Embed Size (px)
Citation preview
Thomas W. Grabau, Ph.D.September 25, 2007
MAJOR GIFTSPerformance Planning
The 12th Annual Conference of the Association of Arts and Sciences Advancement Professionals
2
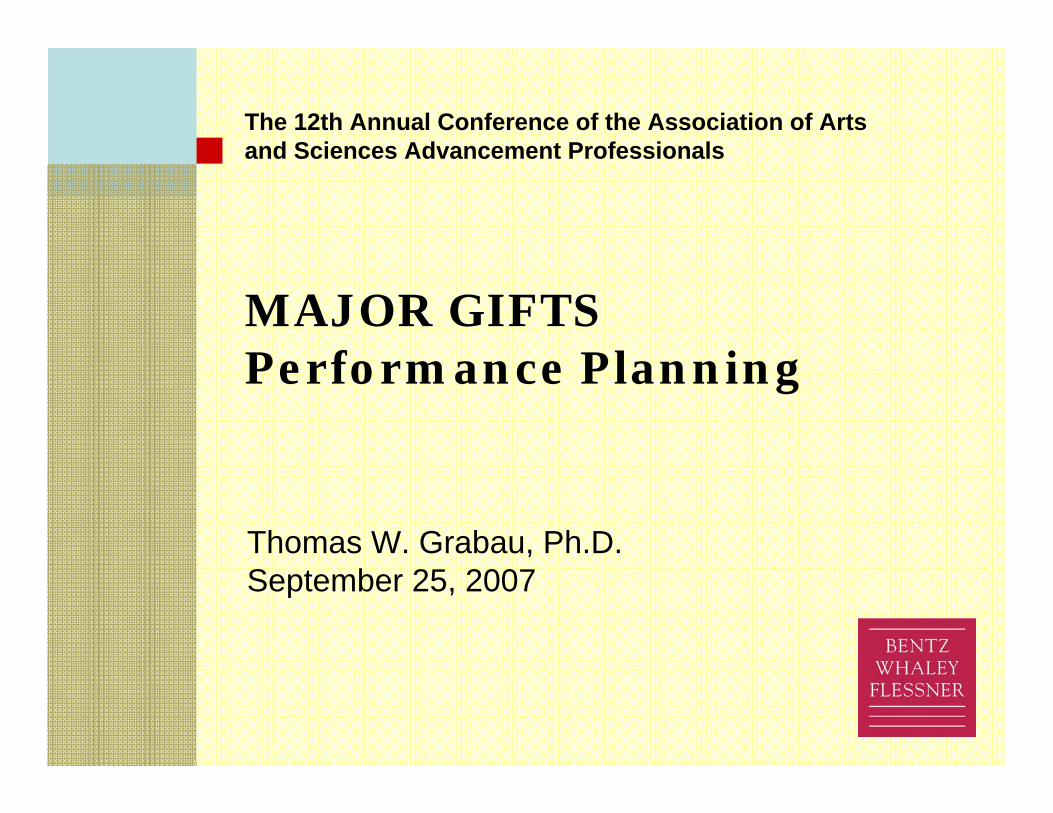
Performance MetricsRules of Thumb
Officers should conduct an average of 12 to 15 face-to-face visits per month.
Officers should visit approximately 50% of their portfolio each year (75/150).
Approximately 30% of an officer’s portfolio should be in the solicitation stage.
Officers should raise on average of $1.0 million per year.
3
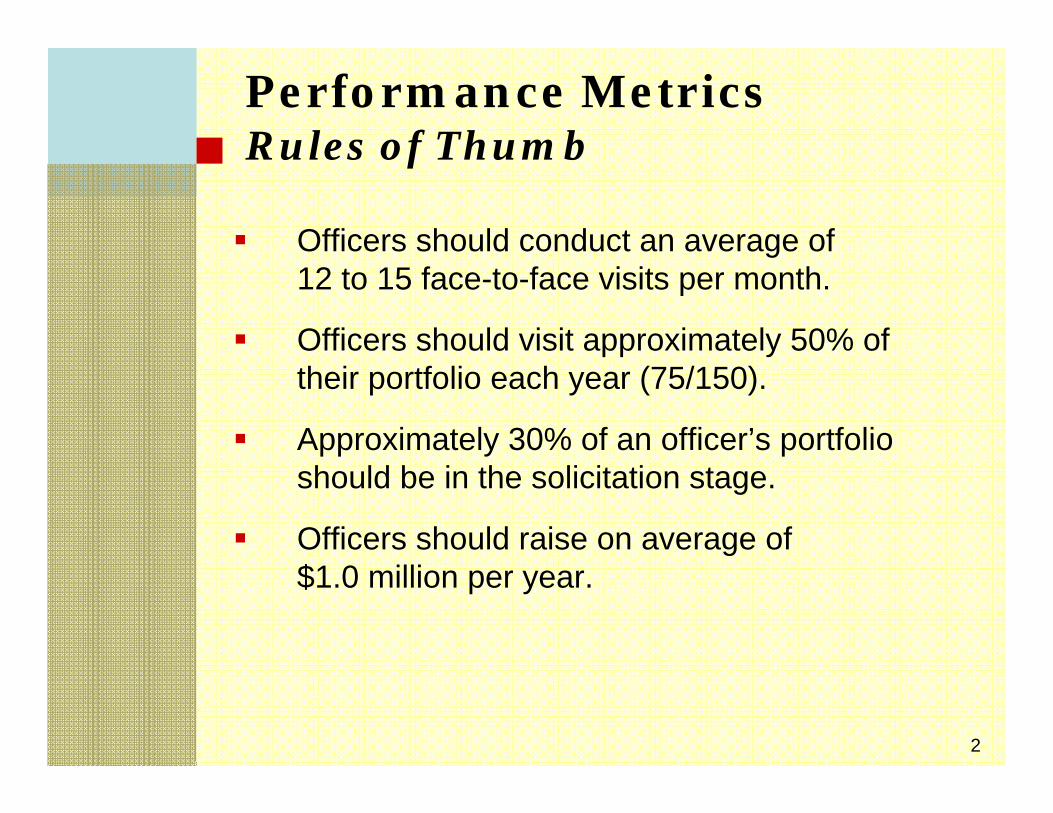
EduVentures Study
Nearly 70 percent of gift officers completed 10 visits or fewer per month.
The overall average was 7.3 visits per month.
High performers conducted an average of 8.3 visits per month.
“Across all institutions and performance levels, actual performance for visits and solicitations is significantly less than the stated target goals.”
4
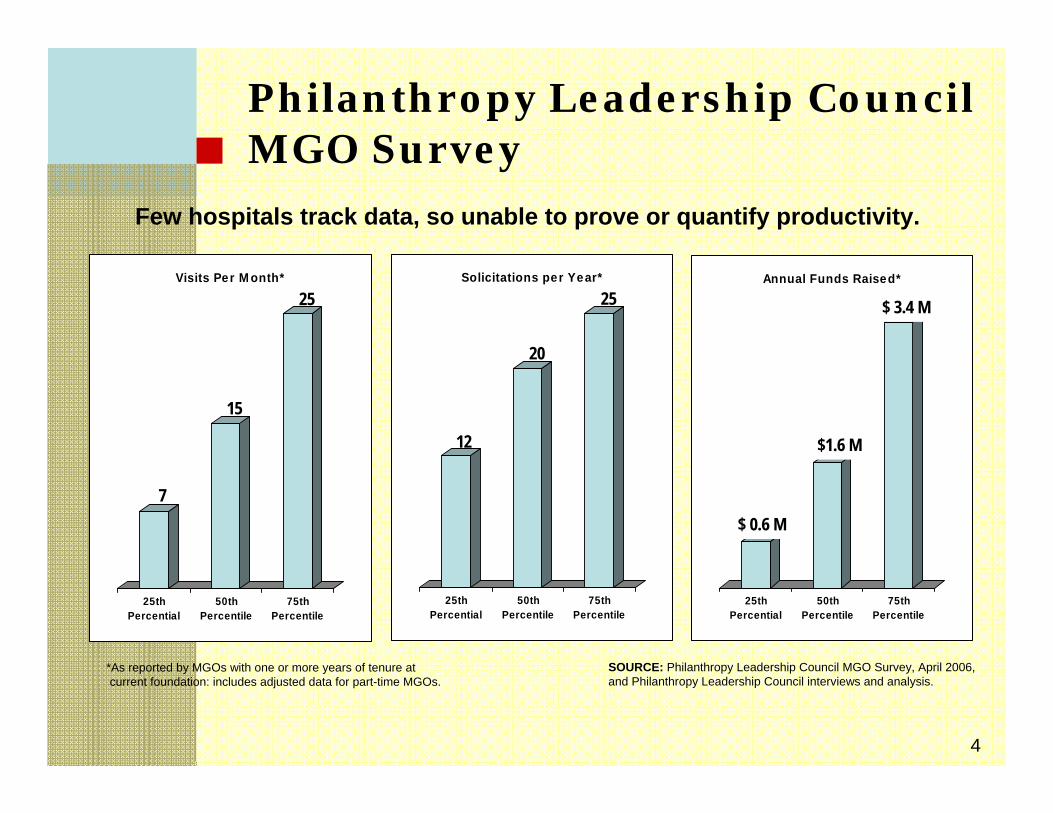
25thPercential
50thPercentile
75thPercentile
Annual Funds Raised*
$ 0.6 M
$1.6 M
$ 3.4 M
25thPercential
50thPercentile
75thPercentile
Visits Per M onth*
7
15
25
25thPercential
50thPercentile
75thPercentile
Solicitations per Year*
12
20
25
*As reported by MGOs with one or more years of tenure atcurrent foundation: includes adjusted data for part-time MGOs.
SOURCE: Philanthropy Leadership Council MGO Survey, April 2006, and Philanthropy Leadership Council interviews and analysis.
Few hospitals track data, so unable to prove or quantify productivity.
Philanthropy Leadership Council MGO Survey
5
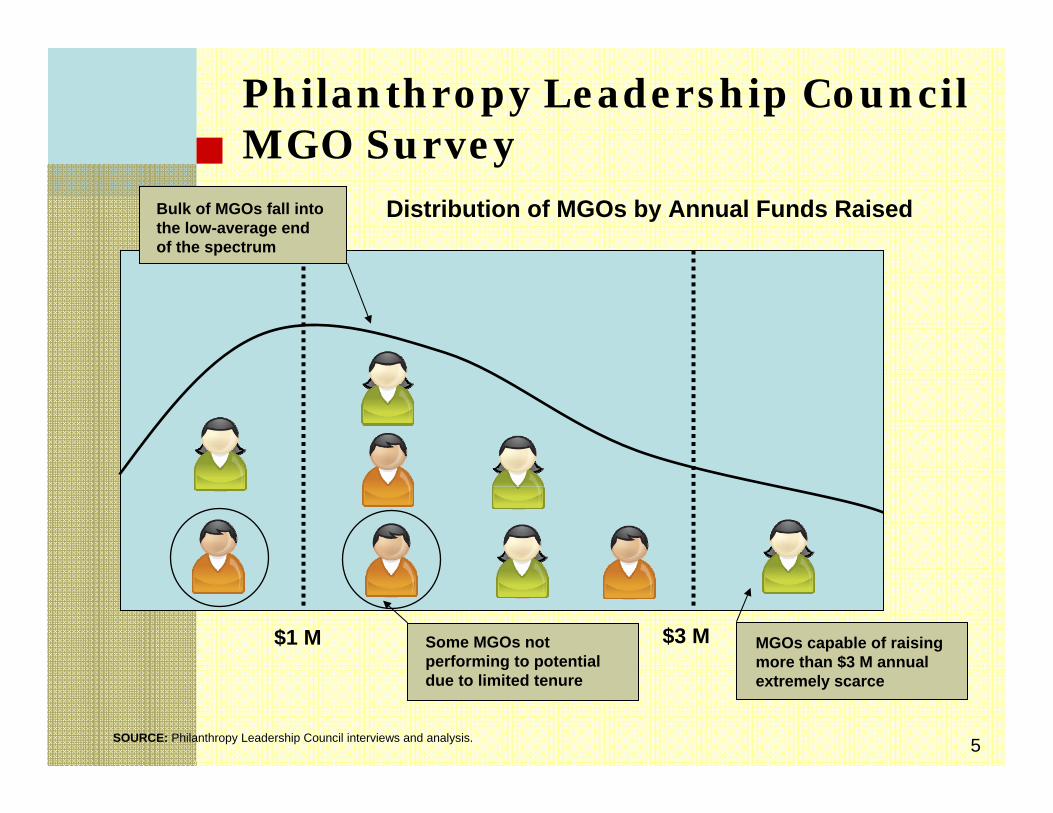
Bulk of MGOs fall into the low-average end of the spectrum
Some MGOs not performing to potential due to limited tenure
MGOs capable of raising more than $3 M annual extremely scarce
$1 M $3 M
Distribution of MGOs by Annual Funds Raised
SOURCE: Philanthropy Leadership Council interviews and analysis.
Philanthropy Leadership Council MGO Survey
6
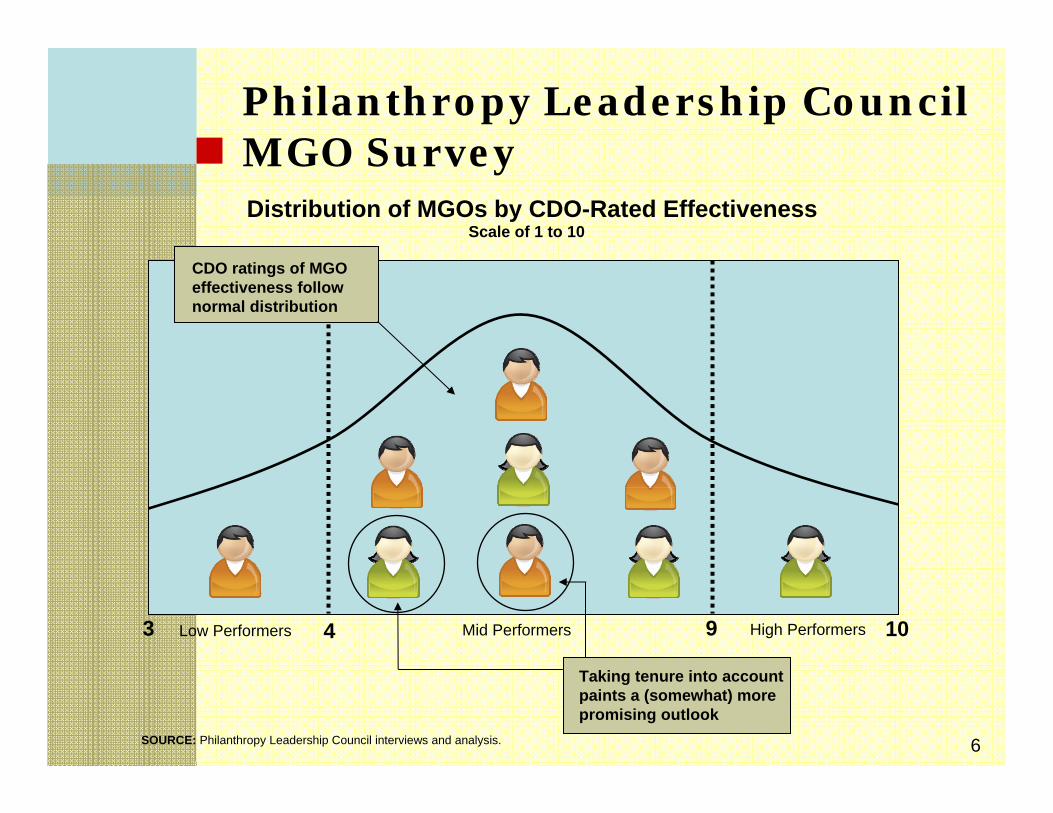
Distribution of MGOs by CDO-Rated Effectiveness
CDO ratings of MGO effectiveness follow normal distribution
Taking tenure into account paints a (somewhat) more promising outlook
4 9
SOURCE: Philanthropy Leadership Council interviews and analysis.
Scale of 1 to 10
103 Low Performers Mid Performers High Performers
Philanthropy Leadership Council MGO Survey
7
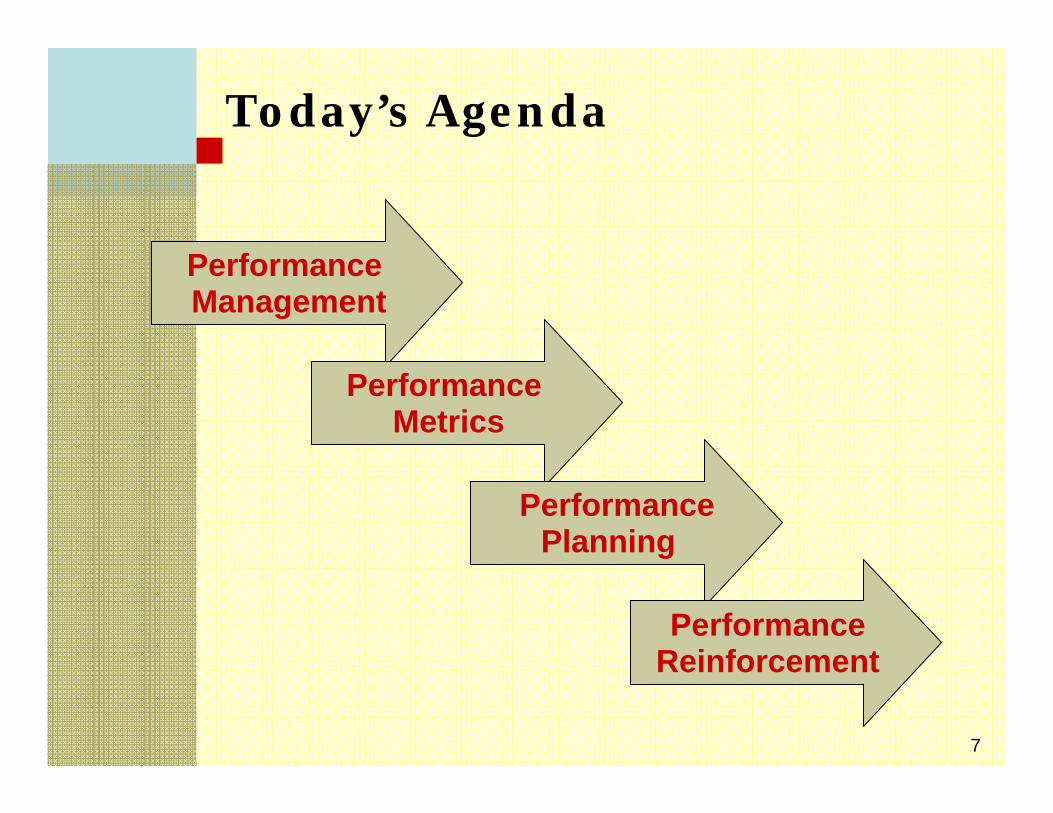
Today’s Agenda
Performance Management
Performance Metrics
Performance Planning
PerformanceReinforcement
8
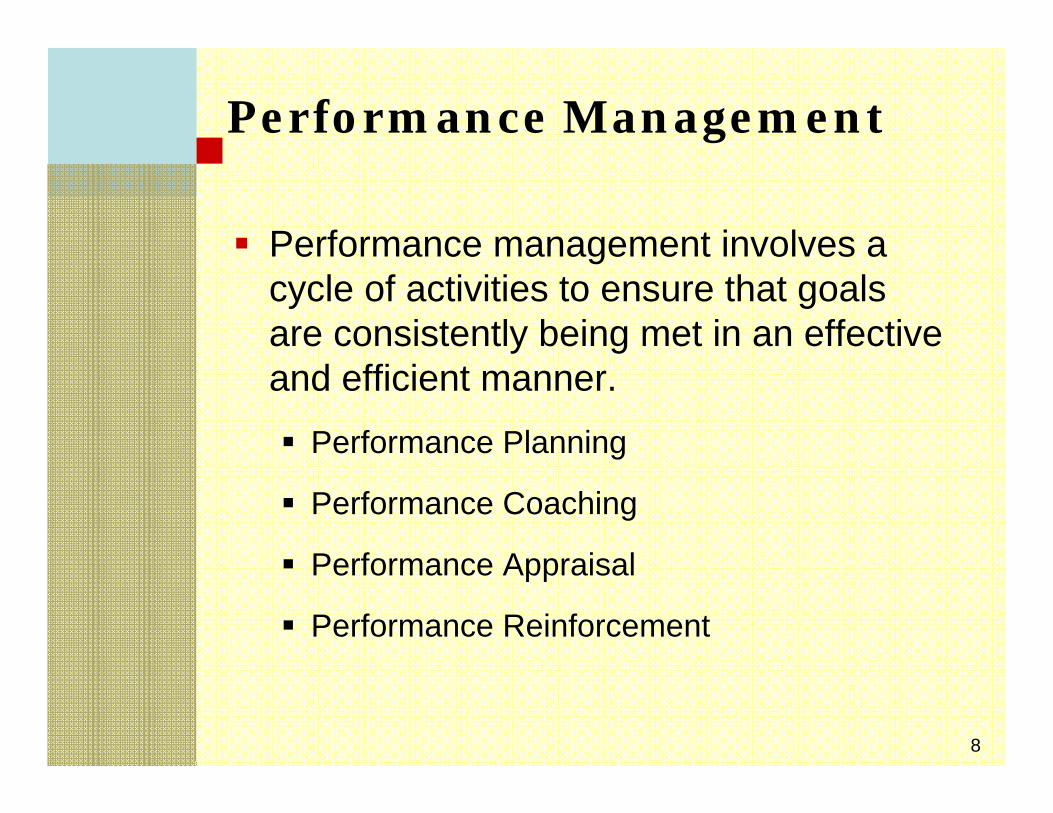
Performance Management
Performance management involves a cycle of activities to ensure that goals are consistently being met in an effective and efficient manner.
Performance Planning
Performance Coaching
Performance Appraisal
Performance Reinforcement
9
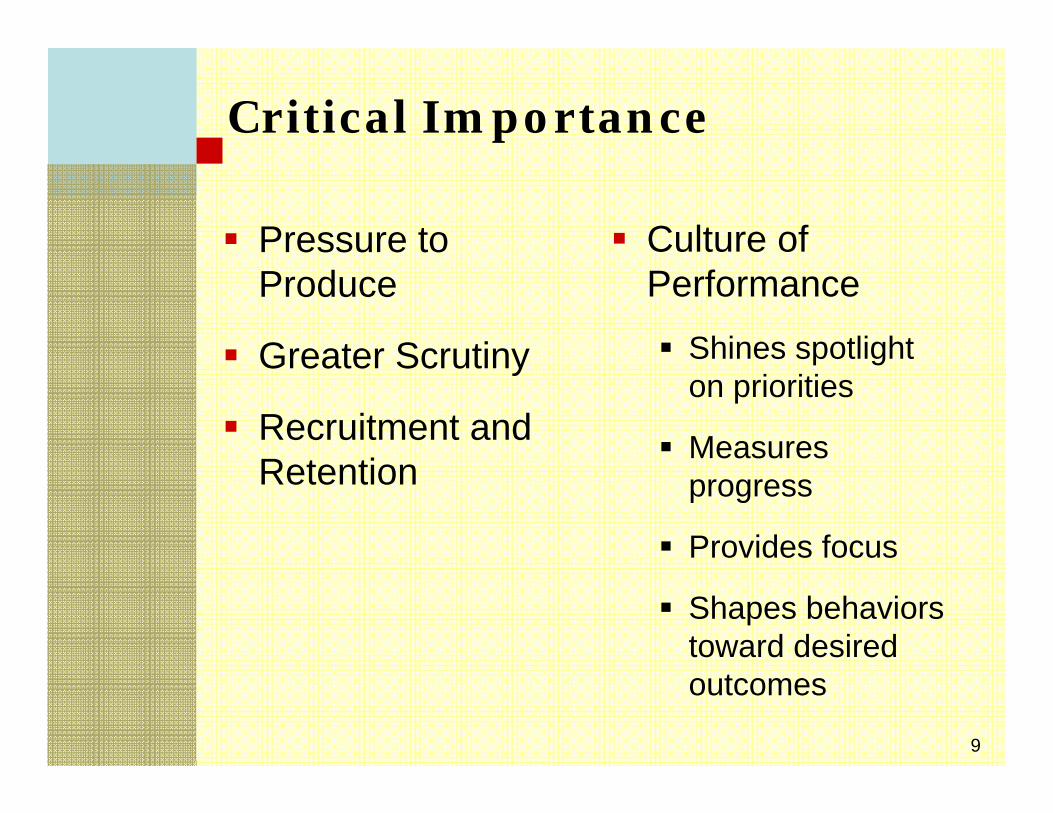
Critical Importance
Pressure to Produce
Greater Scrutiny
Recruitment and Retention
Culture of Performance
Shines spotlight on priorities
Measures progress
Provides focus
Shapes behaviors toward desired outcomes
10
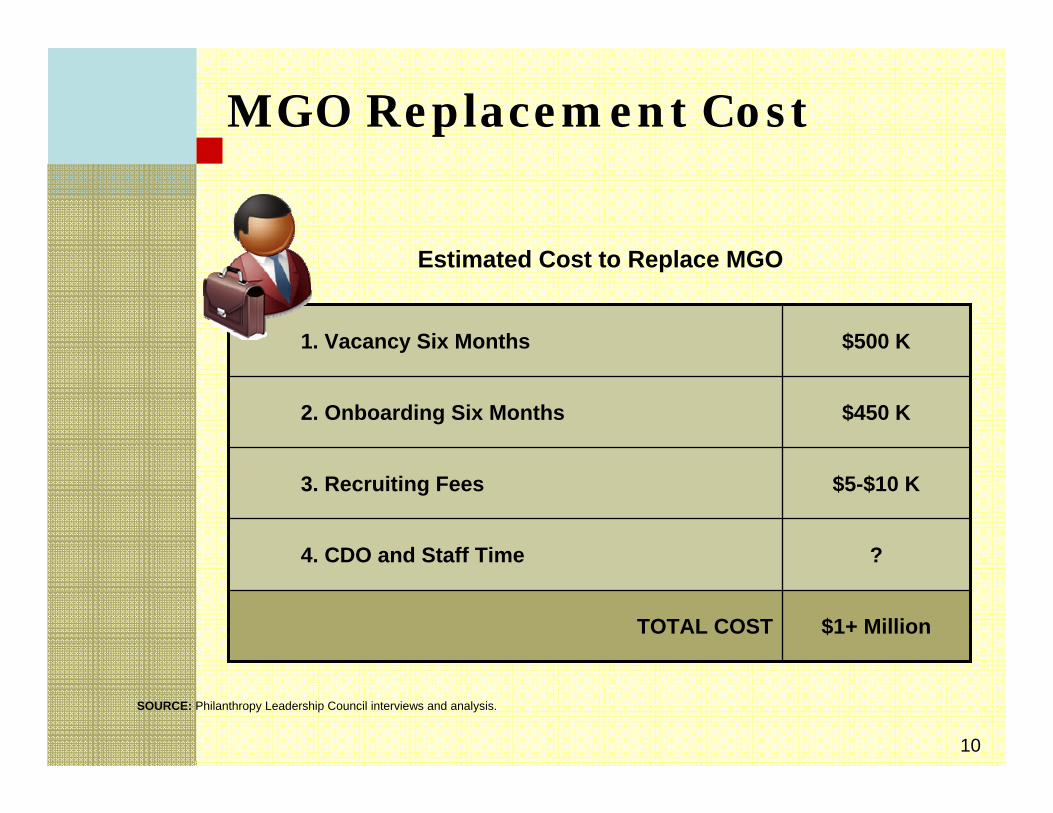
SOURCE: Philanthropy Leadership Council interviews and analysis.
?4. CDO and Staff Time
$1+ MillionTOTAL COST
$5-$10 K3. Recruiting Fees
$450 K2. Onboarding Six Months
$500 K1. Vacancy Six Months
Estimated Cost to Replace MGO
MGO Replacement Cost
11
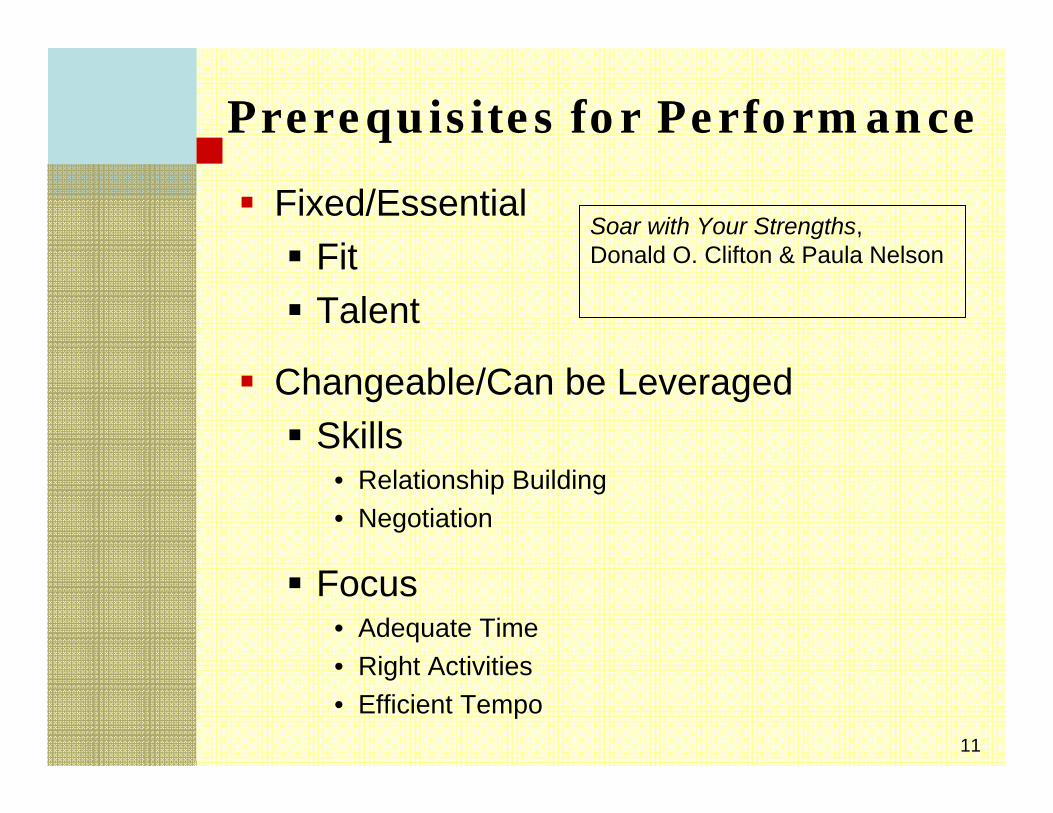
Prerequisites for Performance
Fixed/EssentialFitTalent
Changeable/Can be LeveragedSkills
• Relationship Building• Negotiation
Focus• Adequate Time• Right Activities• Efficient Tempo
Soar with Your Strengths, Donald O. Clifton & Paula Nelson
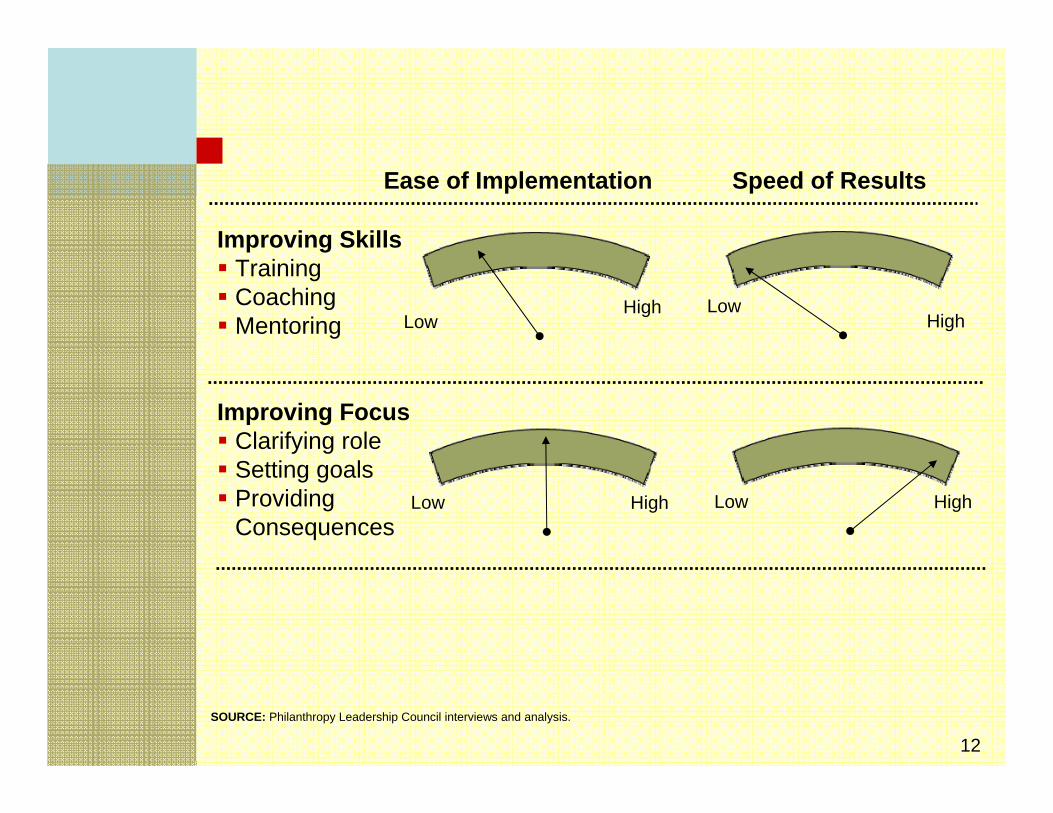
12
Improving SkillsTrainingCoachingMentoring
Improving FocusClarifying roleSetting goalsProviding Consequences
Ease of Implementation Speed of Results
LowHigh Low
High
Low High Low High
SOURCE: Philanthropy Leadership Council interviews and analysis.
13
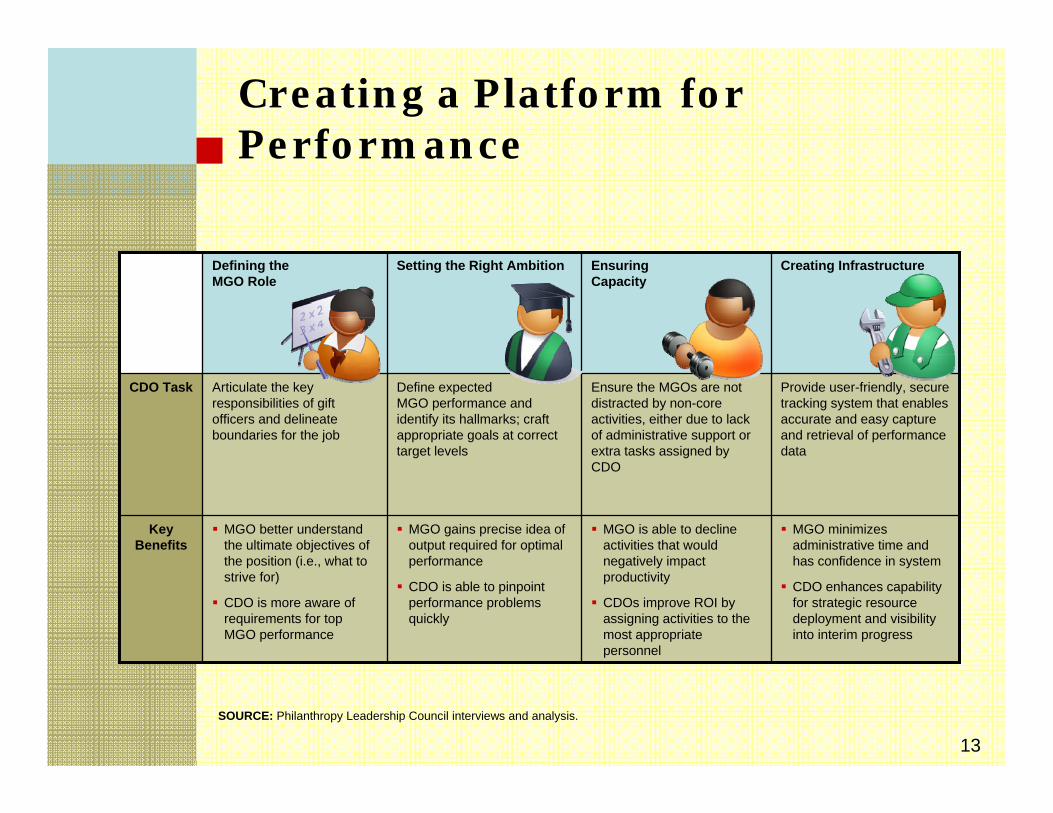
Creating a Platform for Performance
MGO minimizes administrative time and has confidence in system
CDO enhances capability for strategic resource deployment and visibility into interim progress
MGO is able to decline activities that would negatively impact productivity
CDOs improve ROI by assigning activities to the most appropriate personnel
MGO gains precise idea of output required for optimal performance
CDO is able to pinpoint performance problems quickly
MGO better understand the ultimate objectives of the position (i.e., what to strive for)
CDO is more aware of requirements for top MGO performance
Key Benefits
Provide user-friendly, secure tracking system that enables accurate and easy capture and retrieval of performance data
Ensure the MGOs are not distracted by non-core activities, either due to lack of administrative support or extra tasks assigned by CDO
Define expected MGO performance and identify its hallmarks; craft appropriate goals at correct target levels
Articulate the key responsibilities of gift officers and delineate boundaries for the job
CDO Task
Creating InfrastructureEnsuring Capacity
Setting the Right AmbitionDefining the MGO Role
SOURCE: Philanthropy Leadership Council interviews and analysis.
14
Performance Metrics
15
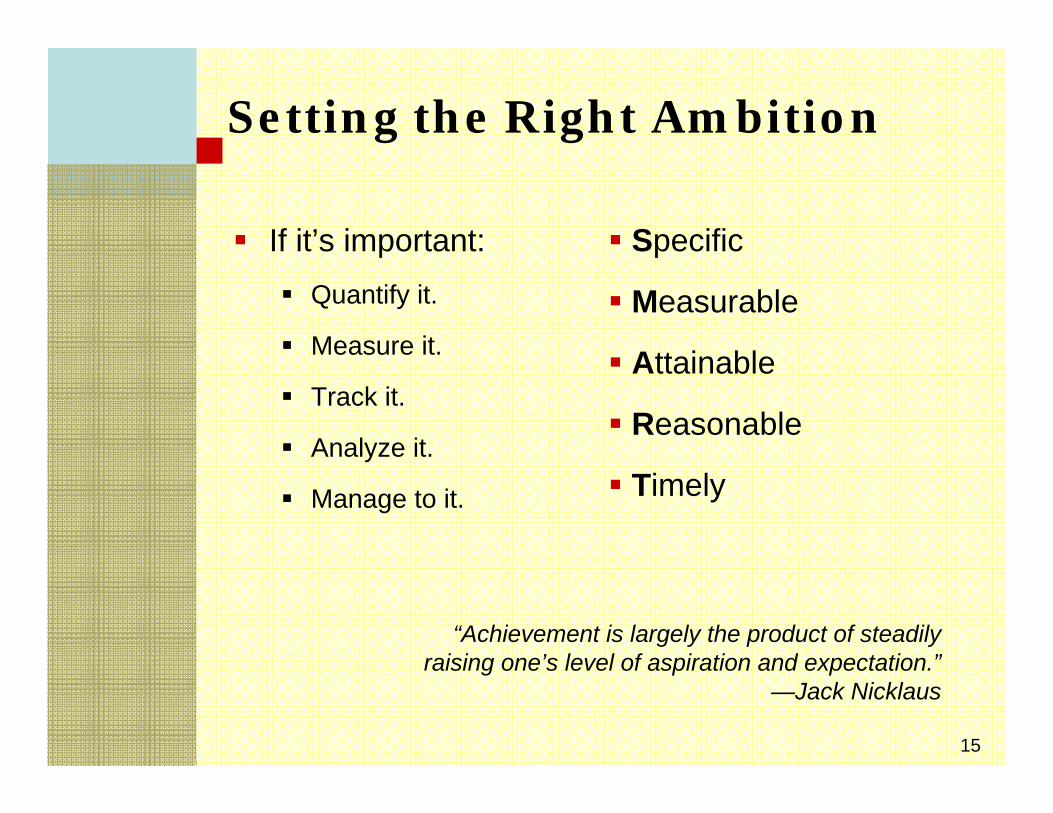
Setting the Right Ambition
If it’s important:Quantify it.
Measure it.
Track it.
Analyze it.
Manage to it.
Specific
Measurable
Attainable
Reasonable
Timely
“Achievement is largely the product of steadily raising one’s level of aspiration and expectation.”
—Jack Nicklaus
16
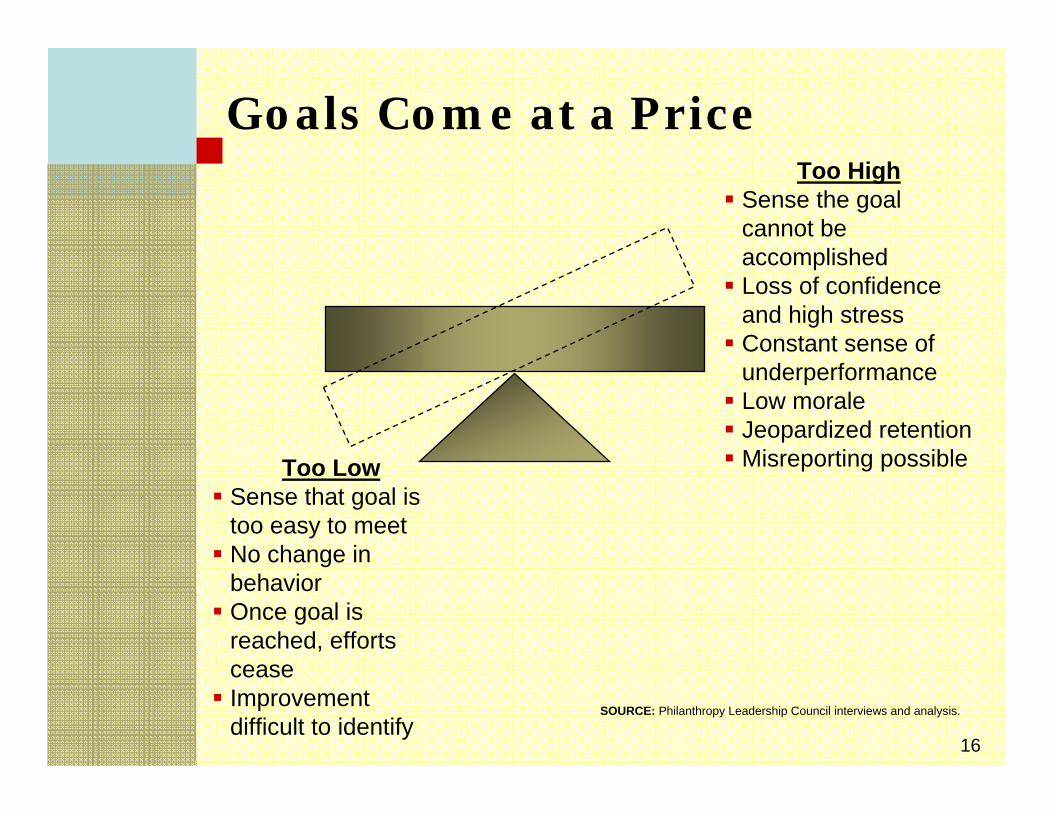
Too LowSense that goal is too easy to meetNo change in behaviorOnce goal is reached, efforts ceaseImprovement difficult to identify
Too HighSense the goal cannot be accomplishedLoss of confidence and high stressConstant sense of underperformanceLow moraleJeopardized retentionMisreporting possible
SOURCE: Philanthropy Leadership Council interviews and analysis.
Goals Come at a Price
17
Other Pitfalls
Imprecise definition
Imperfect understanding of drivers
Insufficient support infrastructure
Conflicting messages about goals
Haphazard reinforcement practices
Short term focus that threatens long-term goals
18
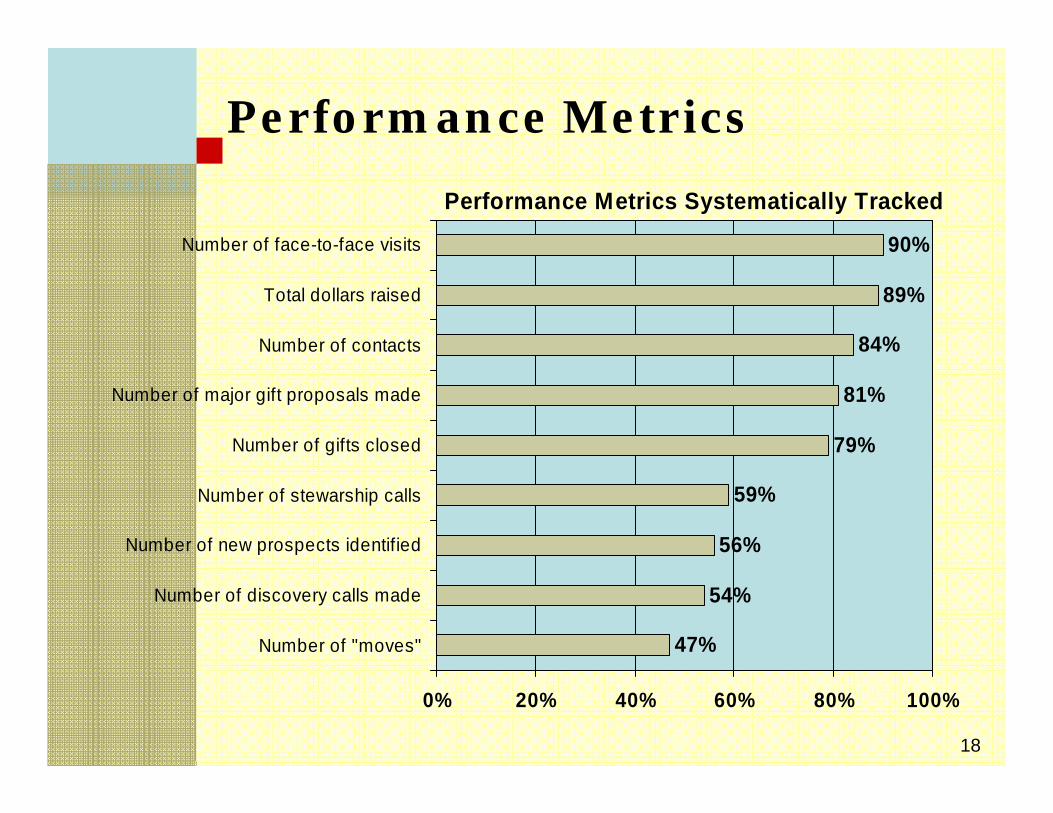
Performance Metrics
Performance Metrics Systematically Tracked
47%
54%
56%
59%
79%
81%
84%
89%
90%
0% 20% 40% 60% 80% 100%
Number of "moves"
Number of discovery calls made
Number of new prospects identified
Number of stewarship calls
Number of gifts closed
Number of major gift proposals made
Number of contacts
Total dollars raised
Number of face-to-face visits
19
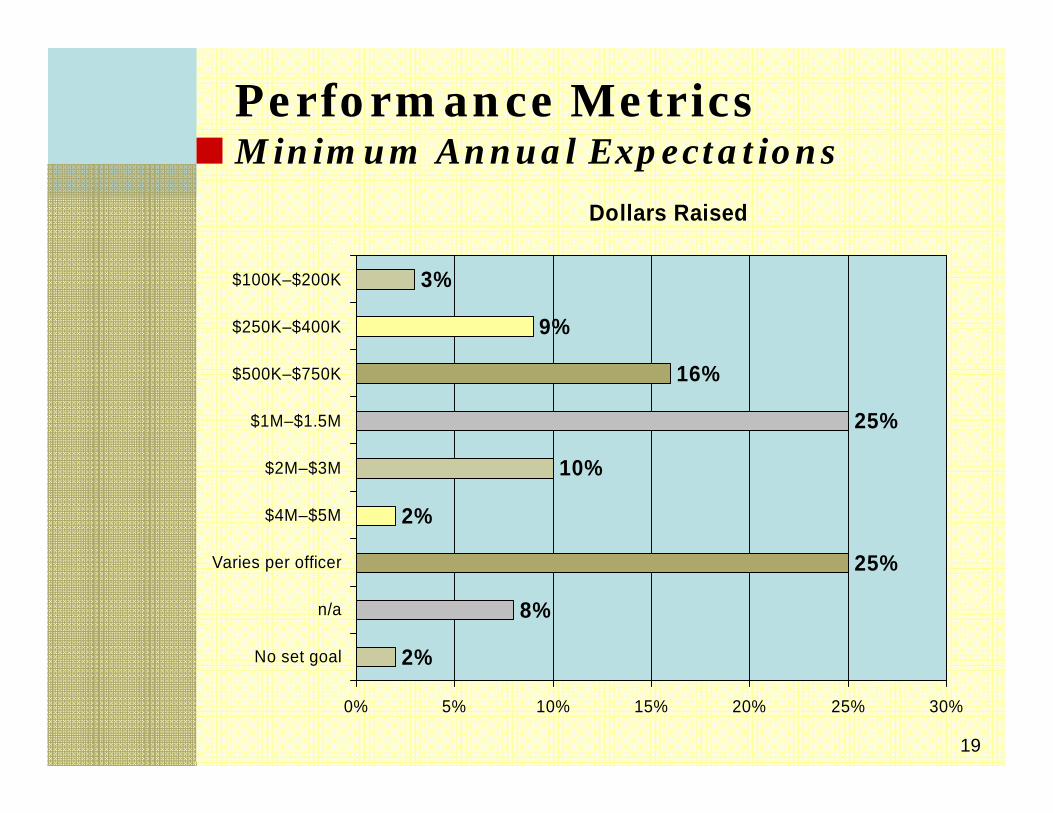
Performance MetricsMinimum Annual Expectations
Dollars Raised
2%
8%
25%
2%
10%
25%
16%
9%
3%
0% 5% 10% 15% 20% 25% 30%
No set goal
n/a
Varies per officer
$4M–$5M
$2M–$3M
$1M–$1.5M
$500K–$750K
$250K–$400K
$100K–$200K
20
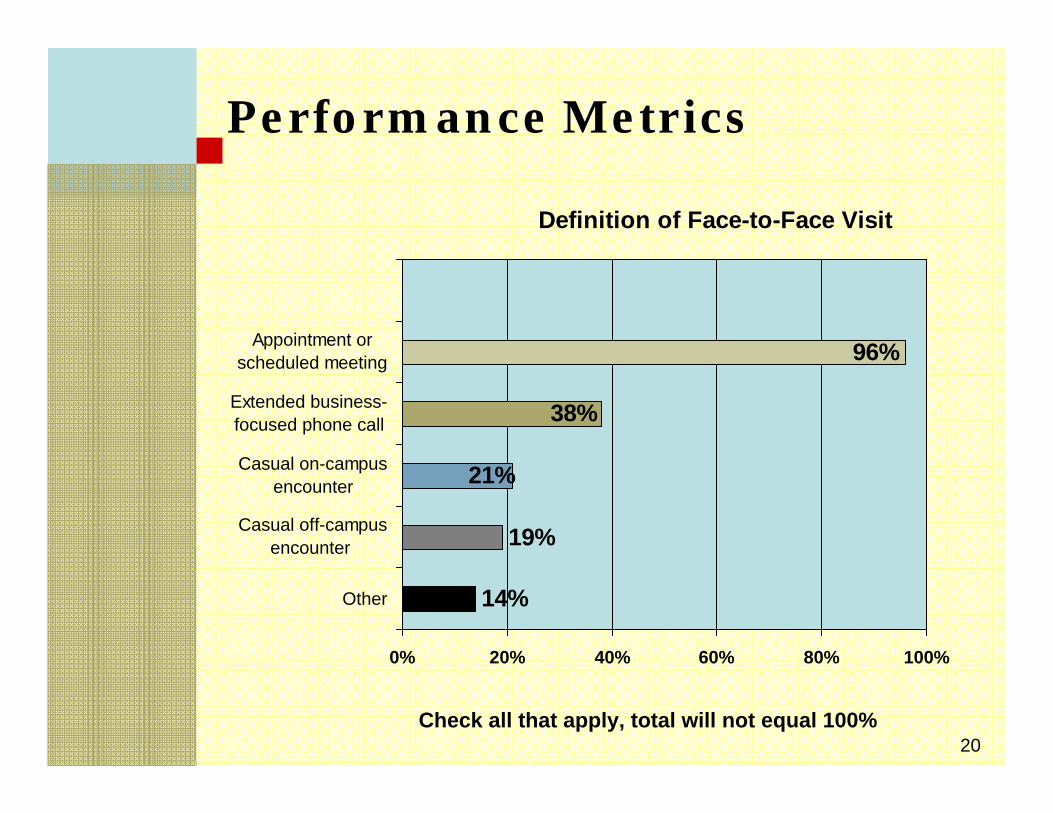
Performance Metrics
Definition of Face-to-Face Visit
14%
19%
38%
96%
21%
0% 20% 40% 60% 80% 100%
Other
Casual off-campusencounter
Casual on-campusencounter
Extended business-focused phone call
Appointment orscheduled meeting
Check all that apply, total will not equal 100%
21
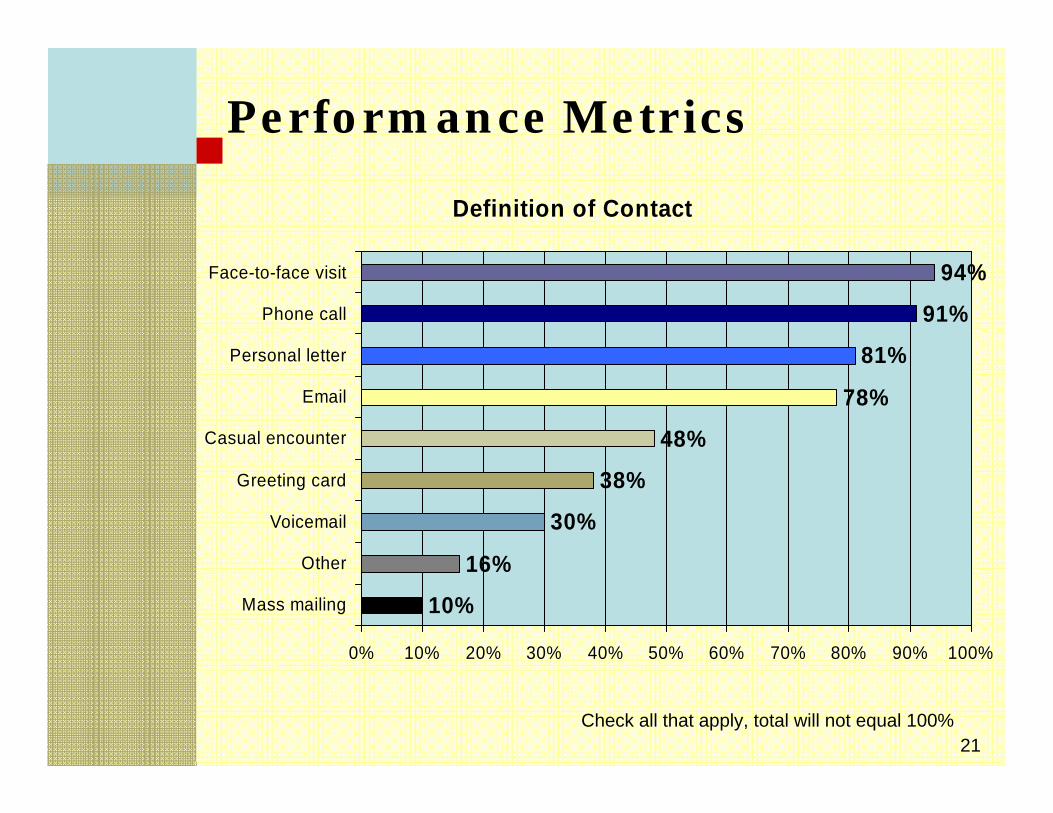
Performance Metrics
Definition of Contact
10%
16%
30%
38%
48%
78%
81%
91%
94%
0% 10% 20% 30% 40% 50% 60% 70% 80% 90% 100%
Mass mailing
Other
Voicemail
Greeting card
Casual encounter
Personal letter
Phone call
Face-to-face visit
Check all that apply, total will not equal 100%
22
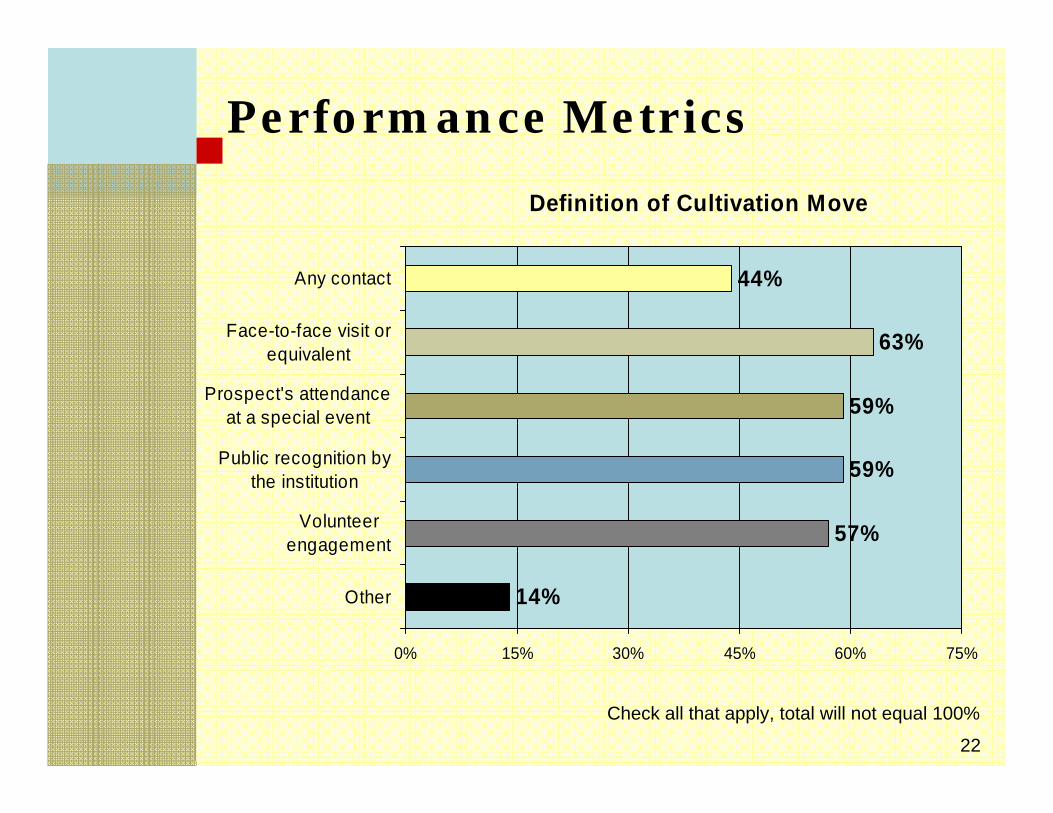
Performance Metrics
Definition of Cultivation Move
14%
57%
59%
59%
63%
44%
0% 15% 30% 45% 60% 75%
Other
Volunteerengagement
Public recognition bythe institution
Prospect's attendanceat a special event
Face-to-face visit orequivalent
Any contact
Check all that apply, total will not equal 100%
23
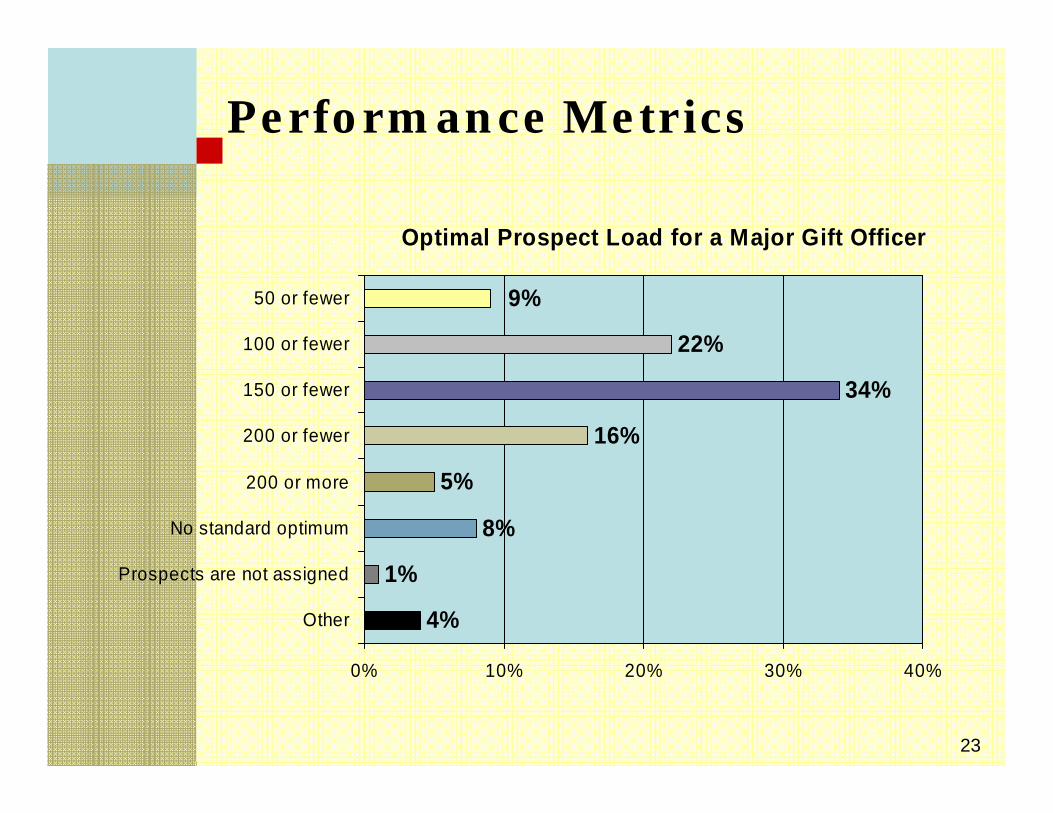
Performance Metrics
Optimal Prospect Load for a Major Gift Officer
4%
1%
8%
5%
16%
34%
22%
9%
0% 10% 20% 30% 40%
Other
Prospects are not assigned
No standard optimum
200 or more
200 or fewer
150 or fewer
100 or fewer
50 or fewer
24
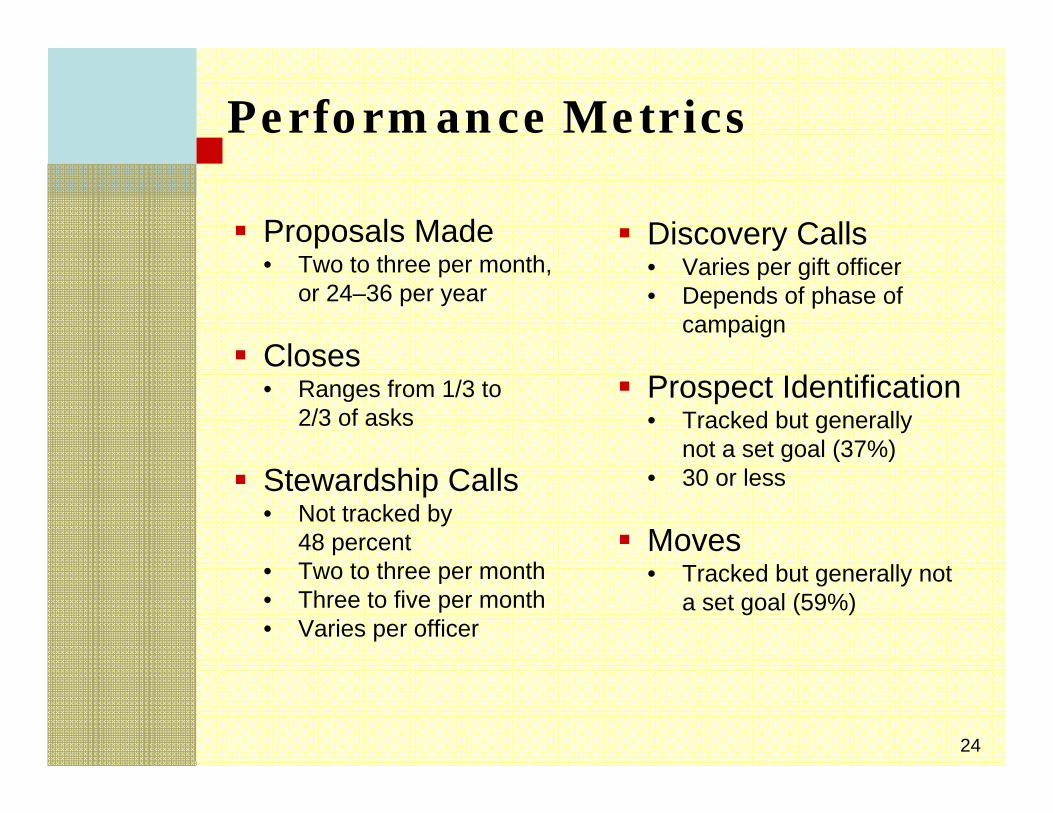
Performance Metrics
Proposals Made• Two to three per month,
or 24–36 per year
Closes• Ranges from 1/3 to
2/3 of asks
Stewardship Calls• Not tracked by
48 percent• Two to three per month• Three to five per month• Varies per officer
Discovery Calls• Varies per gift officer• Depends of phase of
campaign
Prospect Identification• Tracked but generally
not a set goal (37%)• 30 or less
Moves• Tracked but generally not
a set goal (59%)
25
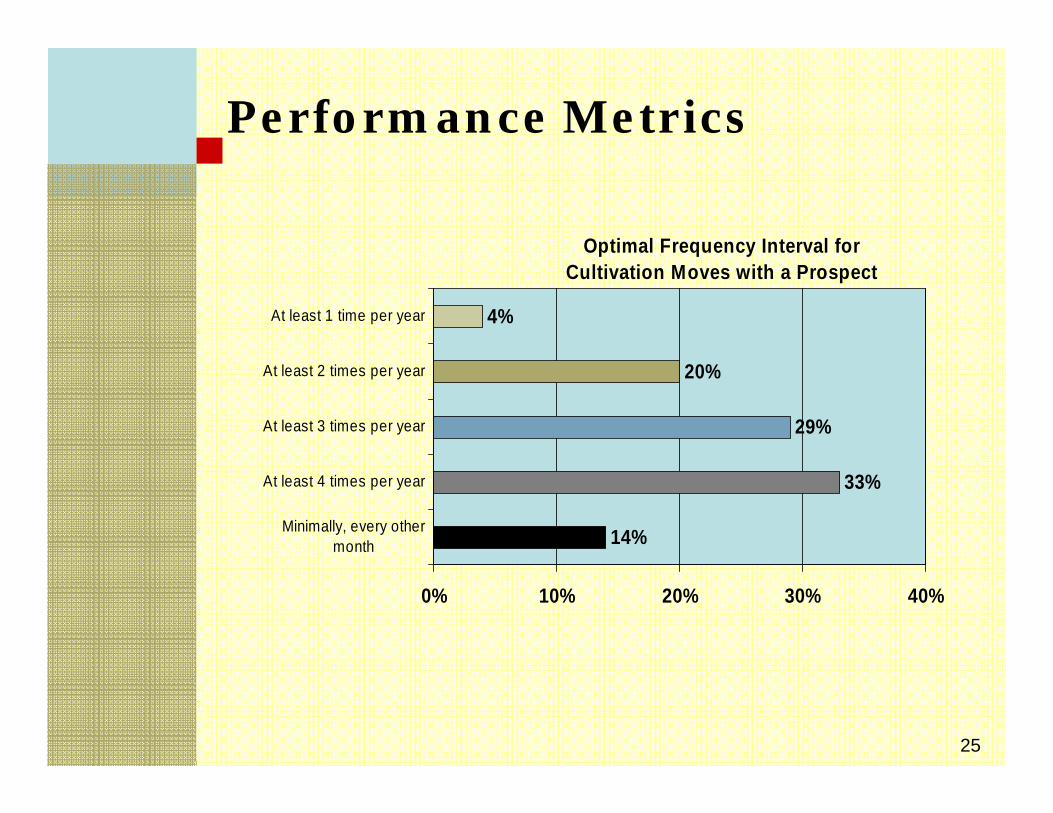
Performance Metrics
Optimal Frequency Interval for Cultivation Moves with a Prospect
14%
33%
29%
20%
4%
0% 10% 20% 30% 40%
Minimally, every othermonth
At least 4 times per year
At least 3 times per year
At least 2 times per year
At least 1 time per year
26
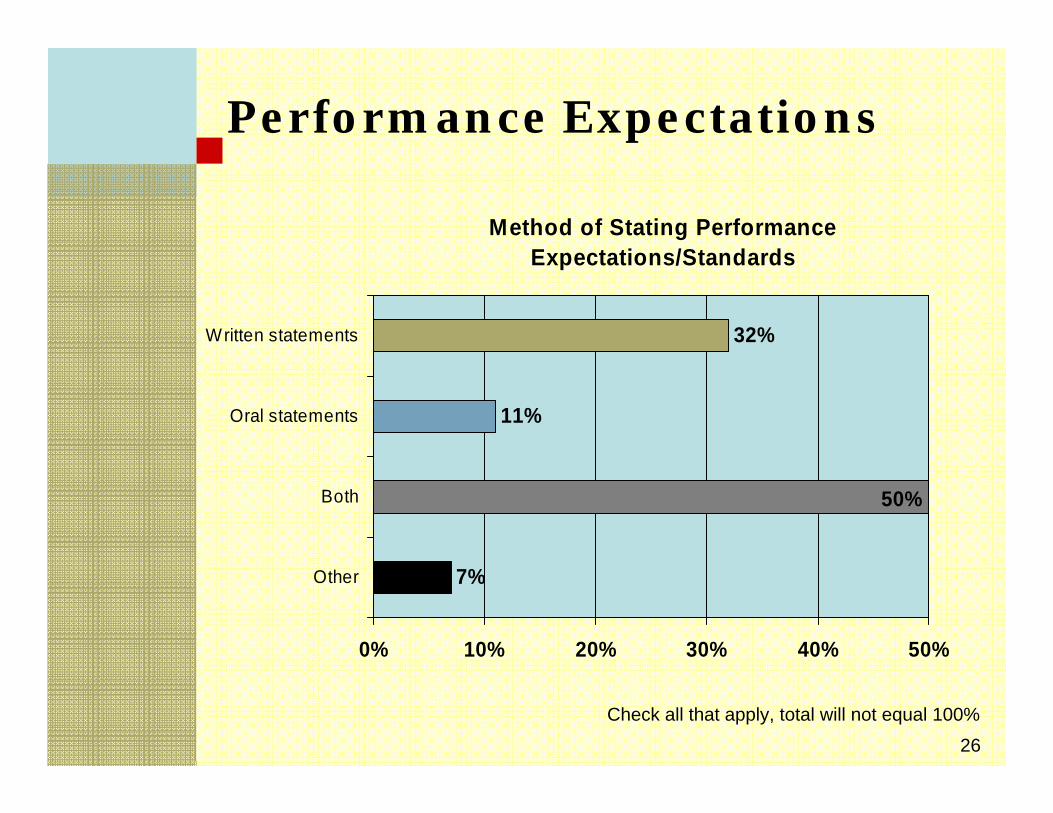
Performance Expectations
Method of Stating Performance Expectations/Standards
7%
11%
32%
50%
0% 10% 20% 30% 40% 50%
Other
Both
Oral statements
Written statements
Check all that apply, total will not equal 100%
27
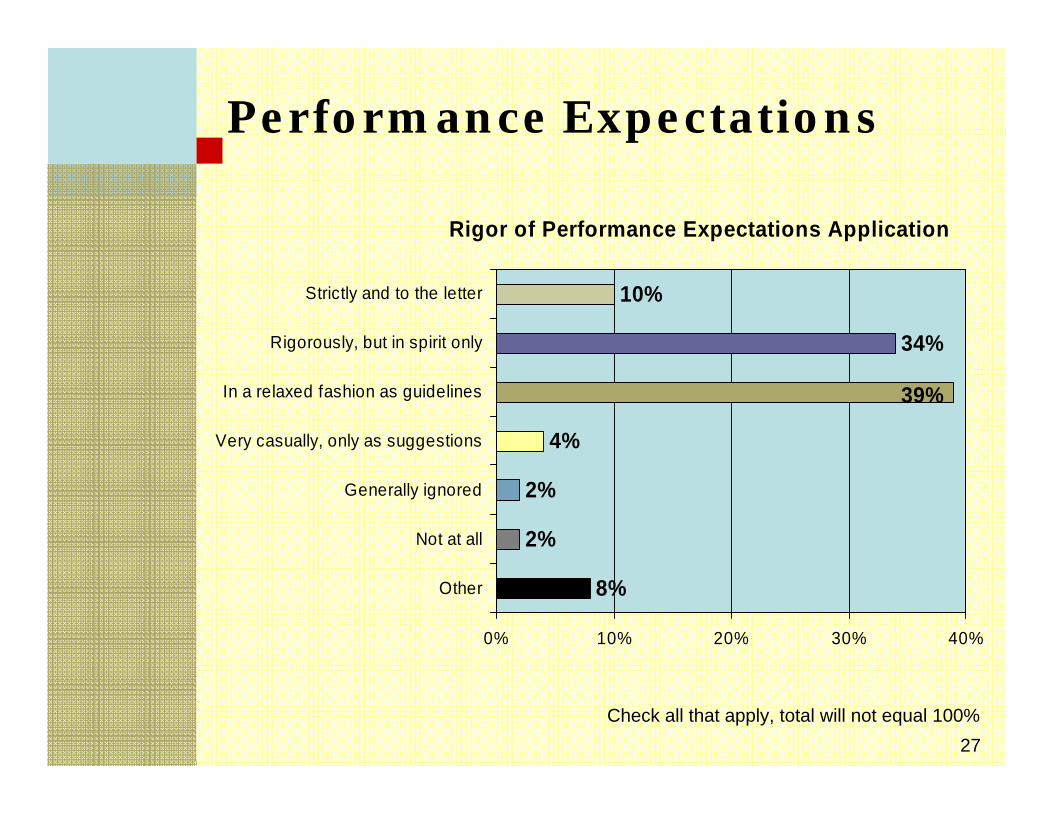
Performance Expectations
Rigor of Performance Expectations Application
8%
2%
2%
4%
34%
10%
39%
0% 10% 20% 30% 40%
Other
Not at all
Generally ignored
Very casually, only as suggestions
In a relaxed fashion as guidelines
Rigorously, but in spirit only
Strictly and to the letter
Check all that apply, total will not equal 100%
28
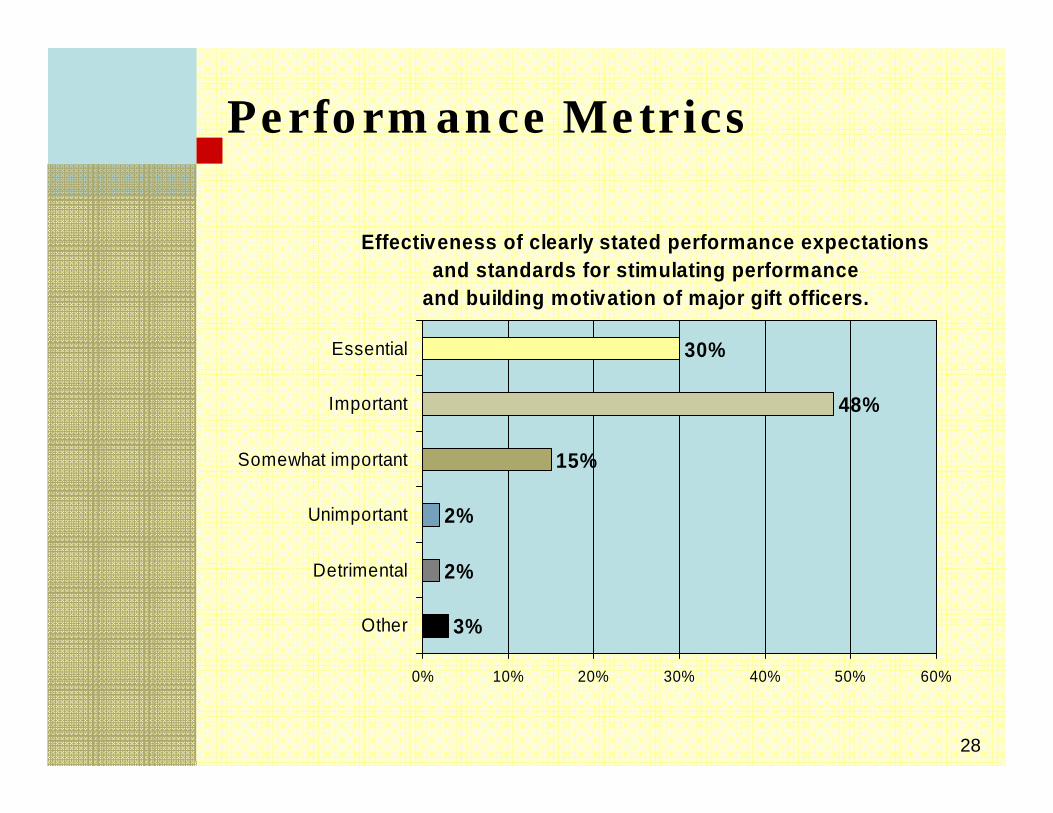
Performance Metrics
Effectiveness of clearly stated performance expectations and standards for stimulating performance
and building motivation of major gift officers.
3%
2%
2%
15%
48%
30%
0% 10% 20% 30% 40% 50% 60%
Other
Detrimental
Unimportant
Somewhat important
Important
Essential
29
Points of View
30
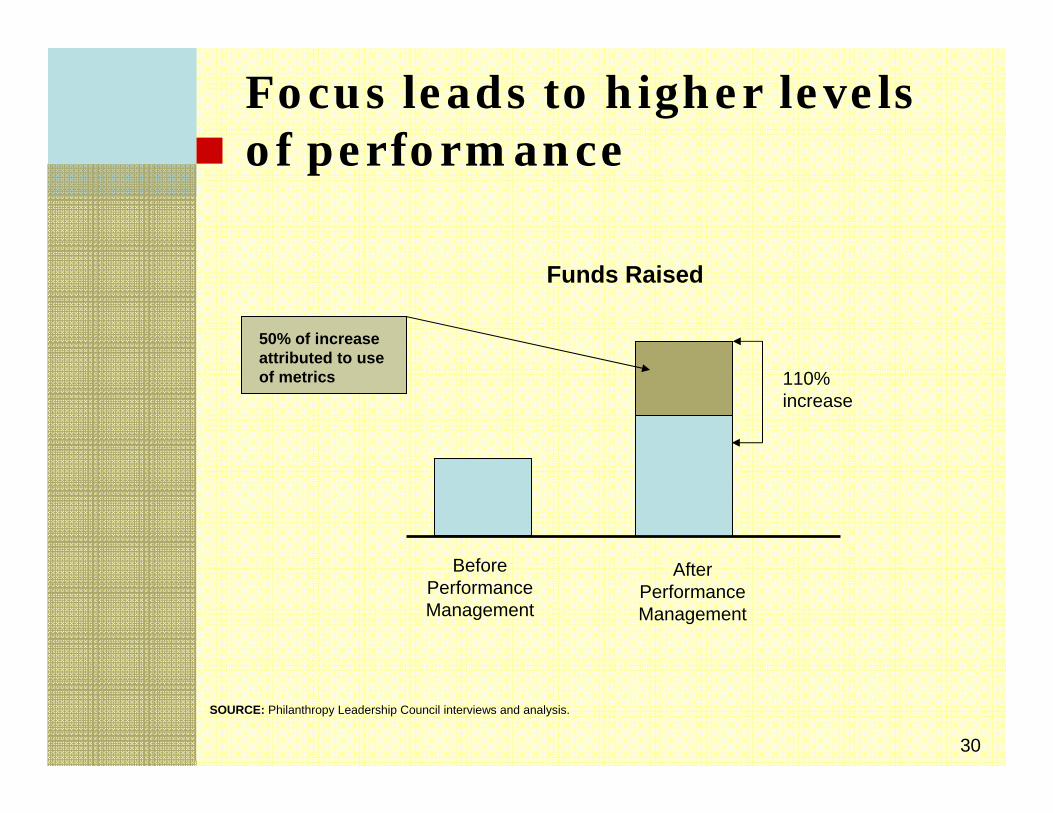
SOURCE: Philanthropy Leadership Council interviews and analysis.
110% increase
BeforePerformanceManagement
AfterPerformanceManagement
Funds Raised
50% of increaseattributed to use of metrics
Focus leads to higher levels of performance
31
Focus leads to higher levels of performance (continued)
EduVentures
Overall, officers at institutions that were more focuses on a single area of metrics—whether prospecting activities, solicitations, or dollars raised—outperformed officers at institutions with equal or mixed measurement models.
Officers at institutions with focused modelsconducted 116 visits on average versus 84 at other institutions
made 18 solicitations versus 14
closed 12 successful solicitations versus 9.
32
Performance Planning
33
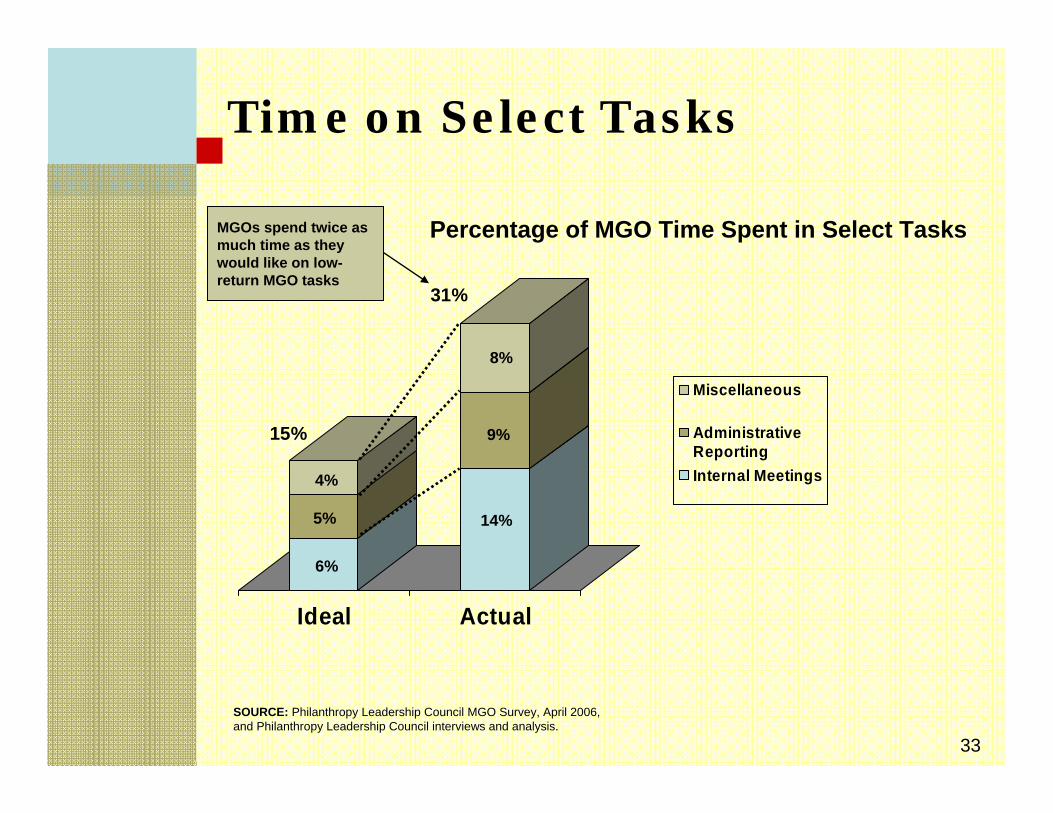
Ideal Actual
Miscellaneous
AdministrativeReportingInternal Meetings
SOURCE: Philanthropy Leadership Council MGO Survey, April 2006, and Philanthropy Leadership Council interviews and analysis.
15%
31%
4%
5%
6%
8%
9%
14%
MGOs spend twice as much time as they would like on low-return MGO tasks
Percentage of MGO Time Spent in Select Tasks
Time on Select Tasks
34
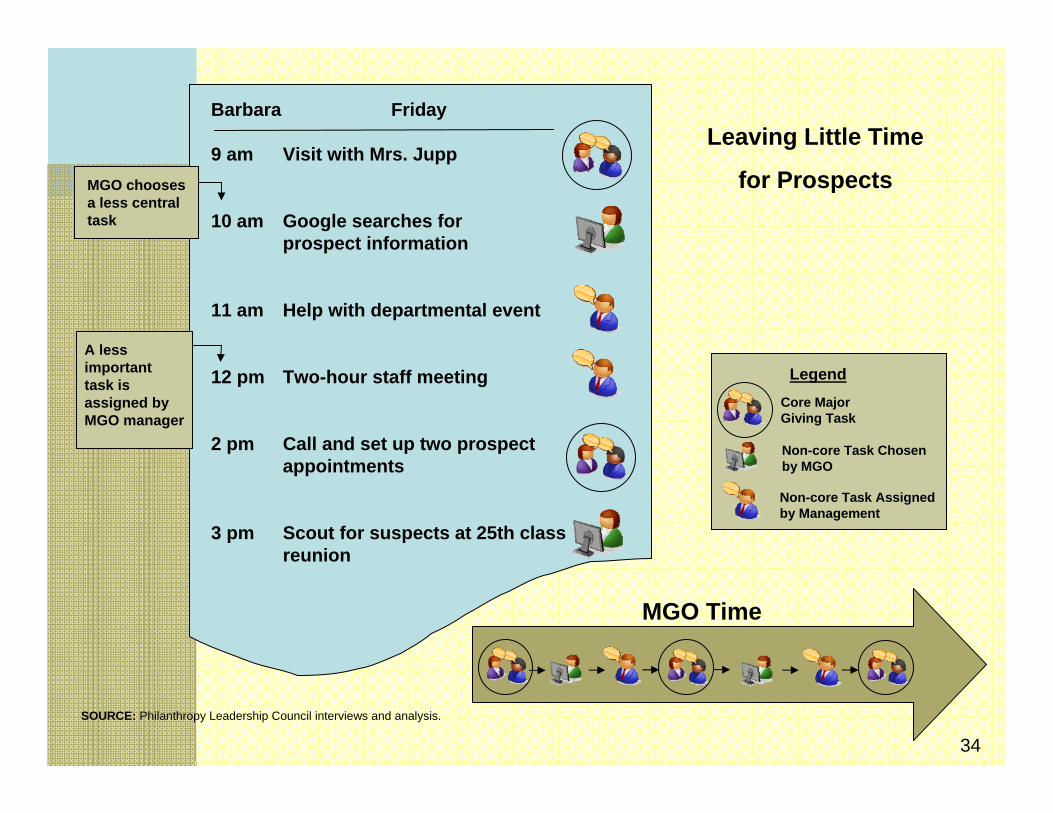
Barbara Friday
9 am Visit with Mrs. Jupp
10 am Google searches for prospect information
11 am Help with departmental event
12 pm Two-hour staff meeting
2 pm Call and set up two prospect appointments
3 pm Scout for suspects at 25th class reunion
Core Major Giving Task
Non-core Task Chosen by MGO
Non-core Task Assigned by Management
Legend
Leaving Little Time
for Prospects
MGO Time
MGO chooses a less central task
A less important task is assigned by MGO manager
SOURCE: Philanthropy Leadership Council interviews and analysis.
35
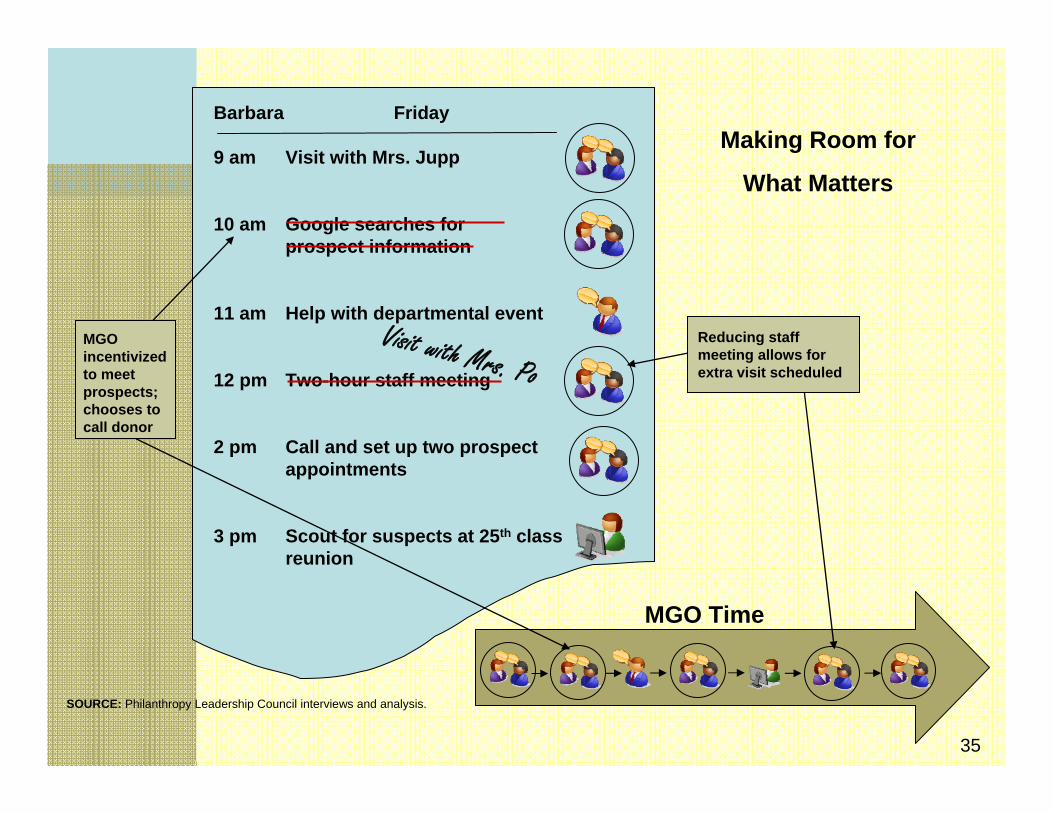
Barbara Friday
9 am Visit with Mrs. Jupp
10 am Google searches for prospect information
11 am Help with departmental event
12 pm Two-hour staff meeting
2 pm Call and set up two prospect appointments
3 pm Scout for suspects at 25th class reunion
Making Room for
What Matters
MGO Time
MGO incentivizedto meet prospects; chooses to call donor
SOURCE: Philanthropy Leadership Council interviews and analysis.
Reducing staff meeting allows for extra visit scheduled
Visit with Mrs. Po
36
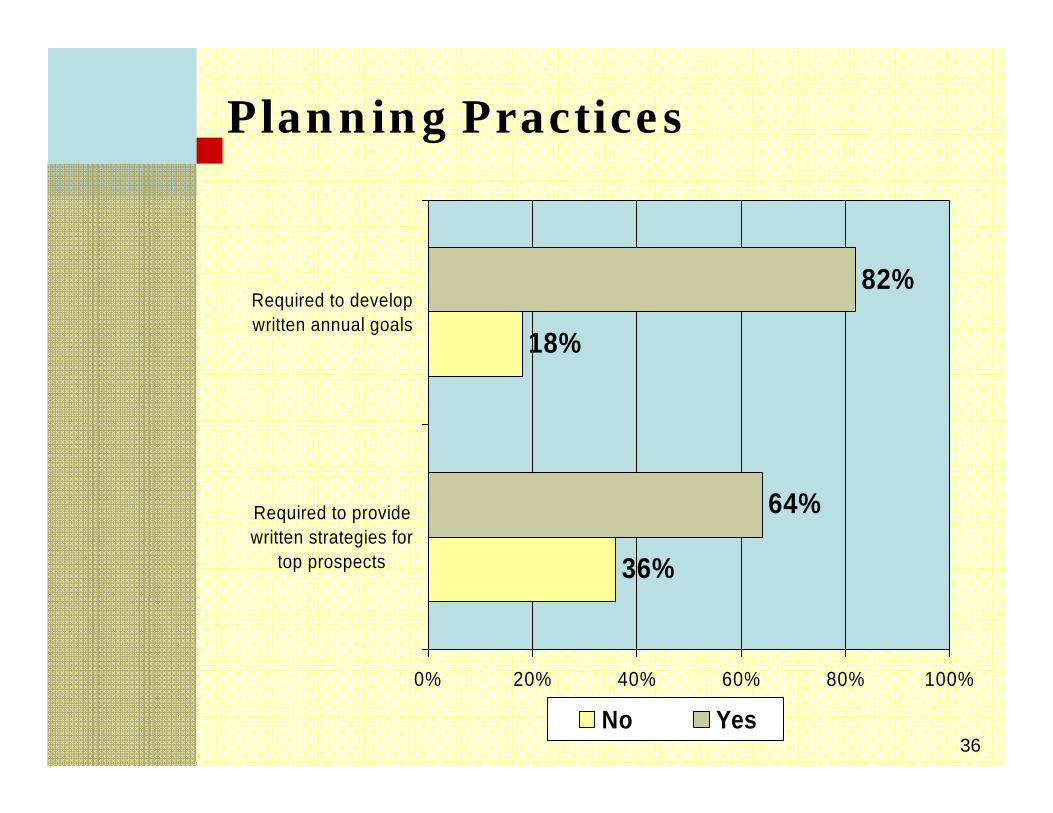
Planning Practices
36%
18%
64%
82%
0% 20% 40% 60% 80% 100%
Required to providewritten strategies for
top prospects
Required to developwritten annual goals
No Yes
37
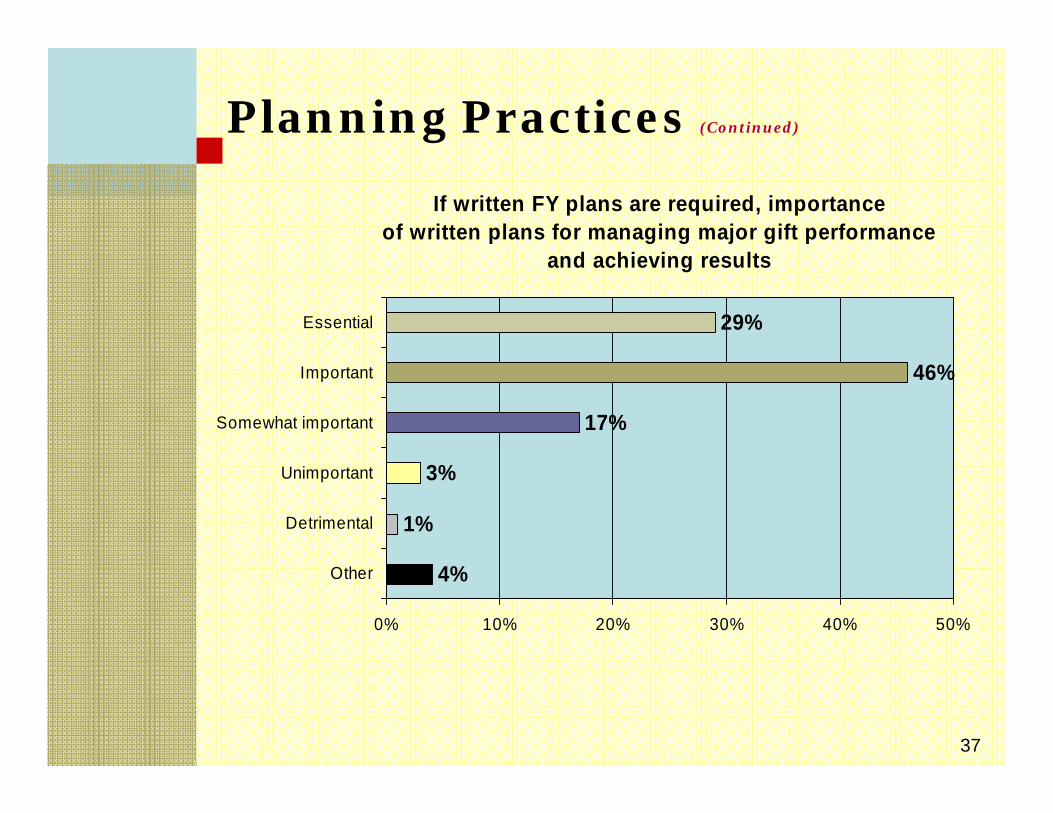
Planning Practices (Continued)
If written FY plans are required, importance of written plans for managing major gift performance
and achieving results
4%
1%
3%
17%
46%
29%
0% 10% 20% 30% 40% 50%
Other
Detrimental
Unimportant
Somewhat important
Important
Essential
38
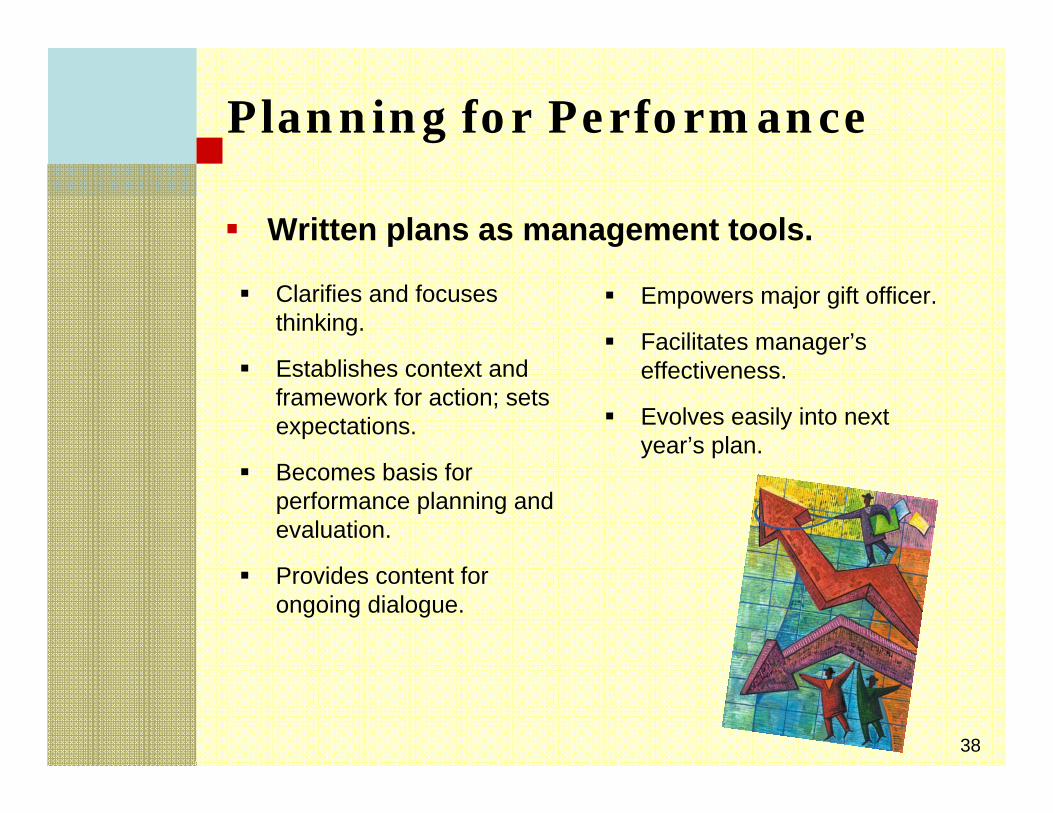
Planning for Performance
Clarifies and focuses thinking.
Establishes context and framework for action; sets expectations.
Becomes basis for performance planning and evaluation.
Provides content for ongoing dialogue.
Empowers major gift officer.
Facilitates manager’s effectiveness.
Evolves easily into next year’s plan.
Written plans as management tools.
39
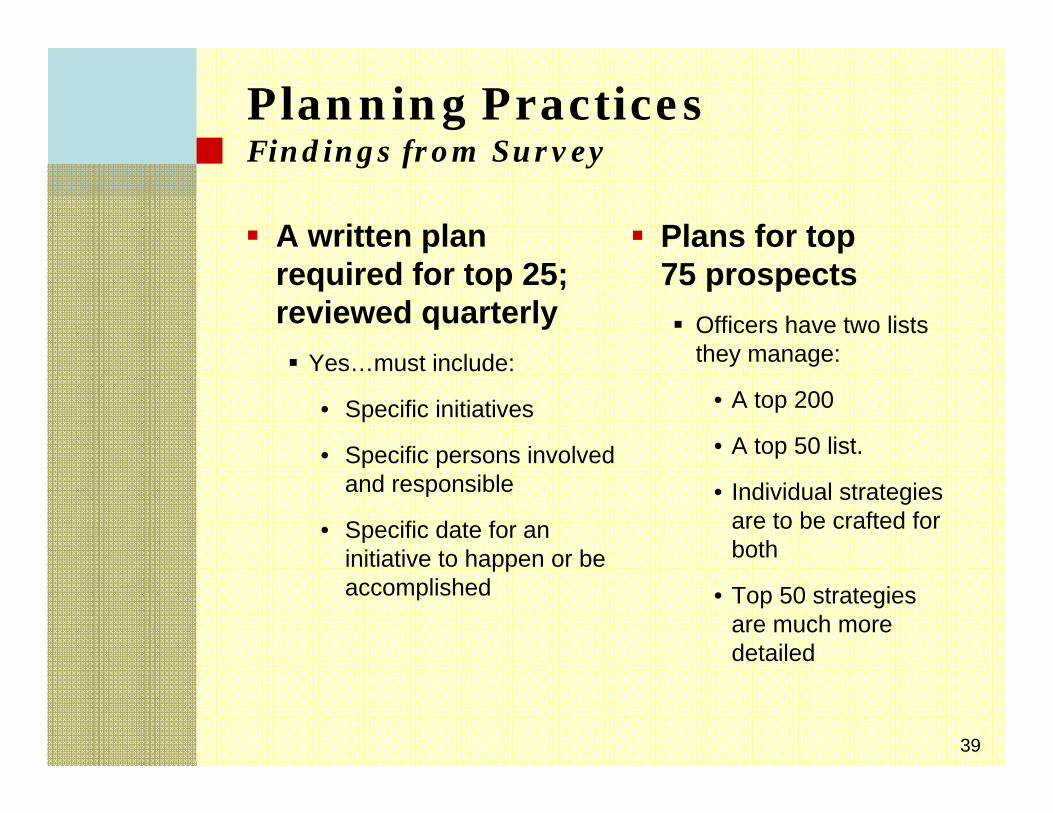
Planning Practices Findings from Survey
A written plan required for top 25; reviewed quarterly
Yes…must include:
• Specific initiatives
• Specific persons involved and responsible
• Specific date for an initiative to happen or be accomplished
Plans for top 75 prospects
Officers have two lists they manage:
• A top 200
• A top 50 list.
• Individual strategies are to be crafted for both
• Top 50 strategies are much more detailed
40
Key Elements of a Performance PlanFiscal year executive summary.
Fiscal year fundraising and engagement goals.
• Major gifts prospect solicitation pipeline.
• Events/donor relations activities.
• Campus liaison responsibilities.
Fiscal year top 25 prospects.
Professional development and technical training.
Professional support needs.
41
Planning Practices (Continued)
Final plan signed by:
Dean
VP/VC
AVP/AVC
Major gifts officer/ director of development
Keys to success:
Keep it simple
Frequent interaction
Focus on the future
Use of consistent data in a consistent manner
Transparency
Foster and expect self-tracking
42
Performance Plan Projections Template
Dean/Administrator
VP/VC
AVP/AVC
Development Officer/Major Gift Officer
43
Part IFiscal Year Executive Summary
Provide a brief narrative overview of fiscal year strategic priorities.• 5–7 priorities that will guide activities and decision-
making and that will drive the goals and objectives by which MGO wants to be evaluated.
– Must advance a philanthropic and constituent relations agenda that is in harmony with vision and strategic directions of the institution.
– Must be stated specifically as quantified outcomes.
• Strategic priorities must be defined in dialogue with the appropriate dean and the MGO’s supervisor/s.
44
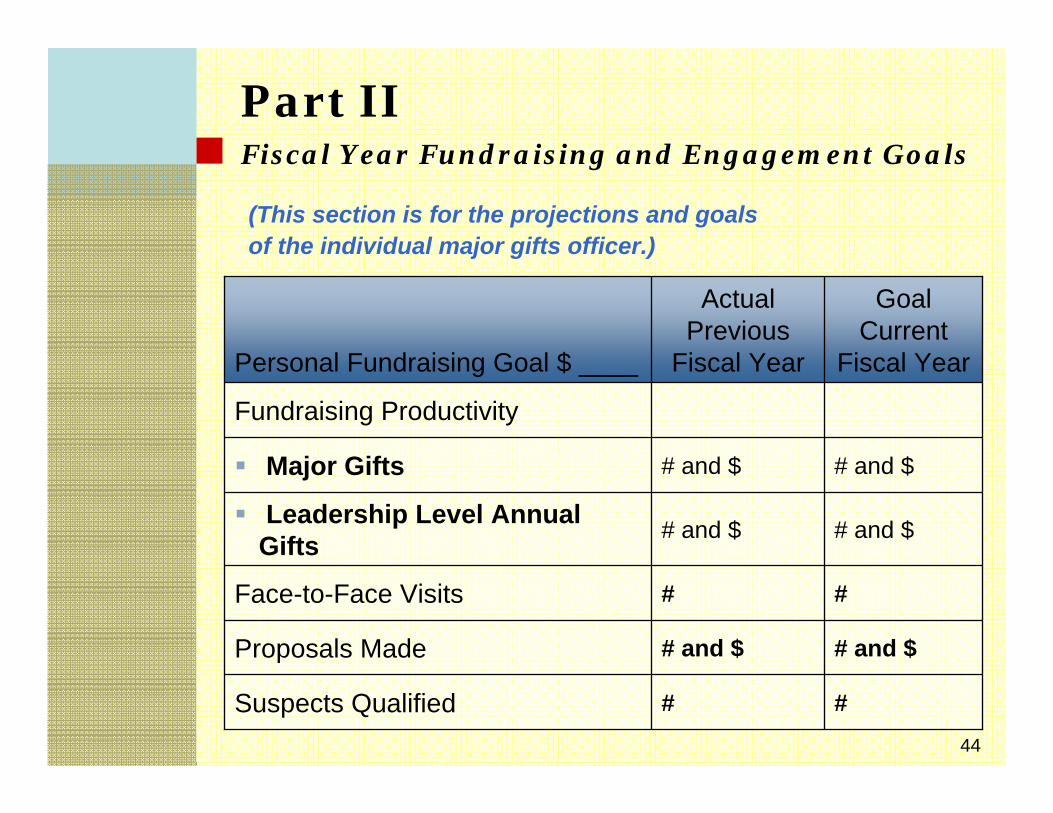
Part IIFiscal Year Fundraising and Engagement Goals
##Suspects Qualified
# and $# and $Proposals Made
##Face-to-Face Visits
# and $# and $Leadership Level Annual Gifts
# and $# and $Major Gifts
Fundraising Productivity
GoalCurrent
Fiscal Year
Actual Previous
Fiscal YearPersonal Fundraising Goal $ ____
(This section is for the projections and goalsof the individual major gifts officer.)
45
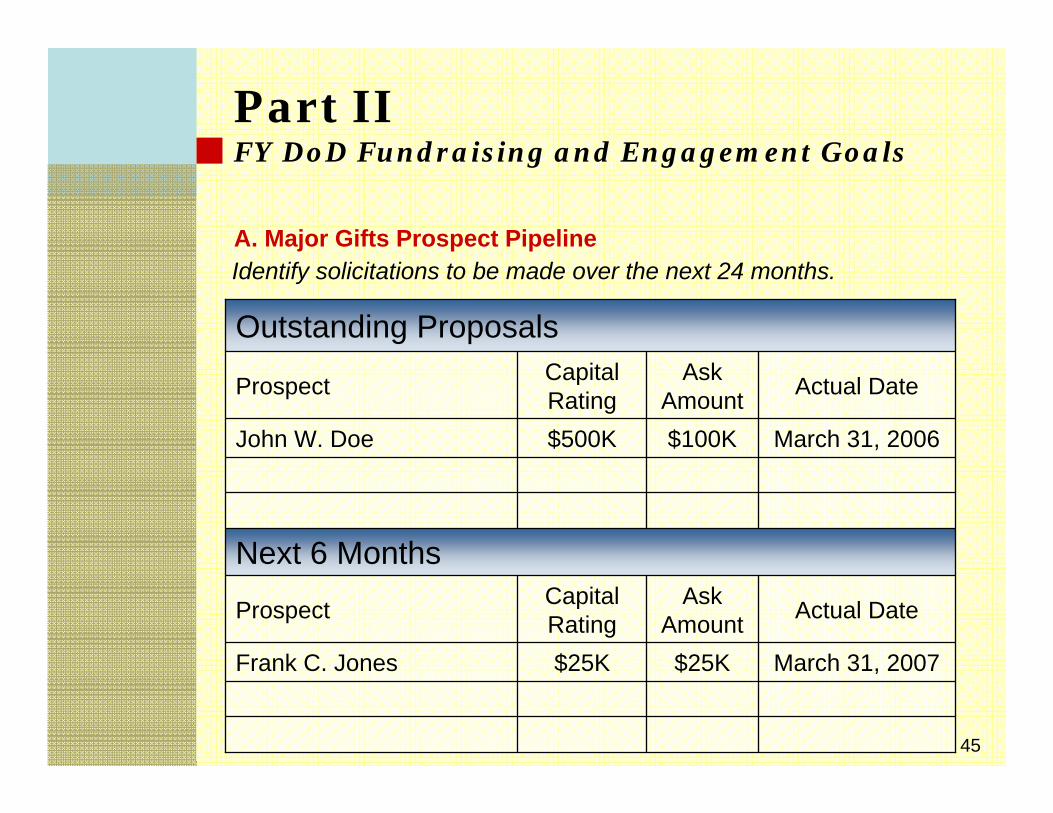
Part IIFY DoD Fundraising and Engagement Goals
Identify solicitations to be made over the next 24 months.
Outstanding Proposals
March 31, 2007$25K$25KFrank C. Jones
Actual DateAsk Amount
Capital RatingProspect
Next 6 Months
March 31, 2006$100K$500KJohn W. Doe
Actual DateAsk Amount
Capital RatingProspect
A. Major Gifts Prospect Pipeline
46
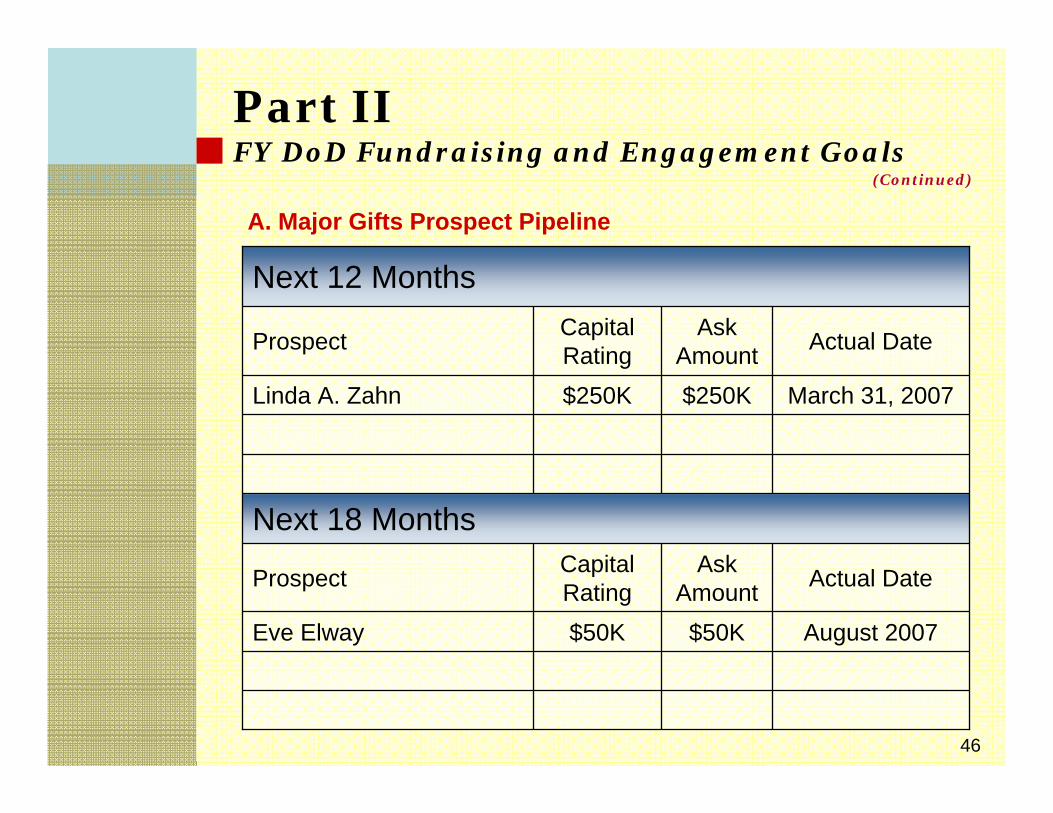
Part IIFY DoD Fundraising and Engagement Goals
A. Major Gifts Prospect Pipeline
Next 12 Months
August 2007$50K$50KEve Elway
Actual DateAsk Amount
Capital RatingProspect
Next 18 Months
March 31, 2007$250K$250KLinda A. Zahn
Actual DateAsk Amount
Capital RatingProspect
(Continued)
47
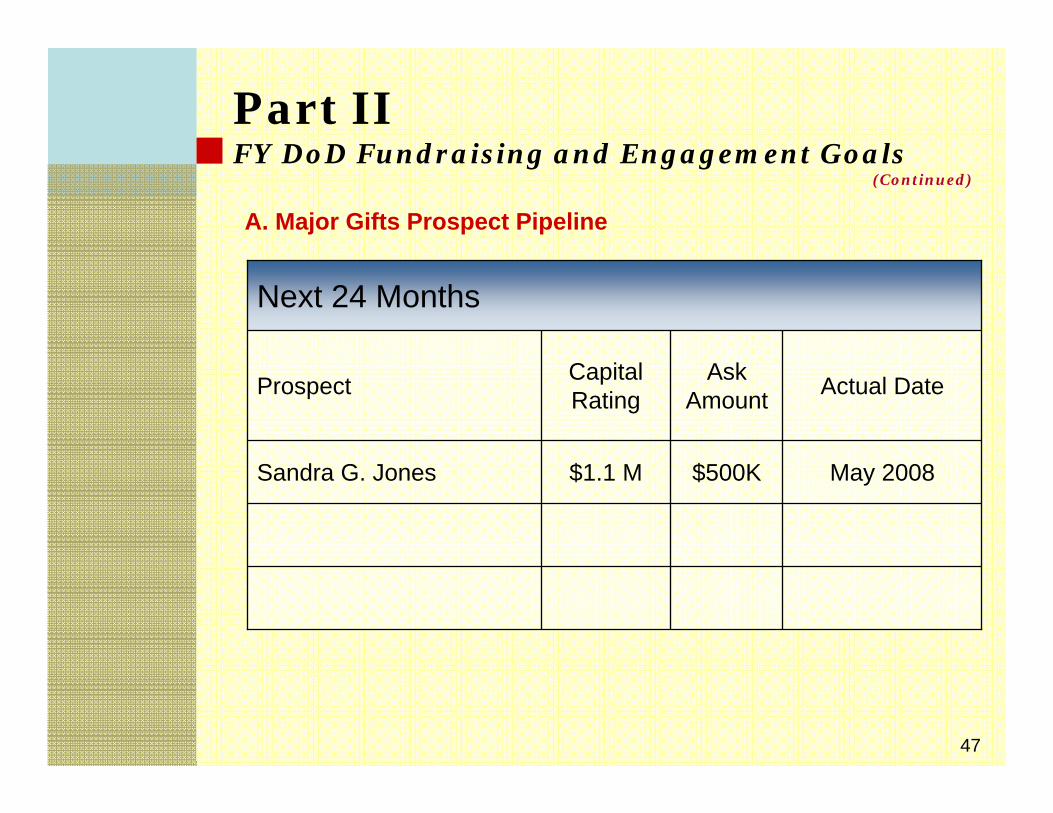
Next 24 Months
May 2008$500K$1.1 MSandra G. Jones
Actual DateAsk Amount
Capital RatingProspect
Part IIFY DoD Fundraising and Engagement Goals
A. Major Gifts Prospect Pipeline
(Continued)
48
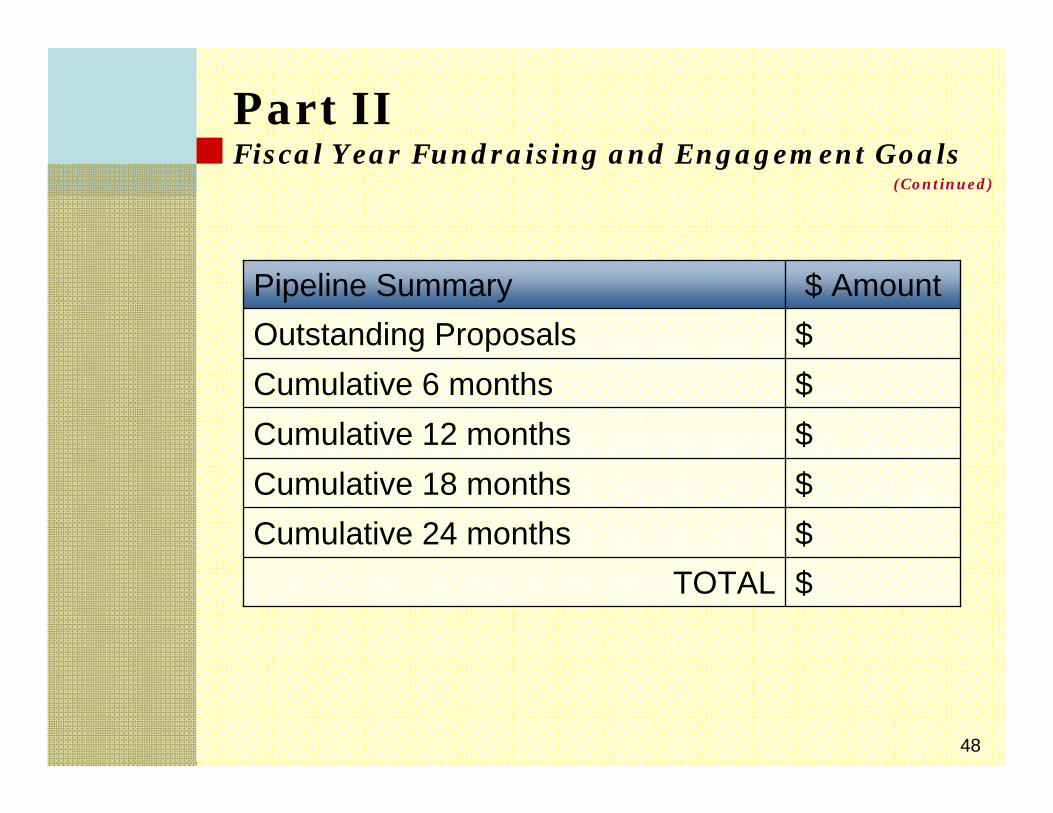
Part IIFiscal Year Fundraising and Engagement Goals
$TOTAL$Cumulative 24 months$Cumulative 18 months$Cumulative 12 months$Cumulative 6 months$Outstanding Proposals$ AmountPipeline Summary
(Continued)
49
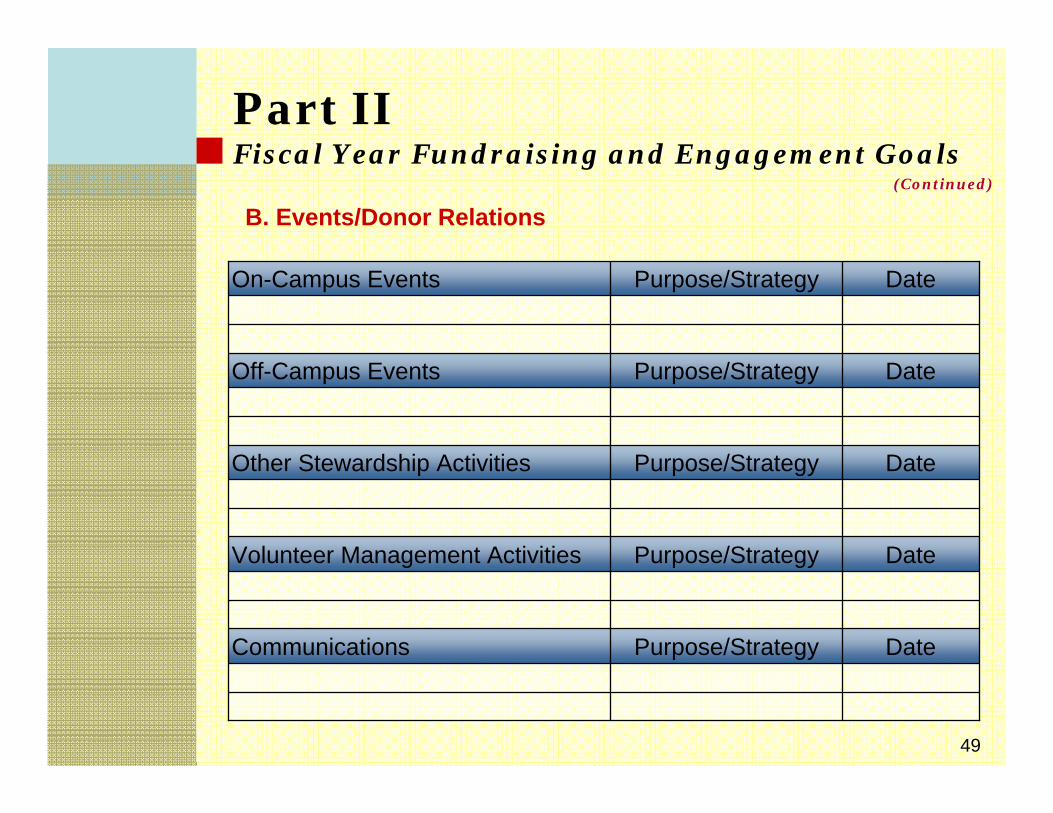
DatePurpose/StrategyCommunications
DatePurpose/StrategyOther Stewardship Activities
DatePurpose/StrategyVolunteer Management Activities
DatePurpose/StrategyOff-Campus Events
DatePurpose/StrategyOn-Campus Events
B. Events/Donor Relations
Part IIFiscal Year Fundraising and Engagement Goals
(Continued)
50
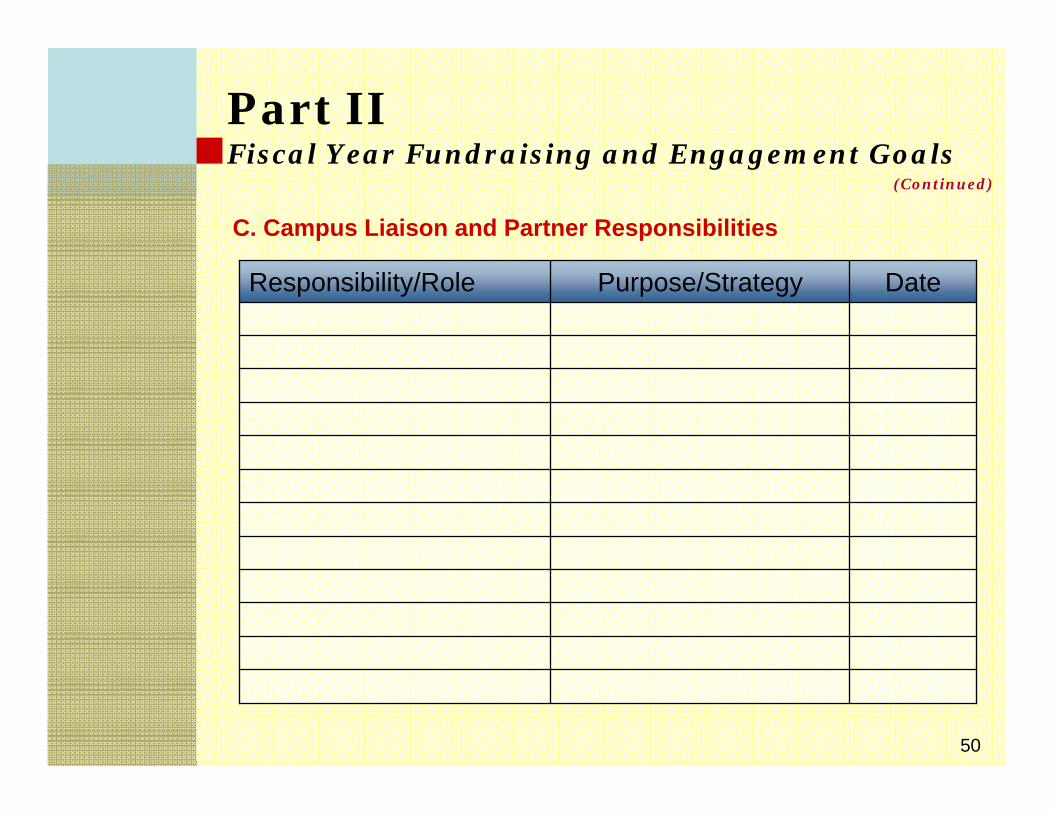
DatePurpose/StrategyResponsibility/Role
C. Campus Liaison and Partner Responsibilities
Part IIFiscal Year Fundraising and Engagement Goals
(Continued)
51
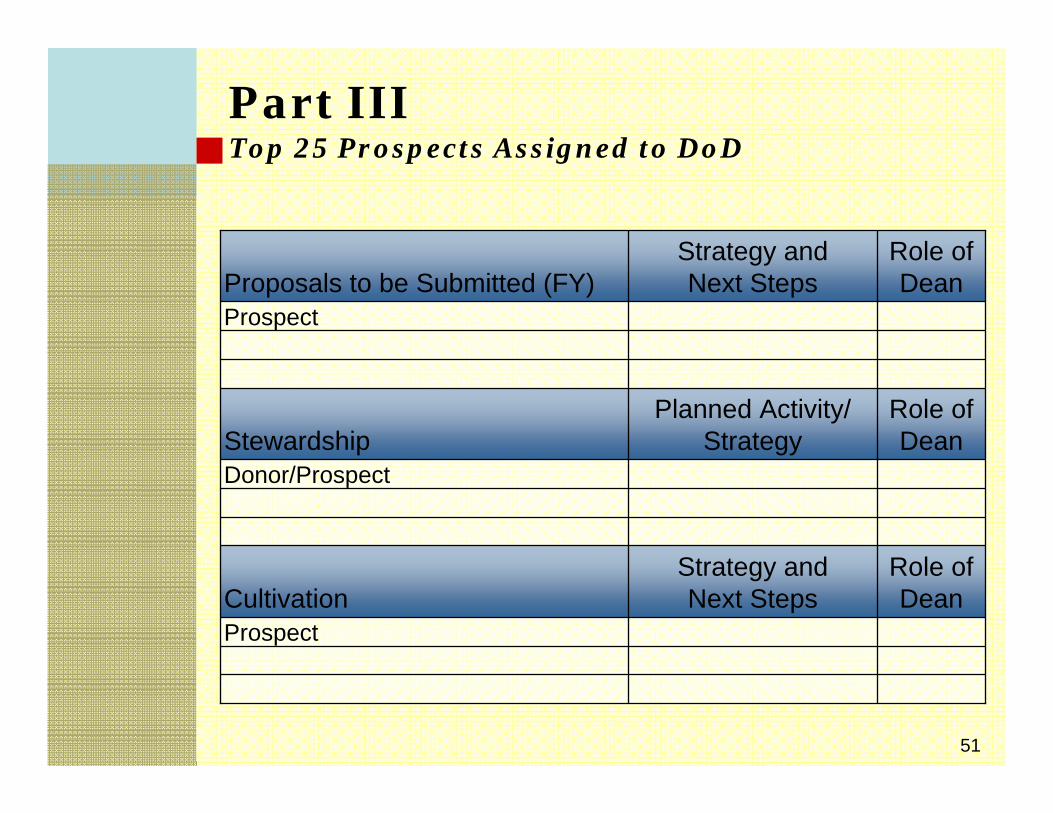
Part IIITop 25 Prospects Assigned to DoD
Role of Dean
Strategy andNext StepsCultivation
Prospect
Donor/Prospect
Role of Dean
Planned Activity/ StrategyStewardship
Prospect
Role of Dean
Strategy andNext StepsProposals to be Submitted (FY)
52
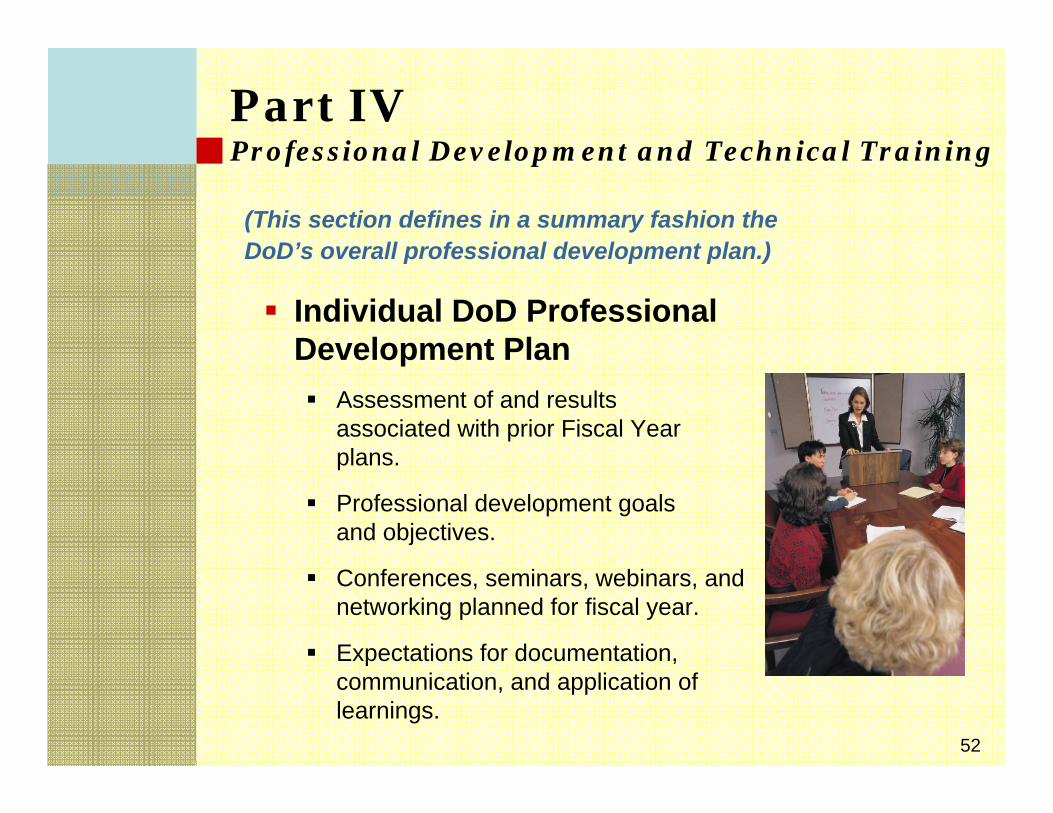
Part IVProfessional Development and Technical Training
Individual DoD Professional Development Plan
Assessment of and results associated with prior Fiscal Year plans.
Professional development goals and objectives.
Conferences, seminars, webinars, and networking planned for fiscal year.
Expectations for documentation, communication, and application of learnings.
(This section defines in a summary fashion the DoD’s overall professional development plan.)
53
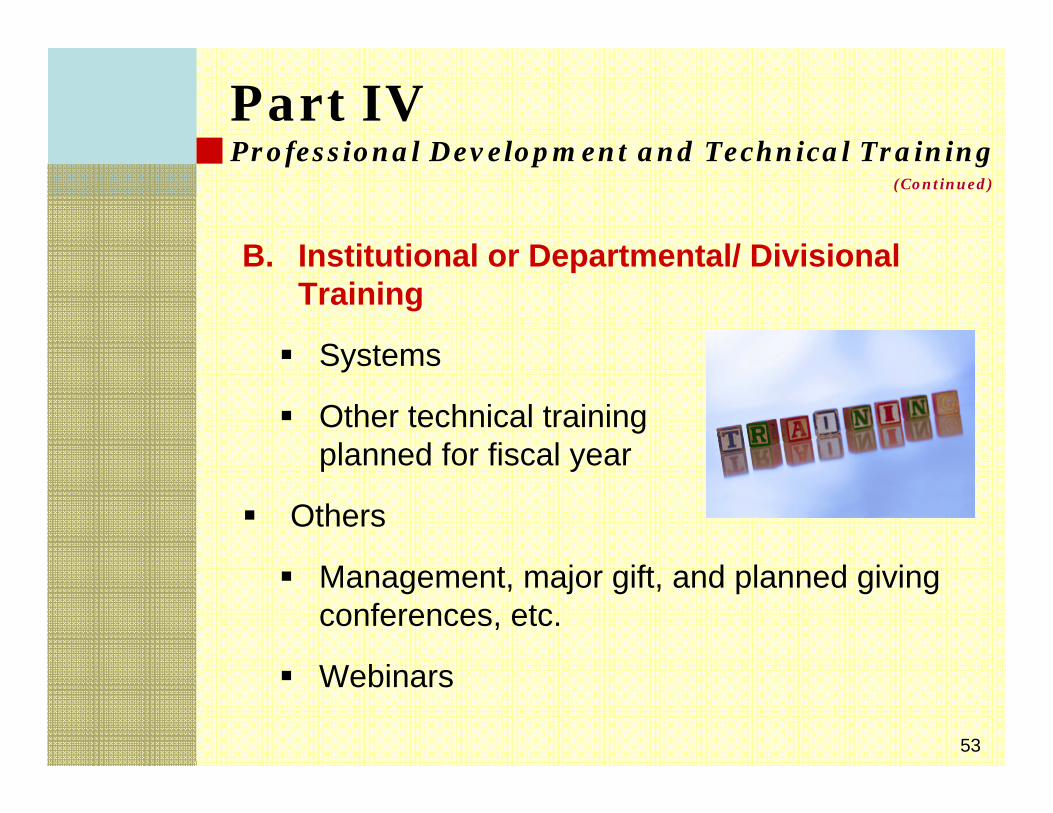
Part IVProfessional Development and Technical Training
B. Institutional or Departmental/ Divisional Training
Systems
Other technical training planned for fiscal year
Others
Management, major gift, and planned giving conferences, etc.
Webinars
(Continued)
54
Part VProfessional Support Needs
MGO identifies the resources and support required to meet the stated goals.
Opportunity to state ‘obstacles’ to higher productivity that could be addressed.
55
Performance Management
What actions have you taken over the last three months?
What are your successes?
What adjustments have you made?
What have you learned?
What relationships have you built?
What is your main focus for the next three months? six months?
What outcomes do you project?
What do you intend to learn?
What new relationships do you plan to build?
Which ones do you plan to enhance?
What are your needs?
Performance planning sessions
56
Why it Works
States clear objectives and expectations.
Makes work interesting and worthwhile.
Focuses on the future.
Fosters self-tracking
Addresses obstacles.
Helps people realize their ambitions and dreams.
Promotes frequent interaction.
57
Performance Reinforcement
58
Motivation and Managers
Motivation: the will to achieve.Motivation is not something you give to people—they give it to themselves.
Managers are only catalysts—agents.Yet, a manager determines:
• How long a staff member stays.
• How productive a staff member will be.
59
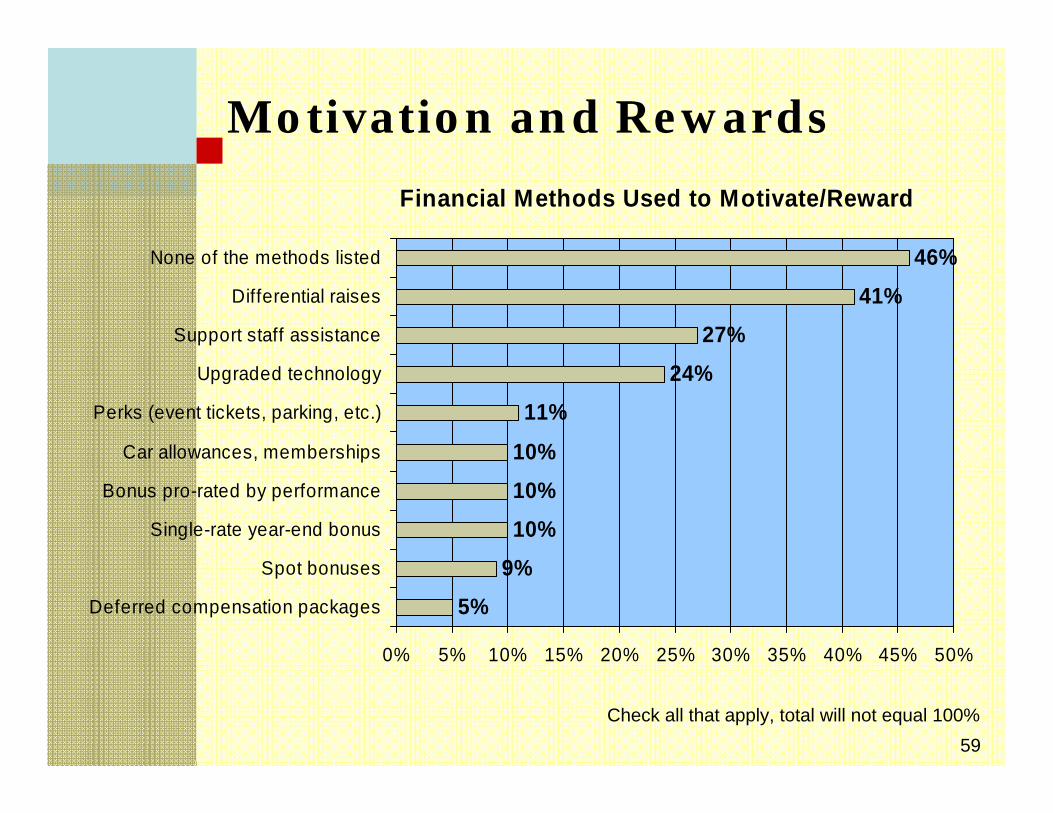
Motivation and Rewards
Financial Methods Used to Motivate/Reward
5%9%10%10%10%
11%24%
27%41%
46%
0% 5% 10% 15% 20% 25% 30% 35% 40% 45% 50%
Deferred compensation packages
Spot bonuses
Single-rate year-end bonus
Bonus pro-rated by performance
Car allowances, memberships
Perks (event tickets, parking, etc.)
Upgraded technology
Support staff assistance
Differential raises
None of the methods listed
Check all that apply, total will not equal 100%
60
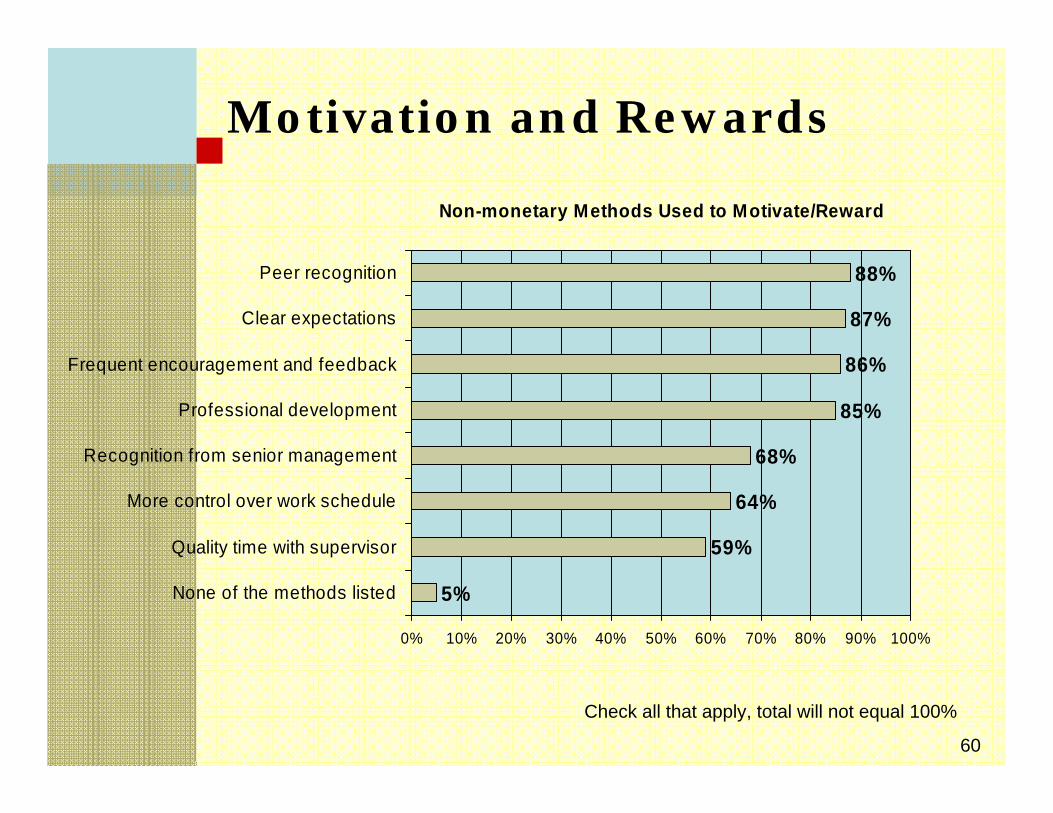
Motivation and Rewards
Non-monetary Methods Used to Motivate/Reward
5%
59%
64%
68%
85%
86%
87%
88%
0% 10% 20% 30% 40% 50% 60% 70% 80% 90% 100%
None of the methods listed
Quality time with supervisor
More control over work schedule
Recognition from senior management
Professional development
Frequent encouragement and feedback
Clear expectations
Peer recognition
Check all that apply, total will not equal 100%
61
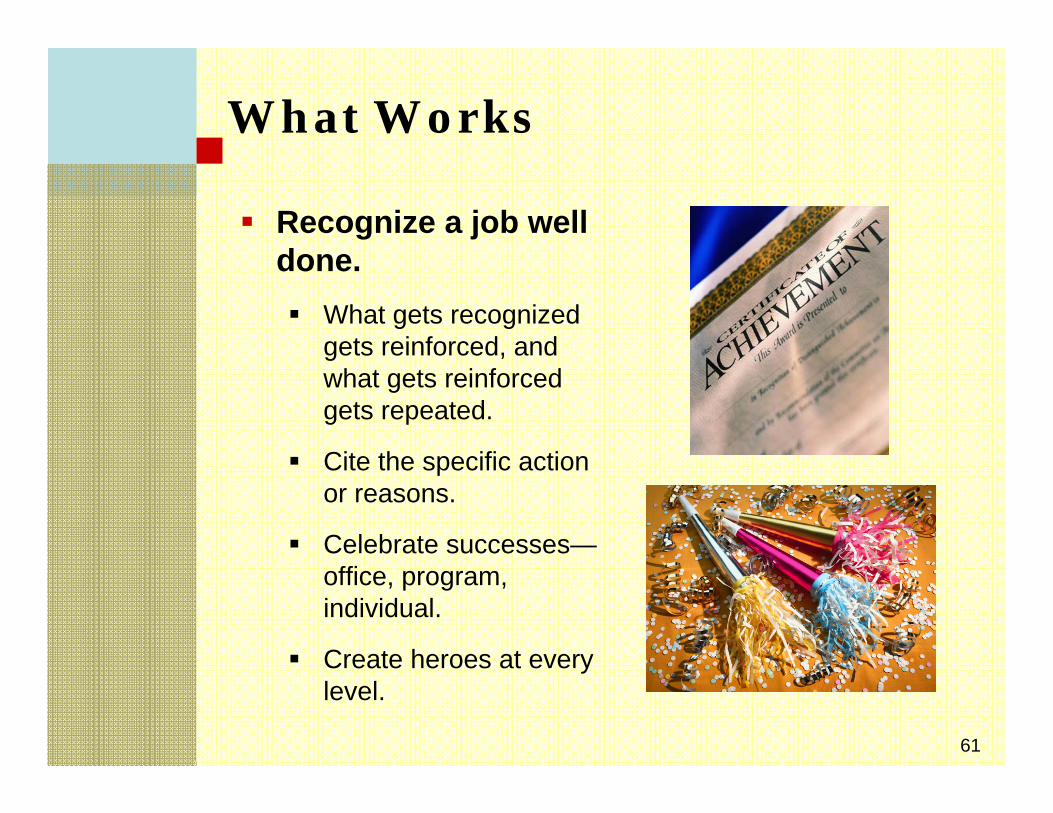
What Works
Recognize a job well done.
What gets recognized gets reinforced, and what gets reinforced gets repeated.
Cite the specific action or reasons.
Celebrate successes—office, program, individual.
Create heroes at every level.
62
Dialogue
63
Thank you!
Thomas W. Grabau, Ph.D.
www.bwf.com
68648/TWG:jub/092007
1
PERFORMANCE PLAN PROJECTIONS
TEMPLATE
_____________________________________________________________ Development Officer/Major Gift Officer _____________________________________________________________ Director of Major Gifts/Supervisor _____________________________________________________________ Director of Development and Alumni Affairs _____________________________________________________________ Dean/Administrator
2
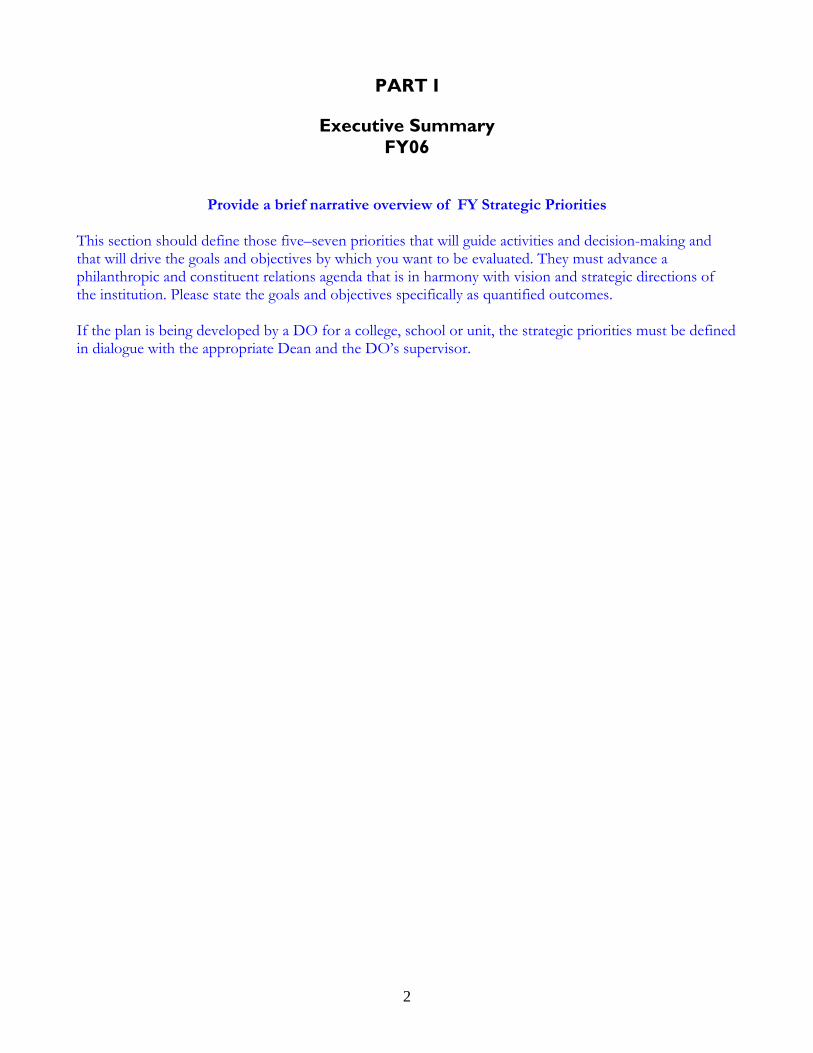
PART I
Executive Summary FY06
Provide a brief narrative overview of FY Strategic Priorities
This section should define those five–seven priorities that will guide activities and decision-making and that will drive the goals and objectives by which you want to be evaluated. They must advance a philanthropic and constituent relations agenda that is in harmony with vision and strategic directions of the institution. Please state the goals and objectives specifically as quantified outcomes. If the plan is being developed by a DO for a college, school or unit, the strategic priorities must be defined in dialogue with the appropriate Dean and the DO’s supervisor.
3
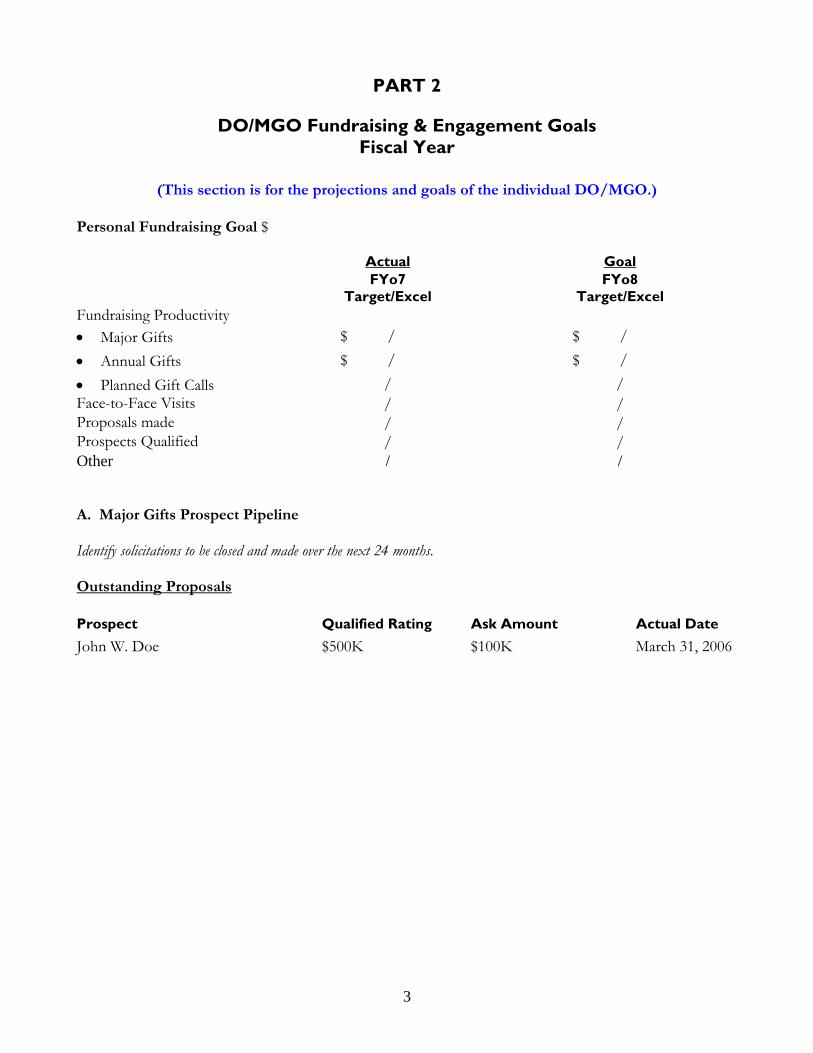
PART 2
DO/MGO Fundraising & Engagement Goals Fiscal Year
(This section is for the projections and goals of the individual DO/MGO.)
Personal Fundraising Goal $ Actual Goal FYo7
Target/Excel FYo8
Target/Excel Fundraising Productivity • Major Gifts $ / $ / • Annual Gifts $ / $ / • Planned Gift Calls / / Face-to-Face Visits / / Proposals made / / Prospects Qualified / / Other / / A. Major Gifts Prospect Pipeline Identify solicitations to be closed and made over the next 24 months. Outstanding Proposals Prospect Qualified Rating Ask Amount Actual Date John W. Doe $500K $100K March 31, 2006
4
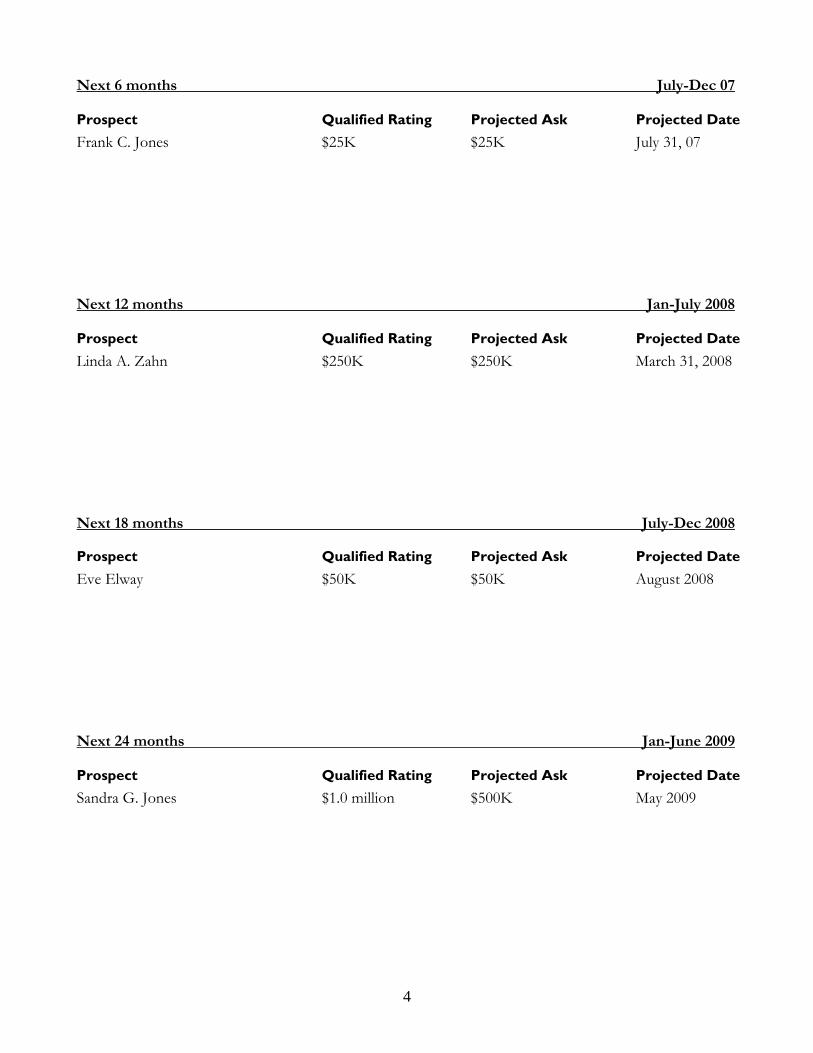
Next 6 months July-Dec 07 Prospect Qualified Rating Projected Ask Projected Date Frank C. Jones $25K $25K July 31, 07 Next 12 months Jan-July 2008 Prospect Qualified Rating Projected Ask Projected Date Linda A. Zahn $250K $250K March 31, 2008 Next 18 months July-Dec 2008 Prospect Qualified Rating Projected Ask Projected Date Eve Elway $50K $50K August 2008 Next 24 months Jan-June 2009 Prospect Qualified Rating Projected Ask Projected Date Sandra G. Jones $1.0 million $500K May 2009
5
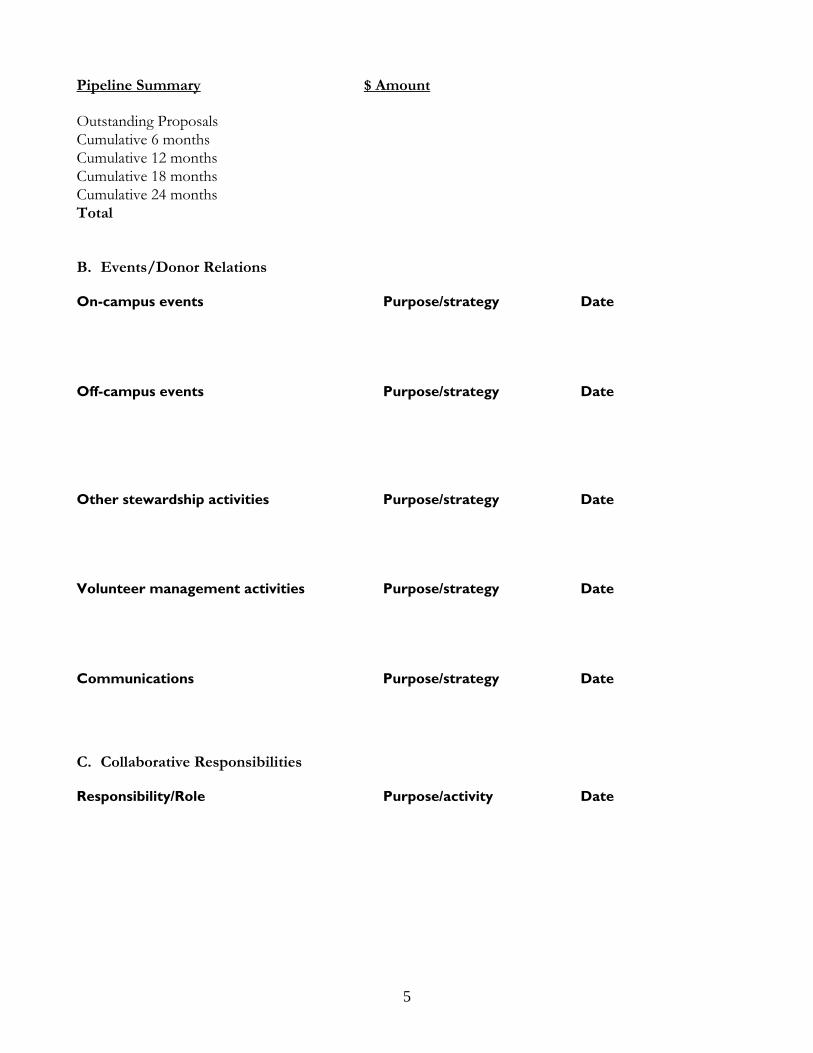
Pipeline Summary $ Amount Outstanding Proposals Cumulative 6 months Cumulative 12 months Cumulative 18 months Cumulative 24 months Total B. Events/Donor Relations On-campus events Purpose/strategy Date Off-campus events Purpose/strategy Date Other stewardship activities Purpose/strategy Date Volunteer management activities Purpose/strategy Date Communications Purpose/strategy Date
C. Collaborative Responsibilities Responsibility/Role Purpose/activity Date
6
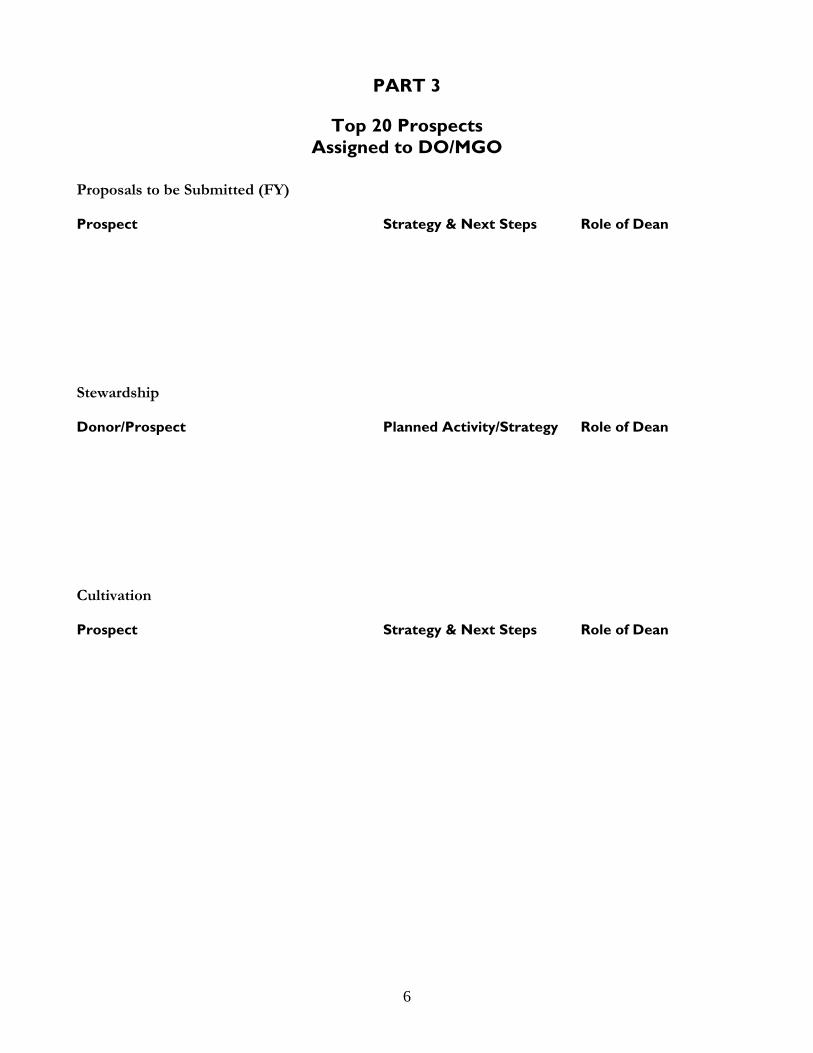
PART 3
Top 20 Prospects Assigned to DO/MGO
Proposals to be Submitted (FY) Prospect Strategy & Next Steps Role of Dean
Stewardship Donor/Prospect Planned Activity/Strategy Role of Dean
Cultivation Prospect Strategy & Next Steps Role of Dean
7
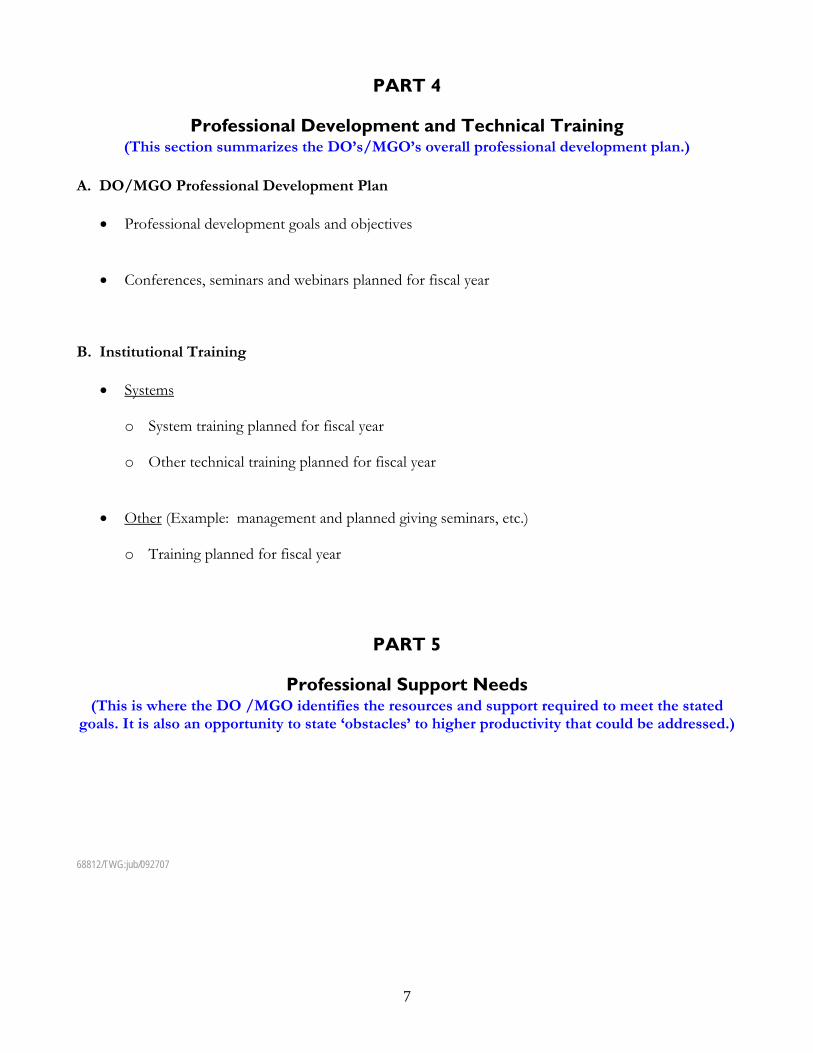
PART 4
Professional Development and Technical Training (This section summarizes the DO’s/MGO’s overall professional development plan.)
A. DO/MGO Professional Development Plan
• Professional development goals and objectives
• Conferences, seminars and webinars planned for fiscal year
B. Institutional Training
• Systems o System training planned for fiscal year
o Other technical training planned for fiscal year
• Other (Example: management and planned giving seminars, etc.) o Training planned for fiscal year
PART 5
Professional Support Needs (This is where the DO /MGO identifies the resources and support required to meet the stated
goals. It is also an opportunity to state ‘obstacles’ to higher productivity that could be addressed.) 68812/TWG:jub/092707


![[Webinar] What Makes a Strong Major Gifts Fundraiser?](https://img.pdfslide.us/doc/110x75/58a006241a28abd40b8b5c7d/webinar-what-makes-a-strong-major-gifts-fundraiser.jpg)