Embed Size (px)
Citation preview
139
www.metla.fi/silvafennica · ISSN 0037-5330The Finnish Society of Forest Science · The Finnish Forest Research Institute
SILVA FENNICA Silva Fennica 45(1) review articles
Major Decline in Fires in Coniferous Forests – Reconstructing the Phenomenon and Seeking for the Cause
Tuomo Wallenius
Wallenius, T. 2011. Major decline in fires in coniferous forests – reconstructing the phenomenon and seeking for the cause. Silva Fennica 45(1): 139–155.
Steep decline in forest fires about a century ago occurred in coniferous forests over large areas in North America and Fennoscandia. This poorly understood phenomenon has been explained by different factors in different regions. The objective of this study is to evaluate the validity of the four most commonly suggested causes of the decrease in forest fires: fire fighting, over-grazing, climate change and human influence. I compiled the available den-drochronological data and estimated the annually burned proportions of Pinus-dominated forests in four subcontinental regions during the past 500 years. These data were compared to the development of fire suppression, grazing pressure, climate and human livelihoods. The annually burned proportions declined over 90% in all studied regions. In three out of the four regions fires decreased decades before fire suppression began. Available drought data are annually well correlated with fires but could not explain the decrease of the level in annually burned areas. A rapid increase in the number of livestock occurred at the same time with the decrease in fires in the Western US but not in Fennoscandia. Hence, fire suppression in Central Fennoscandia and over-grazing in the Western US may have locally contributed to the reduction of burned areas. More general explanation is offered by human influence hypothesis: the majority of the past forest fires were probably caused by humans and the decrease in the annually burned areas was because of a decrease in human caused fires. This is in accordance with the old written records and forest fire statistics. The decrease in annu-ally burned areas, both in Fennoscandia and the United States coincides with an economic and cultural transition from traditional livelihoods that are associated with high fire use to modern agriculture and forestry.
Keywords human influence, fire-history, fire suppression, forest dynamics, PinusAddresses Finnish Forest Research Institute, Vantaa Research Unit, Vantaa, FinlandE-mail [email protected] 14 June 2010 Revised 10 January 2011 Accepted 4 March 2011Available at http://www.metla.fi/silvafennica/full/sf45/sf451139.pdf
140
Silva Fennica 45(1), 2011 review articles
1 Introduction
Frequent forest fires, having pronounced impacts on species composition, tree age, size structures, and nutrient cycling in forests, are considered to be integral part of the ecology of global conifer-ous forests (Goldammer and Furyaev 1996, Pyne et al. 1996). Widespread distribution of the post-fire regeneration cohorts of trees as well as fire-killed and fire-scarred trees attest to the powerful effects of fires on forests and enable the accurate dating of fires of the past few centuries. In the well-studied coniferous forests of Fennoscandia and North America, the reported point-wise fire intervals (corresponding to the inverses of the mean annually burned proportions) have mostly varied from a decade to a century or somewhat more in the past (Niklasson and Granström 2000, Baker and Ehle 2001, Groven and Niklasson 2005, Zhang and Chen 2007).
In contrast to the ample publicity for the recent years‘ large forest fires in North America (Stocks et al. 2002, Whitlock 2004, Westerling et al. 2006), most fire-history studies show a dramatic decline in burned areas when approaching the modern times (Niklasson and Granström 2000, Groven and Niklasson 2005, Zhang and Chen 2007, Marlon et al. 2008). In the latter half of the 20th century, in most parts of North America and Fennoscandia, fires have been so rare that the expected fire intervals are now in the hundreds or thousands of years.
The decrease in fire frequency has resulted in considerable changes in forest structure and spe-cies composition. In Fennoscandia, for example, dozens of fire-dependent species have become endangered (Rassi et al. 2001, Wikars 2004), and large parts of the forests of the Western US are growing more fully stocked than earlier, which leads to more destructive fires (Allen et al. 2002, Whitlock 2004). Although alarmed by these changes, researchers have paid relatively little attention to the cause of the widespread drop in annually burned areas. Usually authors have offered one or two more or less „likely“ explanations, which, however, vary from study to study.
The most common hypotheses presented for the decline in fires have been the following:
1) Fire suppression. The effectiveness of fire suppression has been suggested because of the more or less simultaneous start of fire suppression policy and the decline in fires (Heinselman 1973, Zackrisson 1977). The development of fire sup-pression was started by newly-established public forest services in the 1860s in Fennoscandia (Niklasson and Granström 2000, Ruuttula-Vasari 2004) and in the 1910s in North America (Pyne et al. 1996). The practices included new regulations concerning the use of fire in forests, education, surveillance of people and fires, and extinguishing of fires. However, fire suppression is considered essentially to be an unnatural interference by man in natural forest dynamics, i.e. putting out fires lit by lightning.
2) Climate change. Climatic explanation for the decline in burned areas is suggested in Canada. Despite the generally warming trend since the end of the Little Ice Age it has been proposed that the decrease in the annually burned area has been mainly caused by climate change (e.g. Flannigan et al. 1998, Weir et al. 2000, Girardin et al. 2009). There is no doubt that most forest fires occur during dry and hot weather. However, climatic warming does not necessarily mean more risky fire weather. In southeastern and southwestern Canada, monthly drought code (MDC) in July indicates increasing summer moisture during the 20th century and this has been associated with the decrease in fires since the latter half of the 19th century (Girardin et al., 2009). It has been also proposed that the Pacific Decadal Oscil-lation (PDO) and Atlantic Multidecadal Oscil-lation (AMO) of the sea surface temperatures could explain the long-term trends in fire regimes in that the positive phase of AMO promotes widespread synchronous fires in western North America and the positive PDO does so in northern North America (Kitzberger et al. 2007, Fauria and Johnson 2008).
3) Livestock over-grazing. In the Western US it is suggested that grazing by cattle and sheep in the end of the 19th century reduced the amount of fire-carrying vegetation, and that this contributed to the observed reduction in the annually burned areas (Savage and Swetnam 1990, Heyerdahl et al. 2001, Grissino-Mayer et al. 2004).
4) Past human influence. Many fire-history studies both in Fennoscandia and North America
141
Wallenius Major Decline in Fires in Coniferous Forests – Reconstructing the Phenomenon …
have suggested that a considerable proportion of past fires have been caused by humans and that the reduction in such fires has contributed at least to the observed decrease in number of fires (Niklasson and Granström 2000, Weir et al. 2000, Evett et al. 2007, Granström and Niklasson 2008). In North America, this explanation has usually been coupled with the climatic hypothesis, which has, however, been seen as the main reason for the decrease in the annually burned areas. In Fennoscandia, more careful handling of fire has not been clearly separated from the effects of extinguishing fires.
It is improbable that all the offered explanations are correct or that they are valid everywhere. More likely, the variety of explanations reflects the lack of comprehensive study of the topic that would cover wide spatial and temporal scales. My objective is to clarify the timing and magni-tude of the decline in forest fires and discuss the validity of the four most commonly suggested causes for it.
2 Materials and Methods
I evaluated validity of the hypotheses above with extensive data sets from four intensively studied coniferous forest regions in two continents rep-resenting temperate and boreal vegetation zones. In order to study the temporal and spatial patterns of the major decline in fires, the annually burned areas for the past 500 years were reconstructed using fire-scarred trees. In the studied sites in the Northwest and Southwest US, the dominant species is Pinus ponderosa Dougl. (Laws.) and in Fennoscandia Pinus sylvestris L.. These long-living and widely distributed tree species form fire scars, which do not decay easily and allow accurate dendrochronological dating of past fires. Although results do not represent systematic sample of all forest types, this does not invalidate the analysis since I am focusing on the magnitude and timing of the decline in fires.
Data for the Western US were downloaded in November 2008 from the International Multi-proxy Paleofire Database (http://www.ncdc.noaa.gov/paleo/impd/paleofire.html). A total of 6069 fire-scarred trees from 289 sites in the western
states, i.e. all studies where ‘recording years’ of trees were marked separately from non-recording years, were included in the study (Supplementary data, Table S1). The trees were usually considered susceptible to scarring, and hence to recording fires, only after they had got the first fire scar.
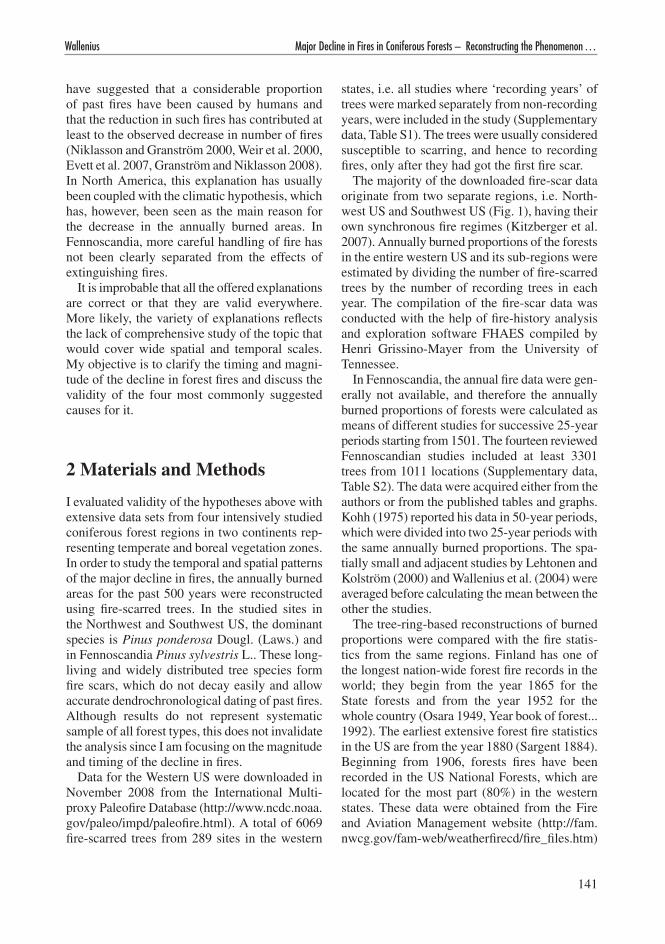
The majority of the downloaded fire-scar data originate from two separate regions, i.e. North-west US and Southwest US (Fig. 1), having their own synchronous fire regimes (Kitzberger et al. 2007). Annually burned proportions of the forests in the entire western US and its sub-regions were estimated by dividing the number of fire-scarred trees by the number of recording trees in each year. The compilation of the fire-scar data was conducted with the help of fire-history analysis and exploration software FHAES compiled by Henri Grissino-Mayer from the University of Tennessee.
In Fennoscandia, the annual fire data were gen-erally not available, and therefore the annually burned proportions of forests were calculated as means of different studies for successive 25-year periods starting from 1501. The fourteen reviewed Fennoscandian studies included at least 3301 trees from 1011 locations (Supplementary data, Table S2). The data were acquired either from the authors or from the published tables and graphs. Kohh (1975) reported his data in 50-year periods, which were divided into two 25-year periods with the same annually burned proportions. The spa-tially small and adjacent studies by Lehtonen and Kolström (2000) and Wallenius et al. (2004) were averaged before calculating the mean between the other the studies.
The tree-ring-based reconstructions of burned proportions were compared with the fire statis-tics from the same regions. Finland has one of the longest nation-wide forest fire records in the world; they begin from the year 1865 for the State forests and from the year 1952 for the whole country (Osara 1949, Year book of forest... 1992). The earliest extensive forest fire statistics in the US are from the year 1880 (Sargent 1884). Beginning from 1906, forests fires have been recorded in the US National Forests, which are located for the most part (80%) in the western states. These data were obtained from the Fire and Aviation Management website (http://fam.nwcg.gov/fam-web/weatherfirecd/fire_files.htm)
142
Silva Fennica 45(1), 2011 review articles
for the period 1970–2007 and prior to that as paper copies of annual reports (National Forest Fire Report 1938, 1940–1941, 1948–1959, 1969; Annual Fire Report... 1960–1968). Seven annual reports; 1939 and 1942–1947 could not be found. The burned proportions based on these statistics were calculated by dividing the annually burned areas of National Forest lands by the annual acre-age of the National Forests (http://www.fs.fed.us/land/staff/lar/LAR07/TABLE_21.htm). Since the National Forests include also rarely- or never-burned areas, the burned proportions of forests can be expected to be somewhat higher than the calculated results.
In order to objectively evaluate the capacity to extinguish forest fires in the Western US, I used inflation adjusted fire control costs (emergency funds excluded) on US federal lands (Historical statistics of... 1975, Large Fire Suppression... 2004). Another option would have been to report milestones of technical development, like the introduction of motorized fire engines and fire fighting aircraft. Studies where the effectiveness of fire suppression have been interpreted from fire-history has little value in resolving the ques-tion of what has caused the dramatic decrease in annually burned areas.
In order to test the proposed effects of cli-matic variables to burned areas, reconstructions of past PDOs (MacDonald and Case 2005) and AMOs (Gray et al. 2004) were acquired from the World Data Center for Paleoclimatology (ftp://ftp.ncdc.noaa.gov/pub/data/paleo/treering/recon-structions/pdo-macdonald2005.txt, ftp://ftp.ncdc.noaa.gov/pub/data/paleo/treering/reconstructions/amo-gray2004.txt). The most recent and most extensive one were selected from the several available PDO reconstructions. The World Data Center for Paleoclimatology also provides annual Palmer’s Drought Severity Index (PDSI) recon-structions for the past centuries (Cook et al. 2004) over a grid covering the entire US (http://www.ncdc.noaa.gov/paleo/newpdsi.html). The PDSI gives estimates for the cumulative departure of soil moisture content using monthly temperature and precipitation data and potential evaporation. Negative values (usually down to –6) denote drought and positive values wet conditions. The annual mean of the PDSI values of the grid points 43, 44, 55, 56, 68 and 69 was computed to serve
as a regional drought index in the Northwest US. In the case of the Southwest US I used the grid points 104, 105, 118, 119, 120, 131, 132, 133, and 134.
PDSI reconstructions were not available for Fennoscandia. Instead reconstructed summer
Fig. 1. The locations of the four subcontinental regions in A) the Western US and B) Fennoscandia where the fire histories were reconstructed. The triangles denote the sampling locations in the Western US and the stars indicate the study areas’ mid-points in Fennoscandia. Approximate date for the steep-est decline in annually burned areas is given for the regions.
143
Wallenius Major Decline in Fires in Coniferous Forests – Reconstructing the Phenomenon …
temperature (Luterbacher et al. 2004) and pre-cipitation (Pauling et al. 2006) were obtained from the Climate Explorer of the Royal Nether-lands Meteorological Institute (KNMI) (http://climexp.knmi.nl/). In addition, instrumentally measured mean summer (June, July and August) temperature and summer precipitation sums for the Western US and Fennoscandia were down-loaded from the KNMI. Six inland stations in the Western US (WMO station codes: 72681, 72483.3, 72376.2, 72269.1, 72653.5, 74530.3) were selected because they have nearly complete weather records dating back to 1868. In Fennos-candia, the selected temperature stations (WMO codes: 1489.1, 2464, 2974) have measured tem-perature continuously at least since 1829 and precipitation stations (WMO codes: 2458.1, 2974, 2627.2) since 1845. Instrumentally determined sea surface temperature indices PDO and AMO were also downloaded from the KNMI (Mantua et al. 1997, Kaplan et al. 1998).
Pearson’s correlations of all the climatic vari-ables with the reconstructed burned proportions were tested in 25-year resolution in Fennoscandia and in annual resolution in the Western US. For the annually burned proportions in the Southwest US it was possible to build a well-fitting general-ized linear model (GLM) using the quasi-likeli-hood with the variance function of the Poisson distribution and the logarithmic link function. The predictors were the same year’s and the previous years’ PDSIs.
Density of cattle was calculated by dividing the number of cattle by the surface area of the area in question. Annual number of cattle in the first of January in US for the period 1867–2007 was obtained from the National Agricultural Statistics Services, United States Department of Agriculture (http://www.nass.usda.gov/). Aver-aged cattle density in Arizona, New Mexico and Colorado were compared to the reconstructed annually burned proportions in the Southwest US (Fig. 1). Correspondingly data from Washington, Oregon, Idaho and Montana were combined and compared to the forest fires in the Northwest US. Cattle data from Finland is available from the beginning of 19th century (Suomen tilastollinen vuosikirja 1925, 1940, Soininen 1974, Statistical Year Book... 1985).
Comprehensive data on the number of human-caused forest fires in the distant past is lacking. Fire statistics including the proportion of human-caused fires are available since 1906 for the US National Forests (National Forest Fire Report, 1938, 1940–1941, 1948–1959, 1969; http://fam.nwcg.gov/fam-web/weatherfirecd/fire_files.htm). During the first three decades the total number of annually recorded fires steeply increased mainly because of improving recording. In 1936 Forest Service started the 10 a.m. policy (meaning that all fires must be put out before 10 o‘clock in the next morning) and as a result at least record keeping of fires was arguably nearly complete. Since that time there is no long-term trend in the record of lightning fires in US National forests, but instead there is a significant decreasing trend (r = –0.55, p < 0.001) in the number of human caused fires.
I suggest that the ratio of human caused fires to lightning fires can be used to show changes in the human contribution or ‚human factor‘ on forest fires. The annual ratio of the number of human caused fires to five year running mean of lightning ignited fires was calculated from the data and it‘s correlation to annually burned proportions was tested. The problem with the fire statistics from the National Forests is that they do not extent to the early times with excessive fires. To get a data point in the 19th century I calculated another vari-able by using decadal resolution and by adding the earliest fire statistics from the 11 western states of US (Sargent 1884).
Estimates of the annually slash-and-burn culti-vated land in Finland (Heikinheimo 1915), com-bined lumber exports from Finland (Ahvenainen 1984) and Sweden (Skogs-styrelsens under-dåniga... 1879, Ilvessalo and Jalava 1931) and lumber production of western tree species (‚doug-las fir‘, ‚western pine‘, ‚hemlock‘ and ‚redwood‘; (Wright 2006) in the US were also used to demon-strate the period of fast transition from traditional fire-causing livelihoods to modern agriculture and forestry. In connection with the modern land uses, forest fires are undesirable.
144
Silva Fennica 45(1), 2011 review articles
3 Results
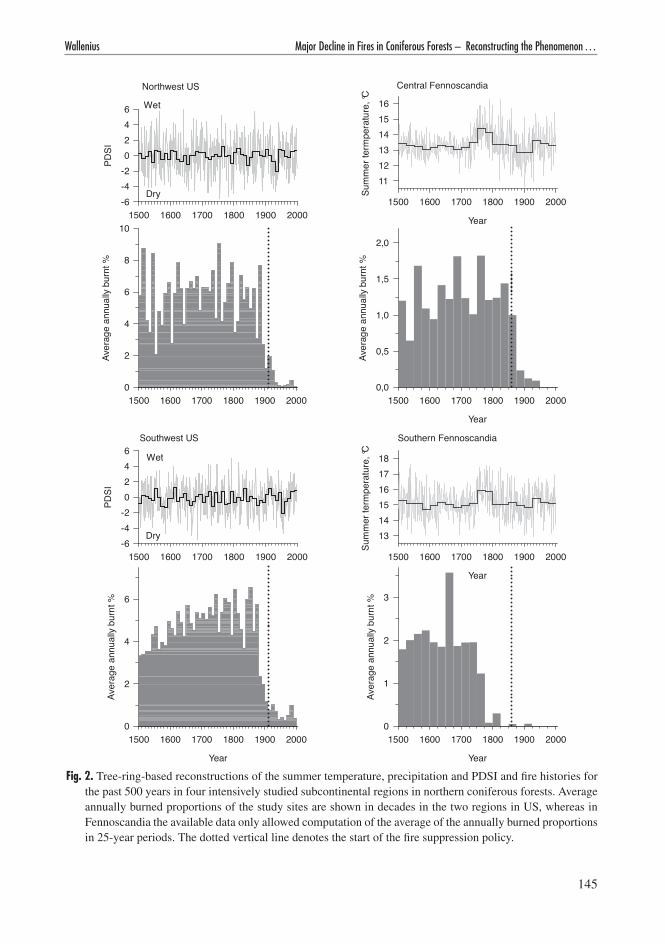
In central Fennoscandia and the Western US, the mean annually burned areas in Pinus-dominated forests diminished between 1850 and 1950 to less than one tenth of what they had been at least since the 16th century (Figs. 2 & 3). In southern Fennoscandia, similar dramatic reduction took place already before the end of the 18th century. Detailed recording of fires began only after most of the reduction in mean annually burned area had already taken place. Annually burned proportions in the US National Forests correlate well with the reconstructed fire history in the Northwest US (Table 1). Also in general the available fire statistics are consistent with the results of the fire-scar-based reconstructions of the burned pro-portions (Fig. 3). Somewhat higher values in the reconstructions as compared to those in the fire statistics could be expected because the sampling sites in the fire-history studies have often been subjectively selected to include a good sample of fire-scarred trees, and therefore possibly more frequently burned stands than the average of the region. Pinus-dominated forests also tend to burn more often than forests dominated by other spe-cies.
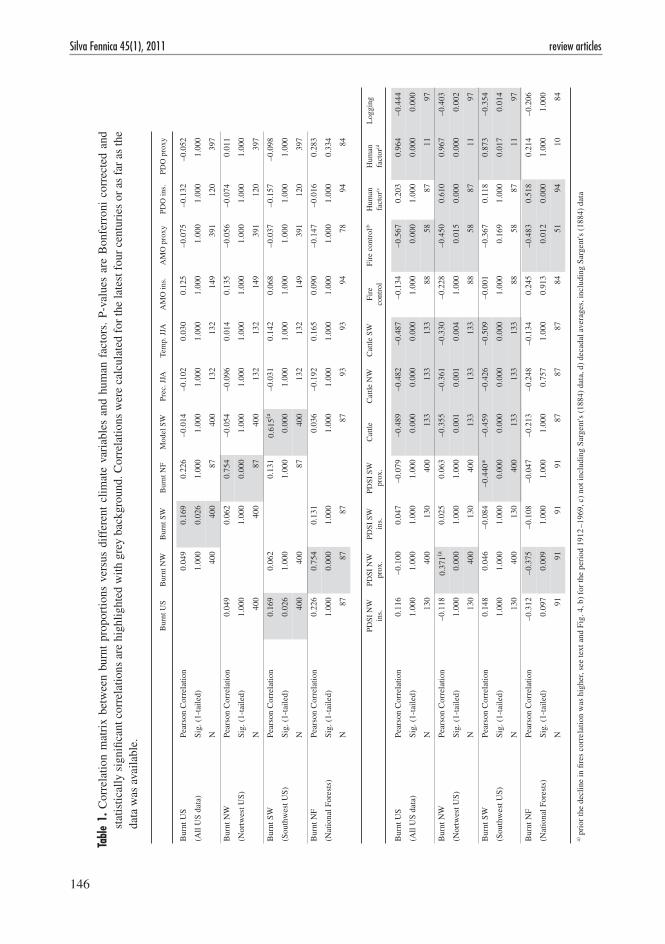
In three out of the four regions, the majority of the reduction in annually burned areas occurred at least two decades before the onset of wide-scale public fire-suppression actions (Figs. 2–4). As is demonstrated by the fire-suppression costs reported for federal lands in the United States (Fig. 3), the resources for extinguishing fires were minuscule before World War II compared to what they are today. Annual fire suppression costs (emergency funds excluded) do not significantly correlate with the annually burned proportions over the whole suppression period in the Western US (Table 1). However, the significant negative correlation for the period 1912–1969 indicates that increasing investment to fire suppression may have reduced annually burned areas in the 1930s and 1940s.
I tested the correlations between several climatic indices and variables, such as summer precipita-tion and summer temperature, with the propor-tions of burn-over area in the Western US and Fennoscandia, but all except one (see below) were
statistically non-significant across the decline in fires and also before the decline (Figs 2 & 3, Table 1). Lack of annual resolution in the Fen-noscandian fire data probably impeded finding of any significant correlation in Fennoscandia. The only statistically significantly correlating cli-matic variable was PDSI, which could be studied solely in the US with long-term reconstructions being available there. The correlations between PDSI and the burned proportion were statistically significant across the whole period including the dramatic decline in fires (Table 1), but for the period before the reduction (1600–1850) the cor-relation coefficients were higher, being –0.44 (p < 0.001) in the Northwest and –0.53 (p < 0.001) in the Southwest of the Untied States.
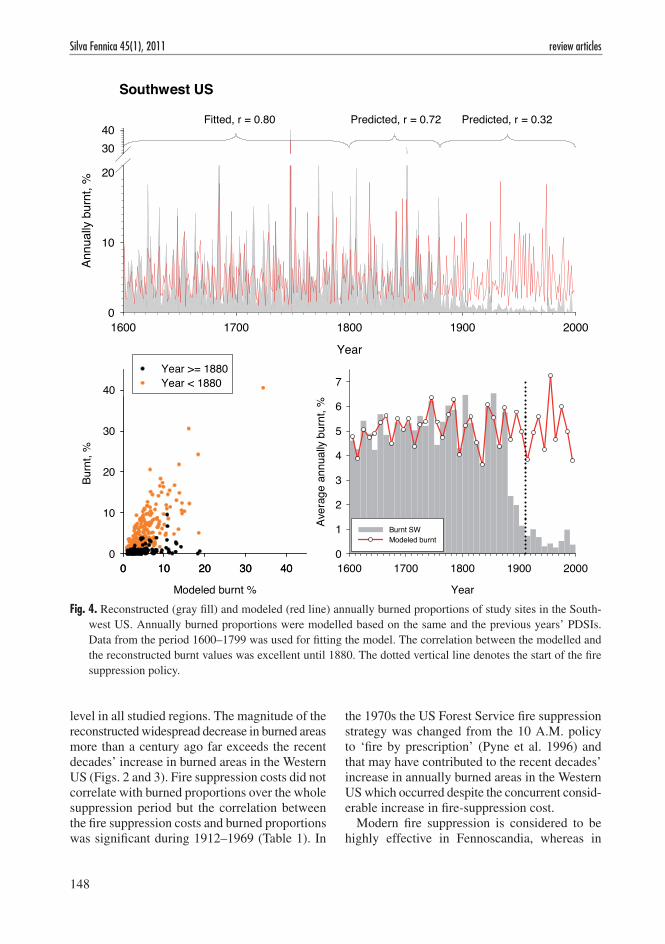
It was possible to build a model for the annually burned proportion in the Southwest US, which explains very well (r = 0.80, p < 0.001) the inter-annual variation in the burned proportions during the period 1600–1799 into which it was fitted (Fig. 4). The model has the form
E(yt) = at, ln(at) = 3.71 – 0.349Dt + 0.232Dt–1, var(yt) = 3.71at (1)
where E(yt) is the expected value and var(yt) is the variance of the modelled burned proportion yt (‰) during year t. Dt is the Palmer’s Drought Severity Index during the same year and Dt–1 is the same index in the previous year. The drier the summer was the more area was burned but the previous years’ effect was the opposite. For the period 1800–1879, the model was able to predict the annually burned proportion well (r = 0.72, p < 0.001), but beginning from 1880 the predicted values were systematically higher than the burned proportions (Fig. 4).
The rapid increase in the number of domestic livestock coincides with the beginning of the reduction in the burned areas in the Western US (Table 1, Fig. 5). The highest correlation (r = 0.50, p < 0.001) between the density of cattle and burned proportions was found in the Southwest US. In Finland, the density of cattle was gener-ally higher and increased more steadily than in the Western US. Around the 1860s and 1870s when annually burned areas decreased sharply there was not any corresponding change in the number of cattle.
145
Wallenius Major Decline in Fires in Coniferous Forests – Reconstructing the Phenomenon …
Year
1500 1600 1700 1800 1900 2000
Sum
mer
term
pera
ture
, °C
131415161718
1500 1600 1700 1800 1900 2000
Aver
age
annu
ally
burn
t %
0
2
4
6
8
10
Year
1500 1600 1700 1800 1900 2000
Aver
age
annu
ally
burn
t %
0
2
4
6
Central Fennoscandia
Year
1500 1600 1700 1800 1900 2000
Aver
age
annu
ally
burn
t %
0,0
0,5
1,0
1,5
2,0
Southwest US
Year
1500 1600 1700 1800 1900 2000
Aver
age
annu
ally
burn
t %
0
1
2
3
Northwest US
Southern Fennoscandia
1500 1600 1700 1800 1900 2000
PDSI
-6-4-20246
1500 1600 1700 1800 1900 2000
PDSI
-6-4-20246
Wet
Wet
Dry
Dry
Year
1500 1600 1700 1800 1900 2000
Sum
mer
term
pera
ture
, °C
111213141516
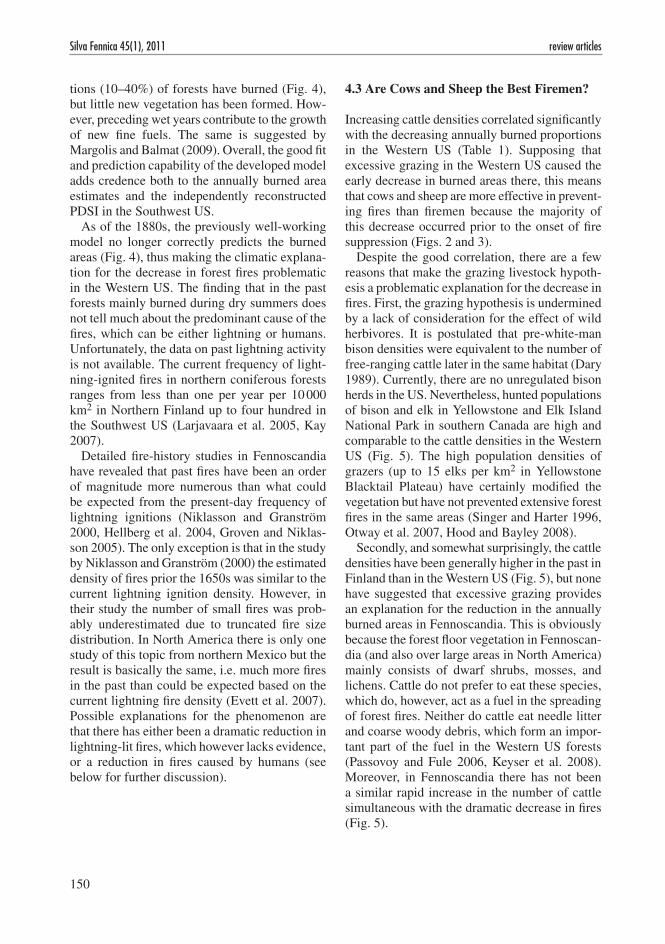
Fig. 2. Tree-ring-based reconstructions of the summer temperature, precipitation and PDSI and fire histories for the past 500 years in four intensively studied subcontinental regions in northern coniferous forests. Average annually burned proportions of the study sites are shown in decades in the two regions in US, whereas in Fennoscandia the available data only allowed computation of the average of the annually burned proportions in 25-year periods. The dotted vertical line denotes the start of the fire suppression policy.
146
Silva Fennica 45(1), 2011 review articles
Tabl
e 1.
Cor
rela
tion
mat
rix
betw
een
burn
t pr
opor
tions
ver
sus
diff
eren
t cl
imat
e va
riab
les
and
hum
an f
acto
rs.
P-va
lues
are
Bon
ferr
oni
corr
ecte
d an
d st
atis
tical
ly s
igni
fican
t cor
rela
tions
are
hig
hlig
hted
with
gre
y ba
ckgr
ound
. Cor
rela
tions
wer
e ca
lcul
ated
for
the
late
st f
our
cent
urie
s or
as
far
as th
e da
ta w
as a
vaila
ble.
Bur
nt U
S
Bur
nt N
W
Bur
nt S
W
Bur
nt N
F
Mod
el S
W
Pre
c. J
JA
Tem
p. J
JA
AM
O in
s.
AM
O p
roxy
P
DO
ins.
P
DO
pro
xy
Bur
nt U
S
Pea
rson
Cor
rela
tion
0.04
9 0.
169
0.22
6 –0
.014
–0
.102
0.
030
0.12
5 –0
.075
–0
.132
–0
.052
(All
US
dat
a)
Sig
. (1-
tail
ed)
1.
000
0.02
6 1.
000
1.00
0 1.
000
1.00
0 1.
000
1.00
0 1.
000
1.00
0
N
400
400
87
400
132
132
149
391
120
397
Bur
nt N
W
Pea
rson
Cor
rela
tion
0.
049
0.
062
0.75
4 –0
.054
–0
.096
0.
014
0.13
5 –0
.056
–0
.074
0.
011
(Nor
twes
t US
) S
ig. (
1-ta
iled
) 1.
000
1.
000
0.00
0 1.
000
1.00
0 1.
000
1.00
0 1.
000
1.00
0 1.
000
N
40
0
400
87
400
132
132
149
391
120
397
Bur
nt S
W
Pea
rson
Cor
rela
tion
0.
169
0.06
2
0.13
1 0.
615(a
–0
.031
0.
142
0.06
8 –0
.037
–0
.157
–0
.098
(Sou
thw
est U
S)
Sig
. (1-
tail
ed)
0.02
6 1.
000
1.
000
0.00
0 1.
000
1.00
0 1.
000
1.00
0 1.
000
1.00
0
N
40
0 40
0
87
400
132
132
149
391
120
397
Bur
nt N
F
Pea
rson
Cor
rela
tion
0.
226
0.75
4 0.
131
0.
036
–0.1
92
0.16
5 0.
090
–0.1
47
–0.0
16
0.28
3
(Nat
iona
l For
ests
) S
ig. (
1-ta
iled
) 1.
000
0.00
0 1.
000
1.
000
1.00
0 1.
000
1.00
0 1.
000
1.00
0 0.
334
N
87
87
87
87
93
93
94
78
94
84
PD
SI
NW
in
s.
PD
SI
NW
pr
ox.
PD
SI
SW
in
s.
PD
SI
SW
pr
ox.
Cat
tle
Cat
tle
NW
C
attl
e S
W
Fir
e co
ntro
l F
ire
cont
rol(b
H
uman
fa
ctor
(c
Hum
an
fact
or(d
Log
ging
Bur
nt U
S
Pea
rson
Cor
rela
tion
0.
116
–0.1
00
0.04
7 –0
.079
–0
.489
–0
.482
–0
.487
–0
.134
–0
.567
0.
203
0.96
4 –0
.444
(All
US
dat
a)
Sig
. (1-
tail
ed)
1.00
0 1.
000
1.00
0 1.
000
0.00
0 0.
000
0.00
0 1.
000
0.00
0 1.
000
0.00
0 0.
000
N
13
0 40
0 13
0 40
0 13
3 13
3 13
3 88
58
87
11
97
Bur
nt N
W
Pea
rson
Cor
rela
tion
–0
.118
0.
371(a
0.
025
0.06
3 –0
.355
–0
.361
–0
.330
–0
.228
–0
.450
0.
610
0.96
7 –0
.403
(Nor
twes
t US
) S
ig. (
1-ta
iled
) 1.
000
0.00
0 1.
000
1.00
0 0.
001
0.00
1 0.
004
1.00
0 0.
015
0.00
0 0.
000
0.00
2
N
13
0 40
0 13
0 40
0 13
3 13
3 13
3 88
58
87
11
97
Bur
nt S
W
Pea
rson
Cor
rela
tion
0.
148
0.04
6 –0
.084
–0
.440
* –0
.459
–0
.426
–0
.509
–0
.001
–0
.367
0.
118
0.87
3 –0
.354
(Sou
thw
est U
S)
Sig
. (1-
tail
ed)
1.00
0 1.
000
1.00
0 0.
000
0.00
0 0.
000
0.00
0 1.
000
0.16
9 1.
000
0.01
7 0.
014
N
13
0 40
0 13
0 40
0 13
3 13
3 13
3 88
58
87
11
97
Bur
nt N
F
Pea
rson
Cor
rela
tion
–0
.312
–0
.375
–0
.108
–0
.047
–0
.213
–0
.248
–0
.134
0.
245
–0.4
83
0.51
8 0.
214
–0.2
06
(Nat
iona
l For
ests
) S
ig. (
1-ta
iled
) 0.
097
0.00
9 1.
000
1.00
0 1.
000
0.75
7 1.
000
0.91
3 0.
012
0.00
0 1.
000
1.00
0
N
91
91
91
91
87
87
87
84
51
94
10
84
a) p
rior
the
decl
ine
in �
res
corr
elat
ion
was
hig
her,
see
text
and
Fig
. 4, b
) fo
r th
e pe
riod
191
2–1
969,
c)
not i
nclu
ding
Sar
gent
's (
1884
) da
ta, d
) de
cada
l ave
rage
s, in
clud
ing
Sar
gent
's (
1884
) da
ta
147
Wallenius Major Decline in Fires in Coniferous Forests – Reconstructing the Phenomenon …
Year
1800 1850 1900 1950 2000
Aver
age
annu
ally
burn
t %
0,0
0,2
0,4
0,6
0,8
1,0
1,2
1,4
1,6
Burn
bea
ten
area
(105 x
ha)
& Lu
mbe
r exp
orts
(106 x
m3 )
0
2
4
6
8
Year
1860 1880 1900 1920 1940 1960 1980 2000
Aver
age
annu
ally
burn
t %
0
1
2
3
4
5
6Fi
re c
ontro
l cos
ts (1
08 $)
Lum
ber p
rodu
ctio
n (1
07 m3 )
0
1
2
3
4
Hum
an fa
ctor
0
1
2
3
4
50
60
70
80
90
Western USSu
mm
er p
reci
pita
tion
mm
6080
100120140160
Sum
mer
tem
pera
ture
C
22
23
24
25
Central Fennoskandia
Sum
mer
tem
pera
ture
C
14
15
16
17
18
Sum
mer
pre
cipi
tatio
n m
m
150
200
250
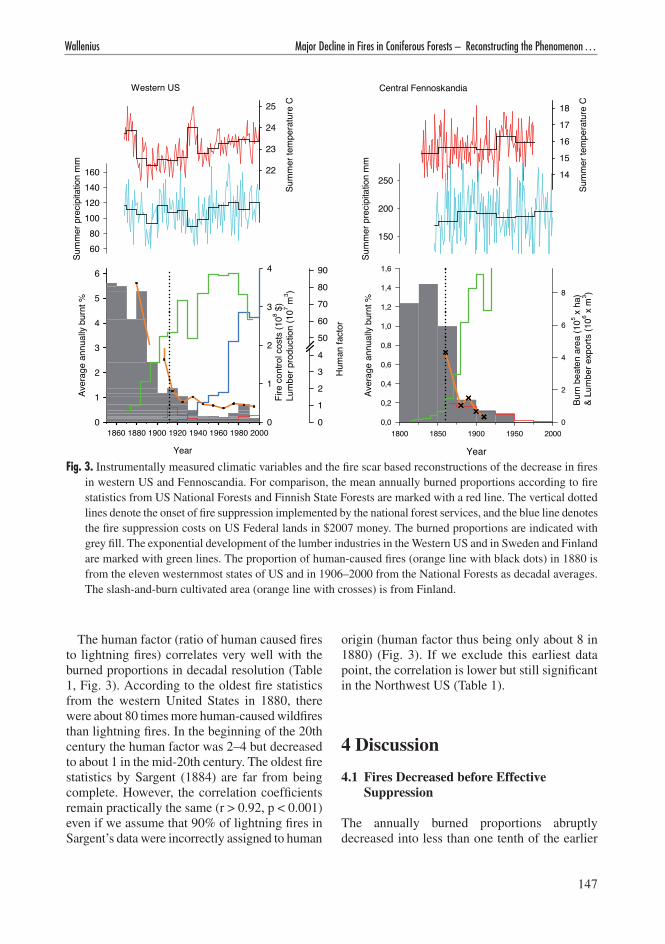
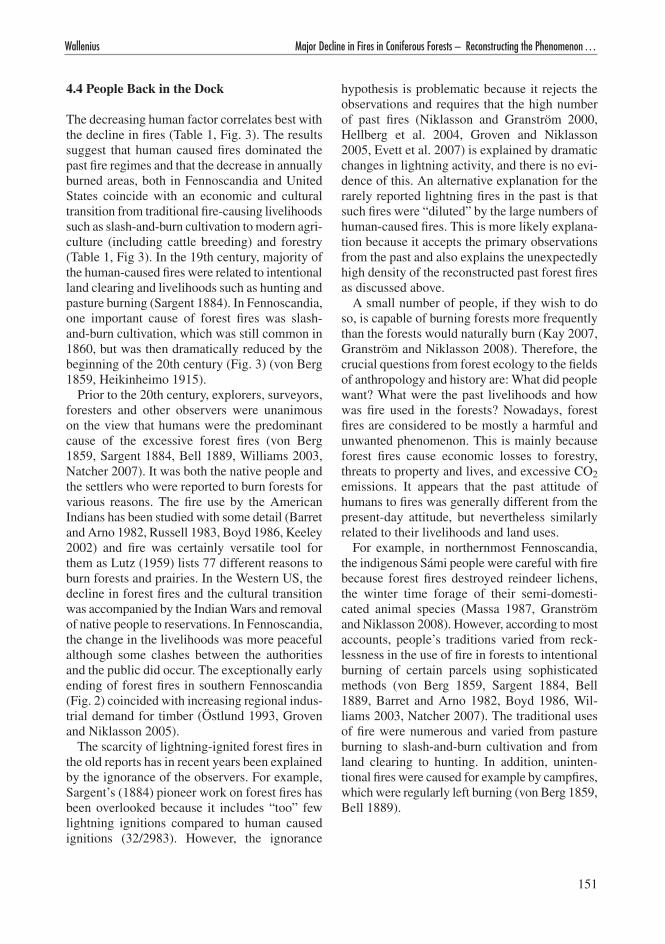
Fig. 3. Instrumentally measured climatic variables and the fire scar based reconstructions of the decrease in fires in western US and Fennoscandia. For comparison, the mean annually burned proportions according to fire statistics from US National Forests and Finnish State Forests are marked with a red line. The vertical dotted lines denote the onset of fire suppression implemented by the national forest services, and the blue line denotes the fire suppression costs on US Federal lands in $2007 money. The burned proportions are indicated with grey fill. The exponential development of the lumber industries in the Western US and in Sweden and Finland are marked with green lines. The proportion of human-caused fires (orange line with black dots) in 1880 is from the eleven westernmost states of US and in 1906–2000 from the National Forests as decadal averages. The slash-and-burn cultivated area (orange line with crosses) is from Finland.
The human factor (ratio of human caused fires to lightning fires) correlates very well with the burned proportions in decadal resolution (Table 1, Fig. 3). According to the oldest fire statistics from the western United States in 1880, there were about 80 times more human-caused wildfires than lightning fires. In the beginning of the 20th century the human factor was 2–4 but decreased to about 1 in the mid-20th century. The oldest fire statistics by Sargent (1884) are far from being complete. However, the correlation coefficients remain practically the same (r > 0.92, p < 0.001) even if we assume that 90% of lightning fires in Sargent’s data were incorrectly assigned to human
origin (human factor thus being only about 8 in 1880) (Fig. 3). If we exclude this earliest data point, the correlation is lower but still significant in the Northwest US (Table 1).
4 Discussion
4.1 Fires Decreased before Effective Suppression
The annually burned proportions abruptly decreased into less than one tenth of the earlier
148
Silva Fennica 45(1), 2011 review articles
level in all studied regions. The magnitude of the reconstructed widespread decrease in burned areas more than a century ago far exceeds the recent decades’ increase in burned areas in the Western US (Figs. 2 and 3). Fire suppression costs did not correlate with burned proportions over the whole suppression period but the correlation between the fire suppression costs and burned proportions was significant during 1912–1969 (Table 1). In
the 1970s the US Forest Service fire suppression strategy was changed from the 10 A.M. policy to ‘fire by prescription’ (Pyne et al. 1996) and that may have contributed to the recent decades’ increase in annually burned areas in the Western US which occurred despite the concurrent consid-erable increase in fire-suppression cost.
Modern fire suppression is considered to be highly effective in Fennoscandia, whereas in
0 10 20 30 400
10
20
30
40 Year < 1880
Modeled burnt %
0 10 20 30 40
Burn
t, %
Year >= 1880
Year
1600 1700 1800 1900 2000
Aver
age
annu
ally
burn
t, %
0
1
2
3
4
5
6
7
Burnt SW Modeled burnt
Southwest US
Year
1600 1700 1800 1900 2000
Annu
ally
burn
t, %
0
10
20
3040
Fitted, r = 0.80 Predicted, r = 0.72 Predicted, r = 0.32
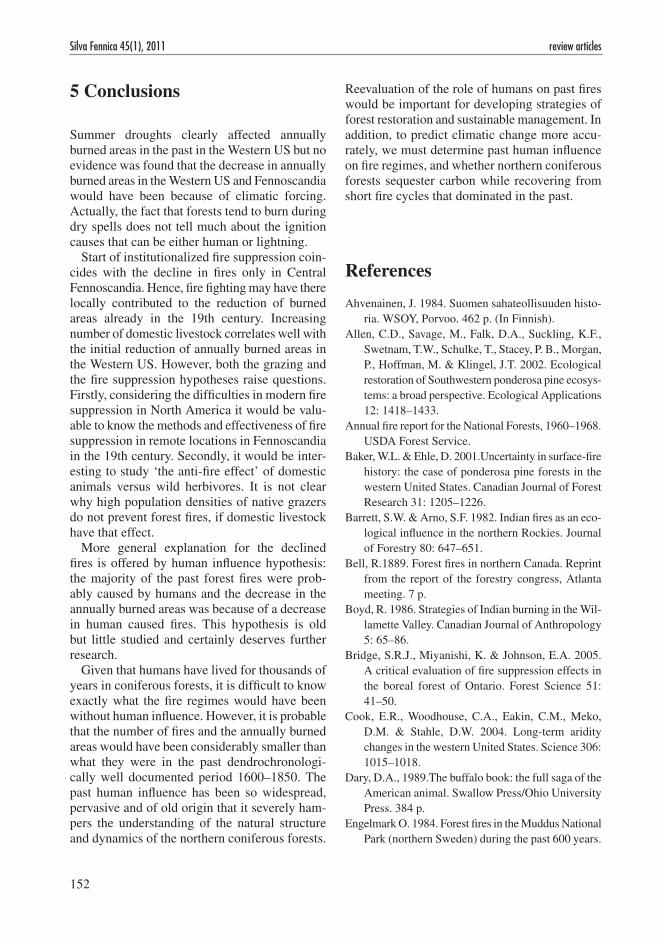
Fig. 4. Reconstructed (gray fill) and modeled (red line) annually burned proportions of study sites in the South-west US. Annually burned proportions were modelled based on the same and the previous years’ PDSIs. Data from the period 1600–1799 was used for fitting the model. The correlation between the modelled and the reconstructed burnt values was excellent until 1880. The dotted vertical line denotes the start of the fire suppression policy.
149
Wallenius Major Decline in Fires in Coniferous Forests – Reconstructing the Phenomenon …
Canada the debate is still on-going as to whether or not modern-day fire suppression is effective (Bridge et al. 2005). Even if current fire suppres-sion practices are effective, the fact that burned proportions decreased for decades before any extensive fire-suppression programs were applied undermines the hypothesis that extinguishing lightning fires was the main cause for the reduc-tion in annually burned areas more than a century ago in the Western US and southern Fennoscan-dia. It was only in central Fennoscandia that the decline in fires did not clearly precede the launch-ing of fire-suppression programs. However, it is not clear how effective fire fighting was possible in remote locations in the 19th century without motorized equipment. Nevertheless, fires ended also in regions where there were very limited resources to put out fires (Engelmark 1984, Wal-lenius et al. 2005).
4.2 Inconsistent Climate and Fire Histories
Contrary to the expectations by the climatic hypothesis, I found that the summer temperature and precipitation statistics as well as PDO and AMO do not show statistically significant cor-relation over the period when the fires decreased, and hence these do not offer a straightforward explanation for the drop in annually burned areas in the Western US and Fennoscandia (Table 1, Figs. 2 and 3). Summer drought correlated sig-nificantly with the annually burned area in the Western US, but it could not explain the dramatic decline in fires (Fig. 4). Most of the previous studies, which have proposed that climate varia-tion drives the long-term changes in fire regimes have their data limited either to the 20th century (Fauria and Johnson 2008, Girardin et al. 2009) or to the past (Kitzberger et al. 2007) and therefore they have possibly missed the dramatic decline in fires. Note, however, that in northern Canada and Siberia the decline has obviously not been as pronounced as in the Western US and Fennoscan-dia (Swetnam 1996, Larsen 1997).
The general climatic trend in the Northern Hemisphere has been warming since the begin-ning of the 17th century (Moberg et al. 2005). The warming of summers during the recent decades has been associated with the increase in fires in the Western US and the same relationship is expected to apply in future fire regimes (Flannigan et al. 2005, Westerling et al. 2006) with considerable spatial variation (Girardin et al. 2009).
The developed model explained more than half of the variance in annually burned proportions (Fig. 4). The model, which was built on drought reconstructions, predicted sharply an upper limit for the annually burned proportions but there was not any clear lower limit for the annually burned proportion. In some years the burned propor-tion remained low despite excellent conditions for fires. This suggests that amount of burning was partly limited by small number of ignitions. The good correlation in the Western US between drought (drought is expressed as negative PDSI values) and burned area can be expected from the physics of the combustion as wet fuels do not burn readily. Previous years’ droughts had a negative impact on the burned area, which makes sense because during dry years considerable propor-
Woodlands
Elk Island
Yellowstone
0
1
2
3
4
5
6
1810 1830 1850 1870 1890 1910 1930 1950Year
Num
ber o
f cat
tle p
er k
m2
FinlandBison densitySouthwestNorthwest
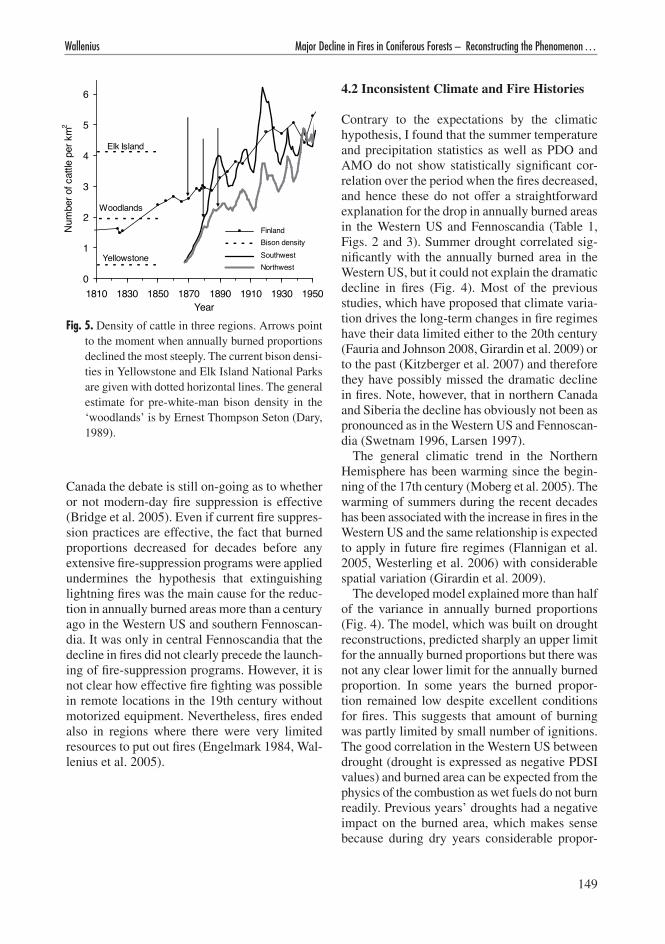
Fig. 5. Density of cattle in three regions. Arrows point to the moment when annually burned proportions declined the most steeply. The current bison densi-ties in Yellowstone and Elk Island National Parks are given with dotted horizontal lines. The general estimate for pre-white-man bison density in the ‘woodlands’ is by Ernest Thompson Seton (Dary, 1989).
150
Silva Fennica 45(1), 2011 review articles
tions (10–40%) of forests have burned (Fig. 4), but little new vegetation has been formed. How-ever, preceding wet years contribute to the growth of new fine fuels. The same is suggested by Margolis and Balmat (2009). Overall, the good fit and prediction capability of the developed model adds credence both to the annually burned area estimates and the independently reconstructed PDSI in the Southwest US.
As of the 1880s, the previously well-working model no longer correctly predicts the burned areas (Fig. 4), thus making the climatic explana-tion for the decrease in forest fires problematic in the Western US. The finding that in the past forests mainly burned during dry summers does not tell much about the predominant cause of the fires, which can be either lightning or humans. Unfortunately, the data on past lightning activity is not available. The current frequency of light-ning-ignited fires in northern coniferous forests ranges from less than one per year per 10 000 km2 in Northern Finland up to four hundred in the Southwest US (Larjavaara et al. 2005, Kay 2007).
Detailed fire-history studies in Fennoscandia have revealed that past fires have been an order of magnitude more numerous than what could be expected from the present-day frequency of lightning ignitions (Niklasson and Granström 2000, Hellberg et al. 2004, Groven and Niklas-son 2005). The only exception is that in the study by Niklasson and Granström (2000) the estimated density of fires prior the 1650s was similar to the current lightning ignition density. However, in their study the number of small fires was prob-ably underestimated due to truncated fire size distribution. In North America there is only one study of this topic from northern Mexico but the result is basically the same, i.e. much more fires in the past than could be expected based on the current lightning fire density (Evett et al. 2007). Possible explanations for the phenomenon are that there has either been a dramatic reduction in lightning-lit fires, which however lacks evidence, or a reduction in fires caused by humans (see below for further discussion).
4.3 Are Cows and Sheep the Best Firemen?
Increasing cattle densities correlated significantly with the decreasing annually burned proportions in the Western US (Table 1). Supposing that excessive grazing in the Western US caused the early decrease in burned areas there, this means that cows and sheep are more effective in prevent-ing fires than firemen because the majority of this decrease occurred prior to the onset of fire suppression (Figs. 2 and 3).
Despite the good correlation, there are a few reasons that make the grazing livestock hypoth-esis a problematic explanation for the decrease in fires. First, the grazing hypothesis is undermined by a lack of consideration for the effect of wild herbivores. It is postulated that pre-white-man bison densities were equivalent to the number of free-ranging cattle later in the same habitat (Dary 1989). Currently, there are no unregulated bison herds in the US. Nevertheless, hunted populations of bison and elk in Yellowstone and Elk Island National Park in southern Canada are high and comparable to the cattle densities in the Western US (Fig. 5). The high population densities of grazers (up to 15 elks per km2 in Yellowstone Blacktail Plateau) have certainly modified the vegetation but have not prevented extensive forest fires in the same areas (Singer and Harter 1996, Otway et al. 2007, Hood and Bayley 2008).
Secondly, and somewhat surprisingly, the cattle densities have been generally higher in the past in Finland than in the Western US (Fig. 5), but none have suggested that excessive grazing provides an explanation for the reduction in the annually burned areas in Fennoscandia. This is obviously because the forest floor vegetation in Fennoscan-dia (and also over large areas in North America) mainly consists of dwarf shrubs, mosses, and lichens. Cattle do not prefer to eat these species, which do, however, act as a fuel in the spreading of forest fires. Neither do cattle eat needle litter and coarse woody debris, which form an impor-tant part of the fuel in the Western US forests (Passovoy and Fule 2006, Keyser et al. 2008). Moreover, in Fennoscandia there has not been a similar rapid increase in the number of cattle simultaneous with the dramatic decrease in fires (Fig. 5).
151
Wallenius Major Decline in Fires in Coniferous Forests – Reconstructing the Phenomenon …
4.4 People Back in the Dock
The decreasing human factor correlates best with the decline in fires (Table 1, Fig. 3). The results suggest that human caused fires dominated the past fire regimes and that the decrease in annually burned areas, both in Fennoscandia and United States coincide with an economic and cultural transition from traditional fire-causing livelihoods such as slash-and-burn cultivation to modern agri-culture (including cattle breeding) and forestry (Table 1, Fig 3). In the 19th century, majority of the human-caused fires were related to intentional land clearing and livelihoods such as hunting and pasture burning (Sargent 1884). In Fennoscandia, one important cause of forest fires was slash-and-burn cultivation, which was still common in 1860, but was then dramatically reduced by the beginning of the 20th century (Fig. 3) (von Berg 1859, Heikinheimo 1915).
Prior to the 20th century, explorers, surveyors, foresters and other observers were unanimous on the view that humans were the predominant cause of the excessive forest fires (von Berg 1859, Sargent 1884, Bell 1889, Williams 2003, Natcher 2007). It was both the native people and the settlers who were reported to burn forests for various reasons. The fire use by the American Indians has been studied with some detail (Barret and Arno 1982, Russell 1983, Boyd 1986, Keeley 2002) and fire was certainly versatile tool for them as Lutz (1959) lists 77 different reasons to burn forests and prairies. In the Western US, the decline in forest fires and the cultural transition was accompanied by the Indian Wars and removal of native people to reservations. In Fennoscandia, the change in the livelihoods was more peaceful although some clashes between the authorities and the public did occur. The exceptionally early ending of forest fires in southern Fennoscandia (Fig. 2) coincided with increasing regional indus-trial demand for timber (Östlund 1993, Groven and Niklasson 2005).
The scarcity of lightning-ignited forest fires in the old reports has in recent years been explained by the ignorance of the observers. For example, Sargent’s (1884) pioneer work on forest fires has been overlooked because it includes “too” few lightning ignitions compared to human caused ignitions (32/2983). However, the ignorance
hypothesis is problematic because it rejects the observations and requires that the high number of past fires (Niklasson and Granström 2000, Hellberg et al. 2004, Groven and Niklasson 2005, Evett et al. 2007) is explained by dramatic changes in lightning activity, and there is no evi-dence of this. An alternative explanation for the rarely reported lightning fires in the past is that such fires were “diluted” by the large numbers of human-caused fires. This is more likely explana-tion because it accepts the primary observations from the past and also explains the unexpectedly high density of the reconstructed past forest fires as discussed above.
A small number of people, if they wish to do so, is capable of burning forests more frequently than the forests would naturally burn (Kay 2007, Granström and Niklasson 2008). Therefore, the crucial questions from forest ecology to the fields of anthropology and history are: What did people want? What were the past livelihoods and how was fire used in the forests? Nowadays, forest fires are considered to be mostly a harmful and unwanted phenomenon. This is mainly because forest fires cause economic losses to forestry, threats to property and lives, and excessive CO2 emissions. It appears that the past attitude of humans to fires was generally different from the present-day attitude, but nevertheless similarly related to their livelihoods and land uses.
For example, in northernmost Fennoscandia, the indigenous Sámi people were careful with fire because forest fires destroyed reindeer lichens, the winter time forage of their semi-domesti-cated animal species (Massa 1987, Granström and Niklasson 2008). However, according to most accounts, people’s traditions varied from reck-lessness in the use of fire in forests to intentional burning of certain parcels using sophisticated methods (von Berg 1859, Sargent 1884, Bell 1889, Barret and Arno 1982, Boyd 1986, Wil-liams 2003, Natcher 2007). The traditional uses of fire were numerous and varied from pasture burning to slash-and-burn cultivation and from land clearing to hunting. In addition, uninten-tional fires were caused for example by campfires, which were regularly left burning (von Berg 1859, Bell 1889).
152
Silva Fennica 45(1), 2011 review articles
5 Conclusions
Summer droughts clearly affected annually burned areas in the past in the Western US but no evidence was found that the decrease in annually burned areas in the Western US and Fennoscandia would have been because of climatic forcing. Actually, the fact that forests tend to burn during dry spells does not tell much about the ignition causes that can be either human or lightning.
Start of institutionalized fire suppression coin-cides with the decline in fires only in Central Fennoscandia. Hence, fire fighting may have there locally contributed to the reduction of burned areas already in the 19th century. Increasing number of domestic livestock correlates well with the initial reduction of annually burned areas in the Western US. However, both the grazing and the fire suppression hypotheses raise questions. Firstly, considering the difficulties in modern fire suppression in North America it would be valu-able to know the methods and effectiveness of fire suppression in remote locations in Fennoscandia in the 19th century. Secondly, it would be inter-esting to study ‘the anti-fire effect’ of domestic animals versus wild herbivores. It is not clear why high population densities of native grazers do not prevent forest fires, if domestic livestock have that effect.
More general explanation for the declined fires is offered by human influence hypothesis: the majority of the past forest fires were prob-ably caused by humans and the decrease in the annually burned areas was because of a decrease in human caused fires. This hypothesis is old but little studied and certainly deserves further research.
Given that humans have lived for thousands of years in coniferous forests, it is difficult to know exactly what the fire regimes would have been without human influence. However, it is probable that the number of fires and the annually burned areas would have been considerably smaller than what they were in the past dendrochronologi-cally well documented period 1600–1850. The past human influence has been so widespread, pervasive and of old origin that it severely ham-pers the understanding of the natural structure and dynamics of the northern coniferous forests.
Reevaluation of the role of humans on past fires would be important for developing strategies of forest restoration and sustainable management. In addition, to predict climatic change more accu-rately, we must determine past human influence on fire regimes, and whether northern coniferous forests sequester carbon while recovering from short fire cycles that dominated in the past.
References
Ahvenainen, J. 1984. Suomen sahateollisuuden histo-ria. WSOY, Porvoo. 462 p. (In Finnish).
Allen, C.D., Savage, M., Falk, D.A., Suckling, K.F., Swetnam, T.W., Schulke, T., Stacey, P. B., Morgan, P., Hoffman, M. & Klingel, J.T. 2002. Ecological restoration of Southwestern ponderosa pine ecosys-tems: a broad perspective. Ecological Applications 12: 1418–1433.
Annual fire report for the National Forests, 1960–1968. USDA Forest Service.
Baker, W.L. & Ehle, D. 2001.Uncertainty in surface-fire history: the case of ponderosa pine forests in the western United States. Canadian Journal of Forest Research 31: 1205–1226.
Barrett, S.W. & Arno, S.F. 1982. Indian fires as an eco-logical influence in the northern Rockies. Journal of Forestry 80: 647–651.
Bell, R.1889. Forest fires in northern Canada. Reprint from the report of the forestry congress, Atlanta meeting. 7 p.
Boyd, R. 1986. Strategies of Indian burning in the Wil-lamette Valley. Canadian Journal of Anthropology 5: 65–86.
Bridge, S.R.J., Miyanishi, K. & Johnson, E.A. 2005. A critical evaluation of fire suppression effects in the boreal forest of Ontario. Forest Science 51: 41–50.
Cook, E.R., Woodhouse, C.A., Eakin, C.M., Meko, D.M. & Stahle, D.W. 2004. Long-term aridity changes in the western United States. Science 306: 1015–1018.
Dary, D.A., 1989.The buffalo book: the full saga of the American animal. Swallow Press/Ohio University Press. 384 p.
Engelmark O. 1984. Forest fires in the Muddus National Park (northern Sweden) during the past 600 years.
153
Wallenius Major Decline in Fires in Coniferous Forests – Reconstructing the Phenomenon …
Canadian Journal of Botany 62: 893–898.Evett, R.R., Franco-Vizcaino, E. & Stephens, S.L. 2007.
Comparing modern and past fire regimes to assess changes in prehistoric lightning and anthropogenic ignitions in a Jeffrey pine-mixed conifer forest in the Sierra San Pedro Mairtir, Mexico. Canadian Journal of Forest Research 37: 318–330.
Fauria, M.M. & Johnson, E.A. 2008. Climate and wildfires in the North American boreal forest. Philosophical Transactions of the Royal Society B 363: 2317–2329.
Flannigan, M.D., Bergeron, Y., Engelmark, O. & Wotton, B.M. 1998. Future wildfire in circumbo-real forests in relation to global warming. Journal of Vegetation Science 9: 469–476.
— , Logan, K.A., Amiro, B.D., Skinner, W.R. & Stocks, B.J. 2005. Future area burned in Canada. Climate Change 72: 1–16.
Girardin, M.P., Ali, A.A., Carcaillet, C., Mudelsee, M., Drobyshev, I., Hely, C. & Bergeron, Y. 2009. Heterogeneous response of circumboreal wildfire risk to climate change since the early 1900s. Global Change Biology 15: 2751–2769.
Goldammer, J.G. & Furyaev, V.V. 1996. Fire in eco-systems of boreal Eurasia: Ecological impacts and links to global system. In: Goldammer, J.G. & Furyaev, V.V. (eds.). Fire in ecosystems of boreal Eurasia. p. 1–20.
Granström, A. & Niklasson, M. 2008. Potentials and limitations for human control over historic fire regimes in the boreal forest. Philosophical Transac-tions of the Royal Society B 363: 2353–2358.
Gray, S.T., Graumlich, L.J., Betancourt, J.L. & Ped-erson, G.T. 2004. A tree-ring based reconstruc-tion of the Atlantic Multidecadal Oscillation since 1567 AD. Geophysical Research Letters 31: L12205.12201.
Grissino-Mayer, H.D., Romme, W.H., Floyd, M.L. & Hanna, D.D. 2004. Climatic and human influences on fire regimes of the southern San Juan Mountains, Colorado, USA. Ecology 85: 1708–1724.
Groven, R. & Niklasson, M. 2005. Anthropogenic impact on past and present fire regimes in a boreal forest landscape of southeastern Norway. Canadian Journal of Forest Research 35: 2719–2726.
Heikinheimo, O. 1915. Kaskiviljelyksen vaikutus Suomen metsiin. Referat: Der Einfluss der Brand-wirtschaft auf die Wälder Finnlands. Acta Fores-talia Fennica 4. 264 p. (In Finnish). Available at https://helda.helsinki.fi/handle/1975/8408.
Heinselman, M.L. 1973. Fire in the virgin forests of the Boundary Waters Canoe Area, Minnesota. Quaternary Research: 3: 329–382.
Hellberg, E., Niklasson, M. & Granstrom, A. 2004. Influence of landscape structure on patterns of forest fires in boreal forest landscapes in Sweden. Canadian Journal of Forest Research 34: 332–338.
Heyerdahl, E.K., Brubaker, L.B. & Agee, J.K. 2001. Spatial controls of historical fire regimes: a multi-scale example from the interior west, USA. Ecol-ogy 82: 660–678.
Historical statistics of the United States, Colonial times to 1970. Bicentennial Edition. 1975. US. Bureau of Census, Washington D.C.
Hood, G.A. & Bayley, S.E. 2008. The effects of high ungulate densities on foraging choices by beaver (Castor canadensis) in the mixed-wood boreal forest. Canadian Journal of Zoology 86: 484–496.
Ilvessalo, L. & Jalava, M. 1931. Maapallon metsävarat. Summary in English: Forest resources of the World. Communicationes ex Instituto Quaestionum Fores-talium Finlandiae Editae 16(2). 407 p.
Kaplan, A., Cane, M. A., Kushnir, Y., Clement, A.C., Blumenthal, M.B. & Rajagopalan, B. 1998. Analy-ses of global sea surface temperature 1856–1991. Journal of Geophysical Research 103: 18567–18589.
Kay, C.E. 2007. Are lightning fires unnatural? A com-parison of aboriginal and lightning ignition rates in the United States. In: Masters, R.E. & Galley, K.E.M. (eds.). Proceedings of the 23rd Tall Tim-bers Fire Ecology Conference: Fire in grassland and shrubland ecosystems. Tall Timbers Research Station, Tallahassee, FL. p. 16–28.
Keeley, J.E. 2002. Native American impacts on fire regimes of the California coastal ranges. Journal of Biogeography 29: 303–320.
Keyser, T.L., Lentile, L.B., Smith, F.W. & Shepperd, W.D. 2008. Changes in forest structure after a large, mixed-severity wildfire in ponderosa pine forests of the Black Hills, South Dakota, USA. Forest Science 54: 328–338.
Kitzberger, T., Brown, P.M., Heyerdahl, E.K., Swet-nam, T.W. & Veblen, T.T. 2007. Contingent Pacific-Atlantic Ocean influence on multicentury wildfire synchrony over western North America. Proceed-ings of National Academy of Sciences U.S.A. 104: 543–548.
154
Silva Fennica 45(1), 2011 review articles
Kohh, E. 1975. Studier över skogsbränder och sken-hälla i älvdalsskogarna. Sveriges skogsvårdsför-bunds tidskrift 73: 299–336. (In Swedish).
Large fire suppression costs – strategies for cost man-agement, 2004. Strategic Issues Panel on Large Fire Costs, Wildland Fire Leadership Council.
Larjavaara, M., Kuuluvainen, T. & Rita, H. 2005. Spatial distribution of lightning-ignited forest fires in Finland. Forest Ecology and Management 208: 177–188.
Larsen, C.P.S. 1997. Spatial and temporal variations in boreal forest fire frequency in northern Alberta. Journal of Biogeography 24: 663–673.
Lehtonen, H. & Kolström, T. 2000. Forest fire history in Viena Karelia, Russia. Scandinavian Journal of Forest Research 15: 585–590.
Luterbacher, J., Dietrich, D., Xoplaki, E., Grosjean, M. & Wanner, H. 2004. European seasonal and annual temperature variability, trends, and extremes since 1500. Science 303: 1499–1503.
Lutz, H.J. 1959. Aboriginal man and white man as historical causes of fires in the boreal forest, with particular reference to Alaska. Yale University, School of Forestry, Bulletin 65. 49 p.
MacDonald, G.M. & Case, R.A., 2005. Variations in the Pacific Decadal Oscillation over the past millennium. Geophysical Research Letters: 32, L08703. doi:10.1029/2005GL022478.
Mantua, N.J., Hare, S.R., Zhang, Y., Wallace, J.M. & Francis, R.C. 1997. A Pacific interdecadal climate oscillation with impacts on salmon production. Bulletin of the American Meteorological Society 78: 1069–1079.
Margolis, E.Q. & Balmat, J. 2009. Fire history and fire–climate relationships along a fire regime gradient in the Santa Fe Municipal Watershed, NM, USA. Forest Ecology and Management 258: 2416–2430.
Marlon, J.R., Bartlein, P.J., Carcaillet, C., Gavin, D.G., Harrison, S.P., Higuera, P.E., Joos, F., Power, M.J. & Prentice, I.C. 2008. Climate and human influ-ences on global biomass burning over the past two millennia. Nature Geoscience 1: 697–702.
Massa, I. 1987. Pasture burn-clearing as a method of colonization in northern Fennoscandia. Jour-nal of the Finnish Anthropological Society 12: 235–239.
Moberg, A., Sonechkin, D.M., Holmgren, K., Dat-senko, N.M. & Karlen, W. 2005. Highly variable Northern Hemisphere temperatures reconstructed
from low- and high-resolution proxy data. Nature 433: 613–617.
Natcher, D. 2007. Historical human causes and uses of fire in Alaska. Bonanza Creek LTER. Available at: http://www.lter.uaf.edu/ascii/files/309_Historical-HumanCauses.pdf.
National forest fire report 1906–1936. 1938. USDA Forest Service.
National Forest fire report 1940–41, 1948–1959, 1969. USDA Forest Service.
Niklasson, M. & Granström, A. 2000. Numbers and sizes of fires: Long-term spatially explicit fire his-tory in a Swedish boreal landscape. Ecology 81: 1484–1499.
Osara, N.A. 1949. Kulovalkeiden esiintyminen ja niiden syyt. In: Kalela, E.K. (ed.). Suuri metsäkirja I. WSOY, Helsinki. p. 455–486. (In Finnish).
Östlund, L. 1993. Exploitation and structural changes in the north Swedish boreal forest 1800–1992. PhD-thesis, Department of Forest Vegetation Ecol-ogy, Swedish University of Agricultural Sciences, Umeå. 30 p.
Otway, S.G., Bork, E.W., Anderson, K.R. & Alexan-der, M.E. 2007. Predicting sustained smouldering combustion in trembling aspen duff in elk island national park, Canada. International Journal of Wildland Fire 16: 690–701.
Passovoy, A.D. & Fule, P.Z. 2006. Snag and woody debris dynamics following severe wildfires in northern Arizona ponderosa pine forests. Forest Ecology and Management 223: 237–246.
Pauling, A., Luterbacher, J., Casty, C. & Wanner, H. 2006. Five hundred years of gridded high-resolu-tion precipitation reconstructions over Europe and the connection to large-scale circulation. Climate Dynamics 26: 387–405.
Pyne, S.J., Andrews, P.L. & Laven, R.D. 1996. Intro-duction to wildland fire. Wiley, New York. 769 p.
Rassi, P., Kaipainen, H. & Mannerkoski, I. (eds.) 2001. Suomen lajien uhanalaisuus 2000. Ympäristömi-nisteriö & Suomen ympäristökeskus, Helsinki. 429 p. (In Finnish).
Russell, E.W.B. 1983. Indian-set fires in the forests of the northeastern United States. Ecology 64: 78–88.
Ruuttula-Vasari, A. 2004. “Herroja on epäiltävä aina – Metsäherroja yli kaiken” Metsähallituksen ja pohjoissuomalaisten kanssakäyminen kruunun-metsissä vuosina 1851–1900. Summary: “Beware of fine gentlemen – and of foresters most of all”:
155
Wallenius Major Decline in Fires in Coniferous Forests – Reconstructing the Phenomenon …
Contacts between the people of Northern Finland and the Forestry Board over administration of the crown forests in the years 1851–1900. PhD-thesis, Department of History, University of Oulu, Oulu. 327 p.
Sargent, C., 1884. Report on the forests of North Ame-rica (Exclusive of Mexico). Government Printing Office, Washington. 612 p.
Savage, M. & Swetnam, T.W. 1990. Early 19th-century fire decline following sheep pasturing in a Navajo ponderosa pine forest. Ecology 71: 2374–2378.
Singer, F.J. & Harter, M.K. 1996. Comparative effects of elk herbivory and 1988 fires on northern Yel-lowstone National Park grasslands. Ecological Applications 6: 185–199.
Skogs-styrelsens underdåniga berättelse angående Skog- och jaktväsendet i Sverige intil år 1870. 1879. Kungliga boktryckeriet, P. A. Nordsted & Söner, Stockholm. 161 p. (In Swedish).
Soininen, A.M. 1974. Vanha maataloutemme. Suomen historiallinen seura, Helsinki. (In Finnish).
Statistical yearbook of Finland 1984. 1985. Central Statistical Office of Finland, Helsinki. 521 p.
Stocks, B.J., Mason, J.A., Todd, J.B., Bosch, E.M., Wotton, B.M., Amiro, B.D., Flannigan, M.D., Hirsch, K.G., Logan, K.A., Martell, D.L. & Skin-ner, W.R. 2002. Large forest fires in Canada, 1959–1997. Journal of Geophysical Research 108: 8149. doi:10.1029/2001JD000484.
Suomen tilastollinen vuosikirja 1925. 1925. Tilastolli-nen päätoimisto, Helsinki. 328 p. (In Finnish).
Suomen tilastollinen vuosikirja 1939. 1940. Tilastolli-nen päätoimisto, Helsinki. 400 p. (In Finnish).
Swetnam, T.W. 1996. Fire and climate history in the central Yenisey Region, Siberia. In: Goldammer, J.G. & Furyaev, V.V. (eds.). Fire in ecosystems of boreal Eurasia. p. 90–104.
Wallenius, T.H., Kuuluvainen, T. & Vanha-Majamaa, I. 2004. Fire history in relation to site type and vegetation in Vienansalo wilderness in eastern Fennoscandia, Russia. Canadian Journal of Forest Research 34: 1400–1409.
— , Pitkänen, A., Kuuluvainen, T., Pennanen, J. & Karttunen, H. 2005. Fire history and forest age dis-tribution of an unmanaged Picea abies dominated landscape. Canadian Journal of Forest Research 35: 1540–1552.
Weir, J.M.H., Johnson, E.A. & Miyanishi, K. 2000. Fire frequency and the spatial age mosaic of the mixed-wood boreal forest in western Canada. Ecological Applications 10: 1162–1177.
Westerling, A.L., Hidalgo, H.G., Cayan, D.R. & Swetnam, T.W. 2006. Warming and earlier spring increase western US forest wildfire activity. Sci-ence 313: 940–943.
Whitlock, C. 2004. Land management – Forests, fires and climate. Nature 432: 28–29.
Wikars, L.-O. 2004. Brandberoende insekter – respons på tio års naturvårdsbränningar. Fauna & Flora 99: 28–34.
Williams, G.W. 2003. References on the American indian use of fire in ecosystems. USDA Forest Service, Washington, D.C.. Available at: http://www.blm.gov/heritage/docum/Fire/Bibliography %20-%20Indian%20Use%20of%20Fire.pdf.
von Berg, E. 1995/1859. Kertomus Suomenmaan met-sistä 1858. Edited reprint of the original publica-tion from the year 1859 ed. Kustannusosakeyhtiö Metsälehti, Helsinki. 92 p.
Wright, G. 2006. Lumber production, by species 1869–1996. In: Carter, S.B., Gartner, S.S., Haines, M.R., Olmstead, A.L., Sutch, R. & Wright, G. (eds.). Historical statistics of the United States, Millen-nial Edition on Line. Cambridge University Press. p. 389–390.
Year book of forest statistics 1990–1991. 1992. The Finnish Forest Research Institute, Gummerus kir-japaino Oy, Jyväskylä. 281 p.
Zackrisson, O. 1977. The influence of forest fires in the North Swedish boreal forest. Oikos 29: 22–32.
Zhang, G.F. & Chen, W.J. 2007. Fire cycle of the Canada’s boreal region and its potential response to global change. Journal of Forestry Research 18: 55–61.
Total of 81 references