Embed Size (px)
Citation preview

Innovating for growth Major Banks Analysis
November 2014
pwc.com.au/mba

2 Major Banks Analysis – November 2014
Major Banks Analysis – November 2014 3
Major banks in a minute
Current environment and performance
Operating environment
Banks performance
Outlook for the banking sector
The innovation imperative
The view from above
Eight recommendations and reflections
Detailed analysis of the results
Net interest income
Other operating income
Operating efficiency
Asset quality
Contents
04
06
11
16
4 Major Banks Analysis – November 2014
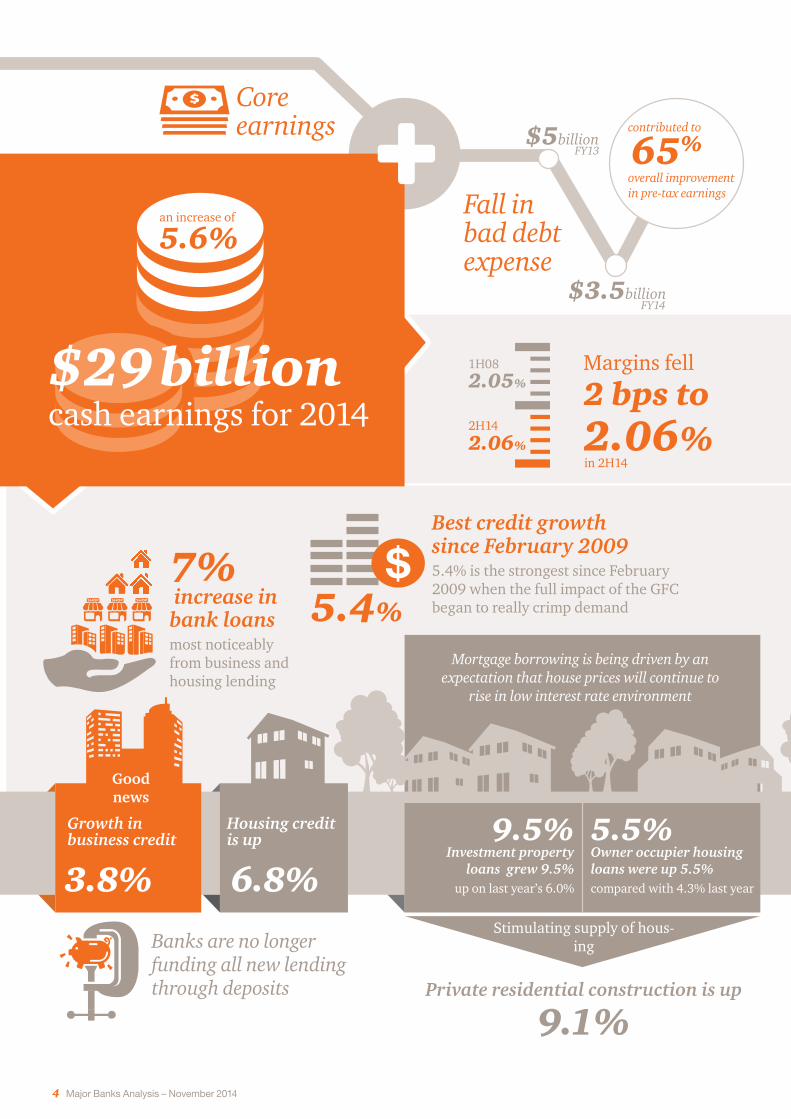
Private residential construction is up
9.1%
Investment property loans grew 9.5%
up on last year’s 6.0%
Owner occupier housing loans were up 5.5%compared with 4.3% last year
9.5% 5.5%
Mortgage borrowing is being driven by an expectation that house prices will continue to
rise in low interest rate environment
Stimulating supply of hous-ing
Growth in business credit
3.8%
Housing credit is up
6.8%
Good news
contributed to
overall improvement in pre-tax earnings
65%
Best credit growth since February 2009 5.4% is the strongest since February 2009 when the full impact of the GFC began to really crimp demand5.4%
7% increase in bank loansmost noticeably from business and housing lending
an increase of 5.6%
$29 billion cash earnings for 2014
2.05%
2.06%
1H08
2H14
2 bps to 2.06%
Margins fell
Fall in bad debt expense
$5billionFY13
FY14$3.5billion
Core earnings
Banks are no longer funding all new lending through deposits
in 2H14
Major Banks Analysis – November 2014 5
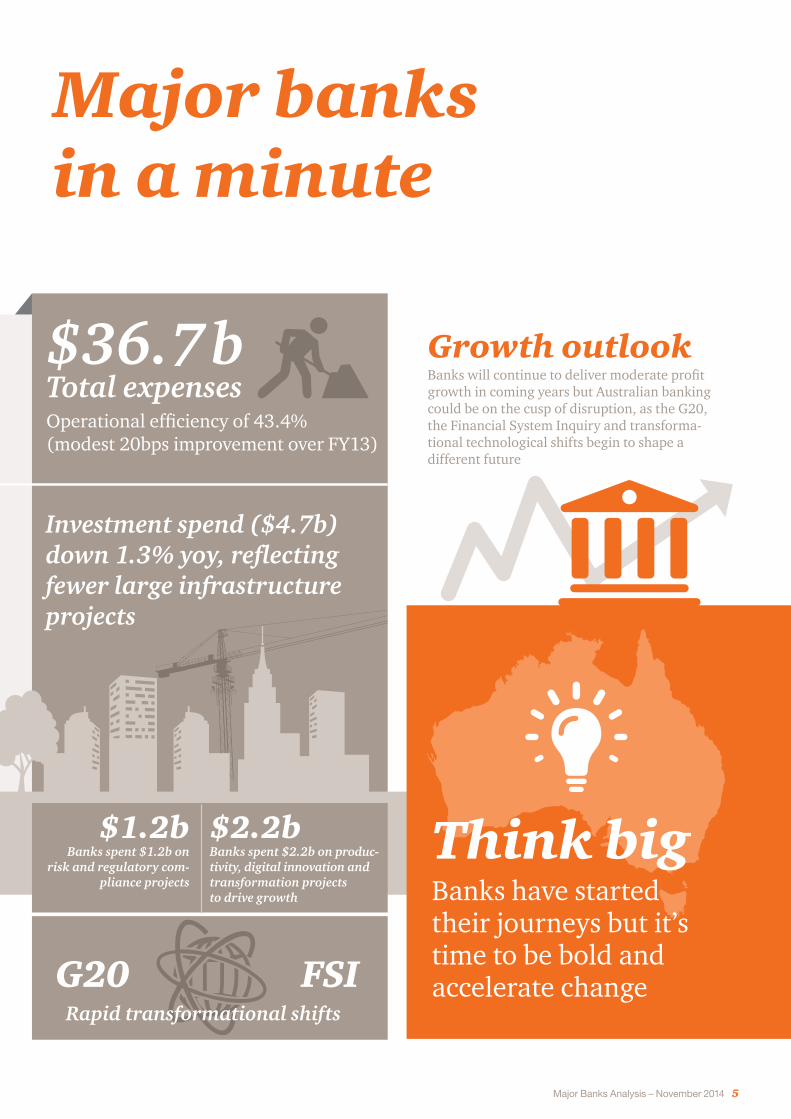
Major banks in a minute
Investment spend ($4.7b) down 1.3% yoy, reflecting fewer large infrastructure projects
Banks spent $2.2b on produc-tivity, digital innovation and transformation projects to drive growth
$2.2b$1.2bBanks spent $1.2b on
risk and regulatory com-pliance projects
Growth outlook
G20 FSIRapid transformational shifts
Banks will continue to deliver moderate profit growth in coming years but Australian banking could be on the cusp of disruption, as the G20, the Financial System Inquiry and transforma-tional technological shifts begin to shape a different future
Think bigBanks have started their journeys but it’s time to be bold and accelerate change
$36.7 b Total expenses Operational efficiency of 43.4% (modest 20bps improvement over FY13)
6 Major Banks Analysis – November 2014
Current environment and performance The Australian major banks have once again displayed remarkable collective dexterity to manage the moving parts to produce another record result.
At $28.8 billion for the full year to September 2014 (FY14), cash profits rose 5.6% year on year (yoy), notwithstanding a decline of 5.4% in the 6 months to September 2014, half on half (hoh).
The reduction in the second half reflects NAB’s additional expenses ($1.5 billion after tax) for conduct-related provisions in its UK operations and capitalised software write downs. Excluding these expenses, cash earnings for the major banks rose 10.3% (yoy) and 2.6% (hoh).
Return on equity remained steady at 15.5% for FY14, down only 10bps over the year.

Major Banks Analysis – November 2014 7
Operating environment
Impact of low interest rates
The operating environment for the banks has been very supportive for income growth because lending volumes have picked up. Bank loans and advances rose by 7.0% over the year to September, which had a material impact on the 5.9% growth in net interest income recorded over the year.
The other element of the operating environment which has assisted has been the low interest rate environment, which contributed to a material drop in the bad debt expense. This improvement in bad debt expense contributed roughly 65% of the increase in pre-tax profits.
With interest rates set to remain low for an extended period, we expect this supportive environment to persist.
The global scene
The interest rate outlook reflects below-trend economic growth globally and in Australia. The International Monetary Fund (IMF) downgraded its growth forecasts as recently as October, reflecting weaker than expected global economic activity. There are particular concerns at present in Europe, including in Germany which has been the mainstay of Europe. There are also uncertainties with regard to China, especially in relation to the interplay between the property and finance sectors.
Prior to these concerns coming to the fore in recent months, a tone of stability and relative confidence in global markets saw a significant reduction in volatility over much of the last year, leading to reduced credit spreads in international wholesale funding markets to levels not seen since prior to the GFC. This reduction in wholesale funding costs has benefited all financial providers, including the regional banks and non-bank funders, and this in turn has increased competition in lending markets.
However the recent concerns about economic conditions in Europe and, to some extent China, may be a prelude to a more sustained return of market volatility and with it increased credit spreads. Any increase in credit spreads in international wholesale funding markets will impact the cost of funds for Australian banks which are net importers of capital.
In all, we could see the RBA maintaining these very low cash rates through all of 2015, especially given recent low inflation readings.
Challenges for Australia
The Reserve Bank nonetheless has a challenging balance to achieve by encouraging growth in growth-creating activities – business investment and new housing construction – without fuelling excessive increases in asset prices. There are some early encouraging signs for business investment in as much as business credit grew by 3.8% pa for the year to September 2014 compared to just 1.0% pa for the year to September 2013. Likewise, total private residential construction is up 9.1% (year to June). The number of dwelling starts is forecast to rise nearly 10% in the calendar year 2014, the highest increase in over a decade. NSW has been a particular stand-out.
Despite this pick-up in construction, there is no doubt that a good deal of the growth in investment housing loans, growing 9.5% pa in the year to September 2014 (6.0% in the year to September 2013), is fuelling price increases for existing housing stock. A further challenge is that these trends are not uniform geographically, with investment heavily skewed to the inner cities. Regulators are watching closely and urging both borrowers and lenders to ensure they are re-assessing the risks as they are continually changing.
There are promising signs that the supportive interest rate environment is starting to stimulate economic activity.
8 Major Banks Analysis – November 2014
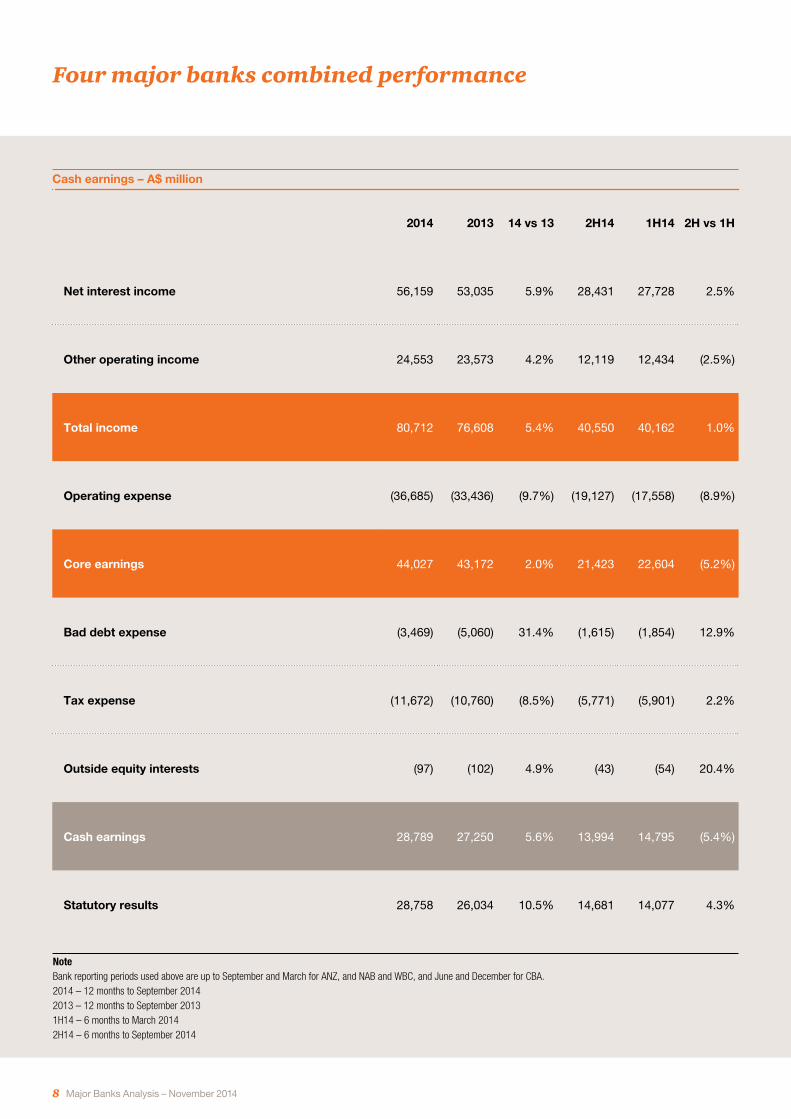
Four major banks combined performance
Cash earnings – A$ million
2014 2013 14 vs 13 2H14 1H14 2H vs 1H
Net interest income 56,159 53,035 5.9% 28,431 27,728 2.5%
Other operating income 24,553 23,573 4.2% 12,119 12,434 (2.5%)
Total income 80,712 76,608 5.4% 40,550 40,162 1.0%
Operating expense (36,685) (33,436) (9.7%) (19,127) (17,558) (8.9%)
Core earnings 44,027 43,172 2.0% 21,423 22,604 (5.2%)
Bad debt expense (3,469) (5,060) 31.4% (1,615) (1,854) 12.9%
Tax expense (11,672) (10,760) (8.5%) (5,771) (5,901) 2.2%
Outside equity interests (97) (102) 4.9% (43) (54) 20.4%
Cash earnings 28,789 27,250 5.6% 13,994 14,795 (5.4%)
Statutory results 28,758 26,034 10.5% 14,681 14,077 4.3%
Note Bank reporting periods used above are up to September and March for ANZ, and NAB and WBC, and June and December for CBA. 2014 – 12 months to September 2014 2013 – 12 months to September 2013 1H14 – 6 months to March 2014 2H14 – 6 months to September 2014
Major Banks Analysis – November 2014 9
Banks performance The banks combined performance is a reflection of their ability to respond and adapt to the economic conditions in which they operate, at least so long as those conditions remain relatively benign. The 5.6% increase in profits yoy, to $28.8 billion, was driven by modest growth in core earnings and continuing reductions in bad debt expenses. The fall in bad debt expenses contributed $1.6 billion, or 65% of the overall improvement in pre-tax profits over the year, emphasising the positive impact of low interest rates.
Core earnings rose 2.0% yoy, and in fact were marginally negative (-5.2%) in the second half compared to the first half.
However, this weakness in the second half reflected conduct related provisions and software write downs taken by NAB which amounted to $1.7 billion (before tax). If we look through these provisions and write downs, core earnings were unchanged in the second half compared to the first half.
Within core earnings, the revenue contribution was quite strong:
• Increased demand for lending across the board and only moderate margin compression lead to a respectable increase in net interest revenue which grew 5.9% yoy (2.5% hoh).
• Wealth management also delivered reasonable growth, up 9.6% yoy (3.2% hoh) off the back of strong equity markets.
• The lack of volatility in financial markets led to less demand for risk management products and lower levels of trading income, particularly in the second half.
Expenses grew faster than inflation due to the increase in salaries particularly in the year to March 2014, and NAB’s conduct related provisions and softwares write downs in the second half.
10 Major Banks Analysis – November 2014
Outlook for the banking sector There is little doubt that the banks will continue to deliver profit growth in coming years, but it is clear that the outcomes from important events such as the Financial System Inquiry (FSI) and the G20 in Brisbane will be influential in defining the environment within which those profits will be realised.
Financial System Inquiry
The FSI has placed emphasis on financial system stability – a particular concern being insulating the taxpayer should a bank fail. Market analysis, including by PwC, has demonstrated that the Australian major banks are well capitalised by international standards and so helped to shift the debate towards growth as well as stability and retirement income issues. Nonetheless, we expect stability issues to feature prominently in the FSI’s final report due later this month.
We also expect the report to have a focus on positioning the financial system for technology change, innovation and growth. We see this as a welcome addition to the range of issues currently under the microscope. The pace of technological change and data-enabled innovation in financial services offerings is only expected to intensify in coming years. FSI recommendations that focus on ensuring we have a financial system that is both innovative and safe will pay dividends for the whole economy in the long run.
G20 – Brisbane
The upcoming G20 leaders’ meeting also has growth as a central theme. After many years focusing on fixing the problems of the past, the leaders are expected to ratify recommendations to finalise financial stability frameworks including adjustments to risk weighted asset measures for banks, but more importantly turn their attention to growth and commit to actions aimed at lifting real economic activity.
The promise of more open international trade arrangements and global investment will benefit an open economy such as Australia. Financial services providers, including banks, have for some time been positioning to participate in a more global economy through investments in Asia, and Asian companies have been investing in Australia. Government policy must keep pace with the changing environment to ensure Australia keeps pace with its regional neighbours.
Looking ahead
Taking all the challenges and changes into account, we expect the banking sector to continue to produce positive results in coming periods. The litmus test for the companies within it will be how they innovate and respond to disruptors who are already focusing on gaining a share of those returns.
The PwC Banking Guage predictions are similar to our outlook. This year the PwC Guage predicts the four major Australian banks will deliver cash earnings growth of 9.2% in FY15 and 4.8% in FY16.
Note: The PwC Banking gauge is a consensus view of the cash earnings growth across four leading banking analysts – Brian Johnson (CLSA), James Ellis (Credit Suisse), Jonathan Mott (UBS), and Scott Manning (JP Morgan).
Major Banks Analysis – November 2014 11
The innovation imperative The rapid pace of change in technology and its adoption is fundamentally altering the entire value chain – from what arouses customer interest in the first place to how the completed sale is paid for and settled.
Innovation and disruption are not new topics. However, what is new are the immediacy and the magnitude with which they have hit the Australian banking system between the eyes in 2014.
Technological change has been an integral component of the banking landscape for many decades, but when we draw all the lines together, 2014 is the year that there has been awakening in the banking system to the change required to leap into a new future.
At least four observations can be made about the Australian banking industry:
1. The publicly-available evidence of disruption is becoming clearer and clearer – everything from the launch of Apple Pay to the rise of peer-to-peer lenders such as SocietyOne.
2. It is also becoming clearer as banks stare into the declining effectiveness of traditional marketing and research and become frustrated by suppliers and external advisers trying to protect traditional business models.
3. Boards have become much more convinced of the need for decisive action.
4. Evidence of cultural weaknesses in traditional businesses, such as financial planning have been apparent, thus encouraging ‘root and branch’ reviews of business models and risk control systems that inevitably put the focus squarely in the domain of digital and data analytics.
To give one simple data point, three of the four major banks now have dedicated innovation centres run by specialist teams who tap rest-of-bank expertise. A year ago none of the banks had such centres. This shift is further highlighted by the change in emphasis for investment spending. In previous years spending has been focused on major infrastructure improvements, this year it has been re-directed towards productivity, digital and innovation initiatives.
The huge external trends buffeting finance are not daunting, but exciting.
12 Major Banks Analysis – November 2014
The view from above
Banking todayTo set the baseline, the Australian major banks’ return on equity continues in the 15% plus range, a strong indicator that they continue to perform well. The focus is on efficiency and customer experience with recognition that innovation and digital need to be high on the agenda.
For efficiency, the actions are product simplification, large scale transformation programs and right sizing of support staff and branch mixes, to name a few.
For customer experience, the focus includes real-time customer and social sentiment monitoring, greater
prominence placed on net promoter scores, in branch concierge and flagship stores, channel migration to self-serve platforms available 24x7, and much deeper analytics applied to all.
The need to innovate and deliver a consistent and seamless customer experience in an increasingly digitised world has transpired into new innovation roles and innovation centres, social media presence and monitoring, internal idea platforms, the move to digital channels for service and marketing, a range of mobile services and apps, early stage seed funding and surface level start up engagement.
The world outside banking Outside the banking lens, the world is changing at a significantly more accelerated pace than the banking sector reflects.
DisruptionDisruption is occurring outside the banking industry at a rapid pace. In areas such as payments global players such as Google Wallet, Apple Pay, Square and Amazon are having a significant impact. Locally, we have seen the emergence of Fin Techs and startups such as P2P lender SocietyOne, payment provider Tryo Payments and foreign exchange platform provider OzForex. Disruption brings a validation for banks to disrupt themselves or defend the value.
Disrupting oneself can bring benefits of cost reduction in using the platforms and partners of highest value. For example, cloud services or startups providing non-core services like security and video ATMs. Disruption also brings the opportunity for banks to leverage other ecosystems or create their own, much like eBay which does not compete with bricks and mortar retailers but gives them another channel by listing on eBay. One of our banks could enable a peer to peer payment service for Facebook users to use globally.
Facebook drives a significant amount of mobile app downloads that banks can embrace to drive their businesses. Thirteen million people in Australia engage with Facebook every month and 11 million engage each day. The majority of bank customers and prospects return to the platform 14 times per day on average. This immense engagement provides a canvas for the banks to efficiently connect with all of these people to drive results.
Consider the objective of increasing the average product per customer. Then consider the fact that a very high proportion of bank customers are looking at Facebook on a smartphone 14 times per day on average. This may provide the single most effective opportunity to connect customer data with the Facebook audience to drive an increase in product adoption and share of wallet.
Major Banks Analysis – November 2014 13
Consumer behaviourEnabled by a range of mobile, location and cloud trends, customer behaviours are characterised by choice, value, peer recommendations and transparency. Addressing changing customer behaviours and demographics presents banks with a whole new set of growth
opportunities around customer experience and relevance. Using these trends to link lending, payments and wealth by being part of the messaging, searching or changing life stage banking, could form a new context for bank customers.
DataData and processing power is widely available to developer communities through open application programme interfaces (APIs) and the commercialisation of data. These are powering analytics to predict and prescribe meaningful new insights at vastly reduced costs. As an example, five years ago it would take $100,000 and one year to decode the human genome, compared with today’s $1,000 and one day to arrive at the same result.
Leveraging data has new customer experience and revenue growth potential in terms of both automating and customising offers to a new level of personalisation, commercialising new value. Using data to reduce the cost of cyber fraud is another area where we are seeing innovation. However, as a recent PwC report Deciding with Data put it, in 2013 Australia left $48 billion on the table in potential value- add to the economy from data-driven innovation.
Fin Tech Now the largest growth sector of the venture capital market, with markets in the US, Singapore and London as well as Australia, leading the world with innovative initiatives, communities, investment and policy. Investing with more purpose and diversification in Fin Tech has the benefit of increasing both innovation and performance for Australian banks, and more profoundly stimulating the Australian economy.
In Singapore, the government is targeting UK and US Fin Techs to come to Singapore as a gateway to Asia. In the UK, the government has launched a new trade body for Fin Techs called Innovate Finance.
For Australian banks, the driver is less about competition and differentiation in the Australian market and more about a springboard from which to leverage their strong performance record to provide new technology globally.
Example of innovation in lending and investmentSocietyOne is disrupting the personal and small business lending ecosystem by reducing information asymmetry between borrowers and investors. Changes in privacy rules has made far more credit data available. By linking with Veda to access customer credit scores and processing a whole lot of personal financial information SocietyOne offers borrowers credit risk adjusted interest rates which are reflective of their individual risk. Similarly the risk assessment enables investors to take specific risks according to their risk appetite.
If banks continue today’s trajectory they will be focusing on efficiency, simplification and digital to enhance customer experience. If banks capitalise on the more pervasive consumer and societal changes, leveraging data and use Fin Techs as a spring board into entirely new opportunities, they have a very positive and optimistic time ahead through accelerating innovation, improving efficiency and generating growth for Australia.

14 Major Banks Analysis – November 2014
Eight recommendations and reflections for banking innovation
Unify and focusComplete an innovation audit and develop an innovation strategy that delivers on the business vision. Most importantly, establish central metrics that capture vision, initiatives, progress and outcomes. Currently, very few organisations measure innovation in terms of goals and results. Include both leading indicators to track initiatives, partnerships, ideas, prototypes and brand perception, and lagging indicators to track time to market, new products, new customers, new partnerships, launched services and revenue generated.
Disrupt yourself (and outside in)As Steve Jobs famously told Rupert Murdoch, “If you don’t, we will”. Establish mechanisms to ensure options are available and considered for using or bypassing in-house systems as answers to every question. Have two teams advocate for one option each. Invite third parties to be a partner in innovation. Position two scenarios to the board or leadership team. Consistency and control in platforms is a differentiator – and it’s also likely there are points in time, or scenarios, where more innovative, faster to market, higher customer experiences and low cost options exist so at least consider the option.
Innovation and customer experience are not the sameBeing innovative and delivering a great experience are not the same. Exclusive clubs, lounges and restaurants have great customer experience with low innovation and revenue growth. Highly innovative organisations targeting new revenues though customer experience is not always the focus of innovation. For example the tetra pack, Wi-Fi as a technology or a business to business provider like IBM.
Fin Tech and startupsIdentify startups in non-core business areas to partner with, to increase innovation as part of customers’ experience. Examples include biometric security, beacons, video chat, accessibility options and video billing, to name a few. Keep a close watch on Fin Techs, monitor emerging technologies, consider who to partner with, invest in, procure, allow your smartest people temporary leave to pursue Fin Techs and startups, and stimulate Australia’s economy and relevance on a global scale.
1
3
2
4
The road ahead The one steadfast requirement is to have an organisation fit to continuously innovate. There is no silver bullet. Here are a few requirements:
• Alignment of vision, strategy and measurement metrics at a leadership level
• Comprehensive communication, adequate investment and M&A activity, appropriate talent and aligned rewards, open data and analytics at an organisation level
• Co-creation with partners, developers and the community
• Use of feedback, customer empathy and prototyping
• Engage and leverage startups and adjacent markets.
Major Banks Analysis – November 2014 15
EcosystemGoogle, Apple, Facebook, eBay, Amazon, PayPal, Uber, AirBnB, etsy, Samsung, all have one core similarity without which they would be a fraction of their success. They develop and enable ecosystems and look for ways millions of people can participate in using, circulating, contributing and customising. These innovators don’t own the entire ecosystem rather enable and provide value to it. Look for ways to create ecosystems that partners, competitors, developers and consumers can contribute to and find value in. And if not, capitalise on the network effects of other services to introduce value.
EmployeesAttracting a talented and diverse workforce may become increasingly challenging as 75% of the fastest growing occupations will require skills drawn from the science, technology, engineering and maths disciplines. Only 16% of Australian tertiary students are studying these subjects to day and less than 16% of these are women. Three recommendations to deal with this challenge:
• Provide all employees with tools and techniques in design thinking and innovation to stimulate new thinking and a common language for doing so
• Recruit and reward people based on the ability to think deeply and laterally
• Share innovative outcomes and success stories to accelerate brand awareness and attract and inspire changes.
Portfolio theoryConsidering the different horizons of time, risk and magnitude, create a portfolio of initiatives that address both near term incremental changes, extending to more radical, ‘10x’ innovation in terms of both ambition and delivery. Then ask “what will stop this happening”?
Simplifying products and services may require as many decisions around what to cease doing, how to transition services and how to resolve competing priorities, as innovating new products and services.
Think bigLook outside the traditional competitors in global banking, for growth and inspiration in keeping with your business vision. Consider if or how you are relevant to societal trends in terms of employment, education, health, aged care, sustainability, public safety and globalisation. Consider how technologies and digital are providing opportunities for example 3D printing, augmented reality, identity and payments.
Australian Banks with the right strategy and ways of working, have the opportunity to lead Australia and the world in financial services offerings, customer experience and technology. The greater risk is not to accelerate change and innovation beyond the level we see today. It’s encouraging to see the changes taking place today around innovation and customer experience in banking. We’re looking forward to the next 12 to 24 months of unprecedented speed of change, courage, growth and innovation in meeting customer needs.
5
7
6
8
16 Major Banks Analysis – November 2014
Net interest income
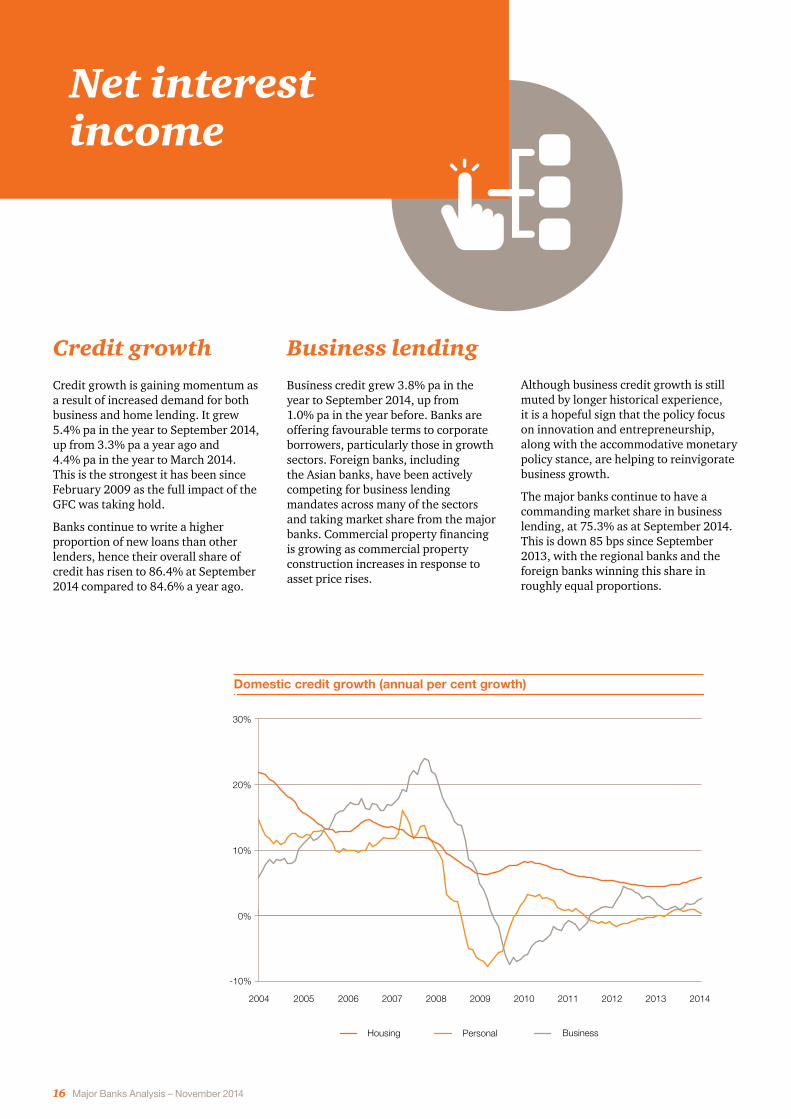
Credit growthCredit growth is gaining momentum as a result of increased demand for both business and home lending. It grew 5.4% pa in the year to September 2014, up from 3.3% pa a year ago and 4.4% pa in the year to March 2014. This is the strongest it has been since February 2009 as the full impact of the GFC was taking hold.
Banks continue to write a higher proportion of new loans than other lenders, hence their overall share of credit has risen to 86.4% at September 2014 compared to 84.6% a year ago.
Business lendingBusiness credit grew 3.8% pa in the year to September 2014, up from 1.0% pa in the year before. Banks are offering favourable terms to corporate borrowers, particularly those in growth sectors. Foreign banks, including the Asian banks, have been actively competing for business lending mandates across many of the sectors and taking market share from the major banks. Commercial property financing is growing as commercial property construction increases in response to asset price rises.
Although business credit growth is still muted by longer historical experience, it is a hopeful sign that the policy focus on innovation and entrepreneurship, along with the accommodative monetary policy stance, are helping to reinvigorate business growth.
The major banks continue to have a commanding market share in business lending, at 75.3% as at September 2014. This is down 85 bps since September 2013, with the regional banks and the foreign banks winning this share in roughly equal proportions.
-10%
0%
10%
20%
30%
BusinessPersonalHousing
20142013201220112010200920082007200620052004
Domestic credit growth (Annual per cent growth)Domestic credit growth (annual per cent growth)
Major Banks Analysis – November 2014 17
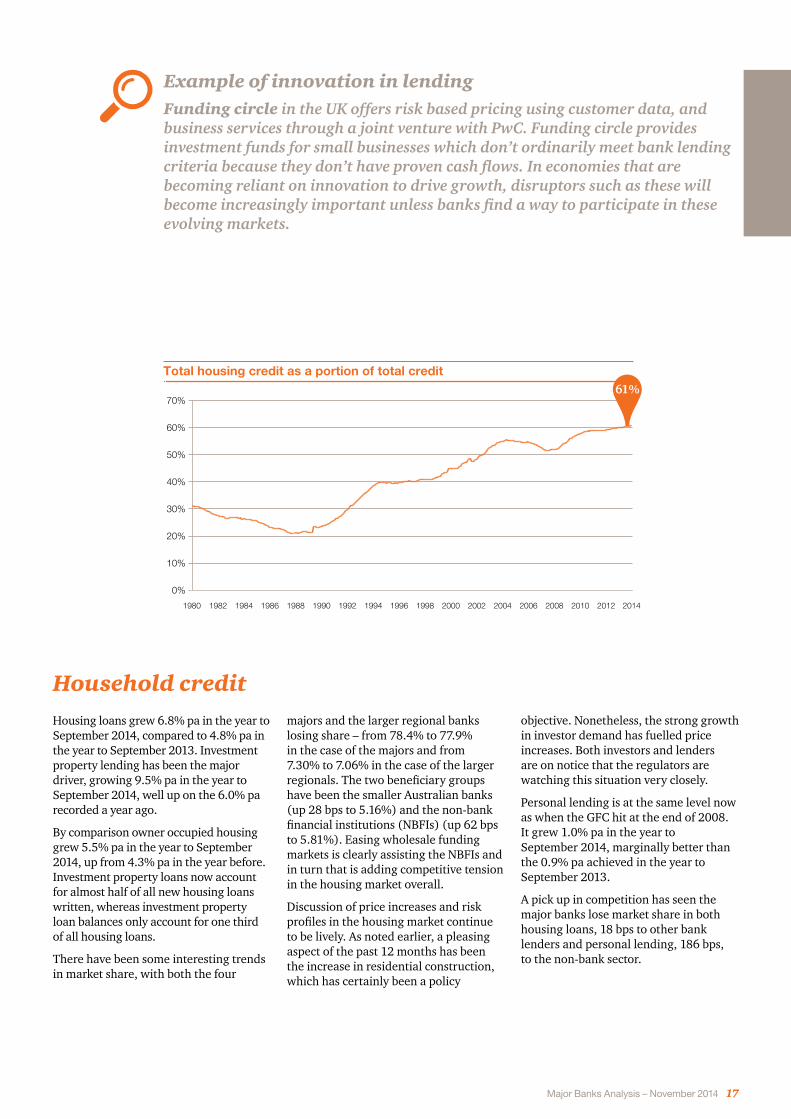
Example of innovation in lendingFunding circle in the UK offers risk based pricing using customer data, and business services through a joint venture with PwC. Funding circle provides investment funds for small businesses which don’t ordinarily meet bank lending criteria because they don’t have proven cash flows. In economies that are becoming reliant on innovation to drive growth, disruptors such as these will become increasingly important unless banks find a way to participate in these evolving markets.
Household creditHousing loans grew 6.8% pa in the year to September 2014, compared to 4.8% pa in the year to September 2013. Investment property lending has been the major driver, growing 9.5% pa in the year to September 2014, well up on the 6.0% pa recorded a year ago.
By comparison owner occupied housing grew 5.5% pa in the year to September 2014, up from 4.3% pa in the year before. Investment property loans now account for almost half of all new housing loans written, whereas investment property loan balances only account for one third of all housing loans.
There have been some interesting trends in market share, with both the four
majors and the larger regional banks losing share – from 78.4% to 77.9% in the case of the majors and from 7.30% to 7.06% in the case of the larger regionals. The two beneficiary groups have been the smaller Australian banks (up 28 bps to 5.16%) and the non-bank financial institutions (NBFIs) (up 62 bps to 5.81%). Easing wholesale funding markets is clearly assisting the NBFIs and in turn that is adding competitive tension in the housing market overall.
Discussion of price increases and risk profiles in the housing market continue to be lively. As noted earlier, a pleasing aspect of the past 12 months has been the increase in residential construction, which has certainly been a policy
objective. Nonetheless, the strong growth in investor demand has fuelled price increases. Both investors and lenders are on notice that the regulators are watching this situation very closely.
Personal lending is at the same level now as when the GFC hit at the end of 2008. It grew 1.0% pa in the year to September 2014, marginally better than the 0.9% pa achieved in the year to September 2013.
A pick up in competition has seen the major banks lose market share in both housing loans, 18 bps to other bank lenders and personal lending, 186 bps, to the non-bank sector.
Total housing credit as a proportion of total credit
0%
10%
20%
30%
40%
50%
60%
70%
201420122010200820062004200220001998199619941992199019881986198419821980
Total housing credit as a portion of total credit61%

18 Major Banks Analysis – November 2014
Deposits and wholesale funding
Bank depositsBank deposit growth has continued to weaken, finishing the year to September 2014 at 7.1% pa, down from 7.6% pa a year ago but a little stronger than the 6.9% pa for the year to March 2014. This is reflective of a number of factors:
• Low interest rates and new liquidity rules making yields unattractive on corporate and institutional deposits
• Savers looking for alternative, higher yielding assets to invest in – a stronger equity market has been key here for confidence
• Ongoing pressures on business and household balance sheets.
Household deposits
Household deposits grew 8.1% pa to September 2014, the same rate as the previous year but weaker than the 9.3% pa at March 2014. However, it remains well within our longer term growth expectations of 7% – 10%.
Business deposit
Business deposit growth remained weak at 3.6% pa to September 2014, the same as a year ago and below the 4.1% pa at March 2014. This reflects prevailing business conditions which remain challenging.
Superannuation deposits
Superannuation deposits have continued to slow, down to 7.9% pa to June 2014 (the latest figures available) from 10.5% pa a year earlier. Representing almost 18% of total bank deposits, they remain an important source of deposits to the banking system.
Composition of bank deposits (A$b)
0
300
600
900
1,200
1,500
Super DepositsBusiness DepositsHousehold Deposits
Sep-14Sep-13Sep-12Sep-11Sep-10Sep-09Sep-08Sep-07Sep-06Sep-05Sep-04
Composition of bank deposits (A$bn)
A$b
Major Banks Analysis – November 2014 19
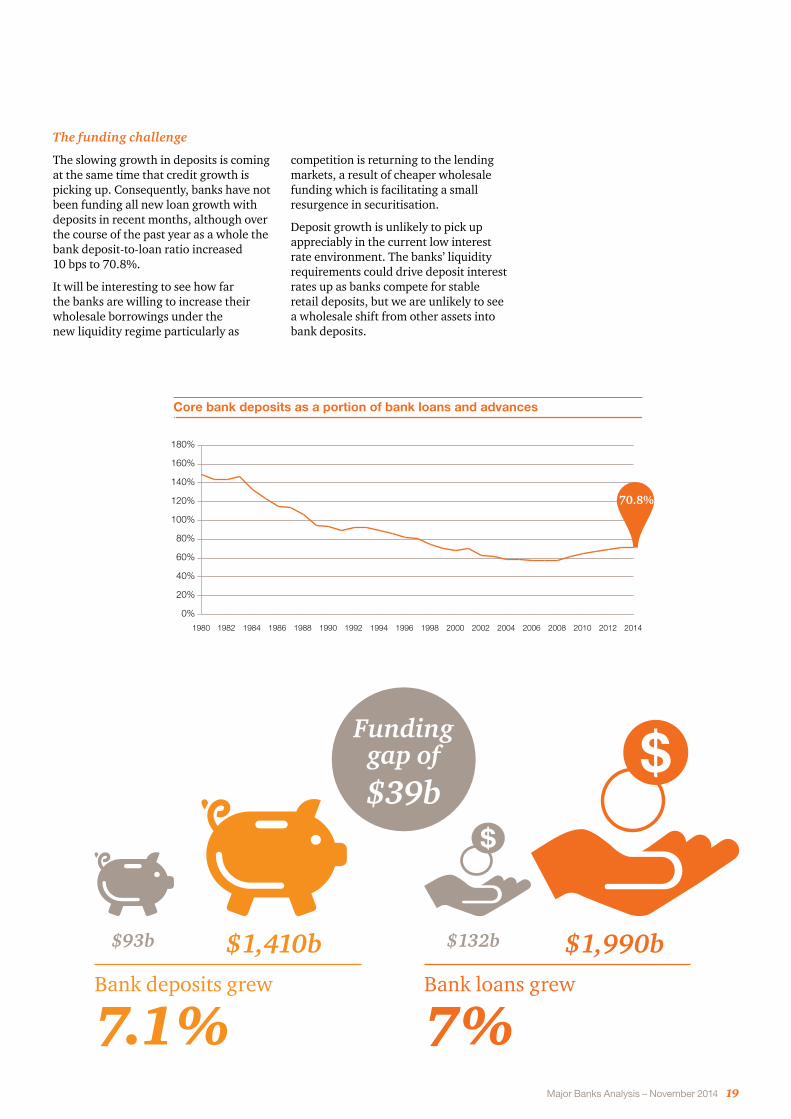
Core bank deposits as a portion of bank loans and advancesCore bank deposits as a proportion of bank loans and advances
0%
20%
40%
60%
80%
100%
120%
140%
160%
180%
201420122010200820062004200220001998199619941992199019881986198419821980
The funding challenge
The slowing growth in deposits is coming at the same time that credit growth is picking up. Consequently, banks have not been funding all new loan growth with deposits in recent months, although over the course of the past year as a whole the bank deposit-to-loan ratio increased 10 bps to 70.8%.
It will be interesting to see how far the banks are willing to increase their wholesale borrowings under the new liquidity regime particularly as
competition is returning to the lending markets, a result of cheaper wholesale funding which is facilitating a small resurgence in securitisation.
Deposit growth is unlikely to pick up appreciably in the current low interest rate environment. The banks’ liquidity requirements could drive deposit interest rates up as banks compete for stable retail deposits, but we are unlikely to see a wholesale shift from other assets into bank deposits.
70.8%
$93b $132b$1,410b $1,990bBank deposits grew
7.1%Bank loans grew
7%
Fundinggap of $39b
20 Major Banks Analysis – November 2014
Net interest margin
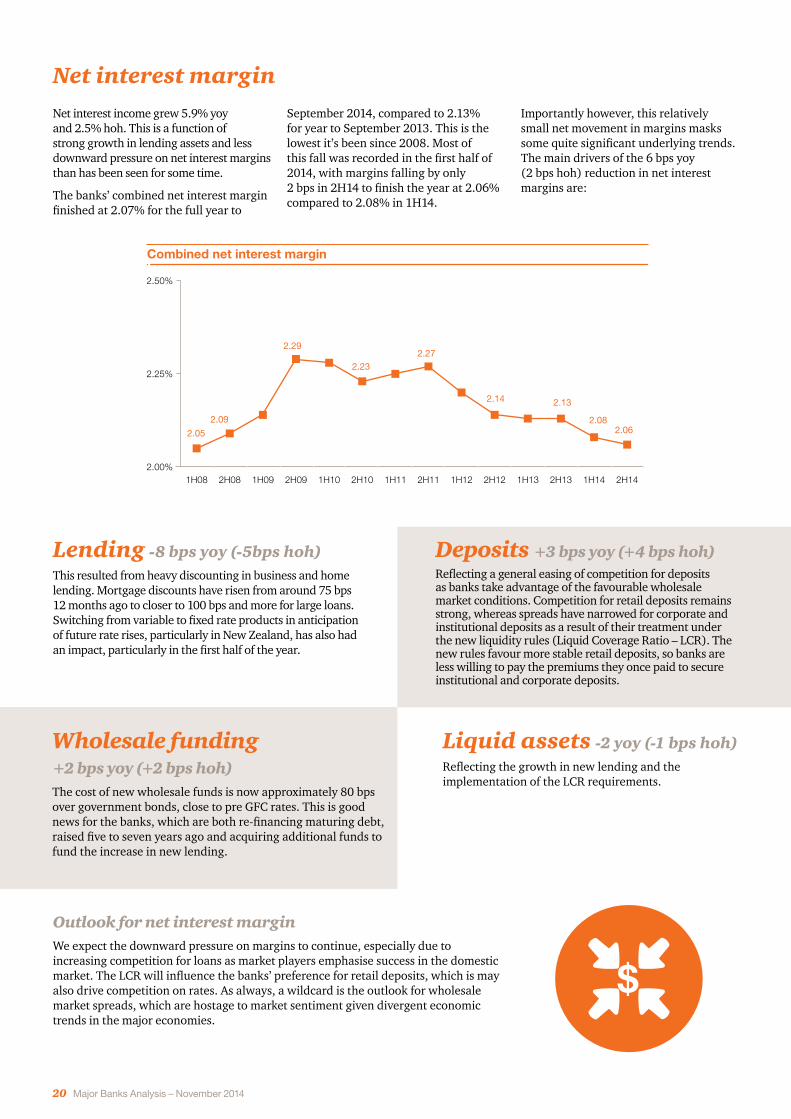
Combined net interest margin
2.00%
2.25%
2.50%
2H141H142H131H132H121H122H111H112H101H102H091H092H081H08
2.05
2.09
2.29
2.232.27
2.14 2.13
2.082.06
Combined net interest margin
Net interest income grew 5.9% yoy and 2.5% hoh. This is a function of strong growth in lending assets and less downward pressure on net interest margins than has been seen for some time.
The banks’ combined net interest margin finished at 2.07% for the full year to
September 2014, compared to 2.13% for year to September 2013. This is the lowest it’s been since 2008. Most of this fall was recorded in the first half of 2014, with margins falling by only 2 bps in 2H14 to finish the year at 2.06% compared to 2.08% in 1H14.
Importantly however, this relatively small net movement in margins masks some quite significant underlying trends. The main drivers of the 6 bps yoy (2 bps hoh) reduction in net interest margins are:
Liquid assets -2 yoy (-1 bps hoh)Reflecting the growth in new lending and the implementation of the LCR requirements.
Deposits +3 bps yoy (+4 bps hoh) Reflecting a general easing of competition for deposits as banks take advantage of the favourable wholesale market conditions. Competition for retail deposits remains strong, whereas spreads have narrowed for corporate and institutional deposits as a result of their treatment under the new liquidity rules (Liquid Coverage Ratio – LCR). The new rules favour more stable retail deposits, so banks are less willing to pay the premiums they once paid to secure institutional and corporate deposits.
Wholesale funding +2 bps yoy (+2 bps hoh)The cost of new wholesale funds is now approximately 80 bps over government bonds, close to pre GFC rates. This is good news for the banks, which are both re-financing maturing debt, raised five to seven years ago and acquiring additional funds to fund the increase in new lending.
Lending -8 bps yoy (-5bps hoh) This resulted from heavy discounting in business and home lending. Mortgage discounts have risen from around 75 bps 12 months ago to closer to 100 bps and more for large loans. Switching from variable to fixed rate products in anticipation of future rate rises, particularly in New Zealand, has also had an impact, particularly in the first half of the year.
Outlook for net interest margin We expect the downward pressure on margins to continue, especially due to increasing competition for loans as market players emphasise success in the domestic market. The LCR will influence the banks’ preference for retail deposits, which is may also drive competition on rates. As always, a wildcard is the outlook for wholesale market spreads, which are hostage to market sentiment given divergent economic trends in the major economies.
Major Banks Analysis – November 2014 21
0
2
4
6
8
10
12
14
Trading Income Wealth Management Banking fees
2H14 1H14 2H13 1H13 2H12 1H12 2H11 1H11 2H10 1H10 2H09 1H09 2H08
A$b
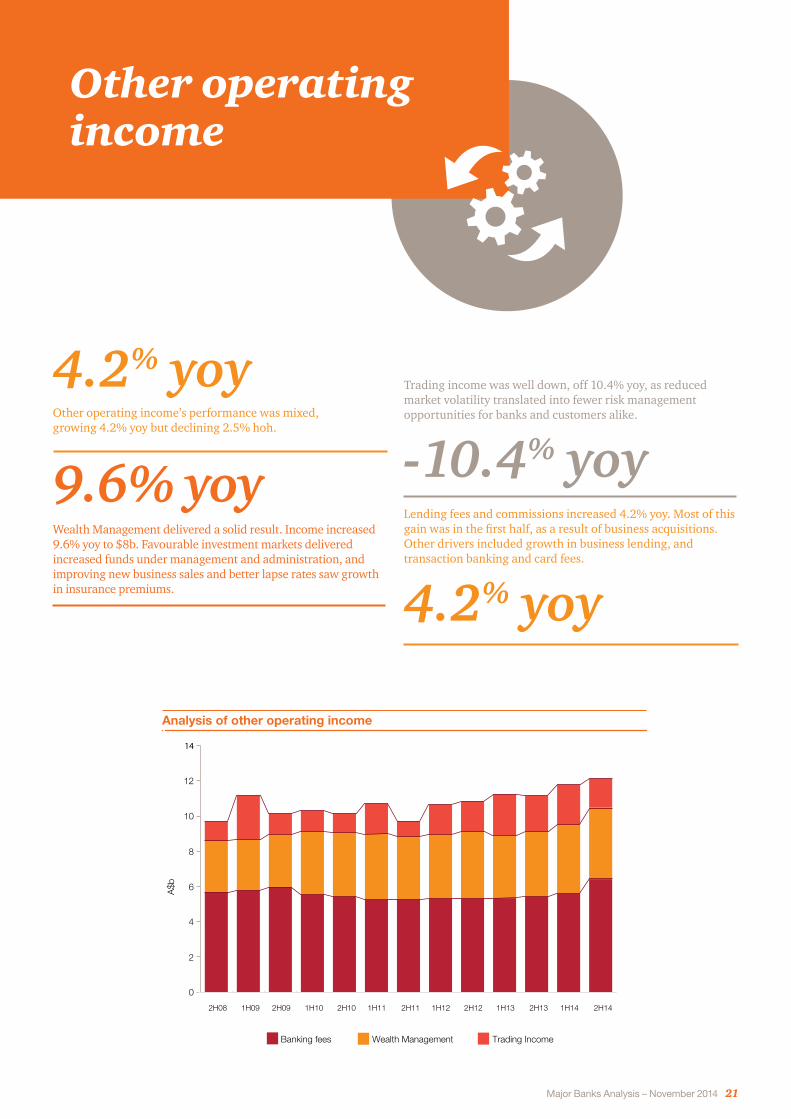
Analysis of other operating income
Other operating income
4.2% yoy Other operating income’s performance was mixed, growing 4.2% yoy but declining 2.5% hoh.
9.6% yoy Wealth Management delivered a solid result. Income increased 9.6% yoy to $8b. Favourable investment markets delivered increased funds under management and administration, and improving new business sales and better lapse rates saw growth in insurance premiums.
Trading income was well down, off 10.4% yoy, as reduced market volatility translated into fewer risk management opportunities for banks and customers alike.
-10.4% yoyLending fees and commissions increased 4.2% yoy. Most of this gain was in the first half, as a result of business acquisitions. Other drivers included growth in business lending, and transaction banking and card fees.
4.2% yoy

22 Major Banks Analysis – November 2014
Combined expense-to-income ratio
42%
44%
46%
48%
46.2%
45.7%
44.4%
45.4%
44.7%44.4% 44.3%
47.2%
43.7%
2H141H142H131H132H121H122H111H112H101H102H091H092H081H08
43.6%
Combined expense-to-income ratio
Operating efficiency
43.4%
The banks’ combined cost to income ratio improved marginally over the year to 43.4% (43.6% in FY13), after excluding the impact of NAB’s conduct related provisions for the UK and software write downs.
Those two items for NAB amounted to $1.7b (pre-tax) and contributed 51% of the four majors’ expense increase for the year.
$1.7b
$1.5b IT and software costs, including software amortisation expenses of $1.5b, rose 10.7% yoy. Software amortisation costs are expected to keep rising as banks continue to invest in new software to drive efficiency improvements and digital growth strategies.
10.7%yoy
$4.7bInvestment spend, at $4.7b, was down 1.3% yoy, reflecting fewer large infrastructure projects. In FY14 banks spent $2.2b on productivity, digital innovation and transformation projects to drive growth, and a further $1.2b on risk and regulatory projects.
173,883Salaries were up 4.5% over the year and flat hoh. The increase reflected high salaries and wages, as aggregate staff numbers rose by only 1,287 in FY14, bringing the total number of employees to 173,883 (an increase of 0.7%).
4.5%
Note ---- Excluding NAB’s $1.7 billion of conduct related provisions and software write downs.
Major Banks Analysis – November 2014 23
Asset quality
0.0%
1.0%
2.0%
3.0%
4.0%
5.0%
6.0%
7.0%
8.0%
Impaired assets/gross loans & acceptances (left axis)
0.0%
0.5%
1.0%
1.5%
2.0%
2.5%
Bad debt charge/gross loans & acceptances (right axis)
2013 2014201220112010200920082007200620052004200320022001200019991998199719961995199419931992
Impaired assets and bad debt expense
Impared assets and bad debt expense
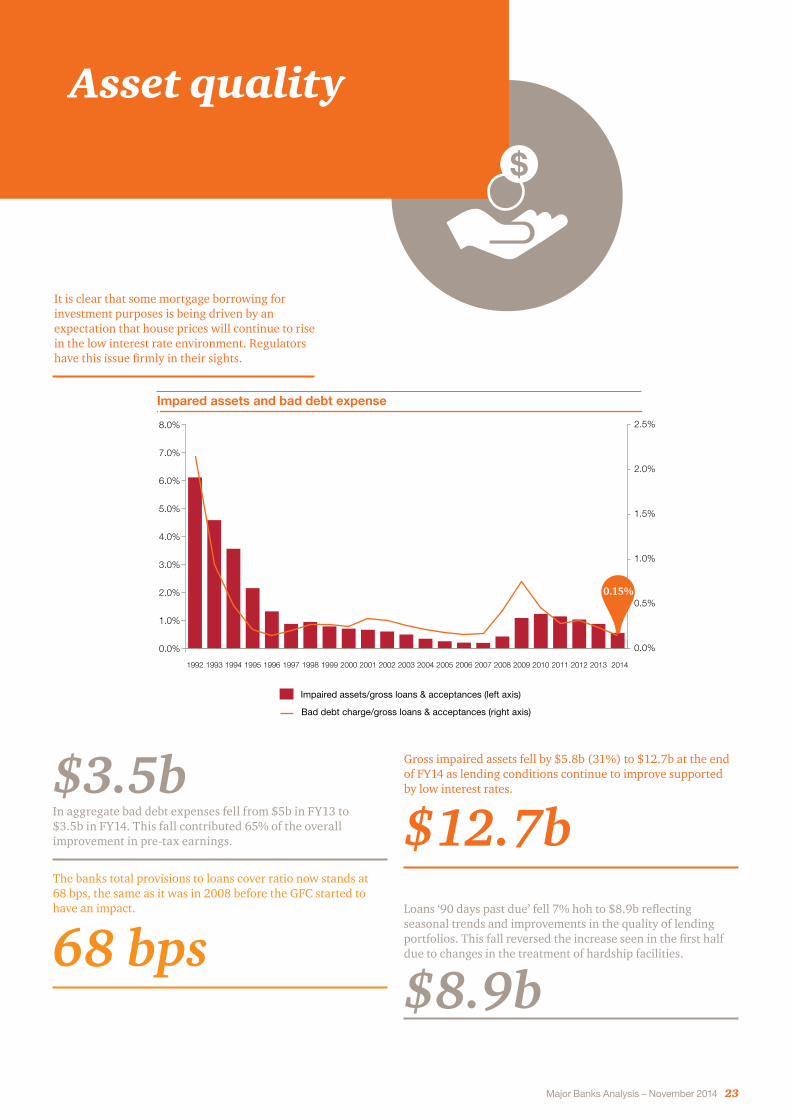
$3.5bIn aggregate bad debt expenses fell from $5b in FY13 to $3.5b in FY14. This fall contributed 65% of the overall improvement in pre-tax earnings.
The banks total provisions to loans cover ratio now stands at 68 bps, the same as it was in 2008 before the GFC started to have an impact.
68 bps
Gross impaired assets fell by $5.8b (31%) to $12.7b at the end of FY14 as lending conditions continue to improve supported by low interest rates.
$12.7b Loans ‘90 days past due’ fell 7% hoh to $8.9b reflecting seasonal trends and improvements in the quality of lending portfolios. This fall reversed the increase seen in the first half due to changes in the treatment of hardship facilities.
$8.9b
It is clear that some mortgage borrowing for investment purposes is being driven by an expectation that house prices will continue to rise in the low interest rate environment. Regulators have this issue firmly in their sights.
0.15%

24 Major Banks Analysis – November 2014
Follow the conversation #bigbankstheory
@PwC_Au
PwC Australia
PwC Australia

All figures in AUD million unless otherwise indicated
(i) In arriving at “cash earnings”, income and expenses exclude certain non cash items. Non cash items include acquisition related adjustments, impact of hedge accounting and revaluation of treasury shares and other items reported by the banks. Some components of income and expenses have been reclassified to improve comparability between banks.
(ii) Statutory result as reported by the banks, unadjusted.
(iii) Capital ratios at September 2014 and September 2013 are calculated based on Basel III; and capital ratios at September 2012 are calculated based on Basel II.
(iv) NAB’s underlying cash earnings after tax are shown before distributions to holders to National Securities - FY14 ($180) million, FY13 ($188) million and FY12 ($207) million, NAB only reports an expense to income ratio for its banking operations.
ANZ CBA NAB (iv) WBC
12 mths Sep-14
12 mths Sep-13
12 mths Sep-12
12 mths Jun-14
12 mths Jun-13
12 mths Jun-12
12 mths Sep-14
12 mths Sep-13
12 mths Sep-12
12 mths Sep-14
12 mths Sep-13
12 mths Sep-12
Balance sheet
Total assets 772,092 702,995 642,127 791,451 753,857 718,859 883,301 809,870 763,090 770,842 701,097 678,612
Risk weighted assets 361,529 339,265 300,119 337,715 329,158 302,787 367,652 362,078 331,336 331,387 307,372 297,901
Gross loans and acceptances 524,383 486,818 431,566 608,127 568,821 542,097 545,361 522,079 500,857 583,516 539,806 518,279
Asset quality & provisioning
Gross impaired assets 2,889 4,264 5,196 3,367 4,330 4,687 4,122 6,347 6,543 2,340 3,600 4,386
Net impaired assets 1,713 2,797 3,423 2,101 2,571 2,556 2,668 4,317 4,560 1,293 2,046 2,745
Gross impaired assets as a % of gross loans and acceptances 0.55% 0.88% 1.20% 0.55% 0.76% 0.86% 0.76% 1.22% 1.31% 0.40% 0.67% 0.85%
Individually assessed provisions 1,176 1,467 1,773 1,127 1,628 2,008 1,454 2,030 1,983 867 1,364 1,470
Individually assessed provisions as a % of impaired assets 40.7% 34.4% 34.1% 33.5% 37.6% 42.8% 35.3% 32.0% 30.3% 37.1% 37.9% 33.5%
Collective provisions 2,757 2,887 2,765 2,779 2,858 2,837 2,471 2,783 2,920 2,614 2,585 2,771
Collective provisions as a % of non housing loans & acceptances 1.09% 1.24% 1.38% 1.33% 1.46% 1.50% 1.06% 1.20% 1.26% 1.33% 1.46% 1.61%
Total provisions 3,933 4,354 4,538 3,906 4,486 4,845 3,925 4,813 4,903 3,481 3,949 4,241
Total provision as a % of gross loans & acceptances 0.75% 0.89% 1.05% 0.64% 0.79% 0.89% 0.72% 0.92% 0.98% 0.60% 0.73% 0.82%
Profit & loss analysis (i)
Net interest income 13,797 12,772 12,110 15,091 13,944 13,157 13,775 13,407 13,297 13,496 12,912 12,563
Other operating income 5,781 5,619 5,738 7,310 6,877 6,993 5,138 5,156 4,927 6,324 5,921 5,513
Total operating expenses 8,760 8,257 8,519 9,499 9,010 9,196 10,180 8,410 7,828 8,246 7,759 7,427
Core earnings 10,818 10,134 9,329 12,902 11,811 10,954 8,733 10,153 10,396 11,574 11,074 10,649
Bad debt expense 989 1,197 1,258 953 1,082 1,089 877 1,934 2,615 650 847 1,212
Profit before tax 9,829 8,937 8,071 11,949 10,729 9,865 7,856 8,219 7,781 10,924 10,227 9,437
Income tax expense 2,700 2,435 2,235 3,250 2,953 2,736 2,492 2,284 2,178 3,230 3,088 2,804
Minority interest 12 10 6 19 16 16 0 0 1 66 76 69
Cash earnings 7,117 6,492 5,830 8,680 7,760 7,113 5,364 5,935 5,602 7,628 7,063 6,564
Statutory results (ii) 7,271 6,310 5,661 8,631 7,618 7,090 5,295 5,355 4,082 7,561 6,751 5,936
Key data
Other operating income as a % of total income 29.5% 30.6% 32.1% 32.6% 33.0% 34.7% 27.2% 27.8% 27.0% 31.9% 31.4% 30.5%
Interest spread 1.90% 1.97% 2.02% 1.97% 1.91% 1.82% 1.64% 1.69% 1.71% 1.89% 1.92% 1.87%
Interest margin 2.13% 2.22% 2.31% 2.14% 2.14% 2.09% 1.93% 2.03% 2.11% 2.08% 2.15% 2.16%
Expense/income ratio (as reported ratio) 44.7% 44.9% 47.7% 42.9% 43.6% 46.0% 53.0% 43.7% 41.3% 41.6% 41.2% 40.8%
Total number of full time equivalent staff 50,328 49,866 48,239 44,329 44,969 44,844 42,853 42,164 43,336 36,373 35,597 35,675
Operating costs per employee (dollars) - annualised 174,861 168,330 172,911 212,748 200,639 202,323 238,956 196,573 180,190 226,271 216,104 206,071
Return on average equity (as reported) 15.4% 15.3% 15.1% 18.7% 18.2% 18.6% 11.8% 14.1% 14.2% 16.4% 15.9% 15.5%
Return on average assets (underlying cash) 0.95% 0.96% 0.93% 1.11% 1.07% 1.01% 0.62% 0.74% 0.74% 1.03% 1.03% 0.99%
Capital ratios (iii)
Common equity 8.8% 8.5% 8.8% 9.3% 8.2% 7.8% 8.6% 8.4% 8.3% 9.0% 9.1% 8.4%
Tier 1 10.7% 10.4% 10.8% 11.1% 10.3% 10.0% 10.8% 10.4% 10.3% 10.6% 10.7% 10.3%
Tier 2 (net of deductions) 2.0% 1.8% 1.4% 0.9% 0.9% 1.0% 1.4% 1.4% 1.4% 1.7% 1.6% 1.4%
Total 12.7% 12.2% 12.2% 12.0% 11.2% 11.0% 12.2% 11.8% 11.7% 12.3% 12.3% 11.7%
Lending and Funding Ratios
Gross loans & acceptances / total assets 67.9% 69.2% 67.2% 76.8% 75.5% 75.4% 61.7% 64.5% 65.6% 75.7% 77.0% 76.4%
Housing loans / gross loans & acceptances 51.8% 52.0% 53.5% 65.7% 65.5% 65.1% 57.2% 55.4% 53.7% 66.4% 67.2% 66.8%
Deposits (exclude CDs)/ Gross loans 84.1% 81.1% 75.7% 72.1% 71.2% 70.0% 71.7% 70.1% 67.7% 70.1% 70.9% 67.1%
Deposits (exclude CDs)/ Total liabilities 61.0% 60.1% 54.4% 59.0% 57.2% 56.0% 46.8% 47.9% 47.1% 56.7% 58.5% 55.0%
Key banking statistics – Full year 2014

26 Major Banks Analysis – November 2014
For any additional enquiries
For further information on digital and innovation
Primary contacts for Major Banks Analysis
Hugh Harley Asia Pacific Financial Services Leader [email protected] +61 (2) 8266 5746
Angela Barter [email protected] +61 (2) 8266 1996
Megan [email protected] +61 (2) 8266 0088
Sarah [email protected] +61 (2) 8266 0354
Kate Eriksson [email protected] +61 (3) 8603 0128
Michelle [email protected] +61 (3) 8603 2997
Jason [email protected] +61 (2) 8266 1252
Tim Lovitt [email protected] +61 (2) 8266 2287
This publication has been prepared for general guidance on matters of interest only, and does not constitute professional advice. You should not act upon the information contained in this publication without obtaining specific professional advice. No representation or warranty (express or implied) is given as to the accuracy or completeness of the information contained in this publication, and, to the extent permitted by law, PwC does do not accept or assume any liability, responsibility or duty of care for any consequences of you or anyone else acting, or refraining to act, in reliance on the information contained in this publication or for any decision based on it.
© 2014 PwC. All rights reserved. PwC refers to the PwC network and/or one or more of its member firms, each of which is a separate legal entity. Please see www.pwc.com/structure for further details.
pwc.com.au/mba