Embed Size (px)
Citation preview

Maize Production Outlook and Implications for Food Security
TEGEMEO INSTITUTE OF AGRICULTURAL POLICY AND DEVELOPMENT, EGERTON UNIVERSITY
September 18, 2009

Presentation outline
• Maize production and consumption trends in Kenya
• Production expectations for 2009/2010
• Stock management issues
• Policy implications

Maize production and consumption trends
(2000-2008)

National maize production and consumption trends: 2000-2008
Source: Economic Survey 2008; MOA; & Tegemeo computations

Contribution of regions to national production: 2000-2008
Source: Ministry of Agriculture
Rift Valley: increasingly an important source of grainNyanza: declining contribution to production

Expected maize production shortfall for the 2009/2010 season

Expected yield based on assessment of current maize crop, long rains season 2009
District Maize Growth Stage Expected yield per
Normal yield/acre
Nakuru Tasselling/ milk stage 1 – 5 10Uasin Gishu Tasseling, Roasting 10 – 15 18Trans-Nzoia Tasselling, Roasting 12– 15 20Nandi North Milk Stage 8– 12 14Laikipia Knee-high 0– 2 8Nyandarua Knee-high 5– 7 6Koibatek Tasselling 2– 5 12
Lugari Roasting/milking 12 – 15 20Narok Harvested 2– 6 11Kericho/ Roasting/harvesting 10 14Bungoma Harvested/Roasting 10 – 15 13Bomet Harvested/ pockets of planting 8 – 10 11Trans-Mara Harvested/planting/ weeding 7 – 15 16Nandi South Harvested/planting 7 – 10 10Eastern Harvested, LP awaiting planting 1.6 6Central Province All Harvested except 2.6 8Nyanza >70% harvested 6 11
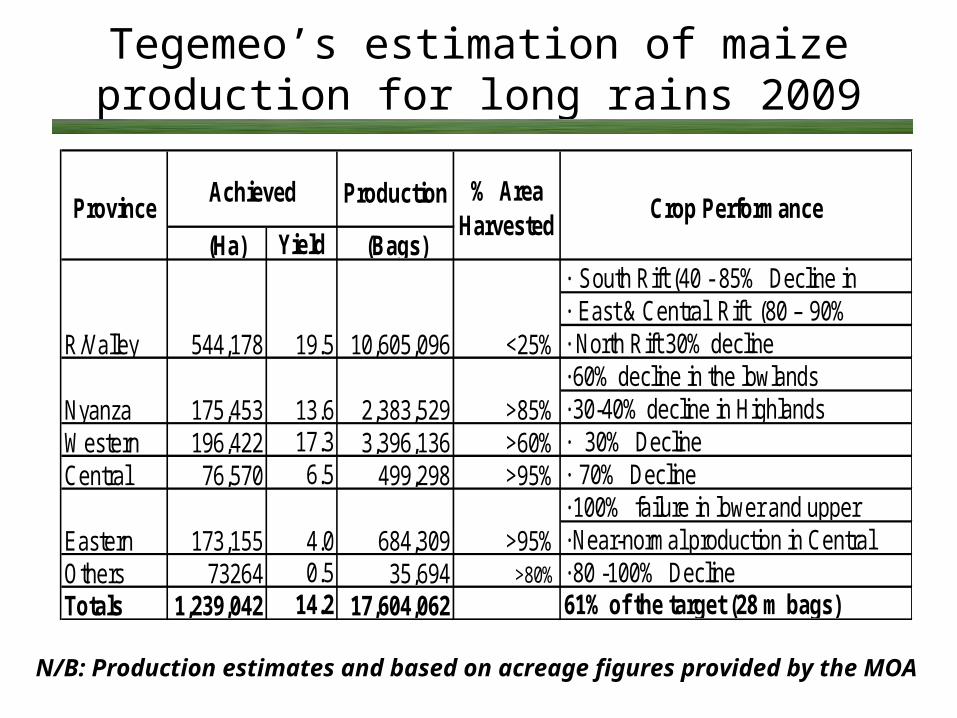
Tegemeo’s estimation of maize production for long rains 2009
Production
(Ha) Yield (Bags)· South Rift (40 - 85% Decline in · East & Central Rift (80 – 90% · North Rift 30% decline· 60% decline in the lowlands· 30-40% decline in Highlands
Western 196,422 17.3 3,396,136 >60% · 30% DeclineCentral 76,570 6.5 499,298 >95% · 70% Decline
· 100% failure in lower and upper · Near-normal production in Central
Others 73264 0.5 35,694 >80% · 80 -100% DeclineTotals 1,239,042 14.2 17,604,062 61% of the target (28 m bags)
Crop Performance
13.6 2,383,529 >85%
Achieved
R/Valley 544,178 19.5
Province% Area
Harvested
>95%Eastern 173,155 4.0 684,309
10,605,096 <25%
Nyanza 175,453
N/B: Production estimates and based on acreage figures provided by the MOA

Production estimates for 2009/2010
• Best case scenario for 2009/2010 crop year is about 23m bags against a consumption of >37m bags
– About 17.6m bags from the long rains season. This is the best scenario with adequate rainfall in areas where the crop was either at knee high, tasselling or milk stage as at beginning of Sept. 2009.
– About 6m bags from the short-rains season with adequate rains; production is normally 15% of average annual production
• Worst case scenario• Inadequate rainfall - could be very grim

Need for adjustments• Estimated annual consumption of 37m bags exclude
green maize YET our production assessment of 23m bags for 2009/2010 is not adjusted for green maize harvests– Reported levels of green maize sales :
• Nandi South: up to 60% • Bomet/Trans-Mara: 40% • Trans-Nzoia: significant • Reasons: profitable; fear of rotting due to rains; decline in
production of green maize in Central province
• Case for El-Nino• Potential destruction of long rain crop in the fields (R/valley)• Potential gains for short season crop
• Production from irrigation – Govt indicated some maize production from irrigation by December
(minimal)

Bridging the production shortfall: Imports
• Under the best case scenario, Kenya will experience a shortfall of about 14m bags in the 2009/2010 cropping year
Maize stocks and management

Maize stocks (bags) as at Jul 30th 2009
Province Farmer’s Traders and Millers
NCPB Totals
Western 380,814 150,778 531,592
Nyanza 455,032 242,605 697,637
R/Valley 1,613,088 461,895 2,074,983Central 41,155 50,336 91,491
Eastern 67,132 72,998 130,574
Coast 1,620 32,516 34,136
Nairobi 0 12,059 12,059
N/Eastern 415 675 1,090
NCPB 1,975,287 1,975,287
Total 2,559,256 1,023,862 1,975,287 5,568,405
Stocks to last 2 Months (Aug/Sep)
Source: Ministry of Agriculture

Stock management issue
• No budgetary allocation made for food importation for SGR in 2009/2010 (source: Ministry of Finance)
• Inadequate SGR (1.8m vs. recommended 8m bags)
– NCPB not selling maize with implications on its price stabilization role
• Ksh.1 bn allocated for generalized food subsidy for urban poor
• Ksh. 5.35 bn allocated for general food relief for rural poor
• Total Ksh. 6.35 bn can purchase about 2.5m bags of maize
– Can feed 10 million people for only 3 months
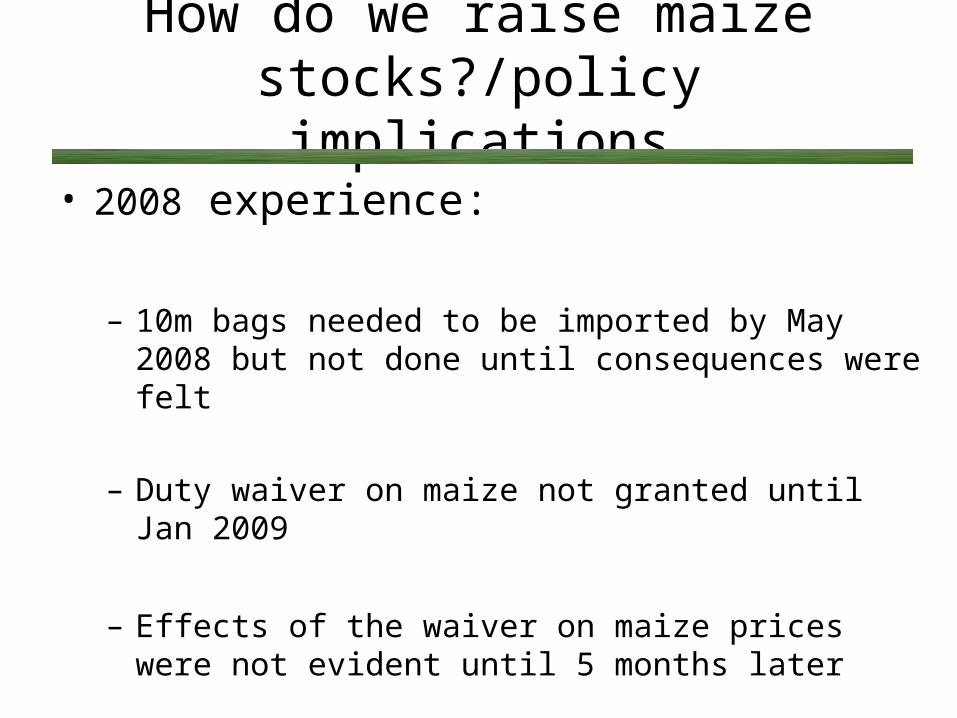
How do we raise maize stocks?/policy implications
• 2008 experience:
– 10m bags needed to be imported by May 2008 but not done until consequences were felt
– Duty waiver on maize not granted until Jan 2009
– Effects of the waiver on maize prices were not evident until 5 months later

How do we raise maize stocks?/policy implications
• What to consider when importing– Quicker response when food balance indicates need
for imports
• This potentially requires major budgetary allocation when major deficits are expected
– Time lag between import order and arrival of grain in the country side (~2 months)
– Information on supply of grains and movements in grain world prices
– Duty on until end of June 2010
• Review situation before removal

Policy suggestions for dealing with production shortfalls

Policy suggestions• Short-term
– Expansion of relief efforts• Increase SGR• Increase food relief supplies to the most vulnerable
– Stimulating production• Targeted fertilizer/seed support for short rains season• Expansion of irrigation
– Maintaining duty waiver• Allow adequate/affordable imports
• Long-term– Productivity enhancing investments
• Expansion of irrigation; roads & railway infrastructure; R&D• Improving access to productivity enhancing inputs
– Working with private sector to improve access to seeds and fertilizers by farmers

Thank You