Embed Size (px)
Citation preview

i
DETERMINING THE FACTORS THAT LIMIT AGRO-PROCESSING DEVELOPMENT IN THE MAIZE MILLING INDUSTRY IN RURAL AREAS IN
SOUTH AFRICA By André Louw, Mariëtte Geyser, Gerhard Troskie, Melissa van der Merwe, Nico Scheltema
and Richard Nicholson

ii
Disclaimer Information contained in this document results from research funded wholly or in part by the NAMC acting in good faith. Opinions, attitudes and points of view expressed herein do not necessarily reflect the official position or policies of the NAMC. The NAMC makes no claims, promises, or guarantees about the accuracy, completeness, or adequacy of the contents of this document and expressly disclaims liability for errors and omissions regarding the content thereof. No warranty of any kind, implied, expressed, or statutory, including but not limited to the warranties of non-infringement of third party rights, title, merchantability, fitness for a particular purpose or freedom from computer virus is given with respect to the contents of this document in hardcopy, electronic format or electronic links thereto. Reference made to any specific product, process, and service by trade name, trade mark, manufacturer or another commercial commodity or entity are for informational purposes only and do not constitute or imply approval, endorsement or favouring by the NAMC.

iii
DETERMINING THE FACTORS THAT LIMIT AGRO-PROCESSING DEVELOPMENT
IN THE MAIZE MILLING INDUSTRY IN RURAL AREAS IN SOUTH AFRICA
by
Andre Louw (Prof), Mariette Geyser (Dr),
Gerhard Troskie, Melissa van der Merwe, Nico Scheltema and Richard Nicholson.
Department of Agricultural Economics, Extension, and Rural Development
Faculty of Natural and Agricultural Sciences
University of Pretoria
June 2010

iv
TABLE OF CONTENTS
TABLE OF CONTENTS ......................................................................................................................... iv
LIST OF FIGURES ................................................................................................................................. vi LIST OF TABLES ................................................................................................................................. viii EXECUTIVE SUMMARY ........................................................................................................................ ix
CHAPTER 1 STUDY OBJECTIVES, DATA COLLECTIONS AND METHODOLOGIES ................... 1
1.1 STUDY OBJECTIVES ............................................................................................................ 1
1.2 DATA COLLECTION ............................................................................................................. 2
1.3 METHODOLOGIES ................................................................................................................ 3
1.3.1 STRUCTURE, CONDUCT AND PERFORMANCE FRAMEWORK ................................... 3
1.3.2 STOCHASTIC COST FRONTIER MODEL ........................................................................ 5
1.3.3 PRICE VOLATILITY .......................................................................................................... 7
1.3.4 RISK MANAGEMENT ANALYSIS ..................................................................................... 8
CHAPTER 2 LITERATURE REVIEW ................................................................................................. 9
2.1 BACKGROUND AND INTRODUCTION ................................................................................ 9
2.2 INTERNATIONAL SECTOR ................................................................................................ 12
2.3 SOUTHERN AFRICAN DEVELOPMENT COMMUNITY (SADC) ........................................ 17
2.4 SOUTH AFRICA................................................................................................................... 24
2.5 CONCLUSIONS AND RECOMMENDATIONS .................................................................... 29
2.5.1 INTERNATIONAL SECTION ........................................................................................... 29
2.5.2 SADC SECTION .............................................................................................................. 30
2.5.3 SOUTH AFRICAN SECTION ........................................................................................... 30
CHAPTER 3 MARKET OVERVIEW ................................................................................................. 31
3.1 GLOBAL OVERVIEW .......................................................................................................... 31
3.1.1 STOCK LEVELS .............................................................................................................. 31
3.1.2 PRODUCTION LEVELS .................................................................................................. 33
3.1.3 CONSUMPTION LEVELS ............................................................................................... 34
3.1.4 WORLD TRADE (IMPORTS AND EXPORTS) ................................................................ 39
3.1.5 PRICES AND PRICE CYCLES ........................................................................................ 40
3.1.6 FOOD SECURITY ............................................................................................................ 43
3.1.7 MILLING INDUSTRY ....................................................................................................... 44
3.2 SOUTHERN AFRICAN DEVELOPMENT COMMUNITY (SADC) OVERVIEW ................... 50
3.2.1 STOCK LEVELS .............................................................................................................. 50
3.2.2 PRODUCTION LEVELS .................................................................................................. 50
3.2.3 PRICES AND PRICE CYCLES ........................................................................................ 54
3.2.4 SUPPORT STRUCTURES............................................................................................... 55
3.2.5 FOOD SECURITY ............................................................................................................ 55
3.2.6 MILLING INDUSTRY ....................................................................................................... 57
3.3 SOUTH AFRICAN OVERVIEW ............................................................................................ 57
3.3.1 PRODUCTION LEVELS .................................................................................................. 57
3.3.2 CONSUMPTION LEVELS ............................................................................................... 59
3.3.3 STOCK LEVELS .............................................................................................................. 61
3.3.4 IMPORT AND EXPORT LEVELS .................................................................................... 63
3.3.5 PRICES AND PRICE VOLATILITY ................................................................................. 66
3.3.6 MILLING INDUSTRY ....................................................................................................... 74
3.3.7 THE SOUTH AFRICAN MAIZE SUPPLY CHAIN ............................................................ 75
3.4 PORTER ANALYSIS OF THE MAIZE MILLING INDUSTRY............................................... 82

v
3.5 CURRENT GLOBAL CHALLENGES FACED BY THE MILLING INDUSTRY .................... 87
3.6 CURRENT ISSUES IN THE GLOBAL MAIZE INDUSTRY .................................................. 92
3.7 BUSINESS MODELS OF THE FUTURE ............................................................................. 96
CHAPTER 4 DATA ANALYSIS AND RESULTS ........................................................................... 104
4.1 INTRODUCTION ................................................................................................................ 104
4.2 STRUCTURE OF MAIZE MILLERS INTERVIEWED ......................................................... 104
4.3 CONDUCT OF MAIZE MILLERS INTERVIEWED ............................................................. 108
4.3.1 INTRODUCTION ............................................................................................................ 108
4.3.2 LEVEL OF COMPETITION ............................................................................................ 108
4.3.3 STRENGTHS, WEAKNESSES, OPPORTUNITIES AND THREATS (SWOT) ANALYSIS.......................................................................................................................111
4.3.4 CRITICAL AREAS OF A MILL BUSINESS ................................................................... 119
4.3.5 THE KEY ISSUES/CONSTRAINTS/CHALLENGES CURRENTLY BEING EXPERIENCED BY MAIZE MILLERS ........................................................................... 121
4.3.6 BARRIERS TO ENTRY AND BARRIERS TO EXIT ...................................................... 123
4.3.7 PROCUREMENT DECISIONS ....................................................................................... 129
4.3.8 IMPORTS, EXPORTS & SALES ................................................................................... 131
4.3.10 RISK MANAGEMENT .................................................................................................... 137
4.3.11 SUPPORT STRUCTURES OF THE DTI ........................................................................ 143
4.4 PERFORMANCE OF MAIZE MILLERS INTERVIEWED ................................................... 144
4.4.1 FINANCIAL PERFORMANCE OF MAIZE MILLERS .................................................... 144
4.4.2 COST EFFICIENCY ....................................................................................................... 147
4.5 EXPANSION PLANS OF MAIZE MILLERS ....................................................................... 150
CHAPTER 5 CONCLUSIONS AND RECOMMENDATIONS ......................................................... 151
REFERENCES .................................................................................................................................... 156
vi
LIST OF FIGURES
Figure 1: Graphical representation of interviews conducted in the various provinces ....................... 3
Figure 2: An illustration of the S-C-P paradigm ................................................................................. 4
Figure 3: Deterministic S-C-P mode .................................................................................................. 5
Figure 4: Dynamic S-C-P model ........................................................................................................ 5
Figure 5: Graphical representation of the risk management process. ............................................... 8
Figure 6: Agrifood value chain ......................................................................................................... 11
Figure 7: Proposed frame for development and periodic update for the Zambian National Food Balance Sheet ........................................................................................................................................ 21
Figure 8: Informal maize import: Malawi, 2005/06 – 2007/08 .......................................................... 23
Figure 9: Maize ending stocks ......................................................................................................... 32
Figure 10: Total U.S. maize production ............................................................................................. 33
Figure 11: Maize yields in the U.S. .................................................................................................... 34
Figure 12: Maize for animal feed ....................................................................................................... 34
Figure 13: Food, alcohol and industrial usage of maize in the U.S. ................................................... 36
Figure 14: U.S. feed and residual maize usage ................................................................................. 36
Figure 15: Maize used for ethanol production as a percentage of U.S. maize percentage ................ 37
Figure 16: Coarse grain utilization ..................................................................................................... 38
Figure 17: Maize utilization and export in the U.S. ............................................................................ 38
Figure 18: U.S. corn exports.............................................................................................................. 39
Figure 19: U.S. free on board prices and SAFEX yellow maize prices .............................................. 42
Figure 20: Maize export price (no. 2 Yellow Gulf) .............................................................................. 43
Figure 21: Where do cereals needed for bio fuel production come from? ......................................... 44
Figure 22: Flow chart of EU maize processing Industry .................................................................... 46
Figure 23: EUROMAISIERS mill production, 2008* ......................................................................... 49
Figure 24: Total SADC maize production for the marketing years 1994 to 2009. .............................. 50
Figure 25: SADC maize consumption ............................................................................................... 51
Figure 26: Total maize exports from South Africa to SADC countries for the marketing years 2003/04 to 2009/10 ......................................................................................................................................... 52
Figure 27: SADC maize imports for marketing years 1980 to 2005. .................................................. 53
Figure 28: Maize export values (USD ‘000) for the SADC region ...................................................... 53
Figure 29: Total white and yellow maize delivered in South Africa from the period 2000/2001 to 2008/2009 ......................................................................................................................................... 58
Figure 30: Projected maize production for the period 2009/2010 to 2013/2014 ................................ 59
Figure 31: Allocation of maize to the different maize consumption categorises ................................ 60
Figure 32: Expected consumption levels of the different consumption categories between 2009/2010 to 2013/2014 ......................................................................................................................................... 61
Figure 33: Maize ending stock levels in South Africa between the periods 2000/2001 and 2008/2009. ......................................................................................................................................... 61
Figure 34: South African total maize exports and imports (excluding imports destined for exports) in tons, 2001-2010 ..................................................................................................................................... 64
Figure 35: South African exports of maize products (grain equivalent/tons), 2000-2010 ................... 65
Figure 36: White and yellow maize spot prices, Nov 2007-Jan2010 ................................................. 66
Figure 37: A model of the principal causes of the crisis..................................................................... 68
Figure 38: SAVI Index of white maize traded on SAFEX (from January 2002 to February 2010) ..... 71
Figure 39: Average monthly price volatility ........................................................................................ 73
Figure 40: Maize milling ('000 tons) from 1999/00 to 2006/07 ........................................................... 74
Figure 41: Market value chain for maize ........................................................................................... 76
Figure 42: Prices and cost of the farm gate to the mill door leg of the maize to maize meal supply chain ......................................................................................................................................... 79

vii
Figure 43: The mill door to retail leg of the maize to maize meal supply chain .................................. 80
Figure 44: Porter’s 5 forces model of competition ............................................................................. 82
Figure 45: Porter’s diamond .............................................................................................................. 85
Figure 46: Where do cereals needed for biofuel production come from? .......................................... 92
Figure 47: Maize consumption 2007/08 ............................................................................................ 93
Figure 48: Maize usage in China ....................................................................................................... 93
Figure 49: Processed and unprocessed Chinese maize exports ....................................................... 94
Figure 50: Business Model Template ................................................................................................ 97
Figure 51: Years of experiences of maize millers interviewed ......................................................... 105
Figure 52: Size and scale of maize millers interviewed. .................................................................. 105
Figure 53: The number of employees within an organisation. ......................................................... 106
Figure 54: The capital investments of maize millers interviewed ..................................................... 107
Figure 55: The level of competition perceived by the interviewees ................................................. 109
Figure 56: The five most important areas of a mill business ............................................................ 119
Figure 57: The five most important issues/constraints/challenges as identified by the interviewees 122
Figure 58: Barrier to entry for maize milling industry ....................................................................... 124
Figure 59 Barriers to exit from the maize milling industry ............................................................... 127
Figure 60: The perceived impact of changes in the maize grain price by maize millers .................. 130
Figure 61: The impact of exports on maize milling businesses. ...................................................... 131
Figure 62: The different distribution channels used by the maize millers interviewed. .................... 133
Figure 63: The perception of small scale maize millers on their financial performance over the past five years. ....................................................................................................................................... 144
Figure 64: The perception of medium scale maize millers on their financial performance over the past five years. ....................................................................................................................................... 145
Figure 65: The perception of larger scale maize millers on their financial performance over the past five years. ....................................................................................................................................... 146
Figure 66: The overall perception of all maize millers on their financial performance over the past five years. ....................................................................................................................................... 146
Figure 67: The willingness of maize millers to expand in operations. .............................................. 150
viii
LIST OF TABLES
Table 1: Zambia national food balance frame ..................................................................................... 19
Table 2: Production and capacity utilisation of millers interviewed ..................................................... 20
Table 3: The classification of manufacturing firms according to the National Small Business Act . 26
Table 4: World maize supply and utilization........................................................................................ 32
Table 5: Feed use of maize by region in tons ..................................................................................... 35
Table 6: Maize trade (thousand metric tonnes) .............................................................................. 40
Table 7: Members of EUROMAISIERS and their companies ............................................................. 48
Table 8: Maize products produced by EU mills (Average 2005 – 2008) ............................................. 48
Table 9: SADC countries which ban Genetically Modified products and crops ................................... 54
Table 10: SADC countries with government held strategic grain reserves ....................................... 56
Table 11: African export parity price calculation ............................................................................... 63
Table 12: Historical volatility of the maize contract traded on CME (percentage) ............................ 69
Table 13: Historical volatility of the white maize contract traded on SAFEX (percentage) ............... 70
Table 14: The maize-to-super maize meal supply chain for August 2006 ........................................ 78
Table 15: The maize situation in China (2000/01-2008/09) .............................................................. 95
Table 16: The strengths of maize millers interviewed and the industry. ......................................... 112
Table 17: Weaknesses of maize millers interviewed and the industry............................................ 114
Table 18: Opportunities identified by maize millers ........................................................................ 116
Table 19: Threats identified by maize millers ................................................................................. 117
Table 20: Risks at macro level ....................................................................................................... 137
Table 21: Risks at Micro level ........................................................................................................ 140
Table 22: Output of Cost efficiency estimates for Small, Medium and Large Scale maize millers.. 148
Table 23: Abu’s estimated cost inefficiency for small, medium and large scale maize millers ....... 149

ix
EXECUTIVE SUMMARY
The main purpose of the study is to determine the factors that limit agro-processing development in rural
areas in the North West and Free State provinces. In order to conduct a proper study that benefits the
industry and all stakeholders involved, objectives must be identified and questions asked by the study ,
solved. The objectives listed below will serve as guidelines for the proposed study. The objectives of the
study can be summarised as follows:
• Report on previous studies conducted in South Africa on the maize milling and agro-processing
industry
• Identify the critical success factors of the current maize millers
• Analyse the maize supply chain to understand the short and long term issues in the sub-sector
that influence the effective establishment of agro-processing industries in rural areas.
• Determine the impact of input price volatility on the profit margins of the smaller commercial mills
• Identify factors that restrict and/or enhance the competitiveness and profitability of smaller
commercial mills.
• Identify the use of any risk mitigation strategies such as hedging, storage and branding applied by
the smaller commercial mills.
• Establish protocols within support structures that can assist in the development and sustainability
of agro-processing industries in rural areas.
• Unpack the governance/business models of successful smaller mills; looking specifically at
contractual arrangements, hedging, infrastructure, and marketing strategies.
• Analyse the barriers to entry and exit.
• Analyse the power relations between the players, if any; with special emphasis on smaller
commercial mills and bakeries.
• Determine the impact of imports and exports of raw materials as well as the manufactured
products.
• Analyse whether the current support measures provided by the DTI are applicable to the agro-
processing sector and to make recommendations on how such support measures can be adapted
if needed.
• Make recommendations on key issues identified in the study.

x
The study was conducted in the geographical regions of the Free State and North West provinces. In
total 36 maize millers were interviewed, 21 maize millers were in the Free State province and 15 in the
North West province. The study made use of a structured questionnaire in order to ensure a consistent
end product is delivered.
However, before the abovementioned objectives of the study can be solved, a foundation from where
the study can be conducted must be laid. A detailed overview of the maize industry on a global, South
African Development Community (SADC) region and South African scale represents this foundation.
The overview of the maize industry includes an analysis of the current stock levels, production levels,
consumption levels, imports and exports, prices and price cycles, food security issues and the maize
milling industry as a whole. For the purposes of the executive summary, only the South African maize
overview will be summarised as this is the environment in which the study is conducted.
South African maize production has increased over the past decade on average by 1.69 percent, yellow
and white maize production represent 2.16 and 1.39 percent respectively of this increase. The expected
future trend for maize production, according to Bureau for Food and Agricultural Policy (BFAP), will
increase on average by 0.6 percent for the next five years. Consumption can be divided into four main
categories which include human, animal, gristing and bio-fuel consumption. Human and animal feed
consumption represents 99 percent of the total maize consumption. Total maize consumption is
expected to increase for the next five years by an average of 0.51 percent per annum. Animal feed
consumption is expected to increase while human consumption decreases.
South Africa is generally a net importer of yellow maize and a net exporter of white maize. Overall,
South Africa is a net exporter of maize. In terms of maize prices, a decrease of 16.34 percent between
October 2008 and October 2009 was experienced. The price of maize products in urban areas
decreased by 2.01 percent in the same period, while maize products over the same period increased by
4.48 percent in rural areas. This is a worrying fact, taking into account that the low income population of
South Africa live in rural areas and the higher income in urban areas. The study further concluded that
price volatility in maize is very high, this needs to be addressed to ensure a more conductive business
environment.

xi
The milling industry is summarised as an industry that consists of 22 large scale millers that account for
two-thirds of the total maize meal produced in South Africa. The rest is produced by smaller, informal
millers. The top four maize milling enterprises account for nearly 40 percent of the maize meal market
share. Over the past two decades, the maize milling industry has experienced a decrease in the amount
of maize being milled. The main reason provided is the changes in consumer preferences that have
occurred.
One of the objectives of the study was to clearly understand and analyse the maize supply chain and
where the milling industry fits into this supply chain. The figure below clearly illustrates the relationship
of all role-players in the maize supply chain.
Figure: The South African maize supply chain
Source: Maize Tariff Working Group, 2005
From the figure it is clear the maize milling industry is in the centre of the whole maize supply chain and
has a key role to play. At the bottom end of the supply chain, research and development has a

xii
significant role to play in terms of improving the technologies and to better understand the nature of the
maize sector. Input suppliers include all companies that are responsible for delivering inputs in all
possible forms (including seed, fertilizer, fuel, mechanisation, pesticides, herbicides, financing, etc).
These input supplying companies supply their final products to the producers/farmers who are
responsible for growing and/or producing the actual maize. Most of the time the maize farmer/producer
delivers the final product to nearby silos. The latter are responsible for grading and storing of maize.
From the silo’s the maize can either be internationally traded (imported or exported) or it is delivered to
the local market. Three different value adding ways are used from the local market maize. The maize is
either used by the animal feed industry, the milling industry for human consumption or by other
processors who may use it for example for wet milling or brewing. The value added product is then
delivered to retail and/or wholesale level where the final consumer buys the product for consumption.
Before all the objectives of the study can be addressed, it is important to get a better understanding of
the average maize miller interviewed. The study divided the maize millers into the number of years
experience, the size of the business in terms of the quantity of maize milled, the number of employees
the business employs and the associated capital investment that was required to start operations. For
the purposes of this study, the average maize mill organisation interviewed has a small scale capacity
(mills between 0.5 and 25 tons per day) has between 11 and 20 years of experience, employs between
one and 20 employees and has a total cost of capital of between a R150 000 and R2.5 million
expenditure.
The study aimed to identify the factors that restrict or enhance the competitiveness of the maize milling
industry. The level of competition in any industry is an important indicator of the long term sustainability
of the industry. It prevents market powers and monopolistic behaviour by firms, while it also enhances
product and market differentiation. From the study it was eminent that the level of competition within the
maize milling industry is very high. Out of all the interviewees, 74 percent indicated that the industry is
highly competitive. The factors that contribute to this high rate of competition are that the maize milling
industry produces a homogenous product at a market related price. The industry has low barriers to
entry, which makes it easy for new market entrants to enter the market as is evidenced in the large
number of maize millers that serve the same market space.
A Strengths, Weaknesses, Opportunities and Threats (SWOT) analysis was performed to identify the
critical success factors of the maize milling industry, as well as to identify what the critical areas of a

xiii
maize mill business are. The maize millers interviewed indicated that high product offerings, an
established client base and brand, market related prices, good and consistent service offerings and
good business stock and overall management are their top five strengths. The maize millers further
indicated that their top five weaknesses are a lack of a proper maintained infrastructure, their respective
cash flow positions, the lack of a well directed marketing campaign, the lack of a well directed and
maintained transport system and the level of experience and knowledge of their labourers. From this it is
clear that in order to be successful in the maize milling industry, one must address all the factors
pointed out by the maize millers interviewed in their strengths and weaknesses.
A worrying fact in the study was the inability of maize millers to see and create new opportunities.
Although several maize millers indicated that they do want to expand operations, no clear indication was
given on the associated plans to do this. Some maize millers indicated that they want to enter smaller
markets, while some indicated that they want to fully integrate their business. The incorporation of
technology was also a subject of discussion as maize millers believe that it will increase their milling
capacity. Surprisingly, maize millers also indicated that they want to enter the wheat milling market; this
is interesting considering the high barriers to entry associated with the latter industry. In terms of threats
for the industry, maize millers indicated that the ever increasing input costs could dampen the
sustainability of the industry. Changes in consumer preferences was a major point of discussion as a
large number of maize millers feel that consumers are changing their preferences of maize meal to
other forms of energy. Theft taking place on site and in transit also impacts the various businesses
negatively while the lack of adequate water quality and quantity impacts the quality of the final product
delivered.
In terms of the critical areas of a maize milling business, respondents indicated that one must have a
strong cash flow position for the reason to take advantage of maize prices should it decrease. Price
formation and setting the correct price at the right time was indicated as the second most critical area of
a maize mill business. In order to survive in the industry, a high quality product offering is essential.
Producing a high quality product was indicated as the third most important area of a maize mill
business. Good management and an established client base were indicated as the fourth and fifth most
important area of a mill business respectively.
The study aimed to identify the barriers to entry and exit that exist in the maize milling industry. Although
the maize milling industry is characterised as an industry with low barriers to entry, maize millers alluded

xiv
to the following barriers to entry. The biggest barrier to entry that exists in the industry is the acquiring of
capital from commercial banks and financial institutions to start operations and for existing maize millers
to expand. The establishment of a brand, client base was indicated as the second and third biggest
barrier to entry that exists in the industry. A well directed marketing campaign and producing a high
quality product was seen as the fourth and fifth biggest barrier to entry. In terms of barriers to exit, the
industry has even lower barriers. The biggest barrier to exit that exists in the industry is again the high
levels of investments that are required to start operations. A large number of millers indicated that they
believe they will not get a willing buyer for their business and even if they do get one it will not be at
market prices. Under the other barriers to exit, milling as a life’s income, client satisfaction, worker
satisfaction and job satisfaction are the biggest barriers to exit that exists in the industry.
The study further analysed the impact input price volatility has on a mill business and the industry as a
whole. Maize prices incur the largest portion of the total cost to produce maize meal. It is estimated that
75 percent of the costs to produce maize meal are allocated to the procurement of maize. The other 25
percent are associated with the costs to mill the maize into maize meal and include labour prices,
packaging material, electricity and transportation costs. In answering the question of what impact price
volatility has on a mill business, the study performed a cost efficiency estimate for small and larger scale
maize millers. The estimate showed that smaller maize millers are 1.6 times more inefficient than larger
scale maize millers. In other words, small scale maize millers incur 1.6 times more unnecessary costs
than larger scale maize millers. This would make smaller maize millers more vulnerable to changes in
maize prices. The maize millers also indicated this with 56 percent of respondents indicating that input
price changes has a very high impact on their business and 26 percent indicating that the impact is
high.
In identifying the impact of exports of the final products in the maize milling industry, only 11 percent of
the respondents indicated that the impact is high. A further 6 percent indicated that the impact is
medium and 9 percent indicated that the impact is low. The remaining 74 percent of the respondents
indicated that exports are not applicable to them. On the other hand, maize millers indicated that
imports have a tremendously low impact on the industry. Out of the total, 91 percent indicated that
imports are not applicable to them. The remaining 9 percent of respondents indicated that the impact of
imports is very low on their business.

xv
Identifying the associate risks of the industry is an important aspect of the objectives of study. The study
aimed to identify all the associated risks in the maize milling industry. Risks was divided into macro risks
that have an external impact on the maize milling industry and micro risks that impacts the daily
operations of the industry. It is worth mentioning in particular one important risk that will have an impact
on the industry. Changes in consumer preferences for maize meal have changed over the years and
are expected to increase even more. More and more consumers are moving away from maize meal to
other energy sources.
The industry is also faced wit challenges and issues that limit the development of the industry. Maize
millers indicated the high level of competition within in the industry is a concern and needs to be
addressed. A large number of maize millers feel that the level of competition within the industry is
unhealthily high and needs to be reduced. As explained in the risk section, changes in consumer
preferences for maize meal are a serious issue within in the industry. Maize millers also alluded to this
and responded that the industry must do something to lure the consumers back to maize meal. In the
barriers to entry section, maize millers indicated that it is difficult to acquire the needed capital to start
operations and to expand. This was also indicated as a constraint of the industry by the maize millers.
There exists also a challenge to overcome the increase in electricity prices for the next three years.
Maize millers indicated that the increase in electricity prices will impact on the profitability and
sustainability of the industry.
The legal framework was also under investigation by the study. Although there is a large number of acts
and laws that can have an impact on the industry, maize millers only made special emphasis of the
fortification law that was enforced by government. A large number of maize millers feel that by adding
vitamins and minerals to the final product, unnecessary costs are incurred. Specifically smaller scale
maize millers indicated this, which is no surprise taking into account that they are incurring 1.6 times
more cost than the larger scale maize millers because of their cost inefficiency. Maize millers further
indicated that the labour law impacts on their daily operations.
The study concluded by assessing the financial performance of maize millers interviewed over the past
five years. The study found that on average 78 percent of small scale maize millers indicated that their
financial performs over the past five years range from an average to very good. The remaining 22
percent of the small scale maize millers indicated that their financial performance is bad to very bad. Out
of the total medium scale maize millers, 91 percent indicated that their financial performance over the

xvi
past five years has been average to very good. The remaining 9 percent indicated that their financial
performance over the past five years has been bad. All of the large scale maize millers indicated that
their financial performance over the past five years has been from average to very good. This is
indicative of a healthy industry with long term sustainable capabilities. However, only 55 percent of
maize millers indicated that they have intentions to expand, indicating an uncertain business
environment.
To conclude, from the study it was clear that the maize milling industry does not have any government
support structures. Government support is a vital ingredient in terms of the overall sustainability of any
industry, none more so the maize milling industry. Government support can aid in acquiring the
necessary capital to establish a milling operation, ensuring that the employees are of a high standard
and have the necessary knowledge and skills levels and by developing a legal framework that enhances
development in agro-processing. The government can further aid by developing and upgrading the
infrastructure. The level of service delivery by the government in terms of the infrastructure that they
provide must improve. Water and electricity were also mentioned by maize millers as a constraint on
their business. Government must ensure that an environment is established that is conductive for
businesses.
The most important risk identified by maize millers for the industry is changes in consumer preferences.
The industry should focus on attracting consumers back to maize meal as a primary source of energy.
However, this is restricted as maize meal is a homogenous product with very little product differentiation
opportunities. Value adding needs to come in other forms for example service delivery, high product
standards and marketing campaigns. The study found that many maize millers do not have the
necessary skills to start a well directed marketing campaign. The National Chamber of Milling can play
an active role in developing these skills
Price volatility of input prices dampens development and growth in agro-processing. Sudden changes in
input prices impacts the cash flow situations of many maize millers. The industry should develop price
volatility strategies that are effective and will counteract the effect price volatility has on a maize miller’s
business.

xvii
The biggest barrier to entry that exists in the industry is the acquiring of the necessary capital to start
operations. Maize millers indicated that it is virtually impossible for them to qualify for credit from banks,
as the banks perceive the milling industry as a too high risk industry. The DTI, IDC, commercial banks
and government institutions must play a more active role in making funds available for credit worthy
maize millers to start operations
One of the most concerning factors for the industry is the unwillingness of maize mill owners to provide
accurate information of the industry and their respective businesses. Information transparency is
essential and must be secured in order to promote development. The cost efficiency calculation was
complicated by this unwillingness of maize mill owners to provide accurate information. In order for the
industry to grow and develop more and more studies needs to be conducted to fully understand the
dynamics in the industry. The Competition Commission must establish a business environment where
information can be shared freely. This will increase the maize milling industry’s potential to develop and
compete freely. The study was complicated by the fact that no small scale maize miller is required to
register at an organisation. This in itself restricts agro-processing development as maize mill owners are
not supported by any institution and little information is available. The National Chamber of Milling in
general only represents the larger scale maize millers of the industry.
The study concludes that the maize milling industry is a high volume, low profit margin industry.
Development of maize milling in rural areas is difficult if no support structures exist. The National
Chamber of Milling must be more active in the development of smaller scale maize millers.

1
CHAPTER 1 STUDY OBJECTIVES, DATA COLLECTIONS AND METHODOLOGIES
The main purpose of the study is to identify factors that limit agro-processing development in rural areas
in the Free State and North West Provinces in South Africa. In order to determine these factors, a
detailed analysis of the maize milling industry is required, emphasising the smaller maize millers in the
two provinces. The study is divided into five chapters. The first chapter sets out in explaining and
describing the study objectives, the method of data collection and the associated methodologies used in
the study. The main purpose of Chapter 2 is to report on previous studies conducted in South Africa on
the maize milling and agro-processing industry. Chapter 3 provides a detailed overview of the
International, Southern African Development Community (SADC) and South African maize industry. The
data analysis and results of the study are presented in Chapter 4. The conclusions and
recommendations are discussed in detail in chapter 5.
In order to conduct a precise and focused study for the industry, a clear understanding of the associated
methodologies used in this study must be understood. Chapter 1 aims to introduce the reader to all the
objectives of the study and the geographical region within which the study is conducted.
1.1 STUDY OBJECTIVES
The objectives of the study can be summarised as follow:
• Report on previous studies conducted in South Africa on the maize milling and agro-processing
industry
• Identify the critical success factors of the current maize millers
• Analyse the maize supply chain to understand the shorter and longer term issues in the sub-
sector that influence the effective establishment of agro-processing industries in rural areas.
• Determine the impact of input price volatility on the profit margins of the smaller commercial mills
• Identify factors that restricts and/or enhances the competitiveness and profitability of smaller
commercial mills.
• Identify the use of any risk mitigation strategies such as hedging, storage and branding applied by
the smaller commercial mills.
• Eestablish protocols within support structures that can assist in the development and
sustainability of agro-processing industries in rural areas.

2
• To unpack the governance/business models of successful smaller mills; looking specifically at
contractual arrangements, hedging, infrastructure, and marketing strategies.
• Analyse the barriers to entry and barriers to exit.
• Analyse the power relations between the players, if any, with special emphasis on smaller
commercial mills and bakeries.
• Determine the impact of imports and exports of raw materials as well as the manufactured
products.
• Analyse whether the current support measures provided by the DTI are applicable to the agro-
processing sector and to make recommendations on how such support measures can be adapted
if needed.
• Make recommendations on key issues identified in the study.
1.2 DATA COLLECTION
The collection of information was done by conducting interviews with a structured questionnaire with
various maize milling and agro-processing firms in the supply chain as well as major role players,
supported by the Bureau for Food and Agricultural Policy (BFAP) database where information regarding
chain size and functions is already disseminated. The structured questionnaires were developed on a
statistical basis, in order to verify the results obtained by the study statistically.
The study was conducted within the geographical boundaries of the North-West and Free State
Provinces. In total thirty six (36) questionnaires were conducted with various role players within the
maize milling industry. In the North West province, fifteen (15) interviews with maize millers were
conducted. A total of twenty one (21) maize millers were interviewed in the Free State province.

3
Figure 1: Graphical representation of interviews conducted in the various provinces
1.3 METHODOLOGIES
1.3.1 STRUCTURE, CONDUCT AND PERFORMANCE FRAMEWORK
Bain (1951) founded the traditional S-C-P analysis framework in industrial organisation theory in 1951
(CAET, 2003) to account for inter-industry differences in profitability. S-C-P is an analytical framework
used to study how the structure of the market and the behaviour of the sellers of different commodities
and services affect the performance of markets and consequently the welfare of the different
participants (USAID, 2006). Structure affects conduct, which in turn affects performance. The structures
considered in S-C-P are as follows (USAID, 2006):
Structure refers to the features of the market that influence the rivalry among buyers and sellers
operating in a market. Examples include the number of buyers and sellers in the market, barriers to
entry to the market, the composition of the market, level of infrastructure etc.
Conduct refers to patterns of behaviour that market participants adopt to affect or adjust to the markets
in which they buy or sell. This includes price setting behaviour and production and marketing practices.
Performance refers to market outcomes and how the market fulfils certain social and private objectives.
It encompasses price levels and stability, profit levels, costs, efficiency as well as quantities and quality
of food sold.
An illustration of the S-C-P paradigm is given in Figure 2 below (Aleksandrova & Lubys, 2004). Given
the linkages of the S-C-P framework, questionnaires were developed to focus on the different elements
36 QUESTIONNAIRES IN TOTAL
15 QUESTIONNAIRES IN NORTH WEST PROVINCES
21 QUESTIONNAIRES IN FREE STATE PROVINCE

4
and separate questions were formulated to address the structure, conduct and performance within the
supply chain. The market structure is the most basic concept and research motive and it reflects
groundwork and environment in a market economy (CAET, 2003).
Figure 2: An illustration of the S-C-P paradigm Source: Aleksandrova & Lubys, 2004
CAET (2003) distinguishes between two different types of S-C-P frameworks. This can be seen in
Figure 3 and Figure 4 below and indicates that it can either be a deterministic model or a dynamic
S u p p ly
T ec h no lo g y
R aw M a te ria ls
P ro d u c t C h a ra c te r is tics
B usin e ss A ttitu d e s
D em a n d
P ric e E la s tic ity
S ub stitu te s
R a te o f G ro w th
C yc lica l an d S e aso na l C h arac te r
B a sic C o n d itio n s
N u m b er o f S e lle rs a n d B u ye rs
P ro d u c t D iffe ren tia tio n
B a rr ie rs to E n try
C o st S tru c tu re s
V e rtic a l In te gra tio n
D iv e rs ific a tio n
M a rk et S tru ctu re
P ric ing B e h av io u r
P ro d u c t S tra te gy an d A d v er tising
R ese arch an d Inn o va tio n
P la n t In v es tm e n t
C o n d u ct
P ro d u ctio n a nd A llo c a tiv e E ffic ie n cy
T e ch n o lo g ica l P ro g re ss
F u ll em p lo ym e n t
E q uity
P erfo rm a n ce
T ax e s an d S u b sid ie s
In te rn a tio n a l T ra d e R u le s
R e g u la tio n a n d P rice
C o n tro ls
A n ti-T ru s t L a w s
P u b lic P o licy

5
model. The flow of the arrows indicates the effect the structure, conduct and performance have on each
other and how these factors influence the market.
Figure 3: Deterministic S-C-P mode Source: Lutz in CAET, 2003
Figure 3 indicates how the flow is only one-way, whereas Figure 4 shows the dynamic nature of the S-
C-P model because of its interrelationships.
Figure 4: Dynamic S-C-P model Source: Lutz in CAET, 2003 The S-C-P paradigm was used to analyse the various role players in the market and how these different
elements feature in the maize milling industry.
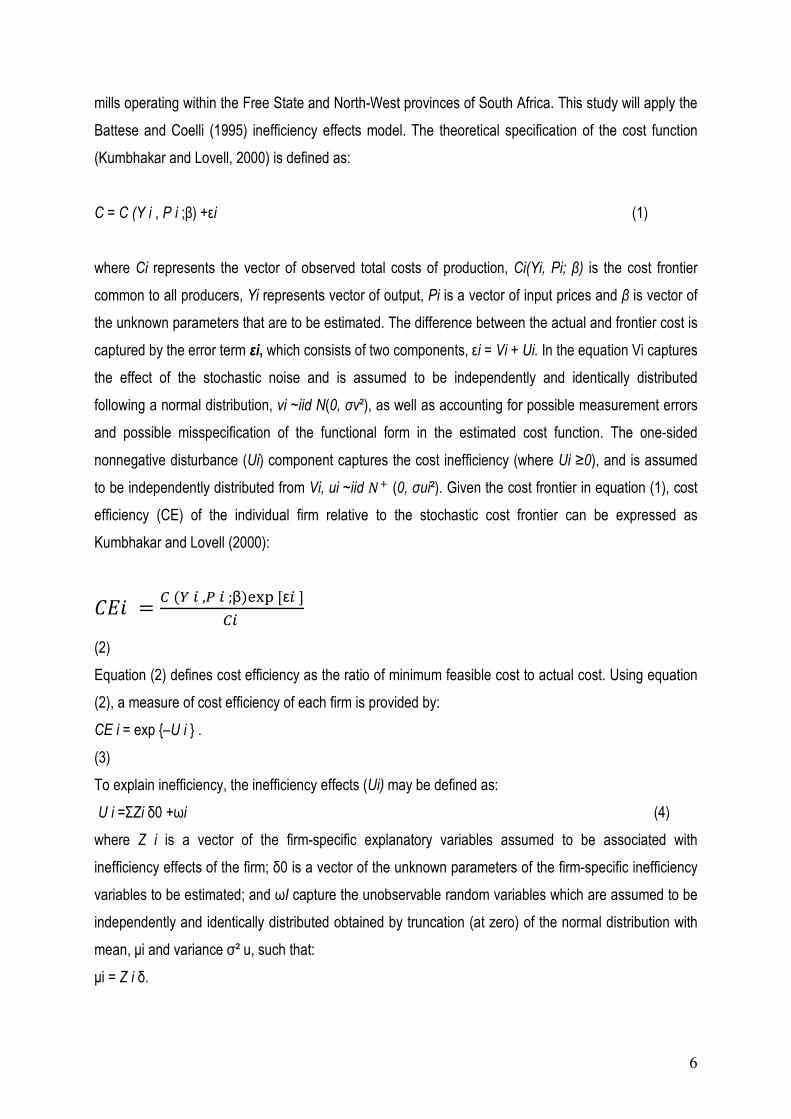
1.3.2 STOCHASTIC COST FRONTIER MODEL
The methodological framework applied within this paper regarding cost efficiency analysis draws upon
the work conducted by Abu (2009). Similar to Abu’s (2009) paper, this study applies the stochastic cost
frontier technique to measure the efficiency of small and medium-scale maize mills, but only focusing on
Structure
Conduct
Performance
Structure
Conduct
Performance
6
mills operating within the Free State and North-West provinces of South Africa. This study will apply the
Battese and Coelli (1995) inefficiency effects model. The theoretical specification of the cost function
(Kumbhakar and Lovell, 2000) is defined as:
C = C (Y i , P i ;β) +εi (1)
where Ci represents the vector of observed total costs of production, Ci(Yi, Pi; β) is the cost frontier
common to all producers, Yi represents vector of output, Pi is a vector of input prices and β is vector of
the unknown parameters that are to be estimated. The difference between the actual and frontier cost is
captured by the error term εi, which consists of two components, εi = Vi + Ui. In the equation Vi captures
the effect of the stochastic noise and is assumed to be independently and identically distributed
following a normal distribution, vi ~iid N(0, σv²), as well as accounting for possible measurement errors
and possible misspecification of the functional form in the estimated cost function. The one-sided
nonnegative disturbance (Ui) component captures the cost inefficiency (where Ui ≥0), and is assumed
to be independently distributed from Vi, ui ~iid �� (0, σui²). Given the cost frontier in equation (1), cost
efficiency (CE) of the individual firm relative to the stochastic cost frontier can be expressed as
Kumbhakar and Lovell (2000):
��� =� ( � , � ;β)��� [ε� ]
��
(2)
Equation (2) defines cost efficiency as the ratio of minimum feasible cost to actual cost. Using equation
(2), a measure of cost efficiency of each firm is provided by:
CE i = exp {–U i } .
(3)
To explain inefficiency, the inefficiency effects (Ui) may be defined as:
U i =ΣZi δ0 +ωi (4)
where Z i is a vector of the firm-specific explanatory variables assumed to be associated with
inefficiency effects of the firm; δ0 is a vector of the unknown parameters of the firm-specific inefficiency
variables to be estimated; and ωI capture the unobservable random variables which are assumed to be
independently and identically distributed obtained by truncation (at zero) of the normal distribution with
mean, µi and variance σ² u, such that:
µi = Z i δ.

1.3.3 PRICE VOLATILITY
Volatility provides a measure of the possible variation or movement in a particular economic variable. It
provides a measure that describes the tendency of a commodity, for example the maize market, to
move either up or down and to what extent the anticipated move could
If the price jumps large amounts in a short space of time then the volatility of the market will be high. If
the market movement is small, steady and predictable then the volatility will be low.
predictability and uncertainty associated with increased volatility may influence both producers and
consumers. High volatility may limit the ability of consumers (processors) to secure supplies and control
input costs.
Two measures of volatility are used (European Commis
• Historical (realised) volatility, based on observed (realised) movements of price over an
historical period. Historical volatility tells us how volatile an asset has been in the past. It
represents past price movements and reflects the resolut
• Implicit volatility. Implicit volatility is the markets' view on how volatile an asset will be in the
future. It represents the market’s expectation of how much the price of a commodity is likely to
move and tends to be more responsive to current market conditions.
Historical volatility is a statistical measure of the volatility of a futures contract, security, or other
instrument over a specified number of past trading days. It is an indication of past volatility in the
marketplace. Historical volatility is calculat
in the logarithmic values of nearby futures settlement prices. Mathematically,
The South African Volatility Index (SAVI) for white maize is based on the forward looking option volatility
which therefore means it provides a transparent reference tool for the market to better understand the
potential uncertainty in the market. It there
contract. In essence, the JSE measures the market volatility is three months from today, every day.
The index serves as a transparent volatility indicator. Because it’s a forward looking indicator
based entirely on the historic values but rather more on participants opinions, one will be able to notice
that as people get more fearful of market conditions, the value of the indicator will start to rise.
ides a measure of the possible variation or movement in a particular economic variable. It
a measure that describes the tendency of a commodity, for example the maize market, to
move either up or down and to what extent the anticipated move could be. In essence it is a fear factor.
If the price jumps large amounts in a short space of time then the volatility of the market will be high. If
the market movement is small, steady and predictable then the volatility will be low.
nd uncertainty associated with increased volatility may influence both producers and
consumers. High volatility may limit the ability of consumers (processors) to secure supplies and control
Two measures of volatility are used (European Commission, 2009):
Historical (realised) volatility, based on observed (realised) movements of price over an
historical period. Historical volatility tells us how volatile an asset has been in the past. It
represents past price movements and reflects the resolution of supply and demand factors.
Implicit volatility. Implicit volatility is the markets' view on how volatile an asset will be in the
future. It represents the market’s expectation of how much the price of a commodity is likely to
more responsive to current market conditions.
Historical volatility is a statistical measure of the volatility of a futures contract, security, or other
instrument over a specified number of past trading days. It is an indication of past volatility in the
marketplace. Historical volatility is calculated as the annualized standard deviation of the first difference
in the logarithmic values of nearby futures settlement prices. Mathematically,
The South African Volatility Index (SAVI) for white maize is based on the forward looking option volatility
which therefore means it provides a transparent reference tool for the market to better understand the
potential uncertainty in the market. It therefore measures the implicit volatility of the
contract. In essence, the JSE measures the market volatility is three months from today, every day.
The index serves as a transparent volatility indicator. Because it’s a forward looking indicator
based entirely on the historic values but rather more on participants opinions, one will be able to notice
that as people get more fearful of market conditions, the value of the indicator will start to rise.
7
ides a measure of the possible variation or movement in a particular economic variable. It
a measure that describes the tendency of a commodity, for example the maize market, to
be. In essence it is a fear factor.
If the price jumps large amounts in a short space of time then the volatility of the market will be high. If
the market movement is small, steady and predictable then the volatility will be low. Lack of
nd uncertainty associated with increased volatility may influence both producers and
consumers. High volatility may limit the ability of consumers (processors) to secure supplies and control
Historical (realised) volatility, based on observed (realised) movements of price over an
historical period. Historical volatility tells us how volatile an asset has been in the past. It
ion of supply and demand factors.
Implicit volatility. Implicit volatility is the markets' view on how volatile an asset will be in the
future. It represents the market’s expectation of how much the price of a commodity is likely to
Historical volatility is a statistical measure of the volatility of a futures contract, security, or other
instrument over a specified number of past trading days. It is an indication of past volatility in the
the annualized standard deviation of the first difference
The South African Volatility Index (SAVI) for white maize is based on the forward looking option volatility
which therefore means it provides a transparent reference tool for the market to better understand the
fore measures the implicit volatility of the white maize
contract. In essence, the JSE measures the market volatility is three months from today, every day.
The index serves as a transparent volatility indicator. Because it’s a forward looking indicator and not
based entirely on the historic values but rather more on participants opinions, one will be able to notice
that as people get more fearful of market conditions, the value of the indicator will start to rise.

8
1.3.4 RISK MANAGEMENT ANALYSIS
Risk management for the purposes of this study will be divided into a macro and micro level. All
identified risks which have an external impact on the daily operations of the milling Industry will be
classified as Macro Risks. Macro Risks will further be divided into a Political, Economical, Social,
Technological and Environmental risks (Louw, 2007). Micro risks, will have an internal impact on the
milling industry in that these types of risks are unique to and affect the long term sustainability of the
industry. Micro risks, therefore will be divided into Operational, Product Market, Financial, Input and
Export risks. The following figure provides a clear understanding of the whole risk management process
for the proposed study.
Macro Risks
Micro Risks
MACRO RISKS
MICRO RISKS
• POLITICAL RISKS • ECONOMICAL RISKS • SOCIAL RISKS • TECHNOLOGICAL RISKS • ENVIRONMENTAL RISKS
• OPERATIONAL • PRODUCT MARKET RISK • FINANCIAL RISKS • INPUT RISKS • EXPORT RISKS
Figure 5: Graphical representation of the risk management process.

9
CHAPTER 2 LITERATURE REVIEW
2.1 BACKGROUND AND INTRODUCTION
Agricultural markets were amongst the most regulated by the apartheid government. Deregulation
started in 1996 with the abolishment of the various Control Boards which had governed the marketing
and price determination of most agricultural products. Prior to deregulation, the Maize and Wheat
Boards acted as the main intermediaries between the farm gate and the processing levels.
Deregulation was expected to lead to a proliferation of small and medium scale maize millers which
could assist in poverty reduction in especially the rural areas.
In 1993, the Macro Economic Research Group (MERG, 1993) suggested that new policy perspectives
be developed for the manufacturing-agricultural complex, a group of industries that reflect the complex
and dynamic linkages between agriculture and the manufacturing sector. MERG recommended a policy
for targeting investment in agro-industry (MERG, 1993). In early 2000, the Department of Trade and
Industry (the dti) – through its Integrated Manufacturing Strategy (IMS) – identified agro-processing as
one of five key sectors of the economy capable of stimulating growth and generating employment
(Machaka and Roberts, 2003).
South Africa’s agro processing sector is regarded as having the potential to generate economic growth,
entrepreneurial opportunities and employment (FAO, 1997; CIAT, 2002; Lambert, 2001; McCormick and
Atieno, 2002). In 1997, the Food and Agriculture Organisation’s (FAO’s) annual State of Food and
Agriculture report argued that:
“because of its high degree of interdependence with forward and backward activities, agro
industry can play a very important role in accelerating economic activity” (FAO, 1997: 8).
Well-operating markets for agri-food products and established linkages between the different parts of
the agri-food system and with the rest of economy are important preconditions for connecting rural and
urban economies and are the long-term solution for agricultural growth, poverty reduction and economic
growth (Memedovic & Shephard, 2009). The agri-food value chain system includes primary production
(farming), post-farm production, marketing and distribution services (domestic and international) and
eventual recycling. The agri-food value chain covers more than 20 different industries and many
commodity sub-sectors including grain, dairy, oils and fats, fruit and vegetables, and horticulture

10
(Memedovic & Shephard, 2009). These industries are important for providing food but also for income
and job creation in agriculture, manufacturing and services. They have strong backward and forward
linkages with other parts of the economy. The progress in agri-food industries is transferred to other
sectors through higher demand for inputs, technology, such as packaging materials, transport,
communication and quality infrastructure (World Bank, 2008).
The agri-food value chain is depicted in Figure 6 below. The first stage of agricultural inputs includes
manufacturing inputs such as fertilizers, seeds, pesticides, tools and agricultural machinery for crop
cultivation, animal breeding and agri-financing and insurance services. They constitute the pre-
production services of the value chain. This stage is followed by primary food processing, crops
cultivation and animal breeding, agro processing products and agro processing by-products. The last
stage encompasses all the activities needed to move the product to the end Consumer.

11
Figure 6: Agrifood value chain Source: Memedovic & Shephard, 2009.

12
This study will focus primarily on activity 3, Post-farm production and services, with special emphasis on
the agri-food processing, packaging and preservation section. This report starts with a summary of all
previous research conducted on the maize milling industry in South Africa, SADC and the rest of the
world.
Agro-processing has the potential to stimulate economic growth and provide socio-economic impacts
such as creating employment and generating income for the rural populace. Some estimates suggest
that in developed countries, up to 14 percent of the labour force is involved in agro-processing sector
directly or indirectly (Kachru, 2009). The growth of the Indian and Chinese agricultural sectors serves as
examples of the power which rural development possesses, and how a previously untapped resource
can be utilised to benefit the entire economy. It is therefore imperative that obstacles facing the
development of the rural agro-processing sector be identified and permanently dealt with, in order to
accrue these benefits as well as to facilitate future public and private investment.
2.2 INTERNATIONAL SECTOR
Background
The international processing sector includes all countries except South Africa and the other SADC
member countries. The focus of the section would be more on the developing countries as South Africa
is still developing. Studies to be used as possible guidelines for the South African agro processing
industry are mainly from China and India. These studies identified problems, challenges, constraints
and limiting factors that may hamper the expansion of the various agro processing industries. A SWOT
analysis was done on the Indian maize processing sector; this led to the identification of objectives and
strategies to achieve the identified objectives. The FAO also came up with many possible advantages
to a country’s economy if the agro processing sector is to be stimulated. With proper management of
the agro processing industry these advantages can also be possible for the South African economy.
MAIZE SECTOR
According to the study, Agro-Processing Industries in India—Growth, Status and Prospects (2001),
conducted by R. P. Kachru there are numerous problems that need to be addressed to enable the
Indian processing sector to become globally competitive. These are:

13
• Obtaining sufficient working capital,
• Better management of the obtained capital,
• Improved utilization of capacity,
• Attending to the unreliable supply of electricity,
• Increase the quality of raw products,
• Adequate removal of finished products from raw products,
• Increased profitability of maize production.
A SWOT analysis stating the strengths, weaknesses, opportunities and threats faced by the Indian agro
processing sector was also conducted by Kachru. This analysis can be used as a guideline for
improving South Africa’s current maize processing industry.
STRENGTHS
• All year availability of agro produce.
• Social tolerance and government support of the agro processing sector.
• Large number of manufacturing facilities country wide.
• Growing domestic market.
WEAKNESSES
• High working capital needed.
• Reliable and better accuracy equipment and instruments are not readily available.
• Poor information management.
• Low attractiveness of compensation in the industry.
• Poor linkages between research and development labs and the agro processing industry.
OPPORTUNITIES
• Agro ecological variability provides a vast crop and material base that may strengthen the agro
processing sector.
• Possible integration between the agro processing sector and the contemporary technologies.

14
• Employment and additional income can be generated by exporting India’s developed technologies
as a result of participation in the global market.
THREATS
• Global competition.
• Outflow of trained employees to other industries as a result of better working conditions abroad.
• Fast developments in modern requirements of the agro processing industry may lead to fast
obsolescence.
The Himachal Pradesh (a state north of India) Department of Agriculture (HP Agri Dept, 2005) did a
study on their maize processing industry and specifically the Maize and maize processing units.
During this study the following limiting factors were found:
• Lack of regular water supply of needed quantity.
• Maize is the staple food of the country’s population and doesn’t demand processed maize products.
• No organized marketing of processed maize.
• Maize availability is limited to one season
• The starch demand is low and growth is slow.
• Poor railway system.
• High cost of transportation of raw and processed materials influence market competitiveness.
A study conducted by Youning, S and Zhongdong, L regarding China’s maize processing industry,
completed in May 2009 revealed the following challenges that the Chinese processing sector face:
• China’s maize conversion is slower than in other developed countries. China uses 65percent of
all maize produced as animal feed, but 40percent of this is used directly and unprocessed. This
lessens the maize conversion rate even more and hampers the utilization of maize as high value
straw and corncobs are wasted.
• China only plants a single species of maize while the processing industry requires a variety to
supply in the different needs of consumers. These other varieties have as a result not been
promoted and developed as they should have been.
• The lack of proper safety and hygiene standards. There are a large gap between China and other
developed countries as China has different standards for food and feed processing.

15
• China’s maize quality standard system is not clear and needs to be defined properly to ensure the
quality of the processed product.
• Most of China’s maize processing plants are small scale enterprises, because of this they often
lack human resources, have low production levels and face high costs and are poorly managed.
This hampers China’s ability to shape a proper maize industry chain.
• Incompatibility of the livestock, maize production and maize processing areas in China is another
hindrance. There usually exist a waste of maize resources in the north and a shortage in the
south.
• Although the Chinese feed industry has grown rapidly the livestock production sector could not
keep up with the pace of the feed production sector (Youning & Zhongdong, 2009).
In 2003 Tongsiri and Alam did a study on the Promotion of Agro-Processing Industry in
Bangladesh: Potentials Constraints and Policy, during 2003. In this study Tongsiri and Alam
identified many economic advantages that would arise if the agro processing sector were to be
stimulated.
• Higher crop prices due to higher demand for processed products.
• More opportunities for women to process raw products at home for home consumption or to sell
as additional household income.
• The seasonal fluctuation of prices will be reduced if raw agricultural produce are processed into
products that is less prone to perish.
• Producers will have increased bargaining power during off seasons if produce can be processed.
• Foreign exchange can be earned if raw produce can be processed to meet international
standards and exported without the fear of losses due to spoilage.
• Reduction in unemployment as a result of value addition.
• The most important advantage is value addition, this will increase employment and profits and will
bring about consumption of more diversified products.
During this study a few constraints were also identified that may hamper the expansion of the agro
processing sector in Bangladesh.
• There exist no policy-guidelines for investors who want to invest in the sector as a result there
are not enough investors involved in the industry.

16
• The industry lacks a central agency that manages the sector in a timely and logical manner.
• No national committee to ensure agro industry development.
• The amount of raw materials supplied is not efficient and sometimes not suited for processing.
• There exists a shortage in employees trained in the food processing field.
• Research and development is hampered by inadequate financial assistance as well as a lack of
skills.
• Appropriate technologies are needed to process many of the agricultural produces.
• There exists a shortage of processing equipment since most of the equipment is imported at
high prices.
• A special programme for institutional loans for the processing of food should be granted to help
entrepreneurs to enter the processing industry.
The following recommendations were made to accomplish momentum in the countries agro processing
industry:
• Government should establish a national agro industrial policy to help and support the activities
and development of the agro industry in Bangladesh.
• The industry needs a Development Division to serve on behalf of the National Committee as the
coordinating body of the agro processing sector.
• The Ministry of Agriculture needs to solve the problem regarding the availability of raw materials
for processing by conducting experiments and doing research on different varieties available and
suited for processing.
• Government should realise the need for trained people to work in the agro processing industry
and support universities to produce the qualified graduates needed in fields such as food
processing, food science, food engineering and agricultural marketing and agribusiness.
• The research and development institutes in Bangladesh need financial assistance.
• Intermediate technology needs to be improved to ensure that produce of high quality that meets
international standards are produced.
• Food processing equipment needs to be produced locally; this will reduce costs and create job
opportunities.
• Investors should be encouraged to invest in the agro processing industry in Bangladesh and
government should increase assistance in the form of soft loans, relaxing tax duties on
processing equipment as well as assisting with the marketing of processed goods and ensuring
that information on the sector is readily available (Tongsiri and Alam, 2003).

17
In 1997 the FAO completed a study The Agro-processing Industry and Economic development.
This study attempted to examine some of the issues in the global agro processing sector as well as
assessing the role, if any, that the agro processing sector plays in the economic development of a
country. The potential of an agro processing industry of a developing country depends on:
• The abundant availability of agricultural raw material. Abundant raw material will offset the
disadvantage of poor infrastructure and unskilled labour.
• Availability of cheap labour.
• The small markets that exist in developing countries make small agro processing plants
economically efficient.
• Transport costs are usually lower after a product has been processed.
• It is possible to relieve high rural unemployment statistics when agro-processing plants are set up
in rural areas.
The study also showed that, in the case where a possible plant has technical freedom plants tend to be
located closer to the market or in urban areas because:
• there exist a greater labour supply,
• distribution cost are lower,
• infrastructure is efficient.
2.3 SOUTHERN AFRICAN DEVELOPMENT COMMUNITY (SADC)
Background The SADC region consists of a total of 14 countries: South Africa, Botswana, Mozambique, Angola,
Malawi, Mauritius, Namibia, Swaziland, Lesotho, Zambia, Zimbabwe, Tanzania, Democratic Republic of
the Congo (DRC) and Seychelles. Madagascar used to be a member but was suspended due to
political turmoil. As developing countries, all of the aforementioned countries rely heavily on social and
economic development and one sector that contributes to this is a strong agricultural sector. The section
to follow provides an overview of the relevant literature available on the agro-processing industries of
countries located in the SADC region. Agro-processing plays an important role in developing countries’
agricultural sectors and is crucial for food security.

18
Section 1.3 provides an overview of relevant literature on agro-processing in SADC with special focus
on maize/wheat milling. It was noted that vary few studies report on agro-processing in the SADC
region. As a result, for the SADC section a literature review is provided for both maize and wheat.
Previous studies conducted
Although literature on South Africa’s agro processing sector exists, few studies describe the role of the
other countries located in the SADC region. Few studies identify the role of the small wheat/maize
millers in the SADC countries. As a result, the section to come reports on commodity specific studies
followed by studies conducted on agro-processing in general. Conclusions and recommendation will be
supplied at the end of the overview.
Commodity specific studies in SADC A significant study by the Zambian Ministry of Agriculture in cooperation with the Food Reserve Agency,
Zambia National Farmer’s Union and Zambian Cooperatives formulated a National Food Balance Sheet
(NFBS) for staple crops in this country. The main objectives of the study were to provide up-to-date
information on food supply and demand and to provide this information to policy makers to assist in
policy making and priority setting.
The specific objectives of the study were:
• To determine the current cereal demand in stock feed, brewing and seed industries
• To review current assumptions on human consumption needs
• To update information on on-farm and industrial losses
• To recommend a system to update the NFBS periodically throughout the year
The methodology in obtaining relevant information was to interview a sample of all of the major millers,
brewers and seed companies in Zambia. Secondary data was obtained from the Central Statistical
Office (CSO).
The Zambian Ministry of Agriculture and Cooperatives and the National Early Warning Unit (NEWU)
release a NFBS yearly after a crop forecast is done. An example of this balance sheet is given in Table
1.
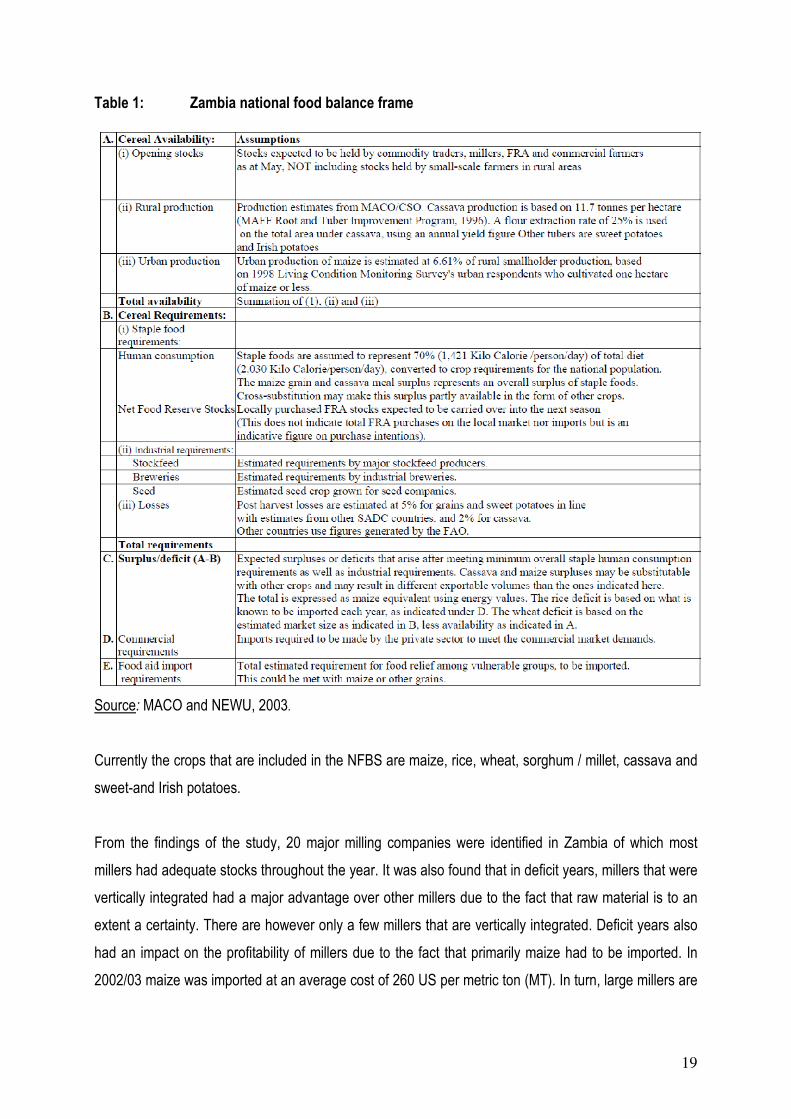
19
Table 1: Zambia national food balance frame
Source: MACO and NEWU, 2003.
Currently the crops that are included in the NFBS are maize, rice, wheat, sorghum / millet, cassava and
sweet-and Irish potatoes.
From the findings of the study, 20 major milling companies were identified in Zambia of which most
millers had adequate stocks throughout the year. It was also found that in deficit years, millers that were
vertically integrated had a major advantage over other millers due to the fact that raw material is to an
extent a certainty. There are however only a few millers that are vertically integrated. Deficit years also
had an impact on the profitability of millers due to the fact that primarily maize had to be imported. In
2002/03 maize was imported at an average cost of 260 US per metric ton (MT). In turn, large millers are

20
forced to stock pile up to 50 000 MT and, as found in the study, losses due to storage ranged from 2.5 –
5 percent.
Table 2 indicate the results obtained from 19 millers that were included in the sample. It can be noted
that a total of 900 758 MT of maize was processed in this year with a capacity of 1 136 878. Thus,
milling capacity of these millers stands at 82 percent. .
Table 2: Production and capacity utilisation of millers interviewed
Millers* Annual Installed Capacity (Maize
Equivalent)
Annual Mealie Meal Production MT (Maize
Equivalent)
Capacity Utilisation
(%)
A 43 800 27 456 63
B 7 110 6 078 85
C 3 250 3 000 92
D 43 805 37 333 85
E 105 120 18 931 18
F 43 200 40 000 93
G 83 950 71 760 85
H 13 141 12 480 95
I 30 660 26 208 85
J 87 062 82 680 95
K 87 600 74 880 85
L 113 880 96 798 85
M 43 200 36 720 85
N 43 200 36 720 85
O 162 000 137 700 85
P 127 750 108 586 85
Q 28 800 24 480 85
R 32 850 27 923 85
S 36 500 31 025 85
Total 1 136 878 900 758 82
Source: Zambian Ministry of Agriculture – Field data, 2004.
Notes: *Assume 365 Working Days a year and an extraction rate of 90% for mealie meal. Assume 85% capacity utilization where information is missing.
In addition to the major millers described in the section above, Zambia also have a few hammer mills
located in some of the rural areas. In the study under discussion, 10 hammer mills were visited. The
study found that the average maximum capacity for a hammer mill was 0.4 MT to 1.5 MT per day. Easy
entry and exit of operators were evident in the findings due to the low state up capital needed for a

21
hammer mill. Thus implying, low barriers to entry and exit in the Zambian small scale maize milling
industry.
The recommendations of the study were that a full survey of all of the operational hammer mills in the
urban and rural areas be done to establish effective demand for maize. From these figures a more
accurate estimate of human consumption can then be made from urban and rural demand from
conventional (larger) millers and hammer mills. The study mentioned that inadequate data obtained
from all miilers and hammer mills, hampered the establishment of human consumption requirements.
The study described above looked at the total balance sheet, but due to the objectives of this study, we
reported on maize milling only. One important result brought upon by the study is the construction of a
proposed frame that will assist in the update of the Zambian National Food Balance. This frame can be
seen in Figure 7.
Figure 7: Proposed frame for development and periodic update for the Zambian National
Food Balance Sheet
Source: Zambian Ministry of Agriculture, 2004.
Agro processing in SADC Wellington and Mwangola (2006) looked at the principal objectives of giving priority to the development
of food processing in the context of agriculture-led development strategy. These objectives are:

22
• To meet urgent food and nutritional needs
• To reduce the qualitative and quantitative losses of agriculture products
• To promote exports in Africa
• To stimulate the development of technological capabilities
• To develop engineering capabilities in food processing
Wellington and Mwangola (2006) are of opinion that food processing is flourishing in countries
worldwide but why not in Africa? They also identify that the aforementioned objectives can only be
achieved by “learning by doing” and if achieved will provide experience. This will serve as a valuable
learning guide for industrialisation in Africa. From all of the sectors, the agro-processing sector is
responsible for 50 percent of manufacturing value adding in Africa according to Wellington and
Mwangola (2006).
Wellington and Mwangola (2006) however identified various factors that are constraining Africa and thus
the SADC region’s agro-processing industries. These factors are:
• Insufficient agricultural, industrial and economic policy
• Poor integration between sectors: agriculture, manufacturing and trade
• Mistakes in the establishment of enterprises
• Inadequate technologies
• Inability to adapt to international markets
• A lack of sectoral integration
• Poor infrastructure
• Economical issues
These factors must thus be attended to in ensuring growth in African agro-processing. Wellington and
Mwangola (2006) concludes that the food industries have tactical and catalytical roles to play within
agricultural-led development strategies in Africa. Training and Research and Development (R&D) are
however crucial to build and sustain entrepreneurial capacities in the food processing industry in Africa.
There are however according to Wellington and Mwangola (2006), research stations that are well poised
to contribute to the development of food industries in Africa. This means that there is potential for
growth in agro-processing in Africa if all of the constraints are attended to and improved on.

23
Various other studies were conducted on the SADC region and included the respective countries’ agro-
processing sectors as a part of their agricultural sector in an attempt to identify their role in trade in the
SADC region. Brenton, Flatters and Kalenga (2005) looked at the rulers of origin and their importance in
preferential trade agreements to ensure that only eligible products receive tariff preferences. The study
just mentioned, may seem irrelevant to the aim of this study, but may provide new insights into tariff
arrangements for imported maize/wheat in the SADC region.
Another study conducted by the Famine Early Warning Systems Network (2007) gave a cross-the-
border trade update for Malawi. Once again this study gave an overview of trade in Malawi and special
focus was placed on maize and wheat. From Figure 8 is noted that maize imports have decreased
dramatically form 2005/06 – 2007/08. This can mainly be attributed to a higher production in Malawi.
These issues are also important in constructing a food balance sheet for the SADC region, thus
illustrating this study’s significance in this literature overview.
Figure 8: Informal maize import: Malawi, 2005/06 – 2007/08
Source: FEWSNET/Malaw, 2007.
24
The other studies that were viewed for this project looked at economical growth and especially
agricultural growth and poverty elevation in Africa. These studies include:
• Johnson, Omilola, Flaherty, Makombe, Macneil and Horowitz (2008). This study aimed at
monitoring agricultural sector performance, growth and poverty in Africa
• Chilonda and Minde (2007). The authors looked at agricultural growth trends in Southern Africa
• Two studies by the New Partnership for Africa’s Development (NEPAD) was viewed: The first
conducted in 2009 focussed on the comprehensive Africa agricultural development programme
(CAADP), and the second looked at a framework for the improvement of rural infrastructure and
trade-related
• Diao, Fan, Headey, Johnson, Pratt and Yu (2008) focussed on Africa’s food production in
response to rising food prices
• Fan, Johnson, Saurkar and Makombe (2009) looked at investing in African agriculture to halve
poverty by 2015
• Lambert and Macniel (2009) focussed on Malawi in achieving agricultural development and
economic growth
• Chilonda, Machete and Minde (2007) completed a study on poverty, food security and agricultural
trends in Southern Africa
• Chilonda, Olubode-Awosola and Minde (2009) conducted a study on trends in agricultural growth
and performance in Southern Africa
These studies mentioned above are not applicable to the agro-processing industries and were thus not
described in detail. The studies included in this overview, provide an overview of some of the most
significant studies conducted in agro-processing for the greater SADC region.
2.4 SOUTH AFRICA
MAIZE SECTOR
Only studies conducted after 1996 were taken into consideration. It is not necessary to look at any
studies prior to 1996, as the deregulation process removed the primary link between the producer and
processor, the Maize Board. Emphasis is placed on studies conducted after 2000, as it was only during
the early part of this century that South Africa was fully integrated into the world arena and was, as

25
such, influenced by the emergence of global value chains. The focus is furthermore limited to
processors in the maize value chain. The study is limited to maize millers, both wet and dry milling.
It is necessary to define maize milling and other relevant key definitions in the maize milling sector
before the results of previous studies can be analysed. Milling is used as a term for grinding, when a
grain cereal (such as maize) is crushed to meal (Wesley, 2003). De-hulling refers to the removal of the
bran and aleurone layers (pericarp and seed coat) of grains like maize (Wesley, 2003). Service milling
or swap milling is a system within which customers bring small quantities of grain to a mill to be milled at
a certain fee. The milling capacity of these millers is typically very small and they usually operate
hammer mills or small roller mills. Production milling is a system within which millers purchase and
store grain in order to produce maize meal to sell to customers.
Hammer milling is the process whereby particles are reduced in size by rapidly moving surfaces. Roller
mills have a gradual reduction process, by breaking down the grain in a series of grinding stages by
using a succession of grinding rollers of different types. Before roller mill grinding maize kernels have to
be de-germed and de-hulled (Bekker, 2004).
In order to classify maize millers according to size, the following criteria are suggested by Wesley
(2003). Large and very large millers mill over 4 Metric Tons (MT) per hour. Medium-scale millers mill 1
to 4 MT per hour and include hammer mills and roller mills. Small-scale mills are involved in village
level processing of 100kg to 1 MT per hour. The small-scale mills category includes mills engaging in
custom milling of small quantities of grain for customers (e.g. 15 to 25kg batches). Small commercial
mills operating at 100 to 500 kg per hour are also included in the small-scale miller category. According
to Dr Phillip Randall an expert in small maize milling in South Africa, small maize mills produce on
average less than 3000MT per month (NAMC, 2003).
Another possible miller classification system is the National Small Business Act, providing a
classification guideline in terms of the number of firm employees, turnover per annum and the value of
assets. The classification of manufacturing firms according to the National Small Business Act is shown
in Table 3 below.

26
Table 3: The classification of manufacturing firms according to the National Small
Business Act
Size or class: Total full-time
equivalent of paid
employees. Less
than:
Total annual
turnover. Less
than:
Total gross asset
value (fixed
property excluded).
Less than:
Medium 200 R40 m R15 m
Small 50 R10 m R3.75 m
Very small 20 R4 m R1.5 m
Micro 5 R0.15 m R0.1 m
Source: National Small Business Act, 1996
A final miller classification system proposed in the Tshwane University of Technology Training Manual
on Food Fortification classifies millers according to the amount of grain that can be cleaned and ground
in 24 hours. Since small millers usually do not operate for more than 8 to 12 hours per day, their
production capacity is expressed in MT per hour. According to this classification mills with a big
capacity (usually roller mills) have a capacity range of 240 to 1200 MT per day. On the other hand mills
with a small capacity (usually single-stage mills) have a capacity of 0.2 to 1.5 MT per hour (Vermeulen
and Kirsten, 2006).
There were, according to the National Agricultural Marketing Council (NAMC) (2003) at least 190
companies involved in maize milling. The average milling capacity utilisation is 3.7 million tonnes or 79.5
percent of the available capacity. The potential capacity is in the order of 5 million tonnes. Twenty-two
companies are responsible for generating 85 percent of all maize milled within the country with the top 4
companies accounting for 73 percent of total market share (De Villiers & Moloitsane, 2003, NDA, 2006).
During 2006, a report was compiled for the National Agricultural Marketing Council (NAMC) by
Vermeulen and Kirsten (2006) on Small Scale Maize Millers and Consumers in the Limpopo
Province. The focus of this research was to provide policy makers with information that could help with
policy implementation that can result in improved smallholder welfare and urban and rural food security
through improved maize marketing and trade systems and minimum cost to the national treasuries. The
research aimed to answer the questions whether a small-scale maize miller (that currently only engaged
in service milling for customers), could operate a profitable business by procuring maize grain from

27
nearby commercial silo’s, in order to engage in production milling and consequently the marketing of
their own maize meal brands. The second research question was whether such an initiative could
actually lead to a more affordable maize meal for consumers.
This research project, investigating maize consumption and the informal maize marketing system in the
Limpopo Province of South Africa, formed part of a larger project of the Food, Agriculture and Natural
Resources Policy Analysis Network and the Department of Agricultural Economics at Michigan State
University, entitled “Toward improved country-level maize marketing and trade policies to promote
household food security in Southern Africa”. The Department of Agricultural Economics at Michigan
State University (MSU) was represented by Prof TS Jayne and Mrs Lulama Traub. The researchers
from MSU undertook a similar study in the informal maize marketing system in the Eastern Cape
Province.
The study found that very little is known about maize consumption behaviour and small-scale maize
millers in terms of their milling practices, marketing margins and maize procurement practices.
Consumers’ maize meal choices were driven by factors such as affordability, habit, taste, hygiene and
convenience. The results from the study indicated significant differences between the Venda and
Sepedi consumers. The Sepedi consumers prefer commercial maize meal to service milling maize
meal and only 19 percent of these consumers ever used a service mill. On the other hand the majority
of the Tsonga consumers (55 percent) preferred service miller maize meal, while the Venda consumers
were divided between the two types of maize meal.
In terms of commercial maize meal preferences, super maize meal and special maize meal was the
most popular choices among all the ethnic groups. The most important purchase location of commercial
maize meal was supermarkets, followed by large co-operative mills and small local shops.
The study also looked at the possibility of maize meal fortification and found that none of the
village/rural millers does any fortification. The commercial millers’ results varied from 64 percent of
commercial millers in the Limpopo Province to 100 percent in Mpumalanga that engaged in the
fortification process.
Traub and Jane (2006) found that the maize market reform in South Africa did not reduce processing
and retailing margins in the maize meal supply chain. It is contrary to ex post studies done in
neighbouring countries. The study aimed to determine actual and potential consumer demand for the

28
types of maize meal capable of being produced by small-scale mills, to measure the potential impact of
small-scale grain retailing and milling channels on households’ disposable income and food security,
and to identify the factors responsible for the negligible role of small-scale milling sector in South Africa.
Surveys of households, small-scale millers, and large-scale millers were conducted within the Eastern
Cape Province. The study highlights four main findings. First, the maize marketing system, in particular
small scale millers, in the Eastern Cape does not respond to the preferences of many consumers.
Second, many local small millers were unaware of this potential demand for their services and the role
they could play in promoting food security in the area. Third, positive benefits could accrue to
consumers through the reduction in the proportion of monthly income devoted to maize meal purchases,
particularly in the case of low-income consumers, if the informal marketing and milling networks could
be developed to operate through the year. And lastly, lack of market information, the inability of milling
agents to perceive marketing opportunities appear to be the major barriers to small-scale millers
entering into production milling.
Kirsten, Edwards and Vink (2007) conducted a study to determine the Distortions to Agricultural
Incentives in South Africa. It formed part of a research project on Distortions to Agricultural
Incentives, under the leadership of Kym Anderson of the World Bank’s Development Research Group
(www.worldbank.org/agdistortions). The Nominal Rate of Assistance (NRA) was calculated for various
commodities. For the calculation of NRAs for wheat flour, Randfontein (where the major millers are
located) was again used as the reference point. The NRA for wheat flour is positive and large (average
of 58 percent from 1995-2005) and also rose from the 1980s to the 1990s. This reflects the reduction in
the distortion on primary wheat during the 1990s as well as tariff escalation and general protection on
wheat flour (average of 37.5 percent from 1996-05). The NRAs for maize flour fluctuated considerably.
Average NRAs for maize flour also appear to have declined from the early 1990s, although they have
risen with the appreciation of the currency since 2002. The overall results of the analysis confirmed the
general perception that since the mid-1990s South African agriculture on average has been operating in
a non-distorted environment, where the net effect of price-distorting policies on aggregate resource use
in agriculture seems to be neutral.
Orefi Abu (2007) presented a paper with the title: Impediments to Competitiveness of Small and
Medium-Scale Maize Milling Enterprises in South Africa at the AAAE conference during 2007.
Despite the benefits and opportunities brought about by the deregulation of the South African maize
market in 1996, the maize milling industry is still highly characterised by continuous growth in maize
milling and retailing margins in real terms (Truab and Jayne, 2004). This may be indicative of the

29
inability of small and medium-scale maize milling enterprises (SMSMMEs) to emerge and compete with
large-scale maize millers. This paper examined the constraints faced by SMSMMEs in South Africa.
Data were collected with the aid of a structured questionnaire. Millers were asked to identify the various
challenges facing their enterprises. Some key constraints identified were; high transport costs, high
maize prices, brand name establishment and government policies such as the compulsory maize meal
fortification regulation and high taxes. Other perceived constraints included lack of adequate
infrastructure, storage facilities, access to credit and seasonality of maize grain.
An article by Parhanse (2007) provide a case study of planning for pro-poor local economic
development (LED) in Senqu municipality, Eastern Cape Province, one of South Africa’s poorest
regions, to show how LED planning is providing an impetus for reversing economic decline in some
small towns.
Abu and Kirsten (2009) presented a paper at the International Agricultural Economists conference titled
The South African Maize Milling Industry: Can Small and Medium-scale Maize Milling Enterprise
Survive and Thrive? The paper investigated the competitiveness of small and medium-scale maize
milling enterprises in South Africa. Results suggest that small and medium-scale maize mills in South
Africa are cost-inefficient, operating as much as 59 percent and 30 percent higher cost than the best
practice respectively. It implies that about 59 percent and 30 percent of the costs incurred by small and
medium-scale maize mills respectively can be avoided without a reduction in maize meal output. These
mills could become competitive if they are able to reduce costs by 59 percent and 30 percent
respectively, thus creating the much needed competition in the maize milling industry. Results further
showed that some mill-specific characteristics such as education, mill size, age of mill and location
could contribute significantly to mill-level efficiency.
2.5 CONCLUSIONS AND RECOMMENDATIONS
2.5.1 INTERNATIONAL SECTION
Information of only a few international agro processing studies is available. This hinders the
effectiveness and accurateness of the conclusions and recommendations made in the international agro
processing sector. In die Indian study (Kachru, 2001) the main objective was to improve certain areas
to increase global competitiveness. They also identified strengths, weaknesses, opportunities and
threats to further improve the agro processing sector’s situation. The study done by the Chinese also
mainly focused on increasing global competitiveness to get the agro processing sector up to a standard

30
where it is possible to export their processed produce. The Bangladesh study was done from an
economic angle where many advantages for the country’s economy were highlighted if the agro
processing sectors where to improve. The FAO study further highlighted the potential of agro
processing industries in developed countries as well as the importance of proximity to the consumer-,
labour- or capital market of the processing plants and the various constraints and advantages regarding
this.
2.5.2 SADC SECTION
From the literature cited it can be concluded that very little literature on agro-processing, and more
specifically on maize and wheat processing, exist for the SADC region. The most significant study
reviewed was perhaps the study conducted by the Zambian Ministry of Agriculture. They conducted a
study on the Zambian Food Balance Sheet and identified the role that conventional millers and hammer
mills play in the agro-processing sector in Zambia. Other studies included did not go into so much detail,
and just highlighted either the maize or wheat sector or agro-processing in general.
It can be concluded that no study reports on the actual agro-processing situation with regards to
wheat/maize in the SADC region and the barriers to entry for smaller role-players in these industries.
Adequate information with regards to the amount of role-players in the milling industries in SADC is also
needed to assist with future studies on agro-processing in SADC.
2.5.3 SOUTH AFRICAN SECTION
Various studies were conducted in South Africa on the maize milling industry. Little conclusions and
recommendations were found that addressed the challenges faced by the maize milling agro processing
industry in the Free State and North West Provinces. All conclusions and recommendations from the
previous studies will be taken into consideration when personal interviews will be conducted with the
respondents.

31
CHAPTER 3 MARKET OVERVIEW
The following section provides an in-depth overview of the current state of the maize sector. Special
emphasis is placed on the global, Southern African Development Community (SADC) and South African
maize sectors. The main purpose of the global overview section of this market overview is also to
identify current trends as far as stock levels, production levels and consumption levels are concerned. It
also extends into the challenges and issues faced by the industry as well as a Porter analysis aimed to
discuss the competitiveness in the global maize sector. The South African section aims to identify
current South African trends as far as stock, production and consumption levels are concerned. The
South African maize supply chain is also discussed. The aim of the market overview is to understand
the current state of the global maize sector. From this, a more precise and concentrated study can be
conducted to identify the factors that limit agro-processing development in the maize milling industry in
rural areas.
3.1 GLOBAL OVERVIEW
Maize is the third most planted crop in the world. Although it is mostly used as feed and as a food
staple, it is also used in industrial products as well as in the production of ethanol (Abbassian, 2009).
3.1.1 STOCK LEVELS
Figure 9 shows the ending stock of maize in thousand tonnes. Global maize stock levels showed an
increase from the 2007/08 to the 2008/09 marketing season. China, the second largest producer of
maize, is largely responsible for the increase in the global maize stocks as the ending maize stock in
China grew by 34 percent from 40.4 million tonnes in 2007/08 to 54.2 million tonnes during the 2008/09
marketing season. The largest producer of maize, the United States (the U.S.) showed a 4.5 percent
increase in the maize ending stocks from 45.1 million tonnes in 2007/08 to 47.1 million tonnes in
2008/09 (Bordbia, 2009; USDA, 2009).

32
Figure 9: Maize ending stocks Source: Bordbia, 2009.
Table 4 indicates the world maize supply and utilization balance sheet for 2008/09. According to FAPRI
(2009), 157 376 000 hectares of maize were harvested at an average yield of 5.03 ton/hectare leaving
world maize production at 791 039 000 tonnes and beginning stocks for 2009/2010 at 128 218 000
tonnes. Feed, food and other usage amounted to 783 676 000 tonnes leaving world ending stocks at
135 582 000 tonnes for the 2008/09 marketing season.
Table 4: World maize supply and utilization
2008/09 Area Harvested (1 000 ha)
157 376
Yield (tons/ha)
5.03
Production (1 000 tons) 791 039 Beginning Stocks (1 000 tons)
128 218
Domestic Supply (1 000 tons)
919 257
Feed Use (1 000 tons) 486 602 Food and Other (1 000 tons)
297 074
Ending Stocks (1 000 tons) 135 582 Domestic Use (1 000 tons)
919 257
Trade* (1 000 tons) 69 601
Stocks-to-Use Ratio 17.30 *Excludes intraregional trade Source: FAPRI, 2009.
0
10,000
20,000
30,000
40,000
50,000
60,000
70,000
2004
/200
5
2005
/200
6
2006
/200
7
2007
/200
8
2008
/200
9
2009
/201
0
2010
/201
1
En
din
g S
toc
ks
(1
00
0 M
T)
China United States Other

33
3.1.2 PRODUCTION LEVELS
Figure 10: Total U.S. maize production illustrates the total U.S. maize production in billion bushels
from 1973 to 2008 with the estimated crop production figures for 2009 and 2010. A definite increase in
the total maize production is noted from 1973 to 2009 in the United States but because the United
States is globally the largest producer of maize we expect an increase in the world maize production for
the next 30 years as well. The United States reached an unprecedented high maize production of 13
billion bushels in 2007. According to the Crop Production 2009 Summary (2010) released by the U.S.
Department of Agriculture’s National Agricultural Statistics Service (NASS), the maize production for
2009 was 13.2 billion bushels; up 1 percent from the 13 billion bushels in 2007, making the maize
harvest in 2009 the new record maize harvest (USDA, 2010).
Figure 10: Total U.S. maize production Source: Agmanager, 2010.
Figure 11 shows the maize yields in the United States from 1970 to 2008. From 1996 a definite increase
in the yield can be observed. Yields increased by approximately 11.6 percent from 2005 to reach 165.2
bushels per acre. In 2004 the maize yields in the United States reached a record high of about 160
bushels/acre. However, according to the latest crop production summary released by the NASS maize
yields reached an unparalled high of 165.2 bushels per acre (USDA, 2010).
0
50,000
100,000
150,000
200,000
250,000
300,000
350,000
400,000
1975
/197
6
1978
/197
9
1981
/198
2
1984
/198
5
1987
/198
8
1990
/199
1
1993
/199
4
1996
/199
7
1999
/200
0
2002
/200
3
2005
/200
6
2008
/200
9
Harvest Year
Co
rn P
rod
ucti
on
(1000 M
T)

34
Figure 11: Maize yields in the U.S. Source: Agmanager, 2010.
3.1.3 CONSUMPTION LEVELS
Approximately 65 percent (460 million tonnes) of total global maize production is utilized for feed
purposes, 15 percent for food and the remainder is used in industrial products. Maize consists of 61
percent starch, 16 percent moisture, 11.2 percent fibre, 8 percent protein and 3.8 percent oil
(Abbassian, 2009).
Figure 12 shows the leading countries that use maize as animal feed. Maize is commonly used as
animal feed because of its high energy content. Together the U.S., China, the European Union and
Brazil, make up approximately 70 percent of the global use of maize as animal feed.
Figure 12: Maize for animal feed Source: Abbassian, 2009.
0
2
4
6
8
10
12
1975
/197
6
1978
/197
9
1981
/198
2
1984
/198
5
1987
/198
8
1990
/199
1
1993
/199
4
1996
/199
7
1999
/200
0
2002
/200
3
2005
/200
6
2008
/200
9
Harvest Year
Co
rn Y
ield
(M
T/H
A)
Brazil
8%
China
22%
European Union
10%
United States
29%
Other
31%

35
The use of maize as animal feed has risen from 2001 to 2006. The growth rates of various regions are
presented in Table 5: Feed use of maize by region below. Central America showed the largest
growth rate with 4.8 percent growth followed by Africa with a 4.3 percent growth rate. With 2.5 percent
growth rate, the developing countries, especially Africa and Central America, contributed the most to the
global 2 percent growth rate of maize used as feed.
Table 5: Feed use of maize by region in tons
Country 2005/2006 2006/2007 2007/2008 2008/2009 2009/2010 2010/2011
Central America
2,925 3,275 3,150 3,050 3,100 3,250
East Asia 124,064 127,075 128,474 129,999 130,380 133,180 European Union
47,000 49,200 51,000 47,500 43,500 43,500
Former Soviet Union - 12
10,643 10,509 11,235 12,920 11,670 13,162
Middle East
11,640 12,640 13,700 13,485 13,450 13,675
North Africa
12,850 13,750 13,450 13,525 14,450 15,425
North America
176,248 164,273 175,177 156,153 158,831 159,196
Oceania 410 300 350 375 365 365 Other Europe
8,717 8,283 7,086 7,071 7,300 7,375
South America
48,324 51,372 54,387 55,029 56,830 59,530
South Asia
7,600 8,000 8,400 9,100 9,100 9,600
Southeast Asia
19,112 19,772 21,399 21,618 22,325 23,625
Sub-Saharan Africa
5,995 6,730 6,695 7,580 8,480 8,580
World 477,608 477,364 496,838 479,540 481,916 492,698
Source: Abbassian, 2009.
Figure 13 illustrates the maize usage in the United States for food, alcohol and industrial products. The
graph show an upward sloping trend with maize usage increasing exponentially especially from around
2002. Maize usage for food, alcohol and industrial products totalled 5 billion bushels in 2008 and it is
expected to continue to increase in future.

36
Figure 13: Food, alcohol and industrial usage of maize in the U.S. Source: Agmanager, 2010.
The United States’ Feed and Residual maize usage increased until 2005 to reach approximately 6.2
billion bushels as indicated in Figure 14 after which it started to decline steadily up to 5.3 billion bushels
in 2008.
Figure 14: U.S. feed and residual maize usage Source: Agmanager, 2010.
0.00
1,000.00
2,000.00
3,000.00
4,000.00
5,000.00
6,000.00
7,000.00
1980
/81
1982
/83
1984
/85
1986
/87
1988
/89
1990
/91
1992
/93
1994
/95
1996
/97
1998
/99
2000
/01
2002
/03
2004
/05
2006
/07
2008
/09
2010
/11
Mil
lio
n B
u.
0
20,000
40,000
60,000
80,000
100,000
120,000
140,000
160,000
180,000
1975
/197
6
1978
/197
9
1981
/198
2
1984
/198
5
1987
/198
8
1990
/199
1
1993
/199
4
1996
/199
7
1999
/200
0
2002
/200
3
2005
/200
6
2008
/200
9
Harvest Year
Feed
& R
esid
ual
(1000 M
T)

37
Figure 15 indicates corn used for ethanol production as a percentage of U.S. corn production. The rising
oil prices and increasing demand of “green” fuels have supported ethanol production from maize which
led to the United States becoming the major producer of maize-based ethanol in the world. The figure
illustrates a steady increase in the percentage of ethanol produced from total U.S. corn production from
2002 (approximately 11 percent) to 2008 (about 30 percent).
Figure 15: Maize used for ethanol production as a percentage of U.S. maize percentage Source: Agmanager, 2010.
Figure 16 indicates the total utilization of coarse grains from 2005/06 to 2008/09 as well as the forecast
for the 2009/10 marketing season. A slight increase in the utilization can be seen and it is expected to
increase slightly during the projected period as well. The slight increase is the result of an increase in
‘other uses’ of coarse grains.
0
5
10
15
20
25
30
35
40
2002
/03
2003
/04
2004
/05
2005
/06
2006
/07
2007
/08
2008
/09
2009
/10
2010
/11
% o
f p
rod
ucti
on

38
Figure 16: Coarse grain utilization Source: FAO, 2009.
Figure 17 indicates that maize for feed use and ethanol use make up the largest part of maize utilization
in the United States. Maize utilization in the United States showed a slight decline from 2007/08 to
2008/09 but it is expected to increase during the 2009/10 marketing season to reach a level close to
325 million tonnes. This increase is expected to be driven mainly by ethanol production and exports.
Figure 17: Maize utilization and export in the U.S. Source: FAO, 2009.
0
200
400
600
800
1000
1200
2005/06 2006/07 2007/08 2008/09 2009/10
Mil
lio
n t
on
nes
Feed use Food use Other uses
0
50
100
150
200
250
05 06 07 08 09 10
Harvest Year
Bil
lio
n b
ush
els
Food, Alcohol & Industrial Corn Used for Ethanol
Feed & Residual Usage All Dom. Use
Exports

39
3.1.4 WORLD TRADE (IMPORTS AND EXPORTS)
Figure 18 indicates the total maize exports by the United States during the period 1973 to 2008 with a
forecasted 2009 figure. Maize exports by the United States depend to a large extent on the situation
regarding local maize supply as the United States will only export maize in years that they have a
surplus of maize. In 1975 as little as 1.15 billion bushels of maize were exported while as much as 2.45
billion bushels were exported in 2007.
Figure 18: U.S. corn exports Source: Agmanager, 2010. Table 6 shows the various maize importing and exporting countries during the 2008/09 marketing
season as indicated in the FAPRI outlook of 2009. The U.S. with 63 percent (44 071 000 metric tons)
and Argentina and Brazil with 13 percent (9 000 000 metric tons each) rank amongst the top maize
exporters. Japan is the world’s top maize importing country contributing 24 percent (16 500 000 metric
tons) to global maize imports, followed by other Latin American countries and Mexico with 15 percent
(10 585 000 metric tons) and 11 percent (7 900 000 metric tons) respectively.
0
10,000
20,000
30,000
40,000
50,000
60,000
70,000
1975
/197
6
1978
/197
9
1981
/198
2
1984
/198
5
1987
/198
8
1990
/199
1
1993
/199
4
1996
/199
7
1999
/200
0
2002
/200
3
2005
/200
6
2008
/200
9
Harvest Year
Exp
ort
s (
1000 M
T)

40
Table 6: Maize trade (thousand metric tonnes)
Rank Net Exporting Countries Exports (1000 MT)
1 United States 48,262
2 Brazil 10,000
3 Argentina 9,000
4 Ukraine 2,500
5 South Africa 2,000
6 Serbia 1,200
7 Paraguay 1,000
8 Russian Federation 1,000
9 India 1,000
10 Thailand 750
Rank Net Importing Countries Imports (1000 MT)
1 Japan 16,300
2 Korea, Republic Of 7,500
3 Mexico 7,500
4 Egypt 4,200
5 Taiwan, Province Of China 4,000
6 Colombia 2,900
7 Iran, Islamic Republic Of 2,900
8 Malaysia 2,600
9 Canada 2,400
10 Algeria 2,100
11 Chile 1,900
12 Syrian Arab Republic 1,900
13 Saudi Arabia 1,800
14 Morocco 1,600
15 Peru 1,500
16 Israel 1,300
17 Dominican Republic 1,000
18 Venezuela 900
19 Tunisia 800
20 Cuba 800
* Total net exports are the sum of all positive net exports and negative net imports.
Source: FAPRI, 2009.
3.1.5 PRICES AND PRICE CYCLES
Maize prices usually fluctuate between import parity and export parity prices. For short periods, maize
prices may move outside the import-export parity band, but market forces will soon rectify this. Maize
prices are mainly driven and influenced by fundamental factors. These factors also result in price
volatility in the maize as well as other commodity markets. The primary fundamental factors that
influence the maize market prices are the supply and demand of maize as well as the U.S. dollar. The

41
higher the supply, the lower the price of maize tends to be and the higher the demand the higher the
price of maize tend to be. A weaker U.S. dollar will result in a higher maize price (CME group, 2009).
Other macro fundamental factors include weather, world politics, consumer attitudes and tastes,
disruptions in distribution channels, interest rates, inflations, natural disasters and currency values (Zain,
undated). Figure 19 is an example of how sensitive the maize price is towards any fundamental factors.
According to Figure 19 the free on board United States maize prices showed a significant overall
increase from October 2009 (US$ 166) to December 2009 (US$ 178). The figure indicates the relatively
high volatility that the United States maize prices experienced during this period. During early October
cold, wet weather conditions hampered the United States maize harvesting process and reduced the
United States maize prices. Closer to the end of October, prices increased due to the high expected
United States maize harvest, these high prices were supported by the high demand for ethanol, high
brent crude oil prices as well as a weakening United States dollar. The drop in prices at the end of
October is a result of a stronger United States dollar, weaker share prices and favourable production
circumstances. The drop in prices in mid-November is due to wet conditions in the United States during
their harvesting season which caused a reduction in maize quality. The United States maize prices
dropped even further at the end of November attributable to high production and high maize stocks, that
impacted negatively on the demand of maize as feed, and thus on prices. The increase in maize prices
in December were mainly due to the European Union’s decision to allow the importation of GM maize as
well as the increase in maize exports to Mexico and Japan (GrainSA, 2009).

Figure 19: U.S. free on board prices and SAFEX yellow maize pricesSource: GrainSA, 2009.
Figure 20 indicates the high 2007/2008 and 2008/2009 US export prices of no. 2 Yellow Gulf maize
relative to the much lower 2006/2007 US prices.
reached US$ 180/t, the highest since October 2008 but still not as high as prices reported in June 2008.
Increases in energy markets, high CBOT prices, tighter export supplies and a decline in stocks in the
US and a weakening US dollar support high internat
U.S. free on board prices and SAFEX yellow maize prices
the high 2007/2008 and 2008/2009 US export prices of no. 2 Yellow Gulf maize
relative to the much lower 2006/2007 US prices. In May 2009, the price for No. 2 Yellow Gulf US maize
180/t, the highest since October 2008 but still not as high as prices reported in June 2008.
Increases in energy markets, high CBOT prices, tighter export supplies and a decline in stocks in the
US and a weakening US dollar support high international maize prices (FAO, 2009)
42
the high 2007/2008 and 2008/2009 US export prices of no. 2 Yellow Gulf maize
Yellow Gulf US maize
180/t, the highest since October 2008 but still not as high as prices reported in June 2008.
Increases in energy markets, high CBOT prices, tighter export supplies and a decline in stocks in the
(FAO, 2009).

43
Figure 20: Maize export price (no. 2 Yellow Gulf) Source: FAO, 2009.
3.1.6 FOOD SECURITY
Consumers of the world’s poorest nations are often the hardest hit when it comes to the food security
crisis. Consumers in these countries are suffering form severe, unrelieved malnutrition. The World
Health Organization (WHO, 2010) identified seven (7) factors that may add to the global food security
crisis. These are:
• Increasing prices of energy
• Insufficient investment in global agriculture
• Higher incomes and economic growth stimulate demand for food
• Subsidies leading to trade distortions
• Persistent unfavourable weather conditions and environmental degradation
• Subsidized bio-fuel production substituting the production of food
• Imposition of export limitations leading to hoarding and consumers buying out of panic.
According to the OPEC Fund for International Development (OFID) study done by International Institute
for Applied Systems Analysis (IIASA) in 2009 the cereals needed to produce the necessary biofuel will
come from altering three parts of the agricultural sector, Figure 21. Two thirds of the necessary cereal
will come from increased production (66 percent) and the other third will come from a reduced use of
0
50
100
150
200
250
300
Jul Aug Sep Oct Nov Dec Jan Feb Mar Apr May Jun
US
D p
er
ton
ne
2006/07 2007/08 2008/09

44
feed (24 percent) and a reduced use of food (10 percent). These reductions in feed and food use may
pose a threat to the already high global cereal demand and prices.
Figure 21: Where do cereals needed for bio fuel production come from? Source: Adapted from IIASA, (2009).
3.1.7 MILLING INDUSTRY
There is three different ways in which maize can be milled. This includes Dry milling, wet milling and
feed milling. The different techniques can be summarised as follows.
Dry milling
Maize can be processed through a dry milling process. This process yields grits, corn flour and some
corn meal. These dry milling units are able to crush 10mt/day and are relatively easy to set up anywhere
in a state as long as there are raw materials, electricity and land available (Jansamachar.net, 2005).
During the dry milling process the maize is monitored, tempered with steam or hot water to loosen the
germ and bran, and degerminated to eliminate the bran after which the husk is separated by aspirators.
The maize that is now degerminated is dried (moisture 15-15.5 percent), sieved and milled into grits,
flour and meal (Jansamachar.net, 2005).
Reduced feed
use
24%
Reduced food
use
10%Increased
production
66%
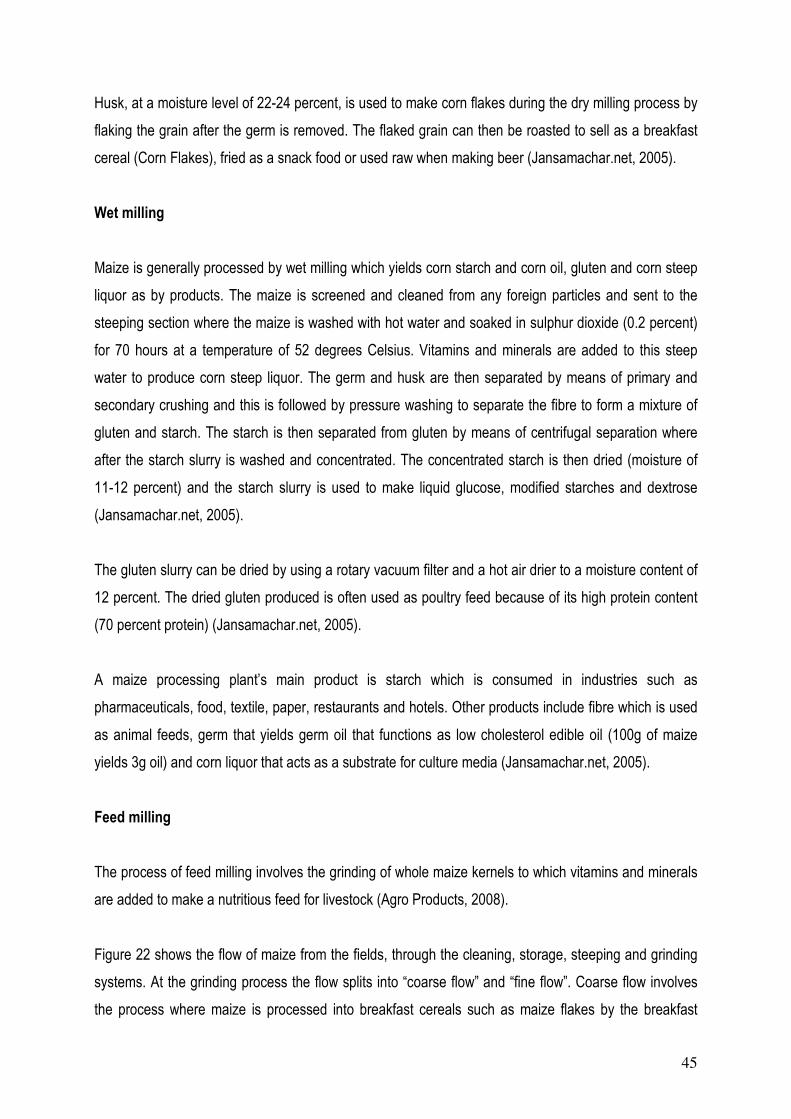
45
Husk, at a moisture level of 22-24 percent, is used to make corn flakes during the dry milling process by
flaking the grain after the germ is removed. The flaked grain can then be roasted to sell as a breakfast
cereal (Corn Flakes), fried as a snack food or used raw when making beer (Jansamachar.net, 2005).
Wet milling
Maize is generally processed by wet milling which yields corn starch and corn oil, gluten and corn steep
liquor as by products. The maize is screened and cleaned from any foreign particles and sent to the
steeping section where the maize is washed with hot water and soaked in sulphur dioxide (0.2 percent)
for 70 hours at a temperature of 52 degrees Celsius. Vitamins and minerals are added to this steep
water to produce corn steep liquor. The germ and husk are then separated by means of primary and
secondary crushing and this is followed by pressure washing to separate the fibre to form a mixture of
gluten and starch. The starch is then separated from gluten by means of centrifugal separation where
after the starch slurry is washed and concentrated. The concentrated starch is then dried (moisture of
11-12 percent) and the starch slurry is used to make liquid glucose, modified starches and dextrose
(Jansamachar.net, 2005).
The gluten slurry can be dried by using a rotary vacuum filter and a hot air drier to a moisture content of
12 percent. The dried gluten produced is often used as poultry feed because of its high protein content
(70 percent protein) (Jansamachar.net, 2005).
A maize processing plant’s main product is starch which is consumed in industries such as
pharmaceuticals, food, textile, paper, restaurants and hotels. Other products include fibre which is used
as animal feeds, germ that yields germ oil that functions as low cholesterol edible oil (100g of maize
yields 3g oil) and corn liquor that acts as a substrate for culture media (Jansamachar.net, 2005).
Feed milling
The process of feed milling involves the grinding of whole maize kernels to which vitamins and minerals
are added to make a nutritious feed for livestock (Agro Products, 2008).
Figure 22 shows the flow of maize from the fields, through the cleaning, storage, steeping and grinding
systems. At the grinding process the flow splits into “coarse flow” and “fine flow”. Coarse flow involves
the process where maize is processed into breakfast cereals such as maize flakes by the breakfast

46
cereal industry. Fine flow represents the processing of maize to manufacture oil and animal feed, but
also products used in the brewing, baking and snack industry.
Figure 22: Flow chart of EU maize processing Industry Source: EUROMAISIERS, 2008.
The production of coarse cereals in India has risen by 107.8 percent from 15.4 (1950-51) to 32 metric
tons (2000-01). This increase is significantly lower than the increase in wheat and rice during the same
period. This is due to the fact that the profitablility of wheat and rice is much higher compared to that of

47
coarse cereals. Maize was stored in metal bins after the 1998-99 and hot air dryers using agriculture
residue as fuel were used for drying maize. Nowadays maize is increasingly used as as animal feed,
occasional or speciality foods and as industrial foods such as starches. The major problem that needs
to be overcome is the safe storage of coarse cereal flour as it has a high degree of perishablility
(Kachuru, 2001).
In India, processed maize products are marketed directly to pharmaceutical companies, hotels and
textile and paper industries but can also be marketed through traders or trading agencies. Trading
agencies however prefer to obtain various maize products from one supplier. To be competitive in the
maize processing market, maize processors should thus ensure that the specific plant is capable of
producing the types of starches demanded as well as the different by-products needed. Starch and
gluten are excellent products for export and India exports these to Sri Lanka, South East Asia,
Bangladesh and South Africa (Kachuru, 2001).
China is the second largest maize producing country in the world. Its annual maize production is second
only to that of the United States. Its maize processing industry on the other hand, although growing fast,
is still behind many developing countries in terms of diversity, scale and level of technology. China’s
maize processing sector is an industry that is effective, non-polluting and waste-free with high value
addition possibilities. The maize processing sector has the potential for a profitable and successful
future. It is important that ideal conditions for maize processing are created in China to ensure the all-
inclusive processing of maize and ensuring that the processed maize meets the quality and quantity
needs of the consumer. The maize processing ability of China showed a yearly growth rate of 20
percent especially in China’s major maize producing provinces (Youning & Zhongdong, 2009).
Currently there are twenty six maize mills in the EU that satisfy the different needs of a broad consumer
base. Four of the companies that operate the twenty six maize mills are responsible for 50 percent of
the total production of maize products in the European Union. The companies listed in
Table 7 are all members of EUROMAISIERS which is an organization that act on behalf of the
European Union dry maize milling industry. EUROMAISIERS oversees trade, regulations and
regulatory matters that may affect the maize milling sector (EUROMAISIERS, 2008).

48
Table 7: Members of EUROMAISIERS and their companies COUNTRY COMPANY
Belgium MASELIS N.V
France USM - Union des Semouliers de Maïs G4S
Costimex (Groupe Soufflet)
Champagne- Maïs(Groupe Champagne-Céréales)
Limagrain Céréales Ingrédients (Groupe Limagrain)
Castelmaïs (Groupe Terre du Sud)
Germany NORDEGETREIDE GmbH & Co.
Hungary Maselis Hungaria Ltd
Italy DE FRANCESCHI SPA MONFALCONE
NDF Azteca Milling Europe Srl
CERALICOLA ROSSI S.R.L
MOLINO FAVERO
Netherlands CODRICO ROTTERDAM B.V.
Poland Bio Corn Sp.Z.O.O
Dacsa Polska Sp.Z.O.O
Spain DACSA
MAICES DEL SUR SA
United Kingdom Maizecor Foods Ltd
Smiths Flour Mills (Albion Mills)
DACSA Ltd
Source: Adapted from EUROMAISIERS (2008).
Table 8 below indicates the type and the average quantity and percentage of the maize products
produced by the 26 mills in the EU from 2005 to 2008.
Table 8: Maize products produced by EU mills (Average 2005 – 2008) Product Quantity (t) Percentage (%)
Maize Flour 144 518 16.21
Brewers Grits 524 579 58.84
Flaking Grits 222 490 24.95
Total 891 587 100
Source: Adapted from EUROMAISIERS, 2008.

49
Approximately 1.5 million tonnes of maize is used by the European Union maize milling industry
annually to produce about 900 000 tonnes of maize flour and grits. The flour and grits are then used in
the manufacturing of snack foods, beer, polenta, breakfast cereals, cereal bars, infant food, products for
the baking industry etc. The 1.5 million tonnes of maize used is however not only from European Union
origin. Around 500 000 tonnes of maize comes from Argentina. These Argentinean maize varieties are
better suited for breakfast cereal production. The remainder of the essential maize comes mainly from
France and Italy. French maize is mainly used for the production of maize snack foods and brewers’
grits while Italian maize is used for the production of polenta (EUROMAISIERS, 2008).
Figure 23 shows the composition of the different products produced from maize in the EU by
EUROMAISIERS maize milling companies. The total production consists of 57 percent brewers’ grits,
28 percent flaking grits and 15 percent maize flour.
Figure 23: EUROMAISIERS mill production, 2008* Source: EUROMAISIERS, 2008.
Glaking Grits
28%
Maize Flour
15%
Brewers' Grits
57%

50
3.2 SOUTHERN AFRICAN DEVELOPMENT COMMUNITY (SADC) OVERVIEW
3.2.1 STOCK LEVELS
According to the Famine Early Warning Systems Network (FEWS NET) available stock levels of the
entire Southern African Development Community (SADC) for the 2009/2010 marketing season is 28 405
000 metric tons which compares favourably to the available stocks of 25 846 000 metric tons in the
2008/2009 marketing season (FEWS NET, 2010). These stock levels indicate a rise in available stock
levels. This trend is also evident in overall increases in stock available in the SADC region, from the
1994/95 season stocks were at the 1819 000 metric ton level to the 2005/06 season where it stocks
were at the 7 621 000 metric ton level (SAGIS, 1995; SAGIS 2006). These stock level increases are
crucial to the SADC region as strategic grain reserves are needed.
3.2.2 PRODUCTION LEVELS
Since South Africa joined the SADC region, production for the region has increased dramatically as
South Africa is a major maize producing country in the region. The country normally produces about half
of SADC maize (FANRPAN, 2003). According to a FANRPAN (2003) report, during the marketing years
1996 to 2001/02, production was mostly sufficient to meet the needs of the SADC countries but in the
year 2001/02 a drop in maize production, especially in South Africa lead to substantial maize gaps also
in countries like Zambia, Zimbabwe, Namibia and Malawi. But SADC maize production recovered from
the 2001/02 setback and production increased 34 percent from 18.89 million tons in 2007 to 23.93
million tons in 2008. This was led largely by South Africa’s contribution, producing 7.26 million tons in
2007 to 13.13 million tons in 2008 (SADC, 2008).
Figure 24: Total SADC maize production for the marketing years 1994 to 2009.
Source: SADC, 2006, 2007, 2008 & SAGIS, 1994 to 2006
0
5000
10000
15000
20000
25000
30000
1961
1965
1969
1973
1977
1981
1985
1989
1993
1997
2001
2005
2009
Years
Tota
l S
AD
C M
aiz
e
Pro
duction (1000M
T)
SADC Maize Production

51
3.2.3 CONSUMPTION LEVELS
The SADC region is unique, compared to the rest of the world in that maize is the most important staple
food crop in most countries within the region (Mano, Isaacson & Dardel, 2003). According to Moyo
(2008), “the annual volume of cereals, maize included, required for the population in the SADC region
for 2008 is estimated at 30.5 million tons, compared to the 1980’s where it was 16 million tons”. Figure
25 illustrates the SADC maize consumption and the dependency of the Southern African population on
maize for their dietary requirements.
Figure 25: SADC maize consumption Source: Mano et al., (2003).
Per capita consumption of cereals, including maize has dropped by 15kg/person; this could have
reflected population growth rates and stagnant production per capita. The steepest rate of decline in per
capita consumption was closely connected with the 1991/1992 drought year, followed then by
persistently low per capita consumption for the next 12 years (Moyo, 2008).
3.2.4 IMPORT AND EXPORT LEVELS
Dependency on food imports has increased for most countries in the region over the last 18 years, with
Zimbabwe being the most affected by this trend since 2002. The total estimated commercial imports into
the SADC region for the marketing years 2006/07 and 2008/09, was 1.22 million tonnes and food aid
0
5000
10000
15000
20000
25000
30000
19
61
19
64
19
67
19
70
19
73
19
76
19
79
19
82
19
85
19
88
19
91
19
94
19
97
20
00
20
03
20
06
20
09
Years
To
tal D
om
es
tic
Co
ns
um
pti
on
(10
00
MT
)
Consumption (1000MT)

52
deliveries was 0.22 million tonnes. If exports of 0.2 million tonnes are taken into account the cereal
deficit is shown to be 2.63 million tonnes. Food aid deliveries have risen sharply from 2001 to 2007
which indicates the unstable nature of the regions production and has reached 1998 levels (Moyo,
2008).
Figure 26 shows the amounts exported by South Africa to the rest of SADC. The lowest amount that
was exported by South Africa was 469 059 metric tonnes in the marketing year 2007/2008. Then the
following year was the highest amount exported by South Africa to SADC in the period, 1.9 million
metric tonnes in the marketing year 2008/2009. This is a clear indication of the volatility in production
and maize stocks that the region experiences.
Figure 26: Total maize exports from South Africa to SADC countries for the marketing years 2003/04 to 2009/10 Source: SAGIS (2010).
Due to the maize deficits the region incurs, major maize producing countries within the region like South
Africa export to the other SADC member countries (Mano et al., 2003).
0
500000
1000000
1500000
2000000
2003
/200
4
2004
/200
5
2005
/200
6
2006
/200
7
2007
/200
8
2008
/200
9
2009
/201
0
Years
To
nn
es
Maize Exports from South Africa to SADC

53
Figure 27: SADC maize imports for marketing years 1980 to 2005. Source: Moyo (2008).
Figure 27 shows the increasing trend of maize imports into the SADC region with occasional spikes of
high volume imports as the region can be unstable in terms of production. Figure 28 indicates the
decreasing trend in value (United States Dollars) of the SADC region’s (including South Africa) maize
exports.
Figure 28: Maize export values (USD ‘000) for the SADC region Source: Moyo (2008).
Trade between the SADC countries increased to 11 percent in 1995 from 1990, but then dropped back
to 9 percent in 2000 and 8 percent in 2005 (Moyo, 2008). This figure confirms the extremely volatile
0
1000
2000
3000
4000
5000
6000
7000
8000
1961
1964
1967
1970
1973
1976
1979
1982
1985
1988
1991
1994
1997
2000
2003
2006
2009
Years
SA
DC
Maiz
e I
mp
ort
s
(1000M
T)
SADC Maize Imports
0
1000
2000
3000
4000
5000
6000
1961
1964
1967
1970
1973
1976
1979
1982
1985
1988
1991
1994
1997
2000
2003
2006
2009
Years
To
tal
SA
DC
Maiz
e E
xp
ort
s
(1000M
T)
SADC Maize Exports

54
nature of imports in the SADC-region. Although always a net importer, the value of the maize imported
fluctuates greatly.
In SADC counties such as Botswana, Lesotho, Mozambique, Namibia, South Africa and Tanzania,
government plays very little if any direct role in cereal imports and generally do not restrict food grain
imports. Millers are issued with import permits in Namibia according to domestic production levels.
Tanzania generally does not restrict trade but will restrict its exports when domestic production is low.
Malawi officially also has no trade restrictions on cereal imports but the only importer of maize in that
country is the National Food Reserve Agency (NFRA) (Mano et al., 2003).
However in terms of trade, according to Bio watch South Africa, six countries within the SADC region
have taken a stance against importing Genetically Modified (GM) crops. The six countries are listed in
Table 9 with additional comments.
Table 9: SADC countries which ban Genetically Modified products and crops Angola Bans imports of all GM products except food aid, provided it has been
milled already.
Lesotho Bans GM [sic] imports unless processed or milled.
Madagascar Bans growing or importing GM foods.
Malawi Bans GM imports unless they are already processed or milled.
Zambia Bans imports of all GM products.
Zimbabwe Bans GM imports unless they are already processed or milled.
Swaziland Bans GM imports unless it has already been milled.
Source: Bio watch & SAGIS, 2010.
Therefore GM crops and products are a major issue in the SADC region and cause governments to ban
the importation of certain GM produce.
3.2.3 PRICES AND PRICE CYCLES
Within the SADC region food price formation and trade is affected by global food, financial markets and
inputs. Food production and marketing are key areas in the maize pricing processes especially in South
Africa (Moyo, 2008). According to Moyo (2008) in the policy discussion paper for the Southern Africa
Trust, “South Africa is the main food and input supplier to the other SADC countries”. This therefore

55
indicates the dependence that most of the SADC countries have on South Africa for their consumption
and production needs.
Countries like Lesotho, Botswana, Namibia and Swaziland import food and inputs from South Africa and
their currencies are pegged to the Rand therefore South African price formation affects food prices in
the formal and informal markets within the SADC region. This situation is mainly due to food and
farming input prices being parity priced. World prices are transmitted through South Africa ultimately
affecting the whole SADC region. The fluctuating food price occurs not only because of the global trend
but also regional food balances (Moyo, 2008).
3.2.4 SUPPORT STRUCTURES
The Industrial Development Corporation (IDC) has an Africa unit which specializes in development
beyond South African borders. The Africa unit has a specialized team which leads the way for the IDC in
SADC economic development. The Africa unit of the IDC therefore also provides funding to businesses
of which agro-processing is key to economic development (IDC, 2009).
The International Finance Corporation (IFC) which is part of the World Bank group attempts to
encourage sustainable economic growth by financing private sector investment in developing countries.
The corporation finances enterprises that are majority owned by the private sector in developing
countries (IFC, 2010). Therefore deduction can be made from the information above that the IFC is an
international support structure which operates all over the world but focuses on developing nations and
therefore applies to SADC and South Africa.
The African Development Bank Group is a support structure which operates throughout Africa. The
Bank aims to assist African countries individually or collectively in order to achieve economic growth
throughout Africa. This Bank offers assistance to SADC and South Africa to invest in agro-processing
enterprises (Africa Development Bank Group, 2010).
3.2.5 FOOD SECURITY
According to the SADC objectives as explained in Article 5 of the SADC Treaty the achievement of
poverty alleviation and enhancement of the standard and quality of life of the Southern African people is
a major objective entrenched in policy and the treaty (SADC, 1992). Food Security in the region is

56
crucial to the achievement of these goals. This can only be done through the individual countries
gaining self sufficiency and allowing for free trade within the region. A free trade agreement called the
SADC Free Trade Area was established in August 2008 is a landmark in intra-SADC trade (Moyo,
2008). These agreements are needed to ensure food insecure countries within the SADC region with
the access to food especially grains when it is needed.
The time and costs involved in transporting traded goods in and among SADC countries especially
during times of drought is a key concern in addressing the chronic food deficits within the region.
Variable production in the area due to the frequency of droughts and instability of certain countries
continue to plague the region in terms of food security (Moyo, 2008). The SADC countries through
policy have set up a Regional Early Warning System to identify disaster areas where production will not
be sufficient for the demand (SADC, 2008). This system is therefore designed for the benefit of
governments to make decisions on what their grain needs might be for the coming seasons.
Table 10 below indicates SADC countries with government held strategic grain reserves, this is a food
security strategy employed by SADC governments under the premise that it provides a safety net in
times of food shortages.
Table 10: SADC countries with government held strategic grain reserves
Country Stocks (1000MT)
Angola 0
Botswana 0
Congo 751
Lesotho 0
Madagascar 0
Malawi 1398
Mozambique 453
South Africa 4207
Swaziland 0
Tanzania 55
Zambia 419
Zimbabwe 0
Source: Mano et al., (2003).

57
3.2.6 MILLING INDUSTRY
Due to the heavy reliance of people in the SADC region on maize meal in their diets, the milling industry
is very important as it provides the maize meal for the majority of the population who depend on it as it
is their staple food (Mano et al., 2003). Therefore stability is needed in terms of production and supply
for the industry to ensure prices are affordable for the poor who depend on maize meal for their survival.
Lower maize milling and retail margins have been realised since the deregulation of maize markets in
the SADC region. The reason for these reductions in the maize milling and retail industries is that the
reform opened up the maize marketing system to better competition from small-scale maize millers who
were previously excluded from the market. This also exerted downward force on large-scale millers
margins which in the end benefited the consumer. However, after the deregulation of the maize market
in 1997, lower maize milling margins did not necessarily occur in South Africa which is a relatively
developed market. This may be an indication of potential non-competitive behaviour in the stages of
maize milling and retailing (Abu & Kirsten, 2009).
The SADC region with all its variables influencing the maize industry, where millers produce food for
people, especially the poor, creates a unique situation which cannot be compared to anything in the
world.
3.3 SOUTH AFRICAN OVERVIEW
3.3.1 PRODUCTION LEVELS
South African total production of maize (yellow and white) has increased annually at a rate of 1.69
percent over the past decade from the production season 2000/2001 to 2008/2009. The production of
yellow and white maize increased over the same period at an annual rate of 2.16 and 1.39 percent
respectively. Production for white and yellow maize stayed constant over the decade. However, there
were some signs of volatility in production between the period 2006/2007 to 2008/2009, as can be seen
in Figure 29.

58
Figure 29: Total white and yellow maize delivered in South Africa from the period 2000/2001 to 2008/2009 Source: SAGIS, 2010 & own calculations
During this period, high decreases in production were followed by sudden high increases. According to
BFAP (2007), severe drought conditions were the reason for the high decreases in production of maize
in the 2006/2007 production season. The increase in production from the 2007/2008 season onwards
can be described due to more favourable growing conditions and improved cultivars, leading to higher
average yields. The Crop Estimate Committee (CEC) expects the average yield for white and yellow
maize for the production season 2009/2010 to be at around 4.53 and 5.06 tons per hectare (The
Citizen, 2010).
The future trend for maize production will stay relatively constant with an expected annual increase from
the 2009/2010 production season to 2013/2014 production season of 0.6 percent. Over this period white
maize production is expected to decrease at 0.88 percent per year, while yellow maize production is
expected to increase at a rate of 2.71 percent per year (BFAP, 2009). These calculations provide an
indication of what the expected maize production figures will be should normal planting conditions
prevail. In the current environment, which is characterised by high input costs and unpredictable
weather conditions, it can be expected that the production levels will decrease especially with the low
maize price currently being experienced. Figure 30 below gives an indication on the expected
production of white and yellow maize from the production period 2009/2010 to 2013/2014.
0
2000000
4000000
6000000
8000000
10000000
12000000
14000000
2000
/200
1
2001
/200
2
2002
/200
3
2003
/200
4
2004
/200
5
2005
/200
6
2006
/200
7
2007
/200
8
2008
/200
9
White maize Yellow maize Total Maize

59
Figure 30: Projected maize production for the period 2009/2010 to 2013/2014 Source: BFAP, 2009 & own calculations
3.3.2 CONSUMPTION LEVELS
Consumption of maize can be divided into four main categorise, which include human consumption,
animal feed consumption, maize processed for bio-fuel and maize gristing. Human consumption and
animal feed consumption are the biggest consumers of maize, with maize allocated to gristing being the
third largest consumer. Much has been said about bio-fuels and the impact bio-fuels will have on the
maize industry. The irony is that over the past decade limited amounts of bio-fuel have been produced
in South Africa. According to SAGIS (2010), maize has not been allocated for production of bio-fuels in
South Africa over the past decade. Figure 31 indicates the allocation of maize to the respective maize
consumption categorise for the 2008/2009 production season. From Figure 31 it is evident, human and
animal feed consumption contribute the most to total maize consumption in South Africa, representing
over 99 percent of maize consumption.
0
2000
4000
6000
8000
10000
12000
2010 2011 2012 2013 2014
White Maize Yellow Maize Total

60
Figure 31: Allocation of maize to the different maize consumption categorises Source: SAGIS, 2010 & own calculations
The future for total maize consumption is expected to remain constant with an expected growth rate
between the production periods 2009/2010 to 2013/2014 of 0.51 percent per annum. Animal feed
production is expected to increase for the same production period at a rate of 1.87 percent per annum.
Bio-fuel production is likely to have the biggest growth percentage of all the consumption categorises,
with a projected growth rate of 36.07 percent per year. This increase in bio-fuel production comes as a
surprise following the aforementioned discussion that no bio-fuel production has taken place over the
past decade in South Africa. Human consumption is the only category that has a negative expected
growth rate for the following five years. It is expected that human consumption of maize would decrease
at a rate of 1.66 percent per annum. Figure 32 gives an indication of the possible trend maize
consumption could take in the following five years.
52%
47%
0% 1% Human
Consumption
Animal Feed
ConsumptionBio-fuel
Consumption
Gristing

61
Figure 32: Expected consumption levels of the different consumption categories between 2009/2010 to 2013/2014 Source: SAGIS, 2010
3.3.3 STOCK LEVELS
The following figure shows the ending stock level for white, yellow and total maize in South Africa for the
period 2000/2001 to 2008/2009.
Figure 33: Maize ending stock levels in South Africa between the periods 2000/2001 and 2008/2009
0
1000000
2000000
3000000
4000000
5000000
6000000
7000000
8000000
9000000
10000000
2009/2010 2010/2011 2011/2012 2012/2013 2013/2014
0
20000
40000
60000
80000
100000
120000
140000
160000
Total Human Consumption Animal Feed consumption
Total consumption Ethanol consumption
0
500000
1000000
1500000
2000000
2500000
3000000
3500000
2000
/200
1
2001
/200
2
2002
/200
3
2003
/200
4
2004
/200
5
2005
/200
6
2006
/200
7
2007
/200
8
2008
/200
9
Closing stock - White maize Closing stock -Yellow maize
Closing stock - Total

62
Source: SAGIS, 2010 & own calculations
The South African ending stock levels of maize change each year. Total maize ending stock is largely
driven during the past decade by white maize, as can be seen in the figure above. Yellow maize stayed
relatively constant over the decade and hovered between the 500 000 to 1 000 000 ton. The reason for
the high increases in white maize ending stock, especially during the period of 2001/2002 to 2004/2005
can be attributed to the high decreases in consumption of white maize in South Africa. According to
SAGIS (2010), white maize consumption decreased year on year at a rate of 11.3 percent during the
period 2000/2001 to 2008/2009.

63
3.3.4 IMPORT AND EXPORT LEVELS
Most of South Africa’s exports are to the BLNS countries and other countries of the Sub-Saharan Africa
and (AGRINC, 2009). Figure 34 indicates that South Africa is generally a net importer of yellow maize
and a net exporter of white maize. Maize exports experienced a surge during 2008 due to higher than
normal maize production (BFAP, 2009).
South African maize exports can be divided into two categories, namely deep-sea exports and African
exports. Deep-sea exports are normally shipped from Durban and East London to the Middle- and Far
East, as well as Madagascar, the Seychelles, Mexico and Mauritius. The USA, Argentina and even
China are likely competitors in this market. The deep-sea parity price consists of the FOB (free-on-
board) price, a premium according to differences in the quality of maize, and the shipping and harbour-
costs. South Africa’s African exports usually compete against the country able to supply at the lowest
price.
For African exports via road and rail South Africa competes with the cheapest other alternative for the
importing country. For example, if Zimbabwe has to import maize and both Zambia and South Africa
have maize surpluses to export, the African export parity price will represent the cheapest price at which
Zimbabwe can buy its maize, either from South Africa or Zambia. The African export parity price will be
calculated back to a South African price. If no other African country has the capacity to export, South
Africa will then compete with the US and South America to export into Africa. The table below shows
how an African export parity price can be calculated for South Africa.
Table 11: African export parity price calculation
FOB ($/ton) USA Gulf price 130
Shipping costs to Beira 120
Insurance and Financing charges 4
FOB Beira harbour ($/ton) 254
Harbour offloading costs 25
FOR Beira harbour 279
Transport cost to Harare 110
Landing cost in Harare ($/ton) 389
Landing cost in Harare (R/ton) 3 112
Transport to Harare from SA ($110) -880
Bagging (50% per road) -60
Insurance and financing charges -50
Other (agent costs, documentation) -100
Possible purchase price in SA (R/t) 2 022

64
Therefore the African parity price is the lowest price converted back into the South African price. South
Africa produces GM (genetically modified) maize, which due to strict regulations can prohibit exports to
African countries even when prices are highly competitive. Deep-sea parity prices are relevant in times
when South Africa has large surpluses of maize which will exceed African demand. African parity prices
on the other hand will be more relevant in times of smaller surpluses, when most of the maize will be
consumed by African demand (Geyser, 2009).
Figure 34: South African total maize exports and imports (excluding imports destined for exports) in tons, 2001-2010 Source: SAGIS, 2010.
Figure 34 indicates that a relatively small portion of maize products are being exported when compared
to whole maize exports. This may signal an opportunity for maize processors to export value-added
products. However, further inspection is needed on the reasons for this occurring. Since the 2005/06
period, no maize imports were destined for exports.
0
500000
1000000
1500000
2000000
2500000
2001/02 2003/04 2005/06 2007/08 2009/10
To
ns
Total Exports Total imports (excluding maize destined for exports)

65
Figure 35: South African exports of maize products (grain equivalent/tons), 2000-2010 Source: SAGIS, 2010.
Although there should be movement towards the ultimate objective of a zero tariff policy, an important
factor that should be taken into account, is that the international trade environment (in particular the
agricultural sector) is characterised by numerous trade-distorting measures. It is possible to take action
against unfair trade practices through instituting countervailing and anti-dumping measures, however,
some trade-distorting measures are non-countervailable subsidies in terms of the WTO Agreement
(NCM, 2005).
As maize is an internationally traded commodity, South African maize prices reflect the South African
maize situation relative to global markets. Therefore, the domestic price usually trades between an
import- and export parity price with the current status and prospects of the domestic situation viewed
against that of the global situation. International market powers determine the level of import- and
export parity, while domestic market powers determine the level of the local maize price between
import- and export parity. Currently an import tariff on imports of maize, which is calculated with an
agreed upon formula, triggers different import tariffs at different price levels. An example of this is that
when USA export prices for maize trade under $110 per ton Free on Board (FOB) for a certain period of
time, a tariff will be implemented (AGRINC, 2009).
0
500000
1000000
1500000
2000000
2500000
2000/01 2001/02 2002/03 2003/04 2004/05 2005/06 2006/07 2007/08 2008/09 2009/10
Period
To
ns
SA - Exports: Whole maize: Total (t)
SA - Exports: Maize products: Total(Grain equiv.) (t)

66
3.3.5 PRICES AND PRICE VOLATILITY
In 1995 grain marketing in South Africa was deregulated in terms of interventions relating to price
determination. The market for agricultural derivatives was established to provide market participants
with a price risk management facility as well as a price determination mechanism without distorting
economic principles. Maize traders who act on behalf of clients for a fixed fee perform an important
function in a free market orientated maize market. These traders take positions (forward buying and
selling), assume market risks, establish the value of maize and provide the real cash market for maize
(NAMC, 2004).
According to the NAMC’s Quarterly Food Price Monitor report (November 2009), world prices for most
soft commodities increased by approximately 20 percent from November 2008 as a result of the world
financial crisis. A depreciation of the US Dollar, higher crude oil prices and a strong demand from Asian
markets and bio-fuel markets in the US and Europe contributed to this increase. These world-price
increases were however not fully transmitted into South African markets due to the appreciation of the
Rand relative to the US Dollar during that period. Between October 2008 and October 2009 domestic
maize prices decreased by 16.34 percent in the South African market. The prices of maize products in
urban areas decreased 2.01 percent (on average) between October 2008 and October 2009. However,
the prices of maize products in the rural areas increased by 4.48 percent (NAMC, 2009).
Figure 36: White and yellow maize spot prices, Nov 2007-Jan2010 Source: SAFEX, 2010.
0
500
1000
1500
2000
2500
39387 39514 39645 39769 39896 40025 40150 40281
White maize spot price Yellow maize spot price

67
Prices of agricultural commodities and "volatility" have been a significant concern since the drastic
maize price changes occurred in South Africa during the 2001/02-marketing season. They have been in
the spotlight again since agricultural commodity prices reached their peak in late 2007 and early 2008.
The problem of price volatility is not new. The issue of how to address the discontinuity of supply in the
face of continued demand has been debated for ages. In addition, volatility discussions nowadays
overlap with discussions of greater uncertainty in a rapidly changing economic and natural environment
and the structural economic changes that occurred during the recent worldwide economic recession.
The prices of agricultural commodities vary more than many other commodity prices (Alexandratos,
2009). Prices could rise, for example by 50 percent and then drop in a short time period. The structure
of the world cereal markets is also quite thin as only a small proportion of world cereal production end
up on the world market as a large portion of the produced cereal is consumed in the domestic market
(FAO, 2008). Only 17 percent of the wheat production and 7 percent of the rice production end up on
the world market (FAO, 2008). Thin markets react easily to the changes in global supply and demand
(Alexandratos, 2009).
In 2008, many articles were published about the food crisis, for example Abbot et al. (2008),
Alexandratos (2008), Baltzer et al.(2008), Heady and Fan (2008) and Trostle (2008), to name but a few.
None of the authors were able to identify a single factor which caused the rapid rise in cereal prices.
Some factors identified have influenced structural changes in demand and supply for decades and other
factors have affected food prices in the near run and some have been only sudden shocks (Trostle,
2008). Abbot et al. (2008) identified three broad sets of forces driving food price increases:
• Global changes in production and consumption of the key commodities
• The depreciation of the dollar, and
• Growth in the production of biofuels.
Heady and Fan (2008) have built a model which explains the principal causes and the main causal
mechanism of the 2007/08 food crisis. Many factors are commodity-specific, some factors are highly
significant and some less. In Figure 37 the so-called less convincing factors are illustrated with dashed
lines. The decline of the dollar and the oil price are in the same box because they are both universal
factors and because they may be causally related to each other.

68
Figure 37: A model of the principal causes of the crisis Source: Heady & Fan, 2008.
Before discussing price volatility, it is necessary to understand what volatility is and how it is related to
risk. According to Hull, risk permits the assignment of probabilities to the different outcomes, and
volatility is linked to risk in that it provides a measure of the possible variation or movement in a
particular economic variable or some function of that variable, an example being a growth rate (Hull,
2006).
Volatility provides a measure of the possible variation or movement in a particular economic variable. It
provides a measure that describes the tendency of a commodity, for example the maize market, to
move either up or down and to what extent the anticipated move could be. In essence it is a fear factor.
If the price jumps by large amounts in a short space of time then the volatility of the market will be high.
If the market movement is small, steady and predictable then the volatility will be low. Lack of
predictability and uncertainty associated with increased volatility may influence both producers and
consumers. High volatility may limit the ability of consumers (processors) to secure supplies and control
input costs.
Two measures of volatility are used by European Commission (2009). These are:
• Historical (realised) volatility, based on observed (realised) movements of price over an historical
period. Historical volatility tells us how volatile an asset has been in the past. It represents past
price movements and reflects the resolution of supply and demand factors.

69
• Implicit volatility. Implicit volatility is the markets' view on how volatile an asset will be in the future.
It represents the market’s expectation of how much the price of a commodity is likely to move and
tends to be more responsive to current market conditions.
Historical volatility
Historical volatility is a statistical measure of the volatility of a futures contract, security, or other
instrument over a specified number of past trading days.
www.cftc.gov/educationcenter/glossary/glossary_h.html. It is an indication of past volatility in the
market place. Historical volatility is calculated as the annualized standard deviation of the first
difference in the logarithmic values of nearby futures settlement prices. Mathematically,
As volatility is usually described in annualized terms, a factor of square root of 252 (estimated number
of trade days in a year) are used to annualize the historical volatility. Table 12 shows the historical
volatility of the maize contract traded on the CME.
Table 12: Historical volatility of the maize contract traded on CME (percentage)
Jan Feb Mar Apr May Jun Jul Aug Sep Oct Nov Dec Yearly
Average
2000 22.4 14.4 25.6 16.8 26.0 28.8 20.4 16.2 18.5 17.4 17 15.7 19.9
2001 17.9 12.1 19.2 20.8 21.3 16.6 41.6 19.1 17.3 15.0 21.4 11.2 19.4
2002 12.0 13.1 11.6 11.4 23.2 20.2 42.1 24.7 28.0 19.2 16.7 13 19.6
2003 20.2 11.4 18.5 12.5 22.6 19.7 16.6 25.4 22.8 28.6 25.2 18.3 20.1
2004 26.0 17.9 23.6 26.3 27.6 29.9 20.4 23.4 15.1 18.0 15.5 16.7 21.7
2005 20.1 20.9 22.6 20.1 25.0 33.8 42.2 22.4 16.0 10.5 9.5 19.5 21.9
2006 19.1 23.1 30.7 19.8 31.3 28.8 26.7 30.2 39.5 43.5 26.9 26.3 28.8
2007 38.1 27.9 23 36.8 42 38.1 30.1 27.3 39.2 31.4 22.6 20.1 31.4
2008 32.2 22.2 40.8 28.9 29.2 35.1 36.5 51.2 49.4 63.9 46 59.8 41.3
2009 50.9 30.2 36.3 28.7 16.6 41.4 46.3 28.4 55.2 43.0 35.2 29.2 36.8
2010 31.7 31.7
Mean 40.23 25.05 31.9 32.85 42 38.1 33.3 39.25 49.4 37.2 23.6 22.98
High 50.9 30.2 40.8 36.8 42 56 54.8 51.2 55.2 63.9 46 59.8
Low 12 11.4 11.6 11.4 21.3 16.6 16.6 16.2 15.1 10.5 9.5 11.2
Table 13 shows the volatile nature of the South African white maize contract traded on SAFEX. One
can clearly see that the South African contract is much more volatile than the CME contracts.

70
Interesting to note is the fact that during 2008 and 2009 (the word financial crisis) the volatility of the
white maize contract traded on SAFEX was less than the volatility of the corn contract traded on the
CME. A possible explanation can be that the South African market has a smaller portion of funds traded
the contract compared to the CME.
Table 13: Historical volatility of the white maize contract traded on SAFEX (percentage)
Jan Feb Mar Apr May Jun Jul Aug Sep Oct Nov Dec Yearly average
2000 15.5 14.9 39.2 67.7 45.9 15.6 18.9 20.4 18.1 26.1 23.4 15.6 26.77 2001 38.6 58.3 28.5 10.7 16.5 21.7 23.7 11.1 18.7 35.4 30.5 39.1 27.73 2002 48.8 39.1 42.6 22.4 24.4 25.6 17.0 14.0 9.3 14.5 14.2 34.7 25.55 2003 41.0 59.8 63.3 47.4 53.6 36.2 26.7 30.7 19.9 47.9 21.8 52.0 41.70 2004 55.4 45.0 47.8 42.3 24.5 31.5 36.8 30.8 23.5 41.0 43.2 49.5 39.28 2005 61.8 36.2 36.4 30.2 25.7 20.5 28.6 20.1 34.5 30.4 37.4 43.4 33.77 2006 47.6 40.5 20.9 51.3 16.5 21.0 19.9 21.2 23.2 40.7 31.3 30.4 30.37 2007 34.7 41.5 39.6 44.4 31.0 32.0 31.1 22.4 24.5 21.6 13.1 38.7 31.22 2008 29.9 33.0 33.5 23.6 26.8 28.6 34.1 42.2 22.6 30.3 20.7 46.5 31.00 2009 27.9 24.4 13.2 26.8 28.3 22.2 36.4 28.4 20.9 28.6 27.1 21.8 25.49 2010 38.9 38.3 38.61
Monthly Average 40.0 39.2 36.5 36.7 29.3 25.5 27.3 24.1 21.5 31.6 26.3 37.2
High 61.8 59.8 63.3 67.7 45.9 36.2 36.8 42.2 34.5 47.9 43.2 52.0 Low 15.5 15.0 13.2 10.7 16.5 15.6 17.0 11.1 9.3 14.5 13.1 15.6
Source: Based on own calculations from SAFEX data (2010).
Implicit volatility
The South African Volatility Index (SAVI) for white maize is based on the forward looking option volatility
which therefore means it provides a transparent reference tool for the market to better understand the
potential uncertainty in the market. It therefore measures the implicit volatility of the white maize
contract.
With the SAVI-White Maize the JSE is constructing a 3 month forward looking index (JSE, 2009). In
essence, the JSE measures the market volatility is three months from today, every day. The index
serves as a transparent volatility indicator. Because it is a forward looking indicator and not based
entirely on the historic values but rather more on participants’ opinions, one will be able to notice that as
people get more fearful of market conditions, the value of the indicator will start to rise. This can be seen
in Figure 38 which plots the SAVI white maize index versus the spot price for white maize going back to
2002. The volatility or fear in the market increases particularly around the local weather market (Jan-

71
Mar) when follow-up rains are crucial to ensure a good crop. Due to the uncertainty around this period,
particularly when stock levels are tight, the volatility increases to over 60 percent in certain seasons.
Figure 38: SAVI Index of white maize traded on SAFEX (from January 2002 to February 2010) Source: JSE, 2010.
The SAVI white maize is a transparent indicator of the market sentiment and easily allows market
participants to gauge how fearful the market really is. When considering the history of the index, an
index below 30 percent implies the market is complacent with limited uncertainty envisaged for the 3
months ahead, whilst anything over 30 percent implies a higher degree of uncertainty (JSE, 2009).
Price variability is an important component of the grain farmers’ planning because of its impact on farm
profitability. Knowledge about price volatility and the factors affecting it will benefit derivative instrument
users and will aid in price risk management. South Africa shows high levels of both implied option
volatility and price volatility. Meyer et al (2006) state that the equilibrium price in the smaller market can
be estimated as a function of the equilibrium price in the dominant market, the exchange rate and the
transaction costs. Thus when trade occurs between markets, the difference in price is equal to the
transaction costs. Meyer et al (2006) divide trade into three market regimes: near-autarky, import parity,
and export parity. Within these regimes Meyer tested the effect of a 10% increase in the world price on
the South African producer price of yellow maize. The results reported indicate a 3.4% increase in
0
500
1000
1500
2000
2500
Jan-2
003
Aug-2
003
Mar-2
004
Oct-2
004
May-2
005
Dec-2
005
Aug-2
006
Mar-2
007
Oct-2
007
May-2
008
Dec-2
008
Aug-2
009
Mar-2
010
Wh
ite m
aiz
e s
po
t p
rice (
Ran
d)
0
0.1
0.2
0.3
0.4
0.5
0.6
0.7
SA
VI
Ind
ex (
%)
White Maize Spot Price SAVI - %

72
producer price in the case of a near-autarky regime and an 11.2% increase in the case of an import
parity regime. The average percentage change between these two regimes is 7.3% indicating a strong
link between the world price and the domestic producer price.
In light of the above, one therefore expects the SAFEX price to follow similar volatility patterns as CBOT
and the exchange rate. Geyser and Cutts conducted a study in 2007 into price volatility of SAFEX.
Cutts and Geyser (2007) explain that the fundamental factors determining the price of maize on the
South African Futures Exchange (SAFEX) are:
• The supply and demand globally [as reflected in the Chicago Board of Trade (CBOT) price]
• South African demand, supply and stock levels,
• The Rand-Dollar exchange rates due to it directly affecting the import and export parity price.
Cutts and Geyser (2007) also noted two points after adjusting a monthly average price volatility graph
depicting South African and North American maize prices (as well as the value of gold and the
Rand/Dollar currency), so that planting and harvesting seasons coincide in the two different countries.
Firstly, they note that uncertainty increases in all markets during the planting and initial growth period.
During the growth period volatility decreases and finally attains a minimum after accurate crop estimates
have been released. The SAFEX futures price for white maize, WMAZ, shows strong variability in
December to February when high degrees of uncertainty surrounding the likely yield outcomes are
present. They further report that the high price variability corresponds to the typical “weather market”
period when SAFEX is responsive towards the impact of the South African weather on maize
production. The SAFEX futures price for yellow maize, YMAZ, follows a similar pattern (although the
period of uncertainty extends into March). Cutts and Geyser (2007) suggested that the futures price for
yellow maize (YMAZ) might not pose the same sensitivity towards weather as the futures price for white
maize (WMAZ), but rather sensitivity towards world supply and therefore exchange rate.

73
Figure 39: Average monthly price volatility Source: Cutts & Geyser, 2007.
Secondly, they found that the South African maize market was consistently more volatile than the CBOT
maize price, and that the SAFEX white maize price was more volatile (on average) than the SAFEX
yellow maize price. They also found that the extended period of volatility for YMAZ (up to March)
illustrated the sensitivity of YMAZ to world supply, which during this period depends heavily on the
weather in the United States.
Another study conducted by Monk, Grove and Jordaan (2007) aimed to quantify and explain SAFEX
July futures price volatilities for white and yellow maize. They also found that volatility has increased for
both the white- and yellow maize market in latter years. They found that information plays a major role
in price changes on futures contracts. Traders and speculators are very sensitive towards new
information releases as has been proven be the significance of the Crop Estimates Committee’s reports
as well as the Word Agricultural Supply and Demand reports issued by the US Department of
Agriculture. Local information as well as international information plays an important role in trader
decision making in the South African maize futures market. This effect can be seen with significant
volatility changes in the futures market prior to the report dates for the respective local and international
reports. This information phenomena can be backed by the fact that expected rainfall is also a
significant role player in the market. The study found that white maize is more sensitive towards CEC
reports than yellow maize, confirming the fact that South Africa rely more in yellow maize imports, thus
being more sensitive towards world conditions and world reports.

74
3.3.6 MILLING INDUSTRY
According to the NAMC’s report on the maize value chain (2004), maize is the most important grain crop
in South Africa. Roughly 60 percent of the total maize production in South Africa consists of white
maize, which is mainly for human consumption. The remaining 40 percent consists of yellow maize
production, mainly for animal feed production in the poultry and feedlot. The milling industry consists of
about 22 large scale millers that accounts for about two-thirds of the maize meal produced in South
Africa (Figure 41). The rest is produced by smaller, often informal millers. The four largest millers,
Pioneer Foods, Tiger Milling, Premier Foods and Pride Milling account for nearly 40 percent of the
market share of maize meal (NAMC, 2004).
The amount of maize that is currently milled by National Chamber of Milling members has dropped
since the deregulation of the maize industry in the early 1990’s. When the Maize Board was still in
operation, up to 5 million tons of maize was milled per annum. Figure 40 indicates that this has fallen to
roughly 2.5 million tons per annum. Due to the change in consumer preferences, less white maize
meant for human consumption is being milled, but deregulation also brought about to an increase in
informal milling (AGRINC & NCM, 2009)
Figure 40: Maize milling ('000 tons) from 1999/00 to 2006/07 Source: National Chamber of Milling, 2009.
0
500
1000
1500
2000
2500
3000
3500
4000
1999
/00
2000
/01
2001
/02
2002
/03
2003
/04
2004
/05
2005
/06
2006
/07
2007
/08
2008
/09
Th
ou
san
d t
on
nes

75
3.3.7 THE SOUTH AFRICAN MAIZE SUPPLY CHAIN
Overview of the maize supply chain
One of the objectives of the study was to clearly understand the maize supply chain and where the
milling industry fits into the supply chain. Figure 41 clearly illustrates the relationship of all role-players in
the maize supply chain. At the bottom end of the supply chain, research and development has a
significant role to play in terms of improving the technologies and to better understand the nature of the
maize sector. The input suppliers involve all companies that are responsible for delivering inputs in all
possible forms (including seed, fertilizer, fuel, mechanisation, pesticides, herbicides, financing, etc).
These input supplying companies supply their final products to the producers/farmers who are
responsible for growing and/or producing the actual maize. Most of the time the farmer/producer of
maize delivers the final product to nearby silo’s who are responsible for grading and storing of maize.
From the silo’s the maize can either be internationally traded (imported or exported) or it is delivered to
the local market. Three different value adding ways are used from the local market maize. The maize is
either used by the animal feed industry, the milling industry for human consumption or by other
processors who may use it for example for wet milling or brewing. As was discussed in the preceding
section, 60 percent of maize consumption is consumed by humans and 40 percent by animals. The
value added product is then delivered to retail and/or wholesale level where the final consumer buys the
product for consumption.

76
Figure 41: Market value chain for maize Source: Maize Tariff Working Group, 2005.

77
The Grain Value Chain
The value chain perspective captures the sequence of related activities required to bring a product or
service from material inputs to production, marketing, sales, final consumption and after sales services
and, eventually, recycling. Technological changes, organizational innovations and policies of
liberalization and deregulation in trade and investment have allowed for functional fragmentation of
value chain tasks into distinct units in some value chains and for outsourcing these tasks to capable
producers worldwide. A noteworthy characteristic of the maize value chain is its length. By the time
maize is turned into a final product, it has passed through many stages of collection, trading, processing
and further processing. A good number of end-products can be derived from just one particular cereal
(i.e. beer, which is made from barley and bread which is made from wheat flour).
The following characteristics of the grain value chain can be highlighted:
• Its length (as mentioned already)
• The scale required to perform in the first stages of the value chain. Traders, wheat millers, and
maize refiners are usually huge operations (with relatively low margins) that operate in a
consolidated environment
• Consolidation can therefore be listed as the third characteristic – from the processing stage to the
consumer product stage
There are many examples of companies that specialise in the trading/handling and industrial processing
of commodities to the exclusion of all else, i.e. they do not appear on the supermarket shelves. At the
right-hand end of the value chain companies appear that – with a few exceptions – are not found in the
stages to the left. Their strategy seems to be based on reaping the highest share of value added profits
throughout the chain and focusing on the end consumer. In general they contract out all processing
activities and the related sourcing of raw materials. Exceptions do exist, but a fully integrated company
with control over all stages of the production process and, presumably, full traceability is rare (Rabobank
International, 2005). Margins are higher at the right-hand end of the chain and it could well be that the
other operations do not satisfy the internal hurdle rates. In addition, competition is tough, but even more
so if one also has brands to sustain. It is interesting to note that within the grains value chain two worlds
with distinct characteristics meet: the world of branded consumer products and the world of commodities
(Rabobank International, 2005).

78
This section of the paper draws heavily from work conducted by Funke (2006). Table 14 provides an
overview of how the supply chain for maize is structured. After the farmer has harvested the maize, the
maize needs to be transported and delivered to a silo and stored. After delivery to the silo the farmer is
issued with a “silo certificate” which can be sold afterwards. The farmer is however exposed to price
fluctuations while holding the “silo certificate”, but can minimize this risk by hedging. The silo owner
never holds ownership over the maize that is stored, but simply provides a service charged at an agreed
upon storage and handling fee (FPMC, 2003). The price the farmer receives after selling the “silo
certificate” and deducting transportation costs and silo fees is known as the farm gate price.
Table 14: The maize-to-super maize meal supply chain for August 2006
Source: Funke, 2006.

79
Millers then buy maize from the silo owners, and after deciding at what price and how the maize should
be utilized, pay transportation costs for moving the maize to the miller as well as storage fees. The miller
can however sell hominy chop created during the milling process. The mill door price can subsequently
be calculated. Retail prices can be calculated by taking the weighted average of the price of maize meal
in retail stores across the country. A four-month lag was used during these calculations due to the fact
that statistical testing indicated that the highest level of correlation between producer- and consumer
prices was achieved when producer prices were lagged by four months. The appropriate use of this lag
was later confirmed after it was determined that the largest milling companies commonly employ a four-
month hedging strategy. This high level of correlation implies that a four–month period expires between
the time that the maize is purchased from the farmer and the time it actually becomes available to the
consumer (FMP Maize Report, 2004).
Figure 42: Prices and cost of the farm gate to the mill door leg of the maize to maize meal supply chain Source: Spencer, 2004).
Funke (2006) discussed the South African maize supply chain by separating it into two segments. The
first segment is the “farm gate to the mill door leg” of the supply chain, as illustrated by Figure 42. This
first leg describes value addition from the maize harvesting phase to the storage phase. SAFEX prices
that are lagged by a four-month period are indicated by the first point in Figure 42. Point 2 represents

80
the farm gate price, which is calculated by subtracting transportation costs and storage costs from the
SAFEX price. Mill door prices, indicated by point 3, are calculated by adding SAFEX prices,
transportation and storage costs (point 4) that are incurred between the silos and the miller, and then
subsequently subtracting earnings from chop (point 5) sold to the feed industry.
Figure 43: The mill door to retail leg of the maize to maize meal supply chain Source: Spencer, 2004.
Funke (2006) further discusses the second leg, namely the “mill door to retail leg”, in which maize
processing and distribution to the retailer level takes place. After the maize has been processed into
maize meal, the different distribution channels available can be illustrated by Figure 43. Most large
millers in South Africa conduct their own packaging and subsequently sell the maize meal under their
own brand to the supermarkets, small scale retailers and food service industries. Another possible
channel is to service the retail level through a wholesaler. Funke (2006) however notes that this channel
is being used less and less when conducting business with supermarkets, as more and more
supermarkets are sourcing directly from the millers.

81
Cost factors:
The main cost factors that influence the maize supply chain can be identified as packaging materials,
payment terms, transport and storage costs and supplier-retailer relationships. The following section will
elaborate on these factors (Funke, 2006).
Packaging costs:
Suppliers in the value chain believe that irresponsible behaviour of retailers unnecessarily increases
consumer prices. It is believed that consumer prices can be lowered if retailers make more of concerted
effort to ensure that more care is given when handling supplier packaging, as well as being held
responsible for damages to products incurred in the retail stores. Due the fact that packaging constitutes
a large portion of the final costs of the product, this is a cause for concern within the industry.
Payment terms:
Payment terms provided by retailers vary between 7 and 90 days. Most manufacturers hardly ever
experience problems with credit payments terms. It is however preferred that the payment be realized
as soon as possible, and becomes problematic when approaching 60 days (FPMC, 2003).
Transportation costs:
The Food Pricing Monitoring Committee (2003) found that transportation margins have a significant
influence on food prices. The inefficiency of rail transport coupled with the fact that retailers are passing
on higher transportation costs to consumers signal transportation costs as a cause for concern in the
maize supply chain.
Storage costs:
Due to the perishable nature and volume of maize, storage is essential in the supply chain. As
mentioned earlier the farmer pays storage fees up until the point the maize is sold. Thereafter the miller
is responsible for storage fees in cases when further storage is needed.
Supplier-retailer relationships:

82
Strong competition in the consumer goods market has forced modern supply chains to realize the
benefits of maintaining sound relationships with suppliers. However, some suppliers still feel that they
are being forced to accept unwanted terms in supply contracts due to the possibility of being delisted as
a supplier to the retailer.
3.4 PORTER ANALYSIS OF THE MAIZE MILLING INDUSTRY
The Porter model is used to analyze the determinants of competitiveness in the maize processing
sector. Porter uses barriers to entry, bargaining power of suppliers and buyers and the threat of
substitutes to explain the rivalry in the maize processing industry. Figure 44 summarizes Porter’s five
forces of model competition.
Figure 44: Porter’s 5 forces model of competition Source: Filling the Gaps, 2008.
Rivalry
• Concentration and volume of competitors- If competing maize millers are more concentrated
and if the larger portion of the market share is owned by only a few large maize millers the
competitive landscape is less competitive.
• Industry growth rate and capacity utilization and expansion- A slow industry growth rate results
in maize mills fighting for market share. If a market is still growing maize mills can easily
increase revenues by expanding in the market.
• High maize storage costs (silo’s), high input costs in the maize production and processing
industries as well perishability of maize products increases rivalry in the maize milling sector.

83
• Low switching costs and low levels of product differentiation increase rivalry in the maize milling
sector.
• High exit barriers, especially regarding expensive equipment bought in the maize milling
industry to run a maize milling plant, make it pricy to abandon a particular product.
Entry Barriers (Threat of new entrants)
• Economies of scale- Larger maize millers have economies of scale as the cost per unit
decreases as the size of the milling plant increases or expands.
• Cost advantages- Large milling companies can bargain for better prices or discounts due to the
fact that they buy more equipment or products.
• Product differentiation- A reduction in cost and economies of scale of larger maize millers
enable these companies to cut costs and invest these savings in producing differentiated
products.
• Switching cost- Switching cost is the cost of switching suppliers. This is a relatively high barrier
to entry as small and large millers are faced with this barrier.
• Capital requirements- Starting a maize mill is a very capital intensive procedure and the capital
requirements are frequently the strongest barrier to entry.
• Access to distribution channels- Access to distribution channels to get maize from the farmer to
the mill and to get the processed maize form the mill to the consumer is often hampered by high
transportation costs and poor logistical management.
• Governmental policies- Governmental policies regarding health and safety, traceability, the use
of GM products and other standards and policies is another barrier to enter the maize milling
industry (Quick MBA, 2007).
Bargaining power of buyers
• Buyer concentration, volume and information- The concentration and volume of the buyers as
well as the information that they have regarding a specific product often influence the power
that they have to influence the demand and thus prices of milled maize products.
• Ability to backward integrate- The ability of the buyer to buy directly from the miller instead of
through supermarkets or from other sources that sell the same product at a cheaper price
increases the buyer’s ability to bargain.
• Availability of substitutes and product variety- The buyer’s bargaining power will increase as the
amount of substitutes increase but also if the variety of products available increase.

84
• Price sensitivity- Buyers are less sensitive to price changes in inferior or normal goods, like
maize meal, than to price changes in luxury goods.
• Brand identification- Different brands of a variety of maize products are available and buyers will
typically choose to buy those products that satisfy their needs the best in terms of quality,
quantity and price.
Bargaining power of suppliers
• The more maize millers there are in a certain region the higher the rivalry and the lower the
bargaining power of one miller.
• Supplier’s knowledge of product’s value to the buyer- An increased knowledge of what the
buyer requires from a specific product increases the miller’s ability to bargain for higher prices.
• The bargaining power of millers decreases as soon as products become standardized.
• Threat of forward integration- Millers that deal directly with consumers have an advantage and
increased bargaining power to millers that lack this.
Threat of substitutes
• Relative price performance of substitutes and price elasticities- As more substitutes become
available the demand for the product becomes more elastic. Cheaper substitutes for certain
maize products will be preferred especially if quality are not given up on. Millers who produce
maize products cheaper will thus have a competitive advantage to those millers who cannot
afford to produce maize products more cheaply.
• Buyer propensity to substitute - The success of cheaper substitute products however doesn’t
only depend on the product itself but also on the buyer or consumer’s ability and willingness to
substitute the one product for the other.
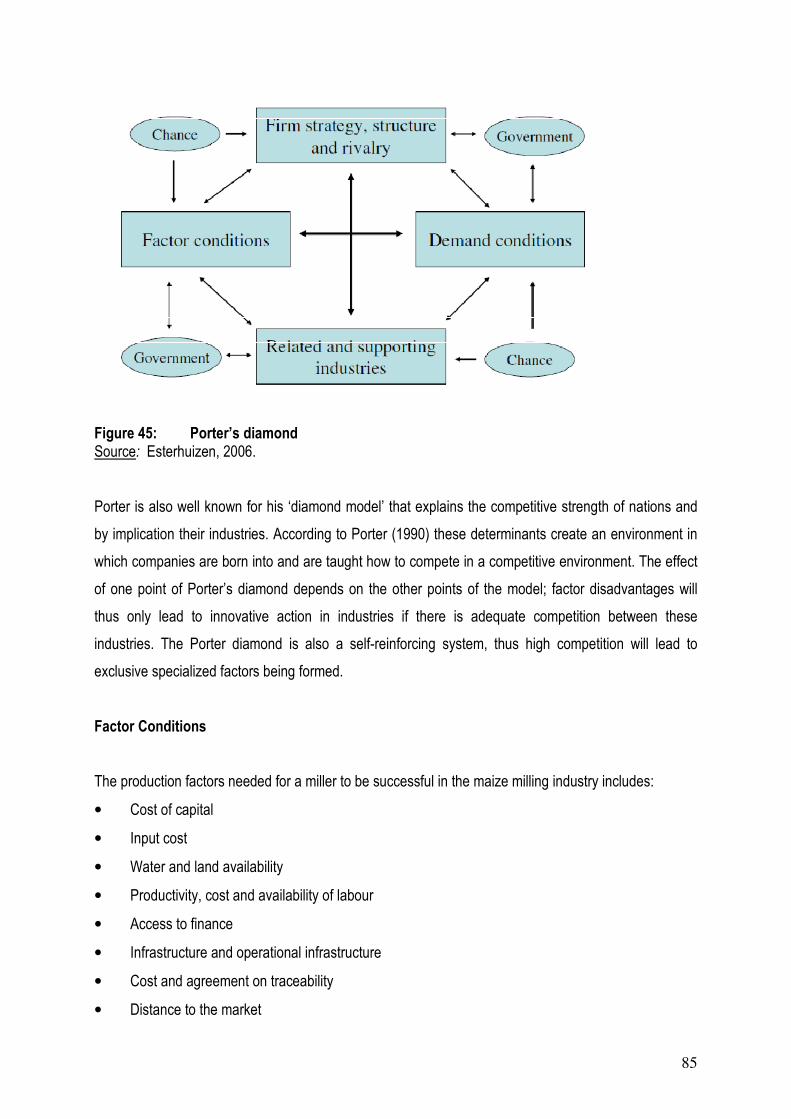
85
Figure 45: Porter’s diamond Source: Esterhuizen, 2006.
Porter is also well known for his ‘diamond model’ that explains the competitive strength of nations and
by implication their industries. According to Porter (1990) these determinants create an environment in
which companies are born into and are taught how to compete in a competitive environment. The effect
of one point of Porter’s diamond depends on the other points of the model; factor disadvantages will
thus only lead to innovative action in industries if there is adequate competition between these
industries. The Porter diamond is also a self-reinforcing system, thus high competition will lead to
exclusive specialized factors being formed.
Factor Conditions
The production factors needed for a miller to be successful in the maize milling industry includes:
• Cost of capital
• Input cost
• Water and land availability
• Productivity, cost and availability of labour
• Access to finance
• Infrastructure and operational infrastructure
• Cost and agreement on traceability
• Distance to the market

86
Demand Conditions
The demand conditions capture the nature and degree of demand within the nation regarding processed
maize products. These conditions are:
• Purchasing power
• Changing consumer trends
• Growth of informal market
• Size and growth of market
Related Industries
Related industries include the continuation, degree and the international competitive power of various
other industries in a country that aid the maize milling industry. The factors that influence this matter are:
• Logistics
• Quality and availability of imported and local inputs as well as reliability of input suppliers
• State of technology, training and skills development
• State of research and development and the availability of quality of information in the industry
Corporate Strategy, Structure and Rivalry
Corporate strategy, structure and rivalry entail the circumstances in the home market that influence the
ways in which corporations are created to grow with proper management. Generally local maize mills
that fight for survival locally have a better chance to compete internationally.
• Relationships and networks
• Supply chain coordination
• Regulations and standards
• Level of competition
• Business behavior
• Nature of barriers to entry
• Nature and activities of industry organizations
• Pricing strategies
• Diversification strategies
87
The role of Government in the model
Government’s role in the Porter diamond is to act as a contender and medium to push companies to
increase their goals and move to higher levels of competitive performance, thus government should:
• Encourage millers in the maize milling industry to raise their performance by implementing strict
standards.
• Create early demands for superior processed maize products.
• Focus on unique factor formation.
• Stimulate domestic competition by restraining direct cooperation and implementing anti-
competitive strategies.
The role of chance
Chance events are events that have nothing to do with current situations and that cannot be controlled
or influenced by a nation, government or firms such as decreases in demand, political decisions by
foreign governments, shifts exchange rates, input demands and various other factors (van Rooyen,
Esterhuizen & Doyer, 1999). Chance can destroy or create new sources of competitive advantage
(Esterhuizen, 2006).
3.5 CURRENT GLOBAL CHALLENGES FACED BY THE MILLING INDUSTRY
The global maize industry is faced with numerous challenges and issues that affect the effectiveness of
the industry and the movement of maize through the supply chain from the producer to the consumer.
Listed below are challenges brought about by the recent economic crisis, challenges faced by farmers
on farm level, challenges due to a changing market as well as more recent issues and challenges.
Economic challenges
• Financial crisis
The number of undernourished people is estimated at 105 million, pushed up due to the recent
economic crisis. Undernourishment is due to unemployment, a reduction in disposable income as well
as unstable commodity prices and limited access to food. The economic crisis might also impact
negatively on agricultural productivity and investment which will further hamper food security and
nutrition especially in developing countries. During times of economic crises banks immediately cut
lending. This will prevent farmers from getting loans to invest in production of agricultural products and
farmers that obtained loans before the crisis will struggle to repay these loans possibly resulting in
farmers going bankrupt. High interest rates also constrain the farmer’s ability to lend money or to make
decent profits to invest or reinvest in his production process. This reduction in production will be
88
countered by increasing the amount of products imported as demand for these products will still exist
(Suresh, 2009).
• Exchange rate volatility
Volatility in the exchange rate poses a major threat to producers and consumers of maize internationally
as maize prices and production inputs in many countries are highly dependent on exchange rates.
However exchange rates not only influence the price of maize but also have an impact on the volumes
of maize imported and exported and the destined countries.
Challenges faced on farm level
• Global warming
Developing countries are expected to be the most affected by this phenomena as they are the least
likely to adapt in time. Global warming brings about various problems such as drought and a reduction
of yields, floods and hail and total crop losses because of this. Global warming can also create
favourable conditions for pests and diseases which can wipe out entire crops (ACCID, 2009).
• El Niño
El Niño is a very important weather phenomenon to take into consideration as it puts global maize
production, especially producers in the southern hemisphere, under severe strain due to the dry
conditions that are brought about by El Niño. These dry conditions result in sharp declines in maize
yields. El Niño can, on the other hand, also have a positive influence on maize production, especially
when its timing corresponds with the vital pollinating stage of maize crops (Abbassian, 2009).
El Niño is expected to occur once again in the 2009/10 production season. Thus it is important to note
the effects of El Niño and the impact that this weather phenomenon may have on the production of
maize and thus indirectly on the maize processing sectors, the supply of various maize products to the
consumers and the prices. El Niño may reduce or increase production in some regions and this will
influence the ending stock of maize as well as the maize available to the processing sector. A reduction
or increase in the ending stocks will influence prices of maize as well as prices of processed maize
products. It is thus clear that El Niño will have far reaching price effects not only for producers but also
for processors and consumers (Abbassian, 2009).

89
• Technology and Input costs
Technology and the lack thereof, especially on farm level and in the emerging farming sector, often
handicaps prosperity on farms. High input costs will reduce the amount of maize planted which will lead
to a reduction in supply and thus a reduction in profits in the maize industry.
• Labour
The labour force in the agricultural sector is facing many problems. HIV, especially in Africa, poses a
significant threat to the labour force as millions of people are infected with and die from the virus world
wide. High minimum wages and the high levels of unskilled labour further contribute to the global high
cost of labour (Avert, 2008).
• Water scarcity
The agricultural sector is one of the major users of groundwater. It is thus of the utmost importance to
ensure that water is used sparingly and with caution by the agricultural sector without reducing yields
and thus income generated by the sector (FAO, 2008).
• Cost price squeeze
According to economist Dennis Shields the cost price squeeze is a result of farmers buying inputs and
not using home-grown inputs. Crop producers face volatile energy and fertilizer costs which influence
their returns. Shields also stated that periods of high commodity prices lead to expansion in crop
production and this results in higher input prices which reduce profits. This in turn reduces production
and ultimately leads to farmers going out of business if they cannot come up with ulterior motives, such
as increasing production to increase output for given levels of input, to try and avoid the negative effect
of the cost price squeeze (Ellis, 2009).
Challenges brought about by a changing market
• Population growth
The low availability of grain at this stage is not only due to the increase in population but that the world
demand for food has been increasing at a rate much faster than increases in production. Joachim von
Bruan from IFPRI has stated that while world food production is increasing by between 1 and 2 percent
per annum, the world population increases by around 4 percent per annum (World Food Crisis, 2008).
• Consumer driven

90
The integration of the demand side of the food chain changed the world from a production driven market
to a consumption driven market. This led to an increase in the variety and options of products available
to consumers (Bosserman, 2007). This is primarily caused by higher consumer awareness and will
increase in future as consumer awareness increases.
• Changing disposable incomes
A shift to more luxurious products can be seen as the consumer’s disposable income increases.
Consumers will generally not buy as much maize meal when a higher disposable income is earned. A
shift towards starch substitute foods such as bread, pasta and potatoes is often seen.
• Convenience and healthy
Consumers are increasingly seeking for products that are healthy without compromising convenience.
Consumers prefer to use and or eat “on the go” food products as they want to buy, prepare and eat in
the quickest, easiest way possible (Staff reporter, 2005).
More recent issues
• Traceability
Another future high growth area is traceability. It is becoming increasingly important for consumers to
know the exact origin of the seed stock as well as the process of production from planting, harvesting
and post harvest processing to guarantee the purity of the final product (Bosserman, 2007).
• Biofuels
Large investments are expected in the maize industry especially for the production of biofuels as a
result of the depletion of fossil fuel levels and the environmental impact caused by the use of fossil
fuels.
• Sustainability, food safety and green movement
Sustainability in the agricultural sector is threatened by consumers demanding safe, clean, as well as
green products because of diseases related to health scares and uneasiness regarding the production
and consumption of genetically modified products such as maize (USDA, 2007). The application of
genetically modified maize will however aid in increasing production as more valued crops will be
planted on less land (Bosserman, 2007). The issue of producing agricultural produce in a green
environment makes the provision of food to the hungry a difficult task.
91
• Emerging farmers
Emerging farmers in the maize industry face problems regarding affordable storage facilities and
transport, much needed mentorship programs guiding them to become commercial farmers as well as
the lack of opportunities to obtain loans to produce high quality, marketable maize (Nyathi, 2009).
• Land reform
According to Tina Joemat-Pettersson, South African minister of Agriculture, Forestry and Fisheries,
commercial farmers in South Africa play a vital role when it comes to producing sufficient quantities to
try and change South Africa from being a net importer of food to being a net exporter. She stated that
this will not be possible if all arable land is in the hands of subsistence farmers. Critics of land reform
have argued that the current land reform policy harmed agricultural investment more because it took
agricultural land out of the hands of commercial farmers (Joemat-Pettersson, 2009).
• Food security
Consumers of the world’s poorest nations are often the hardest struck when it comes to the food
security crisis. Consumers in these countries are suffering form severe, unrelieved malnutrition. The
World Health Organization (WHO) identified 7 factors that may add to the global food security crisis.
These are (WHO, 2010):
• Increasing prices of energy
• Insufficient investment in global agriculture
• Higher incomes and economic growth stimulate demand for food
• Subsidies leading to trade distortions
• Persistent unfavourable weather conditions and environmental degradation
• Subsidized bio-fuel production substituting the production of food
• Imposition of export limitations leading to hoarding and consumers buying out of panic
According to the OFID study done by IIASA in 2009 the cereals needed to produce the necessary
biofuel will come from altering three parts of the agricultural sector as illustrated in Figure 46. Two thirds
of the needed cereal will come from increased production (66 percent) and the other third will come from
a reduced use of feed (24 percent) and a reduced use of food (10 percent). These reductions in feed
and food use may pose a threat to the already high global cereal demand and prices.

92
Figure 46: Where do cereals needed for biofuel production come from? Source: Adapted from IIASA, 2009.
3.6 CURRENT ISSUES IN THE GLOBAL MAIZE INDUSTRY
New Australian grain wagons
In eastern Australia, 84 new grain wagons were constructed and put into place to deal with the shortage
of grain trains. These trains can move 68 tonnes of maize or wheat on main lines. According to Gordon
Davis, AWB managing director, a new level of supply chain efficiencies will be driven by these wagons
in conjunction with their efficient GrainFlow sites to meet the needs and demands of domestic and
export consumers (World Grain, 2009). These Australian grain wagons will increase the efficiency of the
grain distribution channel which will positively impact the movement of grains from producers to
consumers including the international consumer of grain.
Recent growth in Chinese maize processing sector
The growth in Chinese maize is mostly due to the growth in the processing of maize into industrial
products during the past decade. The increase in the industrial processing of maize was so substantial
that exports of these industrial products increased while exports of unprocessed maize declined.
Currently approximately 25 percent of total maize in China undergoes processing, yielding; food,
alcohol, feed and chemical products. Figure 47 illustrates major maize producing countries’ global
contribution to maize use. From the pie chart it is clear that China and the US accounted for over half of
the maize used in 2007/08.
24%
10%
66%
Reduced feed use Reduced food use Increased production

93
Figure 47: Maize consumption 2007/08 Source: USDA, 2009.
Figure 48 clearly indicates the fast growing component of China’s maize use from 1985/86 to 2007/08.
The use of maize for industrial processing was in the minority up until the middle of 2001/02 after which
the use of maize for industrial processing increased significantly.
Figure 48: Maize usage in China Source: USDA, 2009.
Figure 49 serves as proof of the large increases in the industrial processing sector in China. Exports of
maize based industrial products were relatively low up until 2006/07. In 2008/09 exports of unprocessed
China
19%
United States
34%
European Union
8%
Brazil
6%
Mexico
4%
Rest of the
world
29%
0
10
20
30
4050
60
70
80
90
100
1985
/86
1987
/88
1989
/90
1991
/92
1993
/94
1995
/96
1997
/98
1999
/00
2001
/02
2003
/04
2005
/06
2007
/08
2009
/10
Mil
lio
n m
etr
ic t
on
nes
feed food,seed and other Industrial
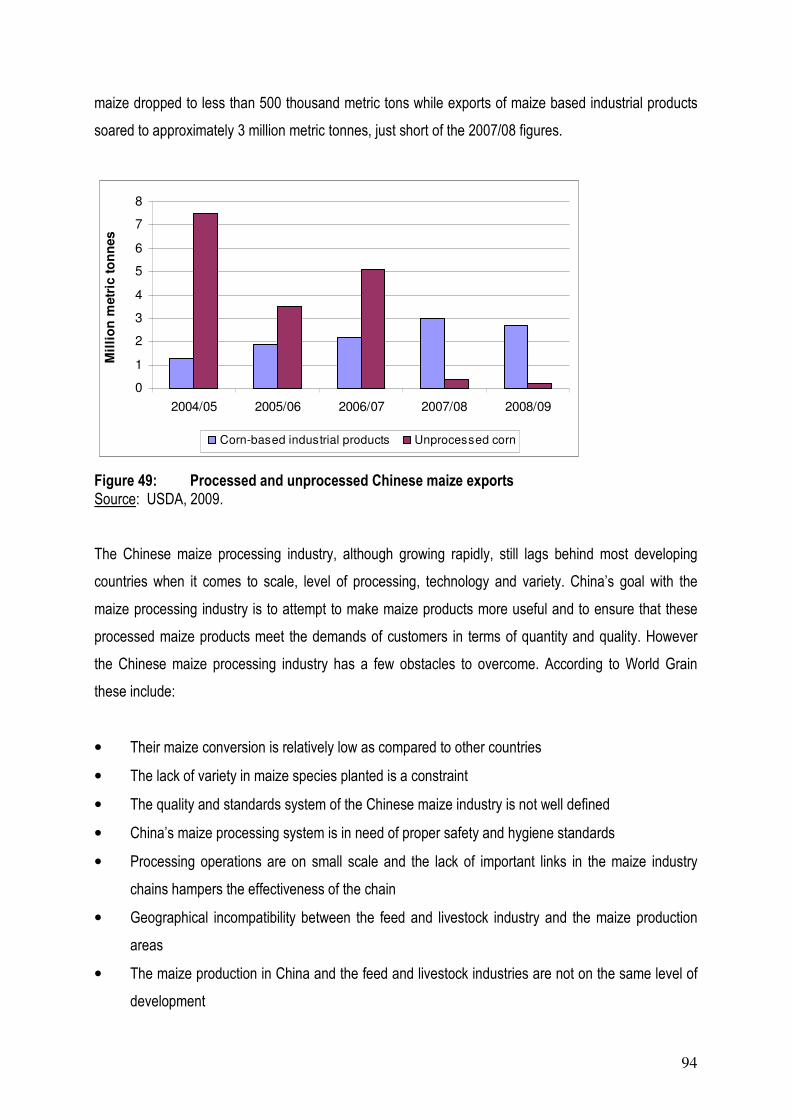
94
maize dropped to less than 500 thousand metric tons while exports of maize based industrial products
soared to approximately 3 million metric tonnes, just short of the 2007/08 figures.
Figure 49: Processed and unprocessed Chinese maize exports Source: USDA, 2009.
The Chinese maize processing industry, although growing rapidly, still lags behind most developing
countries when it comes to scale, level of processing, technology and variety. China’s goal with the
maize processing industry is to attempt to make maize products more useful and to ensure that these
processed maize products meet the demands of customers in terms of quantity and quality. However
the Chinese maize processing industry has a few obstacles to overcome. According to World Grain
these include:
• Their maize conversion is relatively low as compared to other countries
• The lack of variety in maize species planted is a constraint
• The quality and standards system of the Chinese maize industry is not well defined
• China’s maize processing system is in need of proper safety and hygiene standards
• Processing operations are on small scale and the lack of important links in the maize industry
chains hampers the effectiveness of the chain
• Geographical incompatibility between the feed and livestock industry and the maize production
areas
• The maize production in China and the feed and livestock industries are not on the same level of
development
0
1
2
3
4
5
6
7
8
2004/05 2005/06 2006/07 2007/08 2008/09
Mil
lio
n m
etr
ic t
on
nes
Corn-based industrial products Unprocessed corn

95
The table below indicates the maize situation in China. Note the drastic increase in maize consumption
and the subsequent decrease in exports. It is expected that consumption will increase as China’s
population move their diet from a rice based to more meat.
Table 15: The maize situation in China (2000/01-2008/09)
Area harvested Production Exports Consumption
2000/2001 23056 106000 7276 120240
2001/2002 24282 114088 8611 123100
2002/2003 24634 121300 15244 125900
2003/2004 24068 115830 7553 128400
2004/2005 25446 130290 7589 131000
2005/2006 26358 139365 3727 137000
2006/2007 28463 151600 5269 45000
2007/2008 29478 152300 549 149000
2008/2009 29400 165500 500 152000
Source: World Grain, 2009.
The impact of the financial performance of large agribusiness companies on world commodity
prices
The structural changes that were brought about by the world financial crisis, coupled with substantial
positions held by financial fund companies world-wide; result in the world grain price being sensitive
towards the financial performance of large agribusiness companies. The revenues of CHS Inc., a
Fortune 500 holding company for a system of U.S agricultural cooperatives, declined by 25 percent in
the second quarter of 2008. This reduction was brought about mainly by the lower values of grain
refined fuels and crop nutrients. Prices of spring wheat, soybeans and maize showed a decline of $7.67,
$3.90 and $1.22 respectively. Volumes also fell by 7 percent during December to February 2009
compared to 2008. CHS processing operation also showed a reduction which resulted from the decline
in oilseed processing, food production, wheat milling and renewable fuels operations. In total net income
fell by 53 percent and sales fell by approximately 3.8 percent (World Grain, 2009).
Bunge Ltd a Bermudan food conglomerate situated in New York, U.S, reported in April 2009 that they
sustained yet another loss due their fertilizer segment’s poor margins and weak agribusiness demand.
The agribusiness’s sales fell with 26 percent for the first quarter of 2009 from the same period in 2008.
The company’s milling sector however thrived and showed an increase of 171 percent in earnings from

96
milled products this is as a result of an increase in the volumes milled of wheat and maize (World Grain,
2009).
Grain storage and handling
The manufacturing of grain storage and handling equipment have remained busy in the midst of the
global economic slump and deep recession that hampered credit availability. Although the grain storage
and handling equipment for ethanol production sector declined somewhat, the demand for this
equipment for the flour milling, feed milling and oilseed processing sectors remained the same. Eastern
Europe, mainly Russia as well as Asia, the Middle East and South America are some of the more active
regions in terms of building new grain storage facilities and adding capacity to existing plants. The most
favoured material for building these grain storage facilities is galvanized steel as it is more durable.
Customers demand equipment that are environmentally friendly and that reduce dust emissions and
noise pollution (World Grain, 2009).
Importance of information
Information and correct record keeping of prices, quantities, quality etc is crucial to keep the grain
markets of the world informed. The International Grains Council (IGC) provides this very important
service to governments and everyone involved in grain processing and trading. The core function of the
IGC is to supervise and analyze the grain and oilseeds markets and to provide members and
stakeholders with the needed information in a timely and neutral manner as an intergovernmental
organization. Accurate information is of the utmost importance especially because of volatility that
affected the grain markets in recent years. Concerns regarding supply in top exporting countries and the
lack of information regarding this can lead to disorder in the grain markets. The IGC is hoping to expand
their services further by adding a five year forecast of supply and demand for maize, wheat and barley
(World Grain, 2009).
3.7 BUSINESS MODELS OF THE FUTURE
Organisations and industry need to be able to engage successfully in the rapidly changing current and
future business and market environment. Continuous business models and structure development is
required to be able to cope with changes and to be able to ensure sustainable growth. Figure 50 below

is a representation of the elements needed for a business model to be able to function successfully
given that all three aspects are included into the strategic knowledge of thinking in an organisation.
Figure 50: Business Model Template
Source: Abell, 2009
Based on the model of Abell (2009) management of a business must focus on th
follows:
• Customer: Who is the customer that the business will be serving in the future?
• Value proposition: What will be offered to the customer in the future?
• Resources & capabilities: How will the ‘offer’ to the customer be delivered
processes
The development of business models for the future should focus on the customer with the environment
and sustainability as the core for decision
Pearson (2010), a renowned futurologist shared his personal view on how the world of business can
look like in 2020.The following trends were discussed by him:
• “The increasing political and economic dominance of emerging markets will cause global
companies to rethink and customize th
• Climate change will remain high on the agenda as companies seek to explore resource efficiency
to improve the bottom line and drive competitive advantage.
• The financial landscape will look vastly different as increasing regulation
intervention drive restructuring and new business models.
is a representation of the elements needed for a business model to be able to function successfully
hat all three aspects are included into the strategic knowledge of thinking in an organisation.
Business Model Template
Based on the model of Abell (2009) management of a business must focus on th
Customer: Who is the customer that the business will be serving in the future?
Value proposition: What will be offered to the customer in the future?
Resources & capabilities: How will the ‘offer’ to the customer be delivered and value added in the
The development of business models for the future should focus on the customer with the environment
and sustainability as the core for decision-making and strategy, according to the IIED (2009).
uturologist shared his personal view on how the world of business can
look like in 2020.The following trends were discussed by him:
The increasing political and economic dominance of emerging markets will cause global
companies to rethink and customize their corporate strategies.
Climate change will remain high on the agenda as companies seek to explore resource efficiency
to improve the bottom line and drive competitive advantage.
The financial landscape will look vastly different as increasing regulation
intervention drive restructuring and new business models.
97
is a representation of the elements needed for a business model to be able to function successfully
hat all three aspects are included into the strategic knowledge of thinking in an organisation.
Based on the model of Abell (2009) management of a business must focus on the three segments as
Customer: Who is the customer that the business will be serving in the future?
and value added in the
The development of business models for the future should focus on the customer with the environment
making and strategy, according to the IIED (2009).
uturologist shared his personal view on how the world of business can
The increasing political and economic dominance of emerging markets will cause global
Climate change will remain high on the agenda as companies seek to explore resource efficiency
The financial landscape will look vastly different as increasing regulation and government

98
• Governments will play an increasingly prominent role in the private sector as demand for greater
regulation and increasing fiscal pressures dominate the agenda.
• In its next evolution, technology will be driven by emerging-market innovations and a focus on
instant communication anytime, anywhere.
• Leaders will need to address the needs and aspirations of an increasingly diverse 21st century
workforce.
The way that business leaders plan for — and respond to — these trends over the next decade will help
determine who the market leading companies of tomorrow will be (Pearson, 2010 in [Earnest & Young,
2010).
Professor Mohammed Karan (2010) addressed the Agricultural Business Chamber (ABC) conference in
Somerset-West in the Western Cape on behalf of the National Planning Commission (NPC). The NPC
have a vision towards 2025 to look at agriculture in a new era. They are currently researching a new
paradigm for agriculture. The main focus of the strategic planning according to prof. Karan (2010) is to
answer ‘what is urgent’ and ‘what is important’. Thus the NPC will focus on the following:
• Cry the beloved countryside
• Rediscover our role in the economy
• Getting past the ethical issues and stigmas
• The viability and role of the small scale farmers
• Assisting new entrants
• How to help the poor do better
• Serious lack of transformation
• Trust and contracted arrangements
• Implicit subsidization and multi-functuality
• The food security conundrum
• Water
• Competition issues

99
• Extending into Africa
• Public research quovadis
• Future of family farms
• Private equity in agribusinesses
• Education and professional development
• Nature of growth
• Gender
• Climate change
If the NPC can succeed in finding effective solutions to overcome these paradigms, then agriculture in
South Africa can grow sustainably. However in the mean time, agribusinesses will have to adapt their
business models to make provisions for these paradigms as well.
“Business must build their own capacities to work effectively for sustainable development, and engage
in strategic alliances with other enterprises, financial service providers, government agencies
development practitioners and communities” (IIED, 2009). This should also apply to the National
Chamber of Milling. As indicated by the IIED (2009) the following key principles incorporated in the three
elements of a business model need to be joined in strategic planning:
• “...the ‘value proposition’ of a business model for sustainable development needs to be
considered in terms of financial, environmental and social values.”
• “...the company needs to look not only at value creation and capture for itself and its customers,
but also value distribution throughout the market chain.”
• “The more effective the long-term business model for sustainable development are designed
and implemented via collaboration.” (IIED, 2009)

100
Although each business and industry have a different approach to these core principles, at the end the
value added to the business as well as the supply chain and final customer remains paramount.
Agriculture today faces huge challenges. Cooperation and co-creation of new knowledge markets is
essential in the debates concerning the future of agribusiness, agriculture and the environment. Most
issues require involvement not only from the business community and knowledge institutions, but also
different levels of government and a diverse set of societal organizations.
Many (international) organization and companies are working to ensure a future for agriculture that is
sustainable in terms of economic growth and environmental and societal values. In a broader
perspective, those organizations generally work towards the same goal, but focus on different aspects
of the agricultural arena or have a different mode of operation. Still, there is no clear recipe on how to
work on this challenge and with whom. We are still in the experimental stages.
Organisations and businesses of the future will have to adapt and change their current core business
models and short sighted visions of the present. This is to be able to facilitate the following and ongoing
changes in the business and market environment, and answer the questions raised on the future of the
milling industry.
The continuing reshaping and changes in the world’s economies and financial markets are key
principles to consider how to manage the external business environment and retain and develop current
core businesses. Business’s scenarios of the future and how the unfolding of these scenario’s can
potentially impact on the business must be developed and tested by expertise within the organisational
and strategical planning of the board of directors. Dynamic and pragmatic business models for the
future are required and contingency plans must be in place to focus on current and future risks,
structural changes and unforeseen shocks.
Environmental conflicts within the food system are not a new concept to agriculture, rather an
overlooked concept. Business models of the future will have to determine continuously creating
sustainable growth given the environmental impact. In South Africa, for example, the rights of water are
beginning to have a major impact as a restriction on farm expansion. Without farm expansions,
industries cannot grow sufficiently and thus do not adhere to the goal of sustainable growth.
Technology and innovation implementation in meeting food system challenges needs to be up to
standard and globally competitive. New methods and machinery needs to be implemented to lower

101
costs and increase production efficiency and competitiveness without increasing the cost to the
consumer. The harness of renewable energy needs to be used in running this technologically advanced
machinery to further reduce harm to the environment.
Responsible food supply systems as well as the effectiveness of system optimising are critical for
businesses to build their business models for the future. The effectiveness of today’s systems means
the downfall tomorrow if no improvements are made to the supply chain infrastructure, communication
systems, logistics and control.
Human capital development and management issues are a growing concern for the future. During the
2009 AEASA conference in Durban, it was emphasised that there are not sufficient technical expertise,
trained agricultural economists, extension officers and industry leaders in South Africa to supply in the
demand for trained expertise. Organisations must invest into programmes to train new graduates in the
respective fields of agriculture.
The following issues can impact on the South African agricultural landscape and new questions needs
to be asked about the future environment in which they operate:
• Correcting the structural imbalance of maize exports, soyabean and wheat imports in SA
agriculture
• The impact of government policies on various aspects of agriculture and economy of SA
• EU farm subsidies will phase out
• USA exports will be competitive given the devaluating currency
• South Africa will have a strong currency because of other structural weaknesses in other
countries
• Agricultural growth markets will shift with the realignment of exchange rates
• In the past there has been too large focus on traditional markets. This lead to increasing the
South African concentration risks
• The South African agricultural industries are under pressure. The increase in economies of
scale as well as capital intensity, yield increases and diversifying can result in lower numbers of

102
small scale shareholders because they have difficulty to establish themselves in the current
market environment – a dichotomy in terms of establishing more emerging farmers.
• The lack of agricultural policy guidelines will change the way in which markets are shaped
• The impact of the emerging BRIC countries, and how these countries will handle imports and
exports
• The impact of China on the world, and how this impact will change exports and imports
• The current state of the South African infrastructure. The lack of maintenance and
infrastructural development will result in decreased competitiveness and higher costs to the
consumers
• The environment and green movements are becoming a major concern to all. This needs to be
factored into the strategical thinking of organisations to address value adding without damaging
the environment
• The alliances and relationships formed within the supply chains as well as the ownership of an
entire supply chain structure
• The continuous investigation of the Competition Commission and the impact on businesses. If
the Competition Commission keeps focussing on individual large businesses (being highly
integrated on all levels in the supply chain) the result may be that these groups may source
from outside companies.
• Continuous talk on land redistribution and the nationalisation of farm land in South Africa
• The lack of appropriate governmental involvement in creating a sustainable growing agricultural
sector without down grading methods
• Ownership arrangements into BEE
Given the above, the business model of the future will have to be pragmatic and focus on the following:
• Sustainability
• Climate change
• Emerging farmers/markets
103
• Technology
• Systemic risks
• The balance of power
Maize farmers, maize millers and the industry as a whole can develop an acceptable business model to
focus not only on the current market environment but also to create value to customers in the future.
The SWOT analysis of these industries, as earlier mentioned, assists in forming the core foundation and
structure of the business model. Without this vision structure to expand upon and revise continuously, a
business will not be able to create sustainable growth for the future.

104
CHAPTER 4 DATA ANALYSIS AND RESULTS
4.1 INTRODUCTION
The following chapter provides an in depth analysis of all the results obtained in the study. As was
mentioned in chapter 3, in total thirty six interviews were conducted with maize millers in the North West
and Free State provinces. The maize millers ranged from small to large scale millers, with various
degrees of experience in years. For the purposes of this chapter, the findings and results of the study
will be classified into small, medium and large scale millers. By classifying this chapter into scales of
production a more accurate and precise study with clearly stated results and findings will be secured, as
the opinions express by small, medium and large scale millers varies in a great deal of degrees .
4.2 STRUCTURE OF MAIZE MILLERS INTERVIEWED
In total, 36 maize millers were interviewed in the North West (15) and Free State (21) provinces. The
maize millers that were interviewed differed from one another in the number of years in business, the
amount of maize milled per day, the number of employees within each organisation and the total
investment in buildings, machinery and vehicles. By classifying the number of maize millers within these
categories a more precise and consistent study could be conducted. The categories will be used later in
this chapter to form a clear understanding of the opinions of various maize millers within the North West
and Free State provinces.
The years of experience varied from one to ten years, from 11 to 20 years and more than 20 years of
experience. The following figure provides a graphical representation of maize millers interviewed
according to the number of years in business.

105
Figure 51: Years of experiences of maize millers interviewed
Figure 51 clearly indicates that of the 36 maize millers interviewed, 31 percent have been in business
between one and ten years, 40 percent have been in business between 11 and 20 years and 29 percent
have been in business more than 20 years.
The study further classified the maize millers interviewed according to the amount of maize milled per
day. A small scale maize miller mills between 0.5 and 25 tons per day, a medium scale miller mills
between 26 and a 100 tons per day and a large scale miller mills more than a 100 tons per day. In total,
52 percent of all maize millers interviewed fell in the small scale bracket in terms of the quantity of maize
milled per day. Medium scale millers represented 33 percent of all maize millers interviewed and the
rest, 15 percent, fell in the large scale bracket. The following figure provides a graphical representation
of the size and scale of the maize millers interviewed.
Figure 52: Size and scale of maize millers interviewed.
> 20 years
29%
Ten - Twenty years
40%
< 10 years
31%
Small
53%Intermediate
32%
Large
15%

106
The number of employees within the organisation was classified between 1 and 20, between 21 and 50,
between 51 and a 100 and organisations that have more than a 100 employees. Figure 53 provides a
graphical representation of the scale of employees within an organisation. From Figure 53, it is eminent
that the largest part of maize millers has between 1 and 20 employees. In total 73 percent of all maize
millers fell in this bracket. 15 percent of maize millers interviewed fell within the second bracket of
between 21 and 50 employees. The remaining two brackets, between 51 and a 100 and more than a
100 employees, both represent 6 percent respectively.
Figure 53: The number of employees within an organisation.
The cost of capital for maize millers provided the last platform upon which maize millers could be
classified. Cost of capital included the machinery, buildings and vehicles used for daily operations at the
milling plant. For the purposes of the study, the cost of capital was classified into the following brackets:
• less than R150 000,
• between R150 000 and R2.5 million
• between R2.5 million and R5 million
• between R5 million and R50 million and,
• between R50 million and a R100 million.
<20
73%
20 to 50
15%
51 to 100
6%
100 to 1000
6%

107
Figure 54: The capital investments of maize millers interviewed
Figure 54 illustrates in which bracket the maize millers that were interviewed fell. From the 36 maize
millers interviewed, three percent said that their total cost of capital was below R150 000. The majority
of maize millers, 34 percent, indicated that their total cost of capital fell between the R150 000 and R2.5
million bracket. The bracket of between R2.5 million and R5 million, represented 24 percent of all maize
millers interviewed. 35 percent of the interviewees said that their capital cost are between R5 million and
R50 million. The last nine percent of maize millers interviewed indicated that their capital cost exceeded
R50 million but was not more than a R100 million, this qualified them for the last cost of capital bracket.
The cost of capital was further disaggregated into the average cost of buildings and machinery for small,
medium and large scale millers. Although of a sensitive nature, some of the interviewees were willing to
provide the necessary estimates, while the rest were reluctant. The outcome and result of the estimates
are that the average cost of capital for buildings of a small scale miller is approximately R0.8 million, a
medium scale miller’s cost of building is around R1.8 million, while a large scale miller’s average cost of
buildings are around R12.5 million. The machinery also yielded interesting estimates. For a small scale
mill capacity, the average cost of machinery is around R2.0 million, for a medium scale mill capacity the
average cost of machinery is around R4.5 million, while the capital expenditure on machinery for a large
scale capacity will on average be estimated at R27 million..
For the purposes of this study, the average maize mill organisation interviewed has a small scale
capacity, mills between 0.5 and 25 tons per day, has between 11 and 20 years of experience, employs
between one and 20 employees and has a total cost of capital of between a R150 000 and R2.5 million
<R150 000
3%
R0,15 - 2.5 million
34%
R2.5 - 5 million
24%
R5 - 50 million
30%
R50 - 100 million
9%

108
expenditure. As was mentioned in the introduction of this chapter, the results and opinions of the maize
millers interviewed will be classified into a small, medium and large scale capacity.
4.3 CONDUCT OF MAIZE MILLERS INTERVIEWED
4.3.1 INTRODUCTION
The conduct of the maize millers interviewed section refers to the patterns of behaviour that market
participants adopt to affect or adjust to the markets in which they buy or sell. This section includes the
competitive conduct of all market participants, a strengths, weaknesses, opportunity and threats
(SWOT) analysis of maize millers interviewed, the identified critical areas of a maize mill business, the
key issues/challenges/constraints currently being experienced by maize millers, a Porter analysis
identifying the barriers to entry and exit, the procurement practices of maize millers, impacts of the
external environment and associated main problems and risks. All of these aspects will be covered in
detail in the following section. This section will be divided into the results associated with a small,
medium and large scale mill capacity.
4.3.2 LEVEL OF COMPETITION
The level of competition serves as an indicator of the long term sustainability of an industry. A high level
of competition indicates market powers and monopolistic behaviours of key stakeholders within an
industry. A high level of competition further enhances product differentiation and makes sure that the
needs of the customers are met. The level of competition should not be too high to prevent new market
entrants from entering the market while it should also not be too low that it will lead to a monopolistic
situation. Low levels of competition will lead to customers being exposed to unnecessarily high prices
and a one dimensional product. It is therefore vitally important to ensure that the level of competition is
at a healthy level which will benefit producers and customers alike. From the outset of the study, special
emphasis was put on the relevant importance of the level of competition within the maize milling
industry.
The opinions expressed by the relevant maize millers that were interviewed on the subject of the level of
competition were one-sided but still enlightening. Figure 55 gives an indication of the level of
competition perceived by the maize millers that were interviewed.

109
Figure 55: The level of competition perceived by the interviewees
From Figure 55, it is eminent that 74 percent of all interviewees responded that the level of competition
within the industry is very high. All the large scale millers (100 percent) responded that the milling
industry is highly competitive, for the reason that large scale millers compete against each other in
terms of pricing strategies and for the same market space. Large scale millers are of the opinion that it
is not difficult for new maize mill entrants to enter the market, especially for smaller and on-farm mills
which results in a loss of market share for the large scale mills. It is vitally important for large scale
millers to adjust quickly to new market trends and to differentiate products to meet customers demand
and preferences.
Of the 11 medium scale millers, 70 percent responded that the maize mill industry is highly competitive,
20 percent responded that the level of competition is on average the same as what one would expect in
any business environment and 10 percent replied that the maize mill industry’s level of competition is
low. The reasons for the differences in answers could be attributed to the various distribution channels
that the maize mill businesses are using. The millers responded that the level of competition in the
milling industry is very low and have external contracts with companies who have an established brand.
They do not feel at risk of their contracts becoming terminated, as their contracts serve a long period of
time. The 20 percent who responded that the level of competition within the maize milling industry is on
par and similar to other business environment are of the opinion that their final product is of exceptional
quality and at a good price. They further feel that there are no other millers around them that serve their
particular market. The majority (70 percent) of the medium scale respondents feel that the milling
No competition
6%
Competitive
20%
Highly
competitive
74%

110
industry is highly competitive. Some of the reasons given for this high level of competition, ranged from
the number of maize millers serving the same market with the homogenous product at a price, they feel,
are set by dominating large scale millers. They also feel that the level of competition is not at a healthy
level that would secure the long term sustainability and growth of all maize millers within the industry.
The majority of small scale millers’ responded that the level of competition within the maize milling
industry is high to very high. The reasons provided were that the level of entry for maize millers are low,
that on-farm milling increases in periods where the maize price is very low (as is currently the case)
which results in a loss of market share for established businesses and that everyone serves the same
market with a homogenous product at more or less the same prices.
The opinions expressed by maize millers in terms of whether they compete directly or indirectly with the
top four large scale milling enterprises resulted in conflicting responses. About 50 percent of the
interviewees said that they do not compete with the top four maize milling enterprises. Their reasons for
this statement are that they feel they produce a specific product, tailor made for a specific market
segment that the top milling enterprises cannot enter. The top four milling enterprises do not have the
time and personal service to cater for these markets as a large amount of personal service and build
relationships are required. The other 50 percent responded that they do, whether directly or indirectly,
compete with the top four milling enterprises. Of the 17 maize millers who responded that they do
compete against the top four milling enterprises, 64 percent further indicated that this competition is
detrimental to their operations, with the remaining 34 percent indicating that the competition is
beneficial. Competition is detrimental to their operations in that they feel that the top milling enterprises
has an influence on prices, has the available cash flow to buy high volumes of maize from silo’s when
the maize prices are low and has the ability to adapt quickly and swiftly to changing market conditions.
They coped with this by providing a good product that satisfies a specific market segment at a good
price. The competition is also perceived, by 34 percent of the respondents, as beneficial as it provides a
platform for small, medium and large scale millers to measure and rank themselves against the top four
millers. A performance indicator was thus established by competing against the top four millers
To conclude, the level of competition is a key indicator of the health of an industry. The responses from
the market participants are that the level of competition within the maize mill industry is very high. The
reasons provided are that the industry has low barriers to entry, that a homogenous product is produced
at prices that are set by market conditions and that a large number of millers serve the same market. A
large number of established mill businesses eluded to the loss in market share they experience during

111
periods where the maize price is very low. When the maize price is low, on-farm milling increases as
maize producers want to add value to their final product, resulting in higher on-farm profits. This leads to
an increased level of competition.
4.3.3 STRENGTHS, WEAKNESSES, OPPORTUNITIES AND THREATS (SWOT) ANALYSIS
In analysing any industry, the strengths, weaknesses, opportunities and threats that exist in the industry
and in the various maize milling businesses need to be identified. Strengths and weaknesses refer to
the internal environment of the business whilst opportunities and threats refer to the external
environment. The strengths of a maize milling business represent those areas of a maize millers’
business that give a relative competitive advantage over rivals. These areas within the business attract
customers and ensure that the business is profitable and sustainable. Weaknesses in the maize milling
businesses represent the areas of the business in which the maize miller has a relative competitive
disadvantage. Ideally, these weak areas of the business need to be addressed and turned into
strengths in order to grow as a business. Opportunities are present in every business. A maize miller’s
ability to identify new opportunities when they present themselves will secure sustainability for the
business and maize miller. Opportunities therefore can be classified as a new market idea or product
development. Threats on the other hand, are issues external to the business and over which the maize
miller has little control and need to be taken account of and planned for. Table 16 illustrates the areas of
strength of the maize millers interviewed.

112
Table 16: The strengths of maize millers interviewed and the industry.
RANKING
High quality product offerings 10
An established client base and brand 9
Market related and competitive prices 8
Good and consistent service offerings 7
Good business, stock and overall management 6
Well situated and good business location 5
On time and consistent deliveries of final product 4
High profit margins ensuring high net profits 3
A well direct marketing campaign 2
Well educated and experienced staff 1
Table 16 illustrates the top 10 strengths of maize millers and the industry. From the table it is evident
that high quality product offerings are the greatest strength maize millers perceive to have over their
competitors. It therefore can be assumed that the maize milling industry produces a high quality final
product that benefits the final consumer. A well established client base and brand was ranked as the
second biggest strength area that maize millers perceive to have. Maize millers again stressed the fact
that in order to survive, a client base and brand must be established.
The final consumer of maize meal is price sensitive. It is therefore important for maize millers to set the
correct final price at the correct time. The ability to set a competitive and market related price was
ranked as the third largest strength maize millers have. Some of the maize millers indicated that they
have a good and consistent service offering. This service includes the ability of maize millers to meet
the needs of their clients in a short period. Good and consistent service offering was allocated as the
fourth biggest strength maize millers have.
One of the important barriers to entry was the overall business knowledge that a maize miller requires.
Several maize mill interviewees identified that they have good business and stock management skills.
The maize millers indicated that their fifth biggest strength is their ability to sustain a good business,
stock and overall management skills. A high proportion of maize millers interviewed are situated either
near the silos or near the final consumer. Therefore, it is not uncommon to establish that a well situated

113
and good location is a strength for maize millers. The maize millers ranked their location as their sixth
biggest strength area.
An area which was identified and goes hand in hand with good service offering is the ability of maize
millers to deliver the final product consistently and on time. On time deliveries presents the ability of
maize millers to deliver the final product on time and at the right place. On time deliveries were ranked
as the seventh biggest strength area of maize millers. A few maize millers indicated and feel that they
have a strength area in terms of their high profit margins that they can sustain. They offset this high
profit margin by delivering a high quality product for a specific end consumer. This high profit margin
results in high net profits. High profit margins were ranked as the eight biggest strength area of maize
millers.
A well directed marketing campaign was ranked as the ninth biggest strength area of maize millers. As
was indicated in the aforementioned section, having a well directed marketing campaign is crucial to the
overall success of a maize milling business. This low percentage share of the marketing campaign,
indicates that maize millers do not have the necessary resources to structure a proper marketing
campaign. Acquiring staff with high levels of experience and competency and sustaining them were was
the tenth biggest area of maize millers. This area of their business was allocated low down the strength
area list indicating that the industry has a short fall of staff with high levels of competency. The top ten
strength areas of maize millers represented 85 percent of all the strength areas weight.
The remaining 15 percent of the strength area weight was allocated to the following strength areas of
maize mill businesses. Several of the interviewees indicated their ability to procure high levels of maize
grain as a strenght. Milling on a contract basis has several strength points for maize millers. It assures
them of business for a specific period of time as well as a client base. Effective waste and logistic
management were also mentioned by maize millers as a possible strength. Many small millers also
indicated their ability to enter and exit the market as a strength. When the maize price is low, they will
enter the market and exit if the maize price is higher. This is only true for the small maize millers who
are bona fide farmers and only mill the lengthen the chain when maize farming profitability is very low.
Lastly, some of the maize millers indicated that their cash flow position is a strength.
As was explained earlier, a weakness of a business in which a maize miller has a competitive internal
disadvantage. It is important to identify all the relevant weaknesses in the maize milling industry in order

114
to address and convert these weaknesses into strengths. The following table indicates the weaknesses
within the maize milling industry as well as the associated weights.
Table 17: Weaknesses of maize millers interviewed and the industry
RANK
A lack of proper maintained infrastructure 10
The cash flow situation 9
A lack of a well established brand name 8
A well directed marketing campaign 7
A well maintained and directed transport system 6
The experience and knowledge of labourers 5
Limit product differentiation 4
Doing business in a volatile market 3
Being exposed to volatile prices 2
A lack of capital and finance for expansion purposes 1
The weaknesses of the industry are summarised in the table above. The most important weakness for
maize millers identified for the industry and their respective businesses are lack of proper maintained
infrastructure. This infrastructure refers to the business infrastructure as a whole, including the buildings,
machineries and vehicles. A large number of maize millers indicated that their machinery and buildings
are old and that it affects the overall productivity capacity of the business. The cash flow situation of
maize millers again took priority in discussing the weaknesses of their maize mill business and the
industry. The cash flow position of a business enables maize millers to take advantage of maize grain
prices when the opportunity presents itself. The maize millers also indicated their cash flow position as a
weak point because of the current state of their cash flow positions.
A lack of a well established brand name and well directed marketing campaign was assigned as the
third biggest weakness of their businesses. A large number of maize millers saw their inability to
establish a brand and direct a marketing campaign as weaknesses of their business. They are of the
opinion that they do not have the necessary skills to turn this weakness of their business into strength;
the availability of funds also played a role in their inability to offset this weakness into a strong area of

115
their business. As in the case of the poor maintained infrastructure, maize millers indicated that they do
not have access to a well maintained and directed transport system. This is essential for the overall
business since it ensures that the final product is delivered on time to the final customer. It further
promotes service delivery which is crucial for the overall sustainability of the business, as explained in
the barriers to entry section.
A certain weakness of the maize milling industry and for the respective businesses is that the industry
produces a homogenous product with very little product differentiation. Maize millers have to find new
ways to add value to their final product. This lack of product differentiation is seen by maize millers as a
weakness of their business and the industry as a whole. The volatility of the industry in terms of the
market and prices creates problems for maize millers and was indicated as a weakness for the industry.
This volatile environment to which maize millers are exposed makes business decisions difficult and
would therefore naturally incur costs.
The inability of maize millers to expand in operations and which caused them to stagnate as a business
was also a weak area of the maize milling industry as identified by the maize millers. The top ten weak
areas of maize millers represented 80 percent of the total weak areas weight.
The remaining 20 percent was made up by the following weaknesses:
• Some of the maize millers indicated that the final product they produce is not consistently of a
high standard and that it is an area of their business that is weak compared to their competitors.
• The degermination process of the maize grain. Some of the maize millers feel that by not
degerminating the maize grain, the shelf life of the final product decreases which can be a weak
area of the business.
• Having a too high extraction ratio. The extraction ratio norm is 30 percent
• The inability to sell the final product on credit. This inability was indicated by some maize millers
that feel that they do not have the necessary cash flow available to sell product on credit. In turn,
their competitors can sell their final product on credit to customers which lead to a loss in market
share for the maize millers that can not sell in credit.
One of the biggest weaknesses identified by the study is the inability of maize millers to see and create
new opportunities within the maize milling industry.
Table 18 indicates the opportunities as identified by maize millers.

116
Table 18: Opportunities identified by maize millers
WEIGHT
To expand the maize milling business 5
Enter smaller markets 4
The incorporation of new technology 3
To fully integrate the maize milling business 2
To enter the market of wheat milling 1
Table 18 it is clear that according to maize millers and the industry the biggest opportunity is to expand
operations and the maize milling business. The opportunity to expand was seen as the greatest
opportunity by many maize millers. However, this opportunity is very vague, as no mention was made of
the areas in which they wish to expand their business. This is an ominous sign for the sustainability of
the maize milling industry. In order to survive as an industry and a business, opportunities must be
identified and capitalised upon. A possible reason for this opportunity is the low procurement price that
millers currently pay at the moment for maize. If the maize price is higher, strain is put on the miller’s
profit margin and expansion will receive a lesser focus.
An opportunity exists in the industry to enter smaller markets and to produce a final product that meets
the needs of this specific market segment. The large scale millers specifically mentioned this opportunity
and had plans to utilise this opportunity. This opportunity was seen as the second biggest opportunity
that exists. The advancement of technology in the industry over the years created opportunities to
expand operations and to increase the maize milling capacity. This creates new opportunities for maize
millers in markets that require high volumes of maize meal. The advancement of technology in the
maize milling industry was ranked as the third biggest opportunity.
Some of the maize millers identified the opportunity to fully integrate their business on a vertical and
horizontal scale. This will add a new dimension to their operations. The opportunity to fully integrate
their business was ranked as the fourth biggest opportunity. Another strong opportunity seen by maize
millers is to enter the market of wheat milling. This is somewhat of a surprise taking the high barriers to
entry of wheat milling into consideration. Nevertheless, some maize millers feel that they see an
opportunity to enter the market of wheat milling and that by doing so, will add a new dimension to their
business. The top five opportunities represented 85 percent of the total opportunity weight.

117
The remaining 15 percent was allocated to the following two opportunities:
• An opportunity exists in the industry to enter the bigger markets. Smaller maize millers feel that
they have a product of high quality that can not be produced by the larger scale millers. They
therefore, feel that they can penetrate bigger markets.
• Worryingly, only a small percentage of maize millers indicated that they see an opportunity to
enter the export market.
The threats identified by the maize millers for their businesses and the industry can be summarised by
Table 19.
Table 19: Threats identified by maize millers WEIGHT
The ever increasing trend of input costs 10
The changing consumer trends and preferences 9
The action of theft taking place at the maize milling businesses 8
The quality and quantity of water 7
Micro millers entering the markets 6
Large scale millers entering the market 5
Maize quality 4
Maize prices 3
Employing reliable and skilled labour 2
Government regulations 1
In allocating the different threats that the maize millers see for their business and the industry, the threat
of ever increasing input costs is the biggest. A large number of the maize millers feel that input costs are
increasing; special mention was made of packaging material, electricity prices, fuel costs and labour
costs. The second biggest threat maize millers see, especially for the industry, is the changing
consumer patterns and trends of consumers. Many maize millers mentioned that they have definitely
experienced a shift in consumer trends, away from maize meal to other protein sources. Some maize
millers also expressed concerns that the food schemes and food programmes managed by some
municipalities changed the composition of the meals – away from maize meal and samp to rice.
As in any business environment, the threat of theft taking place at your business is very high. Maize
millers feel that on a daily basis theft takes place at their businesses on a daily basis. Transport theft is
118
also a high concern. At this stage the risk is carried by the transport company and not by the mill, but if
this risk is maintained, transport companies will increase the transport cost to protect themselves
against theft from lorries in transit. Theft was allocated as the third biggest threat. In the process of
maize milling, water quality and quantity is very important in ensuring a high quality final product is
produced. Maize millers identified the threat of not having the desired quality and quantity of water at
their businesses.
The threat of new market entrants entering and taking market share away from the existing maize
millers was also seen as a threat. In discussing this threat with small maize millers, they indicated that
they feel threatened by large scale millers entering the markets where they are operating. The main
reason for this threat stems from the fact that large scale millers have the cash flow position to start a
price war with the existing maize millers within a market. The large scale millers in turn, feel threatened
by the small, on-farm, micro milling that takes place and that takes away market share of them.
The quality and price of maize grain was also seen as threat by maize millers. Many maize millers
identified this threat for their business should the maize quality they receive deteriorate. They said that
in the maize milling industry, your final product can only be as good as your intermediate product, which
in the case of maize milling is maize grain. A threat also exists in the maize grain prices. As was
previously explained, the biggest threat of ever increasing input costs that maize millers are exposed to
is due to increases in the maize grain prices. Should sudden increases in the maize grain prices occur,
pressure would increase on the maize millers’ cash flow positions.
The labour force in maize milling has a vital role to play in the overall success of the maize milling
business. The threat of not employing reliable labourers with the right skills and education level can
hamper operations at the business. Government regulations were seen as the tenth biggest threat by
maize millers. A detailed discussion of the legal framework will be done in section 4.3.9. The top ten
threats represented 89 percent of the total threat weight.
The remaining 11 percent of the threats include changes in the cash flow positions of businesses, the
threat of Genetically Modified Organism (GMO) to the maize milling industry, the threat of not having a
proper maintained infrastructure and lastly the event of climate change was also indicated as a threat.

119
4.3.4 CRITICAL AREAS OF A MILL BUSINESS
The views and opinions expressed by the maize millers on what the most critical areas of a mill
business are yielded a wide range of answers. After careful analysis of the opinions expressed, the
study finds that cash flow management is one of the most critical areas of a mill business are. Figure 56
represent the five most critical areas of a mill business as indicated by all maize millers interviewed. The
figure clearly shows that in order for a mill operation to be successful, special care and emphasis must
be paid to cash flow management. Cash flow management reflects the ability of businesses to make
procurement decisions on the basis that funds are available. In the milling industry, the ability of mill
owners to buy high volumes of maize from silo’s in a relatively short period of time is an important
determinant of the long term sustainability of the mill business. Many respondents indicated that the
relative strength of the cash flow positions of the top four milling enterprises results in their ability to buy
high volumes of maize in periods when the maize price is low. This event results in the top four milling
enterprises’ ability to drop prices in order for them to enter new markets. For this reason, the cash flow
position of a mill business must be very good in order to survive in a market environment that can be
exposed to price wars between competitors.
Figure 56: The five most important areas of a mill business
Certain milling companies have a large market share in the ‘super maize meal’ market. They are
sometimes forced to sell ‘special maize meal’ below production cost to prevent old stock in their
business. Many smaller millers see this action as ‘dumping’ since they cannot compete against the
lower prices offered by the larger milling companies.
Cash Flow
17%
Location/client
base
6%
Product price
14%
Quality of
product
13%
Management
9%
Other41%

120
The second most critical area of a milling business is the pricing strategy decisions that mill owners
have to make. The pricing of the final products must be market related but at the same time at a
reasonable mark-up margin to ensure profitability of the mill business. The milling industry is
summarised by some respondents as a high volume, low margin industry. In other words, high
quantities of the final product must be sold at low profit margins. The study conducted by Funke (2006)
indicated the opposite. The study showed a mill to retail profit margin of nearly 130 percent.
The third most critical area of a mill business is to ensure that the final product is of an exceptional
standard and quality. The only way to differentiate your business over your competitors is to ensure that
a consistent and high quality product is delivered to the customer on a regular basis. The overall
management of the mill business was the fourth most critical area of mill businesses. The overall
management included financial, cash flow, procurement, logistics, administration and labour
management decisions. Sound managerial decision capabilities of mill owners were seen as a key
ingredient in ensuring the sustainability and profitability of a mill business. The fifth most important
critical area of a mill business is to ensure that the marketing plan is intended to the right target
audience and that the marketing plan is effective and cost efficient.
The rest of the critical areas as indicated by the millers are as follows:
• Location and client base (5 percent)
• Maize procurement decisions (4.9 percent)
• The reduction of cost to produce the final product, special emphasise was made of packaging,
transportation and electricity costs (4.7 percent).
• The experience and knowledge of the milling techniques (4.6 percent), this included the right
extraction and moisture controls.
• The process to diversify your product and business (2.9 percent).
• The building of relationships and the necessary people skills (2.7 percent).
To conclude, in order to ensure that a maize mill business is as profitable as possible, special care and
interest must be given to the cash flow, product quality and price, general management and marketing
management of the mill business.
121
4.3.5 THE KEY ISSUES/CONSTRAINTS/CHALLENGES CURRENTLY BEING EXPERIENCED BY
MAIZE MILLERS
The issues, constraints and challenges currently being experienced by the maize millers resulted in a
wide range of ideas and opinions. The opinions of maize millers in terms of the challenges in the maize
milling industry ranged from too high level of competition to theft within the industry. Figure 57 reflects
the five most important issues, constraints and challenges that maize millers feel impact the industry
dramatically. High levels of competition were perceived by maize millers as the most important
challenge the maize milling industry is currently facing. As was explained in section 4.3.2.2, the level of
competition is a key indicator in terms of the overall health of any industry. Maize millers feel that the
level of competition is too high and that all market participants are fighting for the same market space
and customers with a homogenous product. The main challenge for maize millers is to overcome this
issue by adding value and differentiating their business and final product.
The second biggest challenge the maize milling industry is currently facing is that consumer preferences
have changed over the years. Maize millers, especially millers who have been in business for a long
period of time, emphasised the fact that consumers have changed their preferences for maize meal and
have shifted towards other starch sources. The industry becomes vulnerable to these changes in
consumer preference during periods when the maize price is high which in turn leads to higher maize
meal prices. The industry must overcome this challenge by attracting consumers back to maize meal by
delivering a product that is of high quality and presents the consumer with more value for their money.
Maize quality is also an important issue and challenge that the maize milling industry is currently facing.
A lot of maize millers feel that the quality of maize they receive from the silos and farmers alike is not of
the quality that it is supposed to be. This results in a final product that is not high quality which in turn
does not bode well for the long term sustainability of the industry.
The recent announcement that electricity prices will increase for the next three years was reported as
the fourth biggest challenge for the maize milling industry. As was discussed in the aforementioned
sections, the maize milling industry is perceived as a high volume, low margin industry. Increases in the
price to produce maize meal will decrease the gross margins within the industry, resulting in further
decreases in profits for maize millers.

122
The fifth biggest issue or challenge the maize milling industry is currently facing is the long term and
short term availability of finance (9 percent). The industry feels that access to finance is restricted by
banks and financial institutions. A lack of access to finance dampens the expansion propositions of the
milling industry. This is also a very important barrier to entry as the capital requirements of developing
and starting a maize mill business is burdensome. In order for the industry to expand in operations,
access to finance must become available.
Figure 57: The five most important issues/constraints/challenges as identified by the interviewees
The study further emphasised the following issues and challenges:
• Establishing a market and client base creates a big challenge for all market participants. There
exists a lack of knowledge in terms of marketing within the industry. Many maize millers do not
know how to penetrate a market and expand on an existing market.
• Volatility of maize prices is a challenge for small and medium scale millers in. A volatile maize
price requires a business to adapt swiftly to maize prices. Small scale millers do not have the
necessary cash flow to respond to sudden maize prices.
• Volatile markets and sales hamper the long term sustainability of the industry. As was mentioned
before, consumer preferences have changed during the past few years.
• Cash flow restrictions for small scale millers are a big challenge that the industry is facing. Small
scale millers do not have the available funds to capitalise on a weak maize price. On the other
hand, large scale millers do have the available funds to buy high volumes of maize during periods
Changing
consumer
preferences
12%
Electricity prices
10%
Finance
11%maize quality
9%
High level
ofCompetition,
12.8
48.5 %
123
where the maize price is low. This inequality between the large and small scale millers creates
advantages for large scale millers when price wars occur to enter new markets
• The knowledge and technical know-how of labour and the required skill levels are another
challenge the industry is facing. No new advancement in terms of labour skills’ development
programmes have been made by the industry to educate and train the labour force to attain the
required skill level
• Water quality, quantity and the general infrastructure were also mentioned by the industry. Maize
millers feel that the quality and quantity of water they receive is not of the acceptable standard
and results in a loss of quality of the final product.
The opinions expressed by maize millers varied according to their specific business environment. The
study did however conclude that the main challenge the industry is faced with is a combination of high
levels of competition and changing consumer preferences. The industry must overcome these
challenges by producing a final product that is of a high quality and provides the final consumer with
value for their money.
4.3.6 BARRIERS TO ENTRY AND BARRIERS TO EXIT
One of the main objectives of the study was to analyse the barriers to entry and exit within the maize
milling industry. A barrier to entry is any factor that restricts potential maize millers from entering the
market, whereas barriers to exit are any factors that restrict current maize millers from exiting the
market. Although the maize milling industry is characterised as an industry which has low barriers to
entry, there are some important factors that were mentioned by the maize millers and industry role-
players. By identifying the barriers to entry, emphasis is placed on the industry in terms of the potential
to expand and grow in a relatively short period of time.
It has been mentioned that the maize milling industry requires high capital investment. In order to be
profitable with an acceptable return, high capital expenditure is required. It is well-known that the largest
barrier to entry the industry is facing is the availability of capital to start operations. Access to capital for
maize millers, as was discussed in the previous sections, is difficult to acquire from banks and financial
institutions. Start-up finance of about R850 000 is needed to start a small maize mill. The availability of
capital therefore is the largest barrier to entry and represented 35 percent of the total barrier to entry
weight, as is shown in Figure 58.

124
Figure 58: Barrier to entry for maize milling industry
The second largest, (the establishment of a brand), to the fifth biggest barrier to entry, (the production of
a high quality final product), all coincide with one another. The establishment of a brand is seen as a
very important barrier for a new market entrant. This barrier represented 15 percent of the total barrier to
entry weight. The third biggest barrier to entry was that the new entrant must have a supportive and
consistent client base. A supportive client base represents 9 percent of the total barrier to entry weight.
An effective and well structured marketing campaign is seen as the fourth biggest barrier to entry. Maize
millers could not over-emphasise the importance of an effective marketing campaign that can attract
new clients to the final product. Out of the total barrier to entry weight, 9 percent was allocated to an
effective marketing campaign. The fifth biggest barrier was to have a good product, which presents
customers with value for their money. A good product is key to the overall success of a maize mill
business and 7 percent of the barriers to entry weight were to this.
Having a good product indirectly resolves the five biggest barriers to entry except for the capital
requirements barrier. By producing a product of exceptional quality, a proper marketing campaign can
be launched provided that the maize miller does have some marketing experience. If a consistent
marketing campaign is established that reaches the final consumer, the business client base can
expand. This can result in the establishment of a well recognised brand that final customers are willing
to buy.
In Figure 58, the ‘Other category’ is a combination of the following barriers to entry:
Establish a
brand
15%
Capital
35%
Client base
9%
Marketing
campaign
8%
Good product
7%
Other
26%

125
• The maize milling industry is characterised as an industry which has high risks with relatively low
profit margins. Another barrier to entry identified was that the maize mill owner must have a risk
taker personality. The risk taker personality of maize millers’ requirement represented 6 percent
of the total barrier to entry weight.
• Cash flow again featured prominently in the barrier to entry category. As was discussed in the
aforementioned sections, maize millers experience problems with cash flow and the management
thereof. Not having the available cash to buy raw materials will lead to failure of the business. It is
therefore important that a new market entrant has access to the available cash and has the
expertise to manage the cash flow. Availability and management of cash flow represents 5
percent of the total barrier to entry weight.
• Depending on the type of marketing and business channel the new market entrant wants to use,
the availability of a well organised and management transportation system is a barrier to entry.
Direct market channels require a transportation system to deliver the final product to the market
and end customer. Out of the total barrier to entry weight, 4 percent is allocated to the
management and availability of a transportation system.
• As in any business, sound business knowledge is essential for the overall success. The ability to
see new market trends and opportunities calls for a mill owner to have knowledge in the business
environment. In an industry which is characterised by ever changing patterns and preferences, a
new market entrant must have the ability to swiftly react to market changes. Sound business
knowledge was allocated a 3 percent of the total barrier to entry weight.
• Diversification of maize millers’ final product and business is also seen as a barrier to entry for
new market entrants. Doing business in the new market environment requires the ability of maize
millers to diversify their business and final product. Diversification in the maize milling industry is
mainly done by selling the by product of the milling process, namely hominy chops, to the feed
industry. Some experienced maize millers responded that their main source of income is the
selling of hominy chops. A new market entrant that does not diversify by selling the by product will
end up closing their business. Two percent was therefore allocated to the diversification process
of a new market entrant business.
• A high level of experience within the maize milling industry together with the technical know how
of the industry is seen as a barrier to entry. Out of the total weight of barriers to entry, 2 percent
was allocated to the level of experience a new market entrant must have in order to survive in the
industry

126
• Location is critical in the overall success of the maize milling business. The location should not be
far from the end customers as well as not too far from the silos. A new market entrant must
identify the perfect location for the business. Out of the total weight of barriers to entry, 2 percent
was allocated to the relevant importance of finding a suitable location.
• The old millers say that one must have a high quality intermediate product to produce a high
quality final product. This is also true in the maize milling industry. If a new market participant
wants to survive in the milling industry he must have access to high quality maize. Some maize
millers said that they must maintain good relationships with the silo manager and farmers in order
to secure high quality maize, emphasising the importance of access to high quality maize. The
last two percent of the total barrier to entry weight was allocated to the quality of maize.
In conclusion, the main barrier to entry is the availability and access to the required capital . The maize
milling industry therefore can be characterised as an industry that has relatively low barrier to entry
levels, although some care must be given to the abovementioned barriers to entry. Failure to provide
the necessary attention to the barriers to entry will result in the new market entrant having to close his
maize mill business.
As was explained earlier, a barrier to exit is any factor that restricts a maize milling business from exiting
the market and starting another form of business adventure. From the outset the study found that the
levels of barriers to exit are low. The study could only identify six possible factors that could restrict a
maize miller from exiting the market. Out of the total barriers to exit weight, 37 percent are allocated to
the industry not having any barrier to exit. Most of the maize millers said that could discontinue business
operations at any given moment. Nothing prevents or restricts them from exiting the market. Figure 59,
illustrates the weight of the allocated barriers to exit that exist in the maize milling industry.

127
Figure 59 Barriers to exit from the maize milling industry
The highest barrier to exit that exists in the maize milling industry is the high level of investment that is
required in establishing a maize milling business. As was explained in the barriers to entry, the maize
milling industry is characterised as an industry that requires high levels of investments to start
operations. If the maize mill owner wants to stop operations, a willing buyer of the assets is required.
This is sometimes a tiresome task in that new market entrants are few to come by. The industry does
not have willing new market entrants that want to start milling operations. It is therefore perceived that
finding a suitable buyer for your assets is a tedious task and could potential restrict the maize miller from
exiting the market. Even if a new buyer of the assets are found, it does not guarantee the maize miller
that he/she will receive a price that is on average the same as the book value of the assets. The buyer
can offer him/her a price much lower than the book value of the assets, resulting in the demotivation of
the maize miller to sell his assets. The high level of investment that goes in a milling business is
perceived as the biggest barrier to exit for a maize miller. Some of the maize millers further pointed out
that because of the high levels of investment required in starting a milling operation, they still have a
large amount of debt that needs to be repaid. This is another reason why some maize millers cannot
exit the maize milling industry. Out of the total barrier to exit weight, 20 percent was allocated the high
levels of investment in a maize milling business.
The second biggest barrier to exit is that for most of the maize millers, milling maize and selling the
maize meal is their life’s income. Even if they want to exit the maize milling industry, for what possible
reason, they cannot do so because the milling industry provides them with the necessary funds to pay
for their living costs. The maize millers allocated 13 percent of the total barriers to exit weight to the life’s
None
37%
High Investment
20%
Job Satisfaction
7%
Client
satisfaction
8%
Worker
satisfaction
8%
Contract
7%
Life income
13%

128
income factor for not exiting the market. Many see the milling industry as the only type of industry where
they can work in and do not have the skills to work in any other type of industry.
The third biggest reason maize millers pointed out for not exiting the market is that they are responsible
for workers in their business that also needs to pay the bills at home. They will not stop operations for
the reason that if they close, they are letting workers down that has dedicated a big part of their life in
ensuring the sustainability of the maize mill business. By closing and stopping the maize mill operations
they will leave their workers unemployed. This factor for not exiting the market was allocated an 8
percent out of the total barrier to exit weight.
Not letting their customer down, is the fourth reason why mill owners would not stop operations. They
have over the years build a trustworthy relationship with their clients, whether it is shop owner in black
communities, agents that sell the final product for maize millers or walk in customers that come to buy
maize meal on a weekly basis. Mill owner do not want to let their customers down by closing operations
if it is not necessary. Client satisfaction was also allocated 8 percent of the total barrier to exit weight.
Job satisfaction was the fifth reason why mill owner would not stop operations. This was especially the
reason given by seasoned maize mill owners who have been in operation for a long period of time. They
have developed a pride in their business and on how it has developed and grown over time. It is this
pride that will be in the way of their plans to stop operations and closing the business. Out of the total
weight allocated to the barriers to exit, 7 percent was given to job satisfaction.
The last barrier to exit that was mentioned by maize millers was that they were in contracts with external
parties, prohibiting their plans to stop operations. The contracts must first be fully delivered before they
can think of stopping operations. Another 7 percent of the total maize milling weight was allocated by
maize millers to the contracts.
In conclusion, although the maize milling industry has relatively low barriers to exit, a couple of key
factors do exist that would restrict a maize miller from stopping operations. The high level of investment
and the inability of maize millers to sell their assets were seen as the biggest barrier to exit that exists in
the maize milling industry.

129
4.3.7 PROCUREMENT DECISIONS
One of the most important areas of running a successful milling business is to make the right
procurement decisions. The ability to make the right procurement decisions develops over a long period
of time. As was explained in barrier to entry section, experience and business knowledge are key to the
overall success of any business, none more so in the milling industry. Procurement decisions entail
making the right decisions in terms of the quantity of raw material that need to be bought and buying
from the right supplier at the correct price given the specific market conditions. It further entails whether
to buy the raw material on a contract basis. These types of decisions are dependant on experience and
business knowledge. This section provides some insight in to the type of procurement decisions a
maize mill owner makes daily.
One of the most important raw materials that a maize mill owner buys is the maize grain. Buying the
correct quantity at the correct price is crucial to the overall sustainability of the maize milling business.
From the outset of the study, special emphasis was put on the procurement decisions of maize. Maize
represents about 75 percent of the total cost to produce a ton of maize. There are three channels
available to procure the maize. The most important one and the one that is more frequently used is the
buying of maize from the silos. The second channel makes use of local farmers to supply the maize
milling business with the required maize grain. The last channel is where the maize miller is also a
maize farmer; supplying his own maize grain for his milling business. The last channel was mostly used
by on-farm maize millers who also farm maize grain. The second and third channel was mostly used
during the harvesting season of maize, when maize grain was readably available. For the rest of the
year, maize millers make use of silos to supply the required maize grain.
As was mentioned in the previous section, maize represents 75 percent of the total cost to produce
maize meal. Any changes on the maize prices could impact the procurement decisions and the
business as a whole. Figure 60 reflects the perceived impact of changes in maize grain prices on the
milling business by maize millers. This is an important consideration as maize prices are very volatile as
was discussed in the market overview. Not surprisingly, 56 percent of all the maize millers responded
that the impact on their maize milling business is very high when changes in the maize grain prices
occur. The reason for this very high impact on their business is that if maize grain prices increase, they
do not have the necessary cash flow available to pay for these changes. They further feel that if maize
prices start to increase the time it takes for maize meal prices to increase is very slow. This forces them
into a cost squeeze situation where maize prices increase and the maize meal prices stays constant for

130
a relatively longer period of time. The reason for this slow price transmission is that the large scale
maize millers buy a large quantity of maize grain, which will last them for a long period of time, during
periods when the maize grain prices are low. Smaller maize millers buy on a more frequent basis, given
their cash flow constraints. When the maize grain price starts to increase, smaller maize millers have to
buy the maize grain price at a higher price than what larger maize millers paid for. Large scale millers
are in essence the price makers of maize meal and because they procured the maize grain at a cheaper
price than smaller maize miller can, they can set prices lower than what the market conditions predict.
However, when maize prices start to decrease the opposite is true and smaller maize millers benefit
from the slow price transmission. If maize prices start to decrease, large scale millers are still in
possession of maize when the price was high. In the situation where the maize prices start to decrease,
smaller maize millers buy the maize grain at a lower rate than what the large scale millers paid for. As
was mentioned, large scale millers are in some ways price setters and would therefore keep the maize
meal prices higher to offset the higher maize grain prices. Smaller maize miller benefit from this situation
in that the maize meal price is high during a period where they bought maize grain at a cheaper rate
than the larger maize millers. This illustrates the importance of making the correct procurement
decisions at the correct time. All the medium scale and small scale millers indicated that an incorrect
procurement decision can result in the closing down of the business. They are therefore very reluctant
to hedge grain purchases for a long period. It is better for them to work in a volatile price environment
with the ability to adjust quickly to prices, than to work in a lesser volatile pricing environment (by
hedging maize purchases) and the lesser ability to adjust to changing maize prices. No hedging
strategy is actively pursued by any mill interviewed.
Figure 60: The perceived impact of changes in the maize grain price by maize millers
Very high
56%High
26%
Medium
9%
Low
9%

131
Out of the 36 respondents, 26 percent indicated that the impact of changes in the maize grain price on
their business was high. The reasons provided was the same as for the maize millers who responded
that the impact is very high. The only differences are that these 26 percent of maize millers’ cash flow
positions are healthier. The maize millers that responded that the impact of changes on maize grain
prices is medium (9 percent) and low (9 percent) had a positive outlook and indicated that the maize
grain prices have not impacted their business so far. They responded positively and confirmed that the
slow price transmission benefited them, especially during periods when the maize price is high and start
to decrease, as was explained on the previous page.
4.3.8 IMPORTS, EXPORTS & SALES
Although of a relatively small nature, it is worth revising the impact of imports and exports on the maize
milling industry. Out of the total maize millers that were interviewed, 74 percent responded that exports
have no impact on their daily operations. The remaining 26 percent had various degrees of answers on
the impact exports have on their business and daily operations. Figure 61 reflects the impact exports of
maize meal have on maize milling businesses.
Figure 61: The impact of exports on maize milling businesses.
The maize millers that indicated that exports have a high impact on their business are depend on
exports for the sustainability of their business. These maize millers’ main markets are in countries like
Zimbabwe, Botswana and Lesotho. Any changes in the market environment in these countries will have
Medium
6%
Low
9%
Not applicable 74%
High 11%

132
an impact on their daily operations. There exists a perception by some exporting maize millers that
Zimbabwe demands maize meal that is Genetically Modified (GM) free. Under some conditions and in
some regions South Africa produce only GM maize grain. It is therefore difficult to produce a product for
Zimbabwe that is GM free. This was the main reason why 11 percent of the respondents indicated that
exports have a high impact on their business. They further indicated that because they are exporting,
they are exposed to changes in the exchange rate. As in any exporting business, a weaker Rand
creates more profits for an exporter than a stronger Rand.
The maize millers that responded that exports have a medium (6 percent) and low (9 percent) impact on
their daily operations said that exporting is not their main source of income and that they will export if
the opportunity presents itself. The impact therefore of exports on their business is relatively low.
The impact of imports is tremendously low on the maize milling industry. Of the 36 maize millers
interviewed, 91 percent said that imports have no impact on their daily operations. The remaining 9
percent said that the impact of maize imports is very low and causes a more indirect impact than direct.
They feel that silos import maize grain at a much lower than acceptable quality which the maize millers
in turn buy. This lower quality of imported maize grain impacts the quality of maize meal that they
produce. This impacts their business in an indirect manner.
The maize millers confirmed the supply chain that was analysed in the market overview section. A
couple of distribution channels exist in the maize milling industry. The most frequently used channel is
the distribution of the final product to local communities. This channel represents 53 percent of the total
distribution channel of maize meal. Figure 62 indicates the different distribution channels used by the
maize mill interviewees.

133
Figure 62: The different distribution channels used by the maize millers interviewed.
The distribution to local communities includes the distribution of maize meal to near-by communities and
retail outlets in the surrounding areas. However, the biggest proportion of maize meal is distributed to
the local black communities and depots in small towns. Maize milling for farmers represents 20 percent
of the total weight of the distribution channels. Many maize millers, especially small scale millers, render
their milling service at a fee. The farmer brings his own maize grain which the maize millers mills at a
predetermined price. As was mentioned before 26 percent of the maize millers export their final product
to nearby countries. This distribution channel represents 17 percent of the total distribution channel
weight. Lastly, some of the maize millers have a contract with an external party to mill maize. This
external party are then responsible for the distribution of the maize meal. The last 10 percent of the total
distribution weight is allocated to the contract channel.
local
communities
53%
Farmers
20%
Exports
17%
Contract
10%

134
4.3.9 LEGAL FRAMEWORK IMPACTING THE MAIZE MILLING INDUSTRY
The study emphasised the role that the legal environment plays in the maize milling industry. Some
maize millers identified the legal issues impacting on the maize milling industry as a potential barrier to
entry. The study identified this important issue and addressed it accordingly. The section that follows
summarises the legal framework that impact the maize milling industry.
Foodstuffs, cosmetics and disinfectants act (Act no 54 of 1972) (REGULATIONS
RELATING TO THE FORTIFICATION OF
CERTAIN FOODSTUFFS)
Any person who manufactures imports or sells foodstuffs identified as food vehicles which has not been fortified shall be guilty
of an offence (DOH, 2003)
This regulation ensures that the process of food fortification is executed by millers (wheat & maize), as well as to provide guidelines as to the correct procedure and fortification standards
(DOH, 2003)
Legislation Definition Purpose / Impact
Legislation impacting Exporting and Marketing of Fresh Produce
Agricultural Product Standards Act
(119 of 1990) – as amended in 1993
To provide for the control over the sale and export of certain agricultural products
and other related products (PPECB, 2007).
The Minister may prohibit the export of products unless each quantity of that
product has been approved by the executive officer (PPECB, 2007).
Consumer Protection Bill
(B 19 – 2008)
To promote a fair, accessible and sustainable market place for consumer
products, to establish national norms and standards relating to consumer protection
and to prohibit unfair marketing (DTI, 2008)
This Bill ensures that consumers have access to a fair marketplace, where
market information is shared by suppliers and buyers. To enhance the
social and economic welfare of consumers (DTI, 2008)

135
National Small Business
Amendment Act (26 of 2003)
Empower the minister to establish and facilitate an Advisory Body to represent the
interest of the small business, to make further provisions in respect of the
functions of the Agency and to make the Public Finance Management Act, 1999, applicable to the agency (GOV, 2003A)
The advisory board will and can promote the interest of small
businesses within the maize milling industry (GOV, 2003)
Land reform (Labour tenants act) (3 of
1996)
To provide for security of tenure of labour tenants and those people occupying or
using land as a result of their association with labour tenants; to provide for the
acquisition of land and rights in land by labour tenants (GOV, 1996)
This Act provides security to labour tenants in that no person other than a court order that is just and equitable may evict labour tenants from farms
Agricultural Labour Act
(147 of 1993)
To provide for the application of the Labour Relations Act, 1956, and the
further application of the Basic Conditions of Employment Act, 1983, to the farming activities and employers and employees
engaged therein (GOV, 1993).
This Act states that the Labour relations Act, 1956, and the Basic Conditions of
Employment Act, 1983, also has an impact on agriculture and that
agricultural entities should take note of these two Acts.
Basic Conditions of Employment Act (75
of 1997)
To give effect to the right to fair labour practices by establishing and making provisions for the regulation of basic
conditions of employment (Acts, 1997).
To regulate the right to fair labour practices by establishing and regulating
basic conditions of employment.
Broad Based Black Economic
Empowerment Act (53 of 2003)
To establish a framework for the promotion of Black Economic Empowerment.
Empower the Minister to issue codes of good practices and to establish the Black
Economic Empowerment Advisory Council (GOV, 2003B).
The purpose is to promote economic transformation in order to enable meaningful participation of black
people, to change the racial composition of ownerships and
management structures
Adult Basic Education and Training Act
(52 of 2000)
To regulate adult basic education and training; to provide for the establishment, governance and funding of public adult
education centres; to provide for the registration of private adult learning
centres (Cape Gateway, 2009).
Any person who establishes and maintains a centre at his or her own
cost is defined as a private centre. The centre can only be registered if the
Head of the Department is satisfied that the necessary criteria are fulfilled.
Compensation for Occupational Injuries
and Disease Act (130 of 1993)
To provide for compensation for disablement caused by occupational
injuries or diseases sustained by employees in the course of their
employment, or for death resulting from such injuries (GOV, 1993).
Management can be held responsible for injuries sustained by employees on
duty and may lead to compensation thereof.
Employment Equity Act
(55 of 1998)
To provide for employment equity and to provide for matters incidental thereto
(ACTS, 1998).
The purpose of the Act is to achieve equity in the workplace by promoting fair treatment in employment and the
implementation of affirmative action to redress the disadvantages.
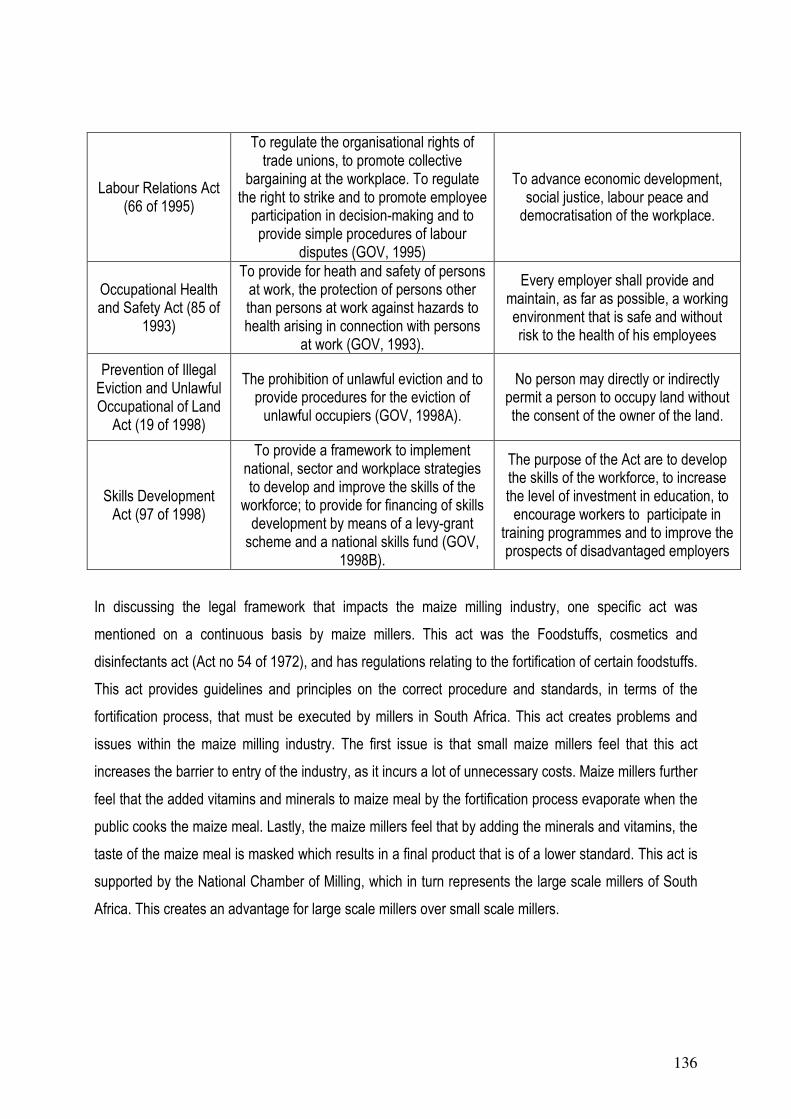
136
In discussing the legal framework that impacts the maize milling industry, one specific act was
mentioned on a continuous basis by maize millers. This act was the Foodstuffs, cosmetics and
disinfectants act (Act no 54 of 1972), and has regulations relating to the fortification of certain foodstuffs.
This act provides guidelines and principles on the correct procedure and standards, in terms of the
fortification process, that must be executed by millers in South Africa. This act creates problems and
issues within the maize milling industry. The first issue is that small maize millers feel that this act
increases the barrier to entry of the industry, as it incurs a lot of unnecessary costs. Maize millers further
feel that the added vitamins and minerals to maize meal by the fortification process evaporate when the
public cooks the maize meal. Lastly, the maize millers feel that by adding the minerals and vitamins, the
taste of the maize meal is masked which results in a final product that is of a lower standard. This act is
supported by the National Chamber of Milling, which in turn represents the large scale millers of South
Africa. This creates an advantage for large scale millers over small scale millers.
Labour Relations Act (66 of 1995)
To regulate the organisational rights of trade unions, to promote collective
bargaining at the workplace. To regulate the right to strike and to promote employee
participation in decision-making and to provide simple procedures of labour
disputes (GOV, 1995)
To advance economic development, social justice, labour peace and
democratisation of the workplace.
Occupational Health and Safety Act (85 of
1993)
To provide for heath and safety of persons at work, the protection of persons other than persons at work against hazards to health arising in connection with persons
at work (GOV, 1993).
Every employer shall provide and maintain, as far as possible, a working environment that is safe and without risk to the health of his employees
Prevention of Illegal Eviction and Unlawful Occupational of Land
Act (19 of 1998)
The prohibition of unlawful eviction and to provide procedures for the eviction of
unlawful occupiers (GOV, 1998A).
No person may directly or indirectly permit a person to occupy land without the consent of the owner of the land.
Skills Development Act (97 of 1998)
To provide a framework to implement national, sector and workplace strategies to develop and improve the skills of the
workforce; to provide for financing of skills development by means of a levy-grant
scheme and a national skills fund (GOV, 1998B).
The purpose of the Act are to develop the skills of the workforce, to increase the level of investment in education, to
encourage workers to participate in training programmes and to improve the prospects of disadvantaged employers
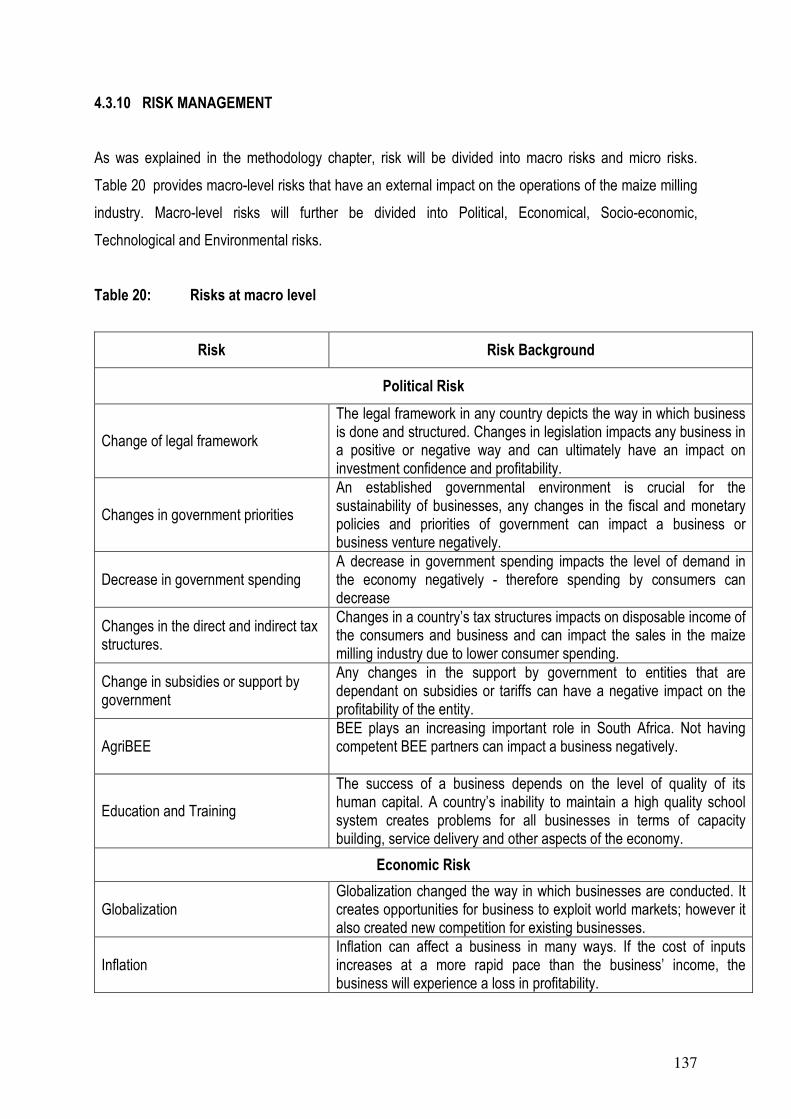
137
4.3.10 RISK MANAGEMENT
As was explained in the methodology chapter, risk will be divided into macro risks and micro risks.
Table 20 provides macro-level risks that have an external impact on the operations of the maize milling
industry. Macro-level risks will further be divided into Political, Economical, Socio-economic,
Technological and Environmental risks.
Table 20: Risks at macro level
Risk Risk Background
Political Risk
Change of legal framework
The legal framework in any country depicts the way in which business is done and structured. Changes in legislation impacts any business in a positive or negative way and can ultimately have an impact on investment confidence and profitability.
Changes in government priorities
An established governmental environment is crucial for the sustainability of businesses, any changes in the fiscal and monetary policies and priorities of government can impact a business or business venture negatively.
Decrease in government spending A decrease in government spending impacts the level of demand in the economy negatively - therefore spending by consumers can decrease
Changes in the direct and indirect tax structures.
Changes in a country’s tax structures impacts on disposable income of the consumers and business and can impact the sales in the maize milling industry due to lower consumer spending.
Change in subsidies or support by government
Any changes in the support by government to entities that are dependant on subsidies or tariffs can have a negative impact on the profitability of the entity.
AgriBEE BEE plays an increasing important role in South Africa. Not having competent BEE partners can impact a business negatively.
Education and Training
The success of a business depends on the level of quality of its human capital. A country’s inability to maintain a high quality school system creates problems for all businesses in terms of capacity building, service delivery and other aspects of the economy.
Economic Risk
Globalization Globalization changed the way in which businesses are conducted. It creates opportunities for business to exploit world markets; however it also created new competition for existing businesses.
Inflation Inflation can affect a business in many ways. If the cost of inputs increases at a more rapid pace than the business’ income, the business will experience a loss in profitability.

138
Interest rate changes
High interest rates have a negative impact on a company’s ability to repay debt or other loan instruments which in turn decreases profitability. It impacts on consumers’ disposable income and buying patterns. Also impacts on investments, ROI.
Volatility of exchange rate Volatility in exchange rates for importing and exporting companies can have a harmful effect on the profitability of the company..
Credit crunch
The current world wide recession and credit crunch impacts on the consumers’ perception of the economy, spending patterns, disposable income, employment, etc and this can result in the decrease of demand and investment
FDI (Foreign Direct Investment) FDI in South Africa is very speculative and short term which creates problems in terms of sustainability of investment which is necessary for businesses to invest longer term.
Changes in international trade structures
The global international trade environment is vibrant and ever changing. Not adjusting to these changes will result in a loss of export opportunities.
Infrastructure Roads, railroads, harbours, communication, water systems, etc are all required investments by government at a certain standards. If not available or not maintained it impacts on investment confidence.
Economic development The stage of economic development of a country will determine the products, quality and services that can be marketed.
Urbanization
The migration from rural areas to urban areas changes demand patterns and quantities in both areas hence impacting the sales and profitability of businesses. It also puts pressure on infrastructure and employment.
House and stock market prices The decline in the prices of the house markets and stock markets impacts the consumer confidence in terms of the economy, consumer disposable income and spending that decreases.
Eskom (load shedding)
Load shedding or the lack of sustainable electricity in South Africa is a reality that creates problems for businesses in terms of service delivery, transportation, communication, etc which in turn has negative impact on profitability.
Socio-Economic risk
Changes in consumer trends
It is vital for companies to keep up with the ever changing consumer trends in order to ensure competitiveness and sustainable profits. Changes in consumer trends can impact on sales/ profits. For example, the change by consumer from maize meal to other energy sources.
Changes in disposable income Changes in disposable which can occur due to taxation, interest rates, etc will dampen the consumption expenditure and spending patterns of consumers - demand changes for certain products.
Unemployment High levels of unemployment in a country/region will decrease disposable income thereby decreasing demand which in turn decreases sales and ultimately profits.
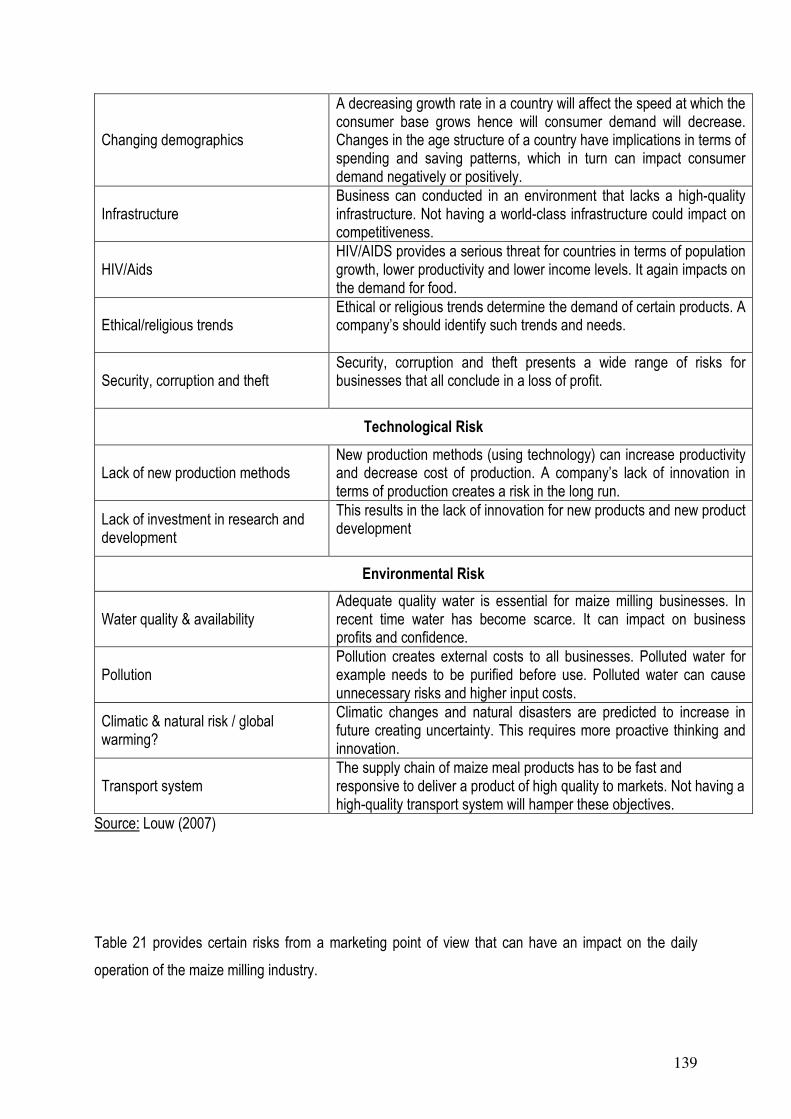
139
Changing demographics
A decreasing growth rate in a country will affect the speed at which the consumer base grows hence will consumer demand will decrease. Changes in the age structure of a country have implications in terms of spending and saving patterns, which in turn can impact consumer demand negatively or positively.
Infrastructure Business can conducted in an environment that lacks a high-quality infrastructure. Not having a world-class infrastructure could impact on competitiveness.
HIV/Aids HIV/AIDS provides a serious threat for countries in terms of population growth, lower productivity and lower income levels. It again impacts on the demand for food.
Ethical/religious trends Ethical or religious trends determine the demand of certain products. A company’s should identify such trends and needs.
Security, corruption and theft Security, corruption and theft presents a wide range of risks for businesses that all conclude in a loss of profit.
Technological Risk
Lack of new production methods New production methods (using technology) can increase productivity and decrease cost of production. A company’s lack of innovation in terms of production creates a risk in the long run.
Lack of investment in research and development
This results in the lack of innovation for new products and new product development
Environmental Risk
Water quality & availability Adequate quality water is essential for maize milling businesses. In recent time water has become scarce. It can impact on business profits and confidence.
Pollution Pollution creates external costs to all businesses. Polluted water for example needs to be purified before use. Polluted water can cause unnecessary risks and higher input costs.
Climatic & natural risk / global warming?
Climatic changes and natural disasters are predicted to increase in future creating uncertainty. This requires more proactive thinking and innovation.
Transport system The supply chain of maize meal products has to be fast and responsive to deliver a product of high quality to markets. Not having a high-quality transport system will hamper these objectives.
Source: Louw (2007)
Table 21 provides certain risks from a marketing point of view that can have an impact on the daily
operation of the maize milling industry.

140
Table 21: Risks at Micro level
Risk Risk Background
Operational Risk
Loss of market share Requires meeting & exceeding requirements of all stakeholders at different levels in the value chain.
Stakeholders with different agendas Lack of alignment in terms of the maize milling strategic and operational goals. Different stakeholders with different objectives.
Food safety An international & domestic requirement. Impacts on business, consumers & suppliers. Requires that necessary control systems are in place.
Systemic risk
The risk that one party involved in the maize milling industry fails, may lead to the collapse of the entire market. If for example the nearby Silo fails, the maize milling business that depends on the silo for maize grain will also fail as it will not have maize grain to produce maize meal with.
Machinery break-down Not having high quality, well maintained, accessible maize milling machines can dampen the profitability of the maize milling business.
Quality of infrastructure & logistics The risk of not having a high quality infrastructure at the various maize milling businesses can lead to a loss in terms of market share, suppliers and customers.
Power outages Contingency plans need to be implemented in the case of power outages. The business still needs to function as efficiently as possible in the case of load shedding.
Employee errors Well trained employees required at different levels of value chain in the maize milling industry. If not available and sustainable, it can impact on reputation risk, etc.
Inventory becoming outdated The risk of insufficient and inconsistent supply of maize meal can have a negative impact on the various maize milling businesses.

141
Product defects or loss of quality in terms of produce.
The quality of maize meal at the businesses must at all times be of a high and consistent standard; the risk of inferior quality will have serious repercussions for the maize milling industry. Must adhere to minimum quality standards.
Security risk The risk of security and safety at maize milling businesses plays a vital role in terms of the long term sustainability.
Product Market Risk
Loss of customers There is always the risk of losing customers to other maize milling businesses.
Competition increases New market entrants in the maize milling industry. Especially, on farm operations of local farmers that can lead to a risk in terms of a loss of suppliers or customers
Supply decreases
A loss in terms of suppliers of consistent quality & quantity can lead to the industry becoming stagnated and predictable. With the recent increases in production costs, the lack of sufficient supply becomes a reality.
Sudden demand changes
The demand for maize meal can change significantly in a short time period. This creates risk in terms of adequate supply of products and supply shortages. For example, the day to day sales of maize meal can change dramatically, one day you will sell one unit of a specific product and the next day you can sell forty units of the same product.
Price volatility
As explained in this study, price volatility can lead to a procurement risk of maize grain. Large scale millers have the cash flow position to adapt to price volatility, which is an advantage over the smaller maize millers.
Lack of innovation and differentiation of products
The value adding, processing and branding of all products needs to be in line with the developments and changes of consumer trends – risk of not doing it.
Mismanagement Issues of bad leadership, lack of vision, innovation, trust, lack of correct information and payment systems all add to this problem.
Financial risk

142
Lack in private sector investment confidence
When financing is required sufficient private sector interest & investment is required. Require a 51:49 financing of expansion. Private sector investment, expertise required.
Interest rate changes Sudden changes in interest rates create risks in terms of credit repayment, which in turn will have a negative effect for the various maize milling businesses.
Capital cost changes (interest costs) Capital cost can change or increase which creates the risk in terms of adequate capital resources necessary to expand.
Default on debt Depending on financial structuring, default on debt is possible due to the above risks.
Control of overheads The risk of not controlling overheads can lead to deficiencies in the functioning, service levels, etc of the market.
Cash flow problems Out of cash or cash flow problems can lead to management problems, payment problems, loss of suppliers, problems with service delivery, security, etc.
Inadequate marketing The effective marketing of value proposition to the public is critical for the development and sustainability of the various maize milling businesses.
Input Risk
Staff skills
The continuous increase in the investment into staff in the milling industry is crucial for capacity building. The staff of the various maize milling businesses are key to the success of the development and expansion of the industry.
Key employees leave Contract of key senior management expire simultaneously. Requires effective succession planning.
Export risk
Consignments not arriving on time
Consignments not arriving on time will create problems in terms of food safety, loss of reputation in agents who export from the various exporting maize milling businesses and future contracts abroad.

143
Consignments arriving damaged Consignments arriving damaged at the final retailer/consumer will result in products with low quality. Negative perceptions are created.
Counterparty risk The loss that may occur in the event of a failure to honour contractual obligations by counterparty creates risk in terms of future contractual agreements.
4.3.11 SUPPORT STRUCTURES OF THE DTI
The Department of Trade and Industry (the Dti) launched a new incentive programme called the
Manufacturing Investment Programme (MIP) which commenced in 2008 and will end in 2014. The
objectives of the MIP are to stimulate much needed investment within the manufacturing industry, while
further aiming to enhance the sustainability of manufacturing investment projects by small enterprises
and to support large-to-medium scale projects in manufacturing that would not have been established
without a grant. The MIP forms part of the Industrial Policy Action Plan. The incentive programme
supports both local and foreign owned entities by offering an investment grant of up to 30 percent. The
qualifying investment costs include machinery, equipment, land and buildings and commercial vehicles.
The investment grant can be summarised as follows (DTI, 2009):
• Investment projects of R5 million and below may qualify for an investment grant of up to 30
percent of the total investment costs.
• Investment projects above R5 million may qualify for an investment grant of between 15 percent
and 30 percent of the total investment costs payable over a two year period.
• Foreign investment projects may qualify for an additional grant for the cost of transporting their
machinery and equipment to South Africa.
To qualify for the MIP, projects are assessed to determine their importance to the Dti’s priority sectors,
job creation, Broad Based Black Economic Empowerment (BBBEE) as well as location in areas of high
unemployment. This programme will aid maize millers with the investment costs. This is a much needed
aspect of the maize milling industry to ensure new entrants and the long term sustainability (DTI, 2009).
To date, a limited number of millers have qualified for the programme as credit conditions from
commercial banks are currently very stringent.

144
4.4 PERFORMANCE OF MAIZE MILLERS INTERVIEWED
The performance of maize millers section includes a detailed analysis of the financial performance of
maize millers, the cost structure in producing a ton of maize meal and also a detailed discussion on
whether maize millers are cost efficient or inefficient.
4.4.1 FINANCIAL PERFORMANCE OF MAIZE MILLERS
The main goal and purpose of this section is to provide an understanding of the maize millers
perception on how their turnover and profit over the past five years performed. The financial
performance of maize millers is divided into the three different capacity scales, which are small, medium
and large. The section also discusses the overall financial performance of all the maize millers
interviewed. Figure 63 indicates the perception of maize millers on how their sales and turnover
performed over the past five years.
Figure 63: The perception of small scale maize millers on their financial performance over the past five years.
From Figure 63 it is clear that 45 percent of maize millers feel that their financial performance over the
past five years was good, 11 percent said their financial performance was very good and 22 percent
indicated that their financial performance was average. This indicates that the majority, 78 percent, of
small scale millers’ financial performance was either average or above average. This is a good sign as it
indicates that, financially, small scale millers are still performing well and that they still have a market
Very good
11%
Good
45%
Average
22%
Bad
11%
Very bad
11%

145
share in the maize milling industry. However, there were also small scale maize millers that indicated
that their financial performance was below average. Out of all the small scale millers, 11 percent
indicated that their turnover and sales performed very bad and another 11 percent indicated that sales
and turnover performed badly.
Figure 64: The perception of medium scale maize millers on their financial performance over the past five years.
Figure 64 indicates the perception of medium scale maize millers regarding their financial performance
over the past five years. From the figure it is clear, that again, medium scale millers (91 percent)
performed above average over the past five years. Of this 91 percent, 37 percent indicated that their
financial performance was very good during the past five years, 27 percent said that it was good and 27
percent indicated that it was on average the same over the past five years. Only 9 percent of all the
medium scale maize millers indicated that their financial performance was very bad over that period.
Figure 65 indicates the perception of the larger scale maize millers interviewed on their financial
performance over the past five years. The figure clearly indicates that all the large scale maize millers
performed either average or better than average over the past five years. Out of the total weight, 40
percent indicated that their sales and turnover has performed very good, another 40 percent that their
financial performance is good and 20 percent indicated that it performed average over the past five
years.
Very good
37%
Good
27%
Average
27%
Very bad
9%

146
Figure 65: The perception of larger scale maize millers on their financial performance over the past five years.
The overall performance of all the maize millers is summarised in Figure 66. From this figure it is clear
that on average 85 percent of maize millers indicated that their financial performance has performed
either averagely or better than average.
Figure 66: The overall perception of all maize millers on their financial performance over the past five years.
Out of the total, 23 percent indicated that their financial performance was very good, 39 percent
indicated it as good and another 23 percent indicated that it was average over the past five years. On
Very good
40%
Good
40%
Average
20%
Very good
23%
Good
39%
Average
23%
Bad
6%
Very bad
9%

147
the downside, only 6 percent of all respondents indicated that their financial performance was good and
another 9 percent indicated that it was very bad.
Having analysed the financial performance of maize millers, it is clear that financially the maize millers
are performing very good. This is a good sign for the long term sustainability of the maize milling
industry.
4.4.2 COST EFFICIENCY
As explained in section 1.3.2, the estimation of whether maize millers are cost efficient was done by
making use of a stochastic cost frontier approach. The details of this approach were fully discussed in
the methodology chapter of this document. A detailed analysis of the results will be presented in this
section.
The gathering of data was complicated by the maize millers’ unwillingness to give a full and detailed
estimate on the specific cost structure for the production of a ton of maize meal, as it was deemed
confidential. Their reluctance stems from the fact that the competition commission is investigating
various sub-sectors in the maize industry. This even led to the National Chamber of Milling posting a
notice that no further information will be made available pending the outcome given by the Competition
Commission of the direction of the study. Maize millers did however provide information on the price of
maize grain per ton, price of labour per ton of maize meal, price of packaging material per ton of maize
meal and transportation costs per ton of maize meal. All other associated costs of producing a ton of
maize meal were categorised as “other costs”. However, maize millers did not feel comfortable providing
their selling price of maize meal per ton, which made the cost efficiency calculation difficult. Their
unwillingness was also due to the expected investigation into the milling industry by the Competition
Commission. The selling price of maize meal is a vital variable that must be included in order to obtain a
proper cost efficiency estimate. The cost efficiency calculation was therefore complicated by the quality
of the data received from the maize millers. The data was statistically insignificant and the number of
observation was too small, which led to degree of freedom problems. As will be explained in Chapter 5,
maize millers are not confident about sharing information freely. This unwillingness to share information
makes a detailed study difficult and complicated. The Competition Commission must ensure that the
industry shares information freely, without being concerned that a prosecution will follow. If an
environment is established by the Competition Commission that promotes information change, future
studies will be less complicated.

148
Table 22 gives the cost efficiency estimates for small, medium and large scale maize millers that were
calculated in this study. However, as explained the calculation was complicated by the unwillingness of
maize millers to share information. This led to data that is of an unusable quality and insignificant
statistical output including degree of freedom problems resulting from the number of observations that
are too small. In order to counter the unwillingness of maize millers to share data, an assumption was
made that all the maize millers have an extraction ratio of 15 percent. This enabled us to perform the
cost efficiency calculation.
Table 22: Output of Cost efficiency estimates for Small, Medium and Large Scale maize millers.
Maize mill Business
Pooled Sample Small Scale
Maize Millers
Medium and Large scale
maize millers
1 1.011824 1.011824
2 1.005320 1.005320
3 1.028529 1.028529
4 1.345264 1.345264
5 1.059470 1.059470
6 1.043953 1.043953
7 1.059698 1.059698
8 1.072079 1.072079
9 1.034906 1.034906
10 1.065289 1.065289
11 1.018245 1.018245
12 1.075365 1.075365
13 1.074443 1.074443
14 1.093493 1.093493
15 1.025731 1.025731
16 1.000471 1.000471
17 1.028174 1.028174
18 1.056324 1.056324
19 1.014698 1.014698
20 1.027337 1.027337
21 1.057149 1.057149
22 1.047792 1.047792
23 1.071741 1.071741
24 1.043897 1.043897
Mean 1.056716 1.067019 1.042293

149
In interpreting the results the cost efficiency estimates indicate that 5.6 percent of all the maize millers’
costs are unnecessary costs. Small scale maize millers are incurring on average 6.7 percent
unnecessary costs and the medium and large scale maize millers are incurring 4.2 percent unnecessary
costs. Put into other words, in total maize millers in the Free State and North West province are wasting
5.6 percent of potential profits. Small scale maize millers are wasting 6.7 percent of profits and the
medium and large scale maize millers are wasting 4.2 percent of profits. From the estimates it is clear
that medium and large scale maize millers are more cost efficient than their small scale competitors.
The ratio between the small and larger scale maize millers in terms of cost efficiency is that the small
scale maize millers are 1.6 times more inefficient that the larger scale maize millers.
In a study conducted by Orefi Abu (2009), it was concluded that the smaller scale maize millers are 1.52
times more inefficient than larger scale maize millers. The output of Orefi Abu (2009) study is presented
in Table 23.
Table 23: Abu’s estimated cost inefficiency for small, medium and large scale maize millers
Efficiency range Pooled Sample Small Scale Mills Medium Scale Mills
# mills Percentage # mills Percentage # mills Percentage
0.10-0.30 7 11.7 4 11.1 2 11.1
0.31-0.50 20 33.3 5 13.9 13 72.2
0.51-0.70 32 53.3 27 75.0 2 11.1
0.71-1.00 1 1.7 0 0.0 1 5.6
Total # of mills 60 100 36 100 18 100
Mean Efficiency 0.58 0.62 0.41
Source: Abu (2009)
In the Abu (2009) study data quality, the willingness to share information and the number of
observations were not a problem. The output of the study can therefore be seen as reliable. From Table
23 it is clear that an average maize mill produces maize meal at a cost that is approximately 58 percent
higher than what is needed. An average small scale mill incurs 62 percent unnecessary costs than is
needed to produce maize meal and a medium scale maize mill is incurs 41 percent more costs than
what is necessary. This is a more realistic estimation of the cost inefficiencies for small and larger scale

150
maize millers. What both these estimates have in common is that smaller scale maize millers are on
average between 50 to 60 percent more cost inefficient than their larger scale maize mill competitors.
4.5 EXPANSION PLANS OF MAIZE MILLERS
Another important issue arising from the study is the perception of maize millers in terms of their
willingness to expand. Figure 67 indicates this perception of maize millers.
Figure 67: The willingness of maize millers to expand in operations.
From the figure it is clear that 55 percent of all maize millers indicated that they want to expand if capital
is available and the opportunity presents itself. The remaining 45 percent indicated that they have no
plans to expand. The reason given for the latter opinion was that some of the maize millers do not belief
that they can acquire the capital for expansion, while the remaining maize millers feel that if they expand
in capacity, efficiency and personal contact will decrease which is a corner stone of their business
operations.
Yes55%
No 45%

151
CHAPTER 5 CONCLUSIONS AND RECOMMENDATIONS
The main purpose of the study was to determine the factors that limits agro-processing in rural areas in
South Africa. In order to conduct a proper study, various objectives and questions were answered and a
detailed analysis of the results was performed. In short, the objectives of the study can be summarised
as follows. The identification of the critical success factors in the maize milling industry, to analyse the
maize supply chain, the determination of input price volatility on the profit margins of maize millers, the
identification of factors that restricts or enhances the competitiveness in the industry, to analyse the
barriers to entry and exit in the industry, the determination of the impact of imports and exports, the
identification of risks in the maize milling industry and lastly, to analyse the support structures provided
to the maize milling industry. This section concludes the findings and results observed by the study and
aims to transform these results and findings into meaningful recommendations.
In order to conduct a proper study, a detailed analysis of the current maize industry was performed in
the maize overview chapter. Chapter 3 was divided into a global maize overview, South African
Development Community (SADC) overview and a South African maize overview. In each overview, the
current state of production, consumption, stock levels, imports and exports, prices and price cycles,
food security issues and the milling industry as a whole, was in detailed summarised to provide an
understanding of the industry in which maize millers have to do business. The South African maize
industry was discussed more in detail and included a section of the South African maize supply chain.
As was mentioned above, a detailed analysis of the South African maize supply chain is one of the
objectives of the study. Chapter 3 further included a detailed Porter Analysis of the maize milling
industry, a detailed discussion of the current global challenges faced by the maize milling industry, as
well as the current issues in the global maize milling industry. In conclusion, Chapter 3 provided a
foundation from where a detailed study could be conducted. The Chapter further provided insights into
the market environment in which maize millers have to do business, a valuable consideration if the
objectives of the study want to be answered.
The maize milling industry in South Africa, specifically in the Free State and North West provinces, is
summarised as an industry that is losing market share in the food industry. The industry which is an
important contributor to the economy, in terms of employment and income creation, must be enhanced
and developed in order secure the long term sustainability of the industry and the goals set out by
government in the Accelerated and Share Growth Initiative –South Africa (ASGISA) programme. The
study concludes that there are many factors that restrict agro-processing development in rural areas.

152
These factors include low levels of government support, the lack of a proper maintained infrastructure,
low levels of diversifications opportunities, high risk environment, high price volatility, highly competitive
industry, changing consumer preferences and the lack of know-how in terms of marketing by
established maize millers.
From the study it is clear that the maize milling industry does not have any government support
structures. Government support is a vital ingredient in terms of the overall sustainability of any industry,
none more so than in the maize milling industry. Government support can aid in acquiring the necessary
capital to establish a milling operation, ensuring that the employees are of a high standard and have the
necessary knowledge and skills levels and by developing a legal framework that enhances development
in agro-processing. In February 2010 the government launched the 2010/11 – 2012/13 Industrial Policy
Action Plan where they aim to support small scale milling as moderate assistance could play an
important role in reducing the cost of basic food products thereby alleviating poverty, reducing hunger
and contributing to a competitively-priced milling and baking sub-sector. The intervention will facilitate
the entry of small-scale maize millers into the South African market. They are expected to be particularly
competitive in rural areas where high transport and logistics costs raise the cost of basic food products.
The intervention consists of standardised maize-mill machinery package embedded in a franchising
business model. This will allow local milling at competitive prices and to the quality standard demanded
by consumers. The lead department is the DTI, supported by the EDD and DAFF. Planned key
milestones are:
• 2010/11 Q3: DTI and IDC will standardised maize-mill machinery programme embedded in a
franchising business model
• 2010/11 Q4: DTI and DAFF will appoint a franchisor to roll out the small-scale maize mill
franchise programme
A large number of maize millers specifically mentioned the legal framework as a barrier to entry created
by government. Especially the small scale maize millers feel that the fortification law enforced by
government incurs a lot of unnecessary costs to an ingredient that the end consumer does not need and
want. The government can further aid by developing and upgrading the infrastructure. Infrastructure was
a major point of discussion as many maize millers feel that the infrastructure around their businesses is
deteriorating. The infrastructure ensures that the final product is delivered on time and meets quality
requirements, a vital value adding proposition by many small scale maize millers. The level of service
delivery by the government in terms of the infrastructure that they provide must improve. Water and

153
electricity were also mentioned by maize millers as a constraint on their business. Government must
ensure that an environment is established that is conductive for businesses.
Another important issue restricting agro-processing development is the high risks involved in the milling
industry. The most important risk identified by maize millers for the industry are changes in consumer
preferences. Maize millers responded that they have definitely experienced changes in consumer
preferences over years. More and more consumers of maize meal are moving away from maize meal to
other starch sources. The industry should focus on attracting consumers back to maize meal as a
primary source of protein. However, this is restricted as maize meal is a homogenous product with very
little product differentiation opportunities. Value adding needs to come in other forms for example
service delivery, high product standards and marketing campaigns. The study found that many maize
millers do not have the necessary skills to start a well directed marketing campaign. The National
Chamber of Milling can play an active role in developing these skills.
Price volatility of input prices dampens development and growth in agro-processing. Sudden changes in
input prices impact the cash flow situations of many maize millers. The respondents alluded to their
cash flow situation as a risk for their business. Price volatility further leads to competitive advantages for
maize millers if their cash flow positions are strong. The industry should develop price volatility
strategies that are effective and will counteract the effect price volatility has on a maize miller’s
business.
Maize milling is a very highly competitive industry, with low barriers to entry. The biggest barrier to entry
that exists in the industry is acquiring the necessary capital to start operations. Maize millers indicated
that it is virtually impossible for them to qualify for credit from banks, as the banks perceive the milling
industry as an industry whose risk is too high. The DTI, IDC, commercial banks and government
institutions must play a more active role in making funds available for credit worthy maize millers to start
operations. Interestingly, the study found that it is not essential for a new market entrant to have many
years of experience to succeed. Several of the maize millers interviewed indicated that they started
operations with no experience. One particular maize miller responded that anyone can learn to operate
a milling machine within one day. However, one needs experience in marketing and for establishing a
brand. Increasing the milling capacity size will improve the market position of some maize millers.
However, the location of the business can serve as a higher competitive advantage over competitors.
The indication was that it is important for small scale maize millers to be located near their end
consumers.

154
The industry is further characterised as having even lower barriers to exit. The only real barrier that
exists in the industry is the ability of maize mill owners to sell their machinery and buildings. Many maize
millers indicated that they can not exit the market because they will not get a willing buyer of their assets
at a reasonable price. This barrier to exit will disappear if the industry becomes more attractive for new
market entrants to enter the maize milling industry.
As was mentioned, the industry is perceived by maize millers as a highly competitive industry, especially
during periods when the maize price is low and farmers start their own milling operations. Large scale
millers also indicated that the industry is highly competitive for the reason that they compete against
each other for the same market space with the same pricing strategies with a final product that is
homogenous in nature. However, high levels of competition are not always bad as it prevents the
occurrence of monopolistic behaviour by larger firms.
One of the most concerning factors for the industry is the unwillingness of maize mill owners to provide
accurate information of the industry and their respective businesses. Information transparency is
essential and must be secured in order to promote development. The cost efficiency calculation was
complicated by this unwillingness of maize mill owners to provide accurate information. In order for the
industry to grow and develop more studies need to be conducted to fully understand the dynamics in the
industry. These are ominous signs for the development of the industry as future studies will become
more complicated. The Competition Commission has an important role to play in this regard. The
Commission must ensure that the industry, which in principle is in favour of what the Commission does,
plays the role of a fair watch dog that protects businesses and prosecutes guilty parties. There is a trend
of businesses not wanting to share information in fear of potential action by the Competition
Commission. Clear rules of the game regarding exchange of information at various levels are required.
The Competition Commission must establish a business environment where information can be shared
freely. This will increase the maize milling industry’s potential to develop and compete freely.
The study was complicated by the fact that no small scale maize miller is required to register at an
organisation. This in itself restricts agro-processing development as maize mill owners are not
supported by any institution and little information is available. The registration of maize mill businesses
will resolve this support problem; it will further provide the maize millers with a voice to discuss the
various issues and challenges in the industry with government. The National Chamber of Milling in
general only represents the larger scale maize millers of the industry.

155
The study concludes that the maize milling industry is a high volume, low profit margin industry.
Development of maize milling in rural areas is difficult if no support structures exist. The National
Chamber of Milling must be more active in the development of smaller scale maize millers.
Having said this, the perceived financial performance of all the maize miller interviewees was good. This
indicates that the established maize millers are doing well and that the industry has grown over the
years. It further indicates that there is room for development within the industry. The concerning issue is
that only 55 percent of all maize millers want to expand their operations, indicating an uncertain industry
for the reasons mentioned above.

156
REFERENCES
Abbassian, A. (2009). Background paper for the Competitive Commercial Agriculture in Sub–Saharan
Africa (CCAA) Study: Maize International Market Profile. Trade and Markets Division. Food and
Agriculture Organization of the United Nations. [Online]: http://siteresources.worldbank.org
/INTAFRICA/Resources/2579941215457178567/Maize_Profile.pdf [Downloaded: 01-2010]
Abbott, P. C., Hurt, C. & Wallace, E. T. (2008). What’s Driving Food Prices? Farm Foundation. Issue
Report. 7/2008.
Abu, O. (2007). Impediments to Competitiveness of Small and Medium-Scale Maize Milling Enterprises
in South Africa. AAAE Conference Proceedings (2007) 291-294.
Abu. O. (2009). Economies of scale and efficiency of small and medium scale maize milling enterprises
in South Africa. Unpublished PhD. Pretoria: University of Pretoria.
Abu, O & Kirsten J.F. (2009). The South African Maize Milling Industry: Can Small and Medium-scale
Maize Milling Enterprise Survive and Thrive? Oral Paper prepared for presentation at the International
conference of Agricultural Economists in Beijing China, 16-22 August, 2009.
ACCID (2009). Africa wide civil society climate change initiative for policy dialogues: Climate change is
a challenge and an opportunity. The Guardian, 18 May 2009. [Online]:
http://www.africaclimatesolution.org/news.php?id=4228 [Downloaded: 23-06-2009]
Acts online. (1997). Basic conditions of employment act. [Online]:
http://www.acts.co.za/bcoe97/index.htm
ACTS online. (1998). Employment Equity Act. [Online]: http://www.acts.co.za/emp_equity/index.htm
African Development Bank Group (2010). About Us. [Online]: http://www.afdb.org/en/about-us/
[Downloaded: 17-02-2010].
African Development Bank Group (2010). Agriculture and Agro-industries. [Online]:
http://www.afdb.org/en/topics-sectors/sectors/agriculture-agro-industries/ [Downloaded: 17-02-2010].

157
AGRINC (2009). Northern Cape Department of Agriculture 2009. [Online]:
www.agrinc.gov.za/docs/Field%20Crop%20Industries.doc [Downloaded: 19-02-2010].
Alam S and Tongsiri N, (2003). Promotion of Agro Processing Industry in Bangladesh: Potentials
Constraints and Policy Issues. Regional seminar of Bangladesh Economics Association at Bangladesh
Agricultural University, Mymensingh on 17th December 2003. [Online]: www.bdeconassoc.org userfiles
pdf 6%20Promotion%20of%20Agro-processing
%20Industry%20in%20Bangladesh%20Potentials%20Constraints%20and%20Policy%20Issues
[Downloaded: 23-01-2010]
Alexandratos, N. (2008). Food Prices Surges: Possible Causes, Past Experience and Longer Term
Relevance. Population and Development Review. Vol. 34(4): 663-697.
Alexandratos, N. ( 2009). World Food and Agriculture to 2030/50. Paper for the Expert Meeting on “How
to Feed the World in 2050,” FAO, Rome, 24-26 June 2009 (revised 25 July 2009).
Aleksandrova, A. & Lubys, J. (2004). Application of the Structure-Conduct-Performance Paradigm in a
Transition Economy: Explaining Reported Profitability of the Largest Latvian Firms. SSE Riga Working
Papers, 8(63).
AVERT (2008). HIV and Aids in South Africa. [Online]: http://www.avert.org/aidssouthafrica.htm
[Downloaded 24-06-2009]
Baltzer, K., Hansen, H. & Lind, K. M. (2008). A note on the causes and consequences of the rapidly
increasing international food prices. Institute of Food and Resource Economics. University of
Copenhagen. May 2008.
Battese, G.,E Coelli, T.J., (1995). A model for technical inefficiency effects in a stochastic frontier
production function for panel data. Empirical Economics, 20, 325-332.
Bavorova M. and Hockmann H., (2008). Relationships’ sustainability: the case of German wheat-to-
bread chain. Martin Luther University /Farm Management Department, Halle, Germany, Leibniz Institute

158
for Agricultural Development in Central and Eastern Europe/Department Agricultural Markets, Halle,
Germany. [Online]: http://ageconsearch.umn.edu/handle/44067 [Downloaded: 17-01-2010]
BEKKER, L. (2004). Fortification manual. Prepared by the Tshwane University of Technology for the
Department of Health, Directorate: Nutrition, Directorate: Food Control, With the support from the
Micronutrient Initiative and UNICEF South Africa.
Bio watch (Not Dated). Frequently asked questions about genetic modification. [Online]:
http://www.biowatch.org.za/main.asp?include=about/faq.html [Downloaded: 2010-03-09].
Bosserman, S. (2007). Agriculture Megatrends: Ten Trends Redefining the Practice of Agriculture in the
World. [Online]: http://www.newmediaexplorer.org/steve_bosserman /2007/02/01/agriculture_
megatrends_ten_trends_redefining_the_practice_of_agriculture_in_the_world.htm [Downloaded: 24-
06-2009]
Brenton, P., Flatters, F. & Kalenga, P. (2005). Rules of origin and Southern African Development
Community (SADC): The case for change in the mid term review of the trade protocol. Working paper,
83. Not known: World Bank.
Bureau for Food and Agricultural Policy (BFAP) (2007). Bureau for Food and Agricultural Policy
Baseline 2007. [Online]: http://www.bfap.co.za/reports/BFAP%20Baseline%20June
%202007.pdf [Downloaded: 2010-02-09]
Bureau for Food and Agricultural Policy (BFAP) (2009). Bureau for Food and Agricultural Policy
Baseline 2009. [Online]: http://www.bfap.co.za/reports/BFAP%20baseline%202009.pdf [Downloaded:
2010-02-09]
Cape gateway (2009). Adult basic education and training act. [Online]:
http://www.capegateway.gov.za/eng/your_life/10115
Chilonda, P., Machete, C. & Minde, I. (2007). Poverty, food security and agricultural trends in Southern
Africa. Pretoria: Regional Strategic Analysis and Knowledge Support System Southern Africa.

159
Chilonda, P. & Minde, I. (2007). Agricultural growth trends in Southern Africa. Pretoria: Regional
Strategic Analysis and Knowledge Support System Southern Africa.
Chilonda, P., Olubode-Awosola, O.O. & Minde, I. (2009). Trends in agricultural growth and performance
in Southern Africa. Pretoria: Regional Strategic Analysis and Knowledge Support System Southern
Africa.
CIAT, (2002). Promoting Agro-enterprise Links for Improved Rural Livelihoods, International Center for
Tropical Agriculture (CIAT), Rural Agro-enterprise Development Project, Cali, Colombia.
CME Group, (2010). Corn historical volatility. [Online]: http://www.cmegroup.com/market-
data/reports/historical-volatility/corn-volatility.html [Downloaded: 22-03-2010]
College for Agricultural Economics and Trade. (CAET). 2003. Structure, Conduct and Performance of
the Vegetable Sector in Pengzhou County. People’s Republic of China: Ya’an, Sichuan Province.
Cutts M & Geyser M (2007). SAFEX maize price volatility scrutinized. Agrekon. Vol. 46 No 3
(September 2007)
Diao, X., Fan, S., Headey, D., Johnson, M., Pratt, A.N. & Yu, B. (2008). Accelerating Africa’s food
production in response to rising food prices – Impacts and requisite actions. Washington: Regional
Strategic Analysis and Knowledge Support System.
de Magistris T. and Gracia A.,(2008). Co-operation and economic relationship as determinants for
competitiveness in the food sector: the Spanish wheat to bread chain. Agro-food Economics and
Natural Resources Unit ,Centro de Investigación y Tecnología Agroalimentaria de Aragón (CITA).
[Online]: http://ageconsearch.umn.edu/handle/44066 [Downloaded: 17-01-2010]
De Villers, J. & Moloitsane, P.J. (2003). Food Security Public Hearing Portfolio Committee On
Agriculture. Presentation made by National Chamber of Milling.
Department of Trade and Industry (2008). Consumer Protection Bill. [Online]:
http://www.dti.gov.za/parlimentary/bills/ConsumerProtectionBill.pdf [Accessed: 2010-05-10]

160
Department of Health (2003). Foodstuff, cosmetics and disinfectants act, 1972: Regulations relating to
the fortification of certain foodstuffs. [Online]:
http://www.doh.gov.za/docs/regulations/2003/ffortification.html
Donley, A. (2009). World Grain: The international business magazine for grain, flour and feed.
Equipment suppliers staying busy despite global economic slowdown. [Online]:
http://am1.sosland.com/Olive/ODE/WorldGrain/Default.aspx?href=WG%2F2009%2F05%2F01&pageno
=42&view=document. [Downloaded: 02-2010]
Duggan P. (2009). Food Alert Capturing Key trends in the Global Food and drinks market: Changes in
World Maize production and trade. [Online]: www.bordbia.ie [Downloaded: 12-2009]
Ellis, S., (2009). How should congress respond to the cost price squeeze in agriculture? Published in
Farmgate. [Online]: http://www.farmgate.uiuc.edu/archive/2009/08/how_should_cong.html Downloaded:
25-03-2010]
Esterhuizen, D. (2006). An Evaluation of the competitiveness of the South African agribusiness sector.
Unpublished PhD thesis. University of Pretoria, South Africa.
EUROMAISIERS affiliated member of COCERAL (2009). The EU dry milling industry of maize: maize
milling process (Flow chart). [Online]: http://www.coceral.com/cms/beitrag/10010249/230012
[Downloaded: 01-2010]
Famine Early Warning Systems Network (FEWS NET) (2009). SADC Food Security Early Warning
System. Food security update no.5, Gaborone, 15th February 2009.
Famine Early Warning Systems Network. (2007). Cross border trade update. Washington: United
Nations World Food Program.
Fan, S., Johnson, M., Saurkar, A. & Makombe, T. (2009). Investing in African agriculture to halve
poverty by 2015. Washington: Regional Strategic Analysis and Knowledge Support System.

161
FAO, (1997). The State of Food and Agriculture: Part III, The agro processing industry and economic
development. Paper originated by Economic and Social development Department. [Online]:
http://www.fao.org/docrep/W5800E/w5800e12.htm [Downloaded 23-01-2010]
Filling the Gaps (2008). Porter’s 5 forces model of competition. [Online]:
http://images.google.co.za/imgres?imgurl=http://fillingthegaps.files.wordpress.com/2008/01/porter1.jpg&
imgrefurl=http://fillingthegaps.wordpress.com/2008/01/16/porters-5-forces-model-of-
competition/&usg=__r-
t2_uPYz67MyGREQwceIYBofoM=&h=386&w=755&sz=19&hl=af&start=5&um=1&itbs=1&tbnid=o_U4jN
Lo4YKpEM:&tbnh=73&tbnw=142&prev=/images%3Fq%3Dporter%2Bmodel%26hl%3Daf%26sa%3DX
%26um%3D1 [Downloaded: 02-2010]
Flatters, F. (2002). Wheat flour in SADC: Rules of origin, tariff preferences and competition. Paper
presented at SADC TNF meeting, 11 – 14 March. Gaborone: Botswana.
Food and Agriculture Organisation (FAO), (1997). The State of Food and Agriculture. FAO report,
Rome.
Food and Agricultural Policy Research Institute (FAPRI), (2009). World Coarse Grains. FAPRI 2009
Agricultural Outlook / 183. [Online]: www.fapri.iastate.edu/outlook/2009/text/10worldcoarsegrains.pdf
[Downloaded: 02-2010]
Food and Agriculture Organization (FAO), (2007). Coping with water scarcity. Agriculture Consumer
and Protection Department. [Online]: http://www.fao.org/ag/magazine/0704sp4.htm [Downloaded: 24-
06-2009]
Food and Agriculture Organization (FAO), (2008). Food Outlook. November 2008. [Online]:
http://www.fao.org/docrep/011/ai474e/ai474e03.htm. [Downloaded: 24.2.2009]
Food and Agriculture Organisation (FAO), (2009). Global market analysis coarse grains. Food Outlook
(June 2009). [Online]: www.fao.org/docrep/011/ai482e/ai482e04.htm [Downloaded: 01-2010]

162
Food Price Monitoring Committee, (2003). Final report of the Food Price Monitoring Committee.
Pretoria, South Africa. In: Funke B.T. (2006). “From farm to retail: costs and margins of selected food
industries in South Africa”.
Food Price Monitoring Committee, (2004). Maize report. Pretoria, South Africa. [Online]:
http://www.namc.co.za/ASSETS/NewPdfs/FPM%20Report%202004_04_02_FoodValueChains_Maize.p
df [Downloaded: 15-03-2010]
Funke B.T. (2006). From farm to retail: costs and margins of selected food industries in South Africa
Unpublished MSc thesis. University of Pretoria. [Online] Available from UPeTD:
http://upetd.up.ac.za/thesis/available/etd-09162008-172432/ [Downloaded: -13-03-2010]
Gale H, Tuan F, Wang X and Cao Z (2009). China is using more maize for industrial products. Report
from ERS for USDA nr. FDS-09K-01.H. [Online]:
http://www.ers.usda.gov/Publications/FDS/2009/12December/FDS09K01/FDs09K01.pdf [Downloaded:
01-2010]
GrainSA, (2009). Final area planted and crop production figures of commercial maize, sunflower seed,
soya beans, groundnuts and sorghum (2008/09 production season). [Online]:
http://www.grainsa.co.za/documents/CEC%20Calculated%20final%20crop%20of%20summer%20crops
%20Nov%2009.pdf [Downloaded 25-03-2010]
Heady, D. & Fan, S. (2008). Anatomy of a crisis: the causes and consequences of surging food prices.
Agricultural Economics, Vol. 39(1): 375-391.
Government Gazette. 1993. Agricultural Labour act. [Online] Available from:
http://www.info.gov.za/view/DownloadFileAction?id=88653
Government Gazette 1993. Compensation for occupational injuries and disease act. [Online] Available
from: http://www.info.gov.za/view/DownloadFileAction?id=71058
Government Gazette (1993). Occupational health and safety act. [Online]:
http://www.info.gov.za/acts/1993/a85-93.pdf

163
Government Gazette 1995. Labour Relations Act. [Online]:
http://www.info.gov.za/view/DownloadFileAction?id=70985
Government Gazette. 1996. Land reform (labour tenants)act. [Online] Available from:
http://www.info.gov.za/gazette/acts/1996/a3-96.htm
Government Gazette (1998A). Prevention of illegal eviction and unlawful occupational of land act
[Online]: http://www.info.gov.za/view/DownloadFileAction?id=70676
Government Gazette (1998B). Skills development act. [Online]:
http://www.info.gov.za/view/DownloadFileAction?id=70755
Government Gazette. 2003. National Small Business Amendment Act. [Online] Available from:
http://www.info.gov.za/view/DownloadFileAction?id=68002.
Government Gazette. 2003B. Broad based black economic empowerment act. [Online] Available from:
http://www.info.gov.za/view/DownloadFileAction?id=68031
Hofstrand D. (2007). Barriers to Entry and Exit. Agricultural Marketing Research Council, Iowa State
University. [Online]: http://www.agmrc.org/business_development/getting_prepared/business_and_
economic_concepts_and_principles/barriers_to_entry_and_exit.cfm [Downloaded: 20-01-2010]
HP Agri Dept. (2005). Maize and maize processing unit. [Online]:
http://www.jansamachar.net/display.php3?id=&num=3041&lang=English [Downloaded: 14-12-2009]
Industrial Development Corporation (2009). Africa Unit. [Online]:
http://www.idc.co.za/Africa%20Funding.asp [Downloaded: 16-02-2010].
IIASA (2009). Biofuels and Food security: Implications of accelerated biofuels production. [Online]:
www.ofid.org/publications/pdf/pamphlet/ofid_pam38_Biofuels.pdf [Downloaded: 02-2010]
Johnson, M., Omilola, B., Flaherty, K., Makombe, T., Macneil, M. & Horowitz, L. (2008). Monitoring
agricultural sector performance, growth and poverty in Africa. Washington: Regional Strategic Analysis
and Knowledge Support System.
164
Joemat-Pettersson, T (2009). White commercial farmers won‘t be discarded. [Online]:
http://www.sagoodnews.co.za/agriculture_land_reform/white_commercial_farmers_wont_be_
discarded_minister.html [Downloaded 24-06-2009]
JSE, (2009). SAVI White Maize Volatility Index. [Online]: http://www.jse.co.za/products/commodity-
derivatives-market/commodity-derivatives-market-product-detail/SAVI_White_Maize.aspx [Downloaded:
17-12-2009]
JSE, (2010). SAVI historical database. [Online]: http://www.jse.co.za/Markets/Commodity-Derivatives-
Market/Commodity-Derivatives-Price-History.aspx#SAVI [Downloaded: 22-03-2010]
Kachru R.P., (2001). “Agro-Processing Industries in India—Growth, Status and Prospects”,
[Online] available at: http://agricoop.nic.in/Farm%20Mech.%20PDF/05024-06.pdf [Downloaded: 13-12-
2009]
Kachru R.P., (2009). “Agro-Processing Industries in India—Growth, Status and Prospects”, Status of
farm mechanization in India, Indian Ministry of Agriculture: Department of Agriculture and Cooperation.
[Online] available at: http://agricoop.nic.in/Farm%20Mech.%20PDF/05024-06.pdf [Downloaded: 15-01-
2010]
Kaplinsky, R. & Morris, M. (2000). A Handbook for Value Chain Research. Handbook prepared for the
IDRC: Canada.
Kumbhakar, S.C & LovelL, C.A.K. (2000). Stochastic Frontier Analysis. Cambridge
University Press.
Lambert, M. & Macniel, M. (2009). Achieving agricultural development and economic growth in Malawi:
How CAADP can help. Washington: Regional Strategic Analysis and Knowledge Support System.
Lambert, I., (2001). Problems and constraints to the development of the agro-processing sector.
Paper presented at the Dominica Country Conference, University of the West Indies, Dominica

165
Lyddon, C. (2009). World Grain: The international business magazine for grain, flour and feed. IGC
executive director says providing accurate information more important than ever in light of the recent
volatility in the grain markets. [Online] :
http://am1.sosland.com/Olive/ODE/WorldGrain/Default.aspx?href=WG%2F2009%2F05%2F01&pageno
=42&view=document. [Downloaded: 02-2010]
Louw, A. (2007).Risk management: managing enterprise risks. University of Pretoria
Louw, A. (2007). Risk management in agriculture. University of Pretoria
Mano R, Isaacson B & Dardel P, (2003). Identifying Policy Determinants of Food security Response and
Recovery in the SADC Region: The Case of 2002 Food Emergency. FANRPAN, Regional Dialogue on
Agricultural Recovery, Food Security and Trade Policies in Southern Africa.
Maize Tariff Working Group (2005). Submission of Maize Tariff Working Group to the International
Trade Administration Commission of South Africa (ITAC). [Online]:
http://www.grainmilling.org.za/maize_tariff.htm [Downloaded: 19-03-2010]
Macro Economic Research Group, (2003). Making Democracy Work. Centre for Development Studies,
University of the Western Cape.
Machaka, J & Roberts, S., (2003). The DTI’s New ‘Integrated Manufacturing Strategy’s Comparative
industrial performance, linkages and technology, South African Journal of Economics, 71(4): 1-26.
McCormick, D. & Atieno, R., (2002). Linkages between small and large firms in the Kenyan food
processing sector, in M. van Dijk and H. Sandee (eds), Innovation and small enterprises in the
Third World, Cheltenham, Edward Elgar.
Memedovic, O. & Shepherd, A., (2009). Agri-food value chains and poverty reduction: overview of main
issues, trends and experiences. Working Paper 12/2008 United Nations Industrial Development
Organization: Vienna.
Moyo S, (2008). Who Will Feed the Poor? The Future of Food Security for Southern Africa. Southern
Africa Trust. [Online]:

166
http://www.donorplatform.org/component/option,com_docman/task,doc_view/gid,886/ [Downloaded:
2010-02-08].
National Agricultural Marketing Council (NAMC). (2004). NAMC Food Value Chains –Maize 2004
[Online]: http://www.namc.co.za/dnn/PublishedReports/FoodPriceMonitoring.aspx [Downloaded: 15-02-
2010]
National Agricultural Marketing Council (NAMC). (2009). NAMC Quarterly Food Price Monitor Nov 2009
[Online]: http://www.namc.co.za/dnn/PublishedReports/FoodPriceMonitoring.aspx [Downloaded: 15-
02-2010]
National Chamber of Milling (NCM). (2005). The Strategic Plan For The South African Grain Industry.
[Online]: www.grainmilling.org.za/documents [Downloaded: 13-02-2010]
National Agricultural Marketing Council (NAMC) (2003): Pretoria, Food Pricing Monitoring Committee,
2002.
NATIONAL CHAMBER OF MILLING (2003). Unpublished information as reported in the Final Report of
the Food Price Monitoring Committee, December 2003, Part 3, The maize-to-maize meal value chain,
Pretoria: National Agricultural Marketing Council and National Department of Agriculture, pp.154.
National Department of Agriculture (NDA), (2005). Abstracts of Agricultural Statistics. Government of
South Africa, Pretoria.
New Partnership for Africa’s Development (NEPAD), (2009). Framework for the improvement of rural
infrastructure and trade-related capacities for market access. Lusaka: University of Zambia
New Partnership for Africa’s Development (NEPAD), (2009). The comprehensive Africa agricultural
development programme (CAADP). Sustainable land water management .Lusaka: University of Zambia.
Nyathi, S (2009). Emerging farmers need help. [Online]: http://www.news24.com/
Content/SouthAfrica/Politics/1057/1a23a398164e4d9b85140fdf51a584d7//Emerging_farmers_need_hel
p [Downloaded 18-03-2010]

167
Parhanse, R. (2007). Peripheral Small Town Development: Senqu Municipality, Eastern Cape
Province, South Africa. Urban Forum (2007) 18:105–115
Perishable Products Export Control Board (PPECB), (2007). Agricultural products standards act 119 of
1990. [Online]: www.ppecb.com/NR/rdonlyres/EE77877B-59F9-4629-8F58-
FAA505127FA3/67/APSAct119of1990.pdf
SADC (2008). Food Security Early Warning System. Food security update issue 7, Gaborone, 12th
August 2008.
Sosland, I.M. (2009). World Grain: The international business magazine for grain, flour and feed.
Australia builds new grain wagons. [Online]:
http://am1.sosland.com/Olive/ODE/WorldGrain/Default.aspx?href=WG%2F2009%2F05%2F01&pageno
=42&view=document. [Downloaded: 02-2010]
Sosland, I.M. (2009). World Grain: The international business magazine for grain, flour and feed.
China’s maize processing industry. [Online]: http://am1.sosland.com/Olive/ODE/WorldGrain/
Default.aspx?href=WG%2F2009%2F05%2F01&pageno=42&view=document [Downloaded: 02-2010].
Sosland, I.M. (2009). World Grain: The international business magazine for grain, flour and feed. CHS
sales, revenues down in first half of 2009. [Online]:
http://am1.sosland.com/Olive/ODE/WorldGrain/Default.aspx?href=WG%2F2009%2F05%2F01&pageno
=42&view=document. [Downloaded: 02-2010].
Sosland, I.M. (2009). World Grain: The international business magazine for grain, flour and feed. Grain
storage and handling projects. [Online]:
http://am1.sosland.com/Olive/ODE/WorldGrain/Default.aspx?href=WG%2F2009%2F05%2F01&pageno
=42&view=document. [Downloaded: 02-2010].
Sosland, I.M. (2009). World Grain: The international business magazine for grain, flour and feed.
Kitahara reflects on several years of expansion. [Online]:
http://am1.sosland.com/Olive/ODE/WorldGrain/Default.aspx?href=WG%2F2009%2F05%2F01&pageno
=42&view=document. [Downloaded: 02-2010]

168
Sosland, I.M. (2009). World Grain: The international business magazine for grain, flour and feed.
Despite Bunge’s first-quarter loss, milling segment grows. [Online]:
http://am1.sosland.com/Olive/ODE/WorldGrain/Default.aspx?href=WG%2F2009%2F05%2F01&pageno
=42&view=document. [Downloaded: 02-2010].
South African Grain Information service (SAGIS). (2010), SADC information. [Online]:
www.sagis.org.za. [Downloaded: 9-02-2010]
South African Grain Information Service (SAGIS) (2010). Progressive Imports and Exports. [Online]:
http://www.sagis.org.za/ [Downloaded: 2010-03-12].
South African Grain Information Service (SAGIS). (2010). Maize database: Stock position tables.
[Online]: http://www.sagis.org.za/main_a.htm [Downloaded: 2010-02-08]
Spencer S. (2004). Price determination in the Australian Food Industry, A Report, Australian
Government, Department of Agriculture, Fisheries and Forestry, Canberra. In: Funke B.T. (2006). From
farm to retail: costs and margins of selected food industries in South Africa.
Staff reporter (2005). Mega-trends: convenience food and health to double in ten years. [Online]:
http://www.bakeryandsnacks.com/Formulation/Mega-trends-convenience-food-and-health-to-double-in-
ten-years [Downloaded 17-07-2009]
Suresh B (2009). Global economic crisis and nutrition security in Africa. Review Article. [Online]:
http://www.ajfand.net/Issue30/PDFs/Suresh9410.pdf [Downloaded: 01-2010]
Traub, L.N. & Jayne, T.S. (2006). Opportunities to Improve Household Food Security Through
Promoting Informal Maize Marketing Channels: Experience From Eastern Cape Province, South Africa.
Working paper: Michigan State University.
Trostle, R. (2008). Global Agricultural Supply and Demand: Factors Contributing to the Recent Increase
in Food Commodity Prices. United States Department of Agriculture. A Report from the Economic
Research Service. May 2008.

169
United States Department of Agriculture (USDA) (2007). Promoting agricultural sustainability through
green food pathway toward wholesome environment, foods and living (non technical summary).
[Online]: http://www.reeis.usda.gov/web/ crisprojectpages/135473.html [Downloaded 24-06-2009]
United States Department of Agriculture (USDA) (2009). World coarse grains production, consumption
and stocks. Foreign Agricultural service. [Online]:
www.fas.usda.gov/psdonline/psdreport.aspx?hidReportRetrievalName=BVS&hidReportRetrievalID=690
&hidReportRetrievalTemplateID=7 [Downloaded: 01-2010]
United States Department of Agriculture (USDA) (2010). 2009 Crop Year is one for the record books.
[Online]: http://www.nass.usda.gov/Newsroom/2010/01_12_2010.asp [Downloaded 25-03-2010]
USAID. (2006). Structure-Conduct-Performance and Food Security. FEWS NET Markets Guidance, No
2. Washington.
Vermeulen, H. & Kirsten, J.F. (2006). Small Scale Millers and Maize Consumers in the Limpopo
Province. National Agricultural Marketing Council. Government printers: Pretoria.
Vilakati J.D. (2010). Swaziland Environment Authority: Importation of Genetically Modified crops to
Swaziland. [Online]: http://www.sagis.org.za/ [Downloaded: 2010-03-10].
Wellington, A. & Mwangola, A. (2006). Why Africa has fallen short of building dynamic agro-processing
capabilities: Constraints, options and prospects. Nairobi: African Technology Policy Studies Network.
World Bank (2008). World Development Report 2008: Agriculture for Development. The World Bank,
Washington DC.
WESLEY, A.S. (2003). Small and medium scale milling and fortification background paper, Draft
January 2003, Micronutrient Initiative, Ottawa, Canada. [Online]: http://www.micronutrient.org
Watkinson E, & Makgetla N. (2002). South Africa’s food security crisis. National Labour and Economic
Development Institute. [Online]: http://www.sarpn.org.za/documents/d0000077/P93_safscrisis.pdf
[Downloaded: 2010-03-01].

170
World Health Organization (WHO) (2010). Health impacts of the global food security crisis. [Online]:
http://www.who.int/food_crisis/en/ [Downloaded: 01-2010]
Youning, S and Zhongdong L, (2009). China’s maize processing industry. [Online]:
http://www.vaas.org.vn/english – VAAS [Downloaded 14-12-2009]
Youning, S & Zhongdong L, (2009). China’s maize processing industry. [Online]:
http://www.vaas.org.vn/english - VAAS [Downloaded: 14-12-2009]
Youning, S & Zhongdong, L. (2009). World Grain: The international business magazine for grain, flour
and feed. Sector is growing rapidly, but still lags behind some developing countries. [Online]:
http://am1.sosland.com/Olive/ODE/WorldGrain/Default.aspx?href=WG%2F2009%2F05%2F01&pageno
=42&view=document. [Downloaded: 02-2010]
Zambian Ministry of Agriculture (2004). Review of the Zambia National Food Balance Sheet. Lusaka:
Ministry of Agriculture.