Embed Size (px)
Citation preview
Session # 7Session # 7
Maintenance PlansMaintenance PlansEngineered Maintenance Strategies, Failure Analysis & Root Cause Analysis
1© Life Cycle Engineering 2008 1© Life Cycle Engineering 2008 1© Life Cycle Engineering 2008© Life Cycle Engineering 2008
Where does the Maintenance Plan fit in?
ASSET MANAGEMENT Where does the Maintenance Plan fit in?
STRATEGY
2© Life Cycle Engineering 2008 2© Life Cycle Engineering 2008 2© Life Cycle Engineering 2008
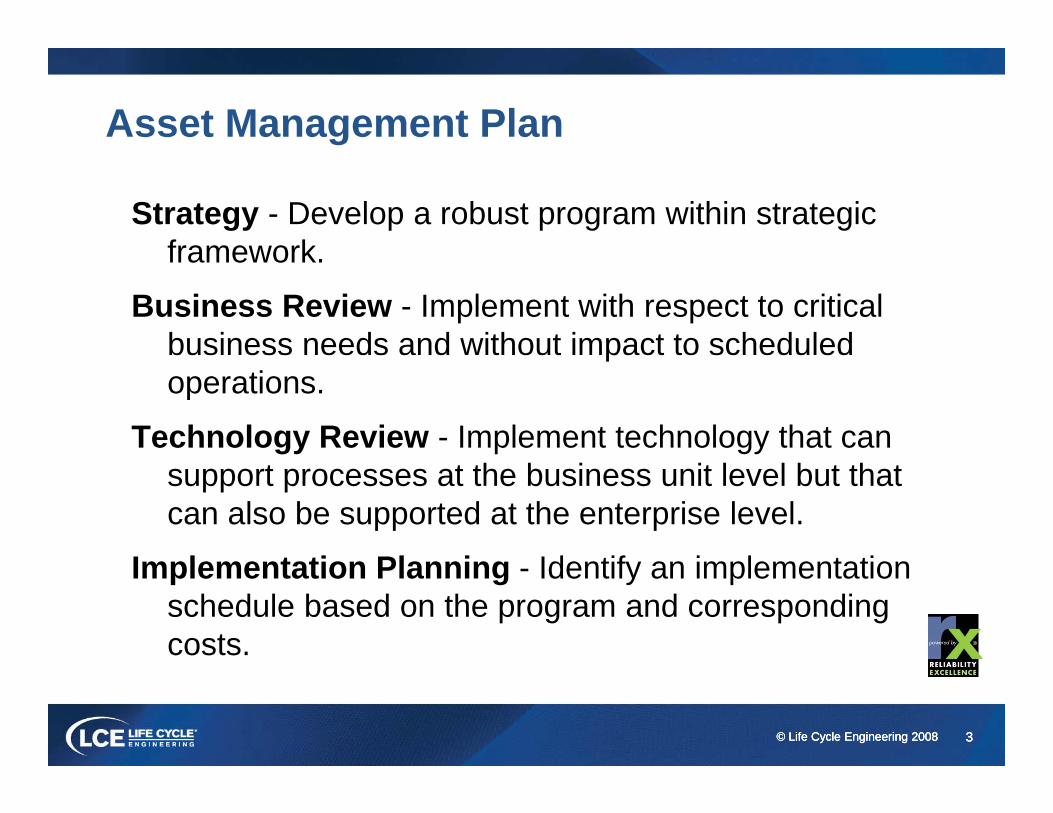
Asset Management Plan
Strategy - Develop a robust program within strategic frameworkframework.
Business Review - Implement with respect to critical business needs and without impact to scheduled poperations.
Technology Review - Implement technology that can support processes at the business unit level but that can also be supported at the enterprise level.
I l t ti Pl i Id tif i l t tiImplementation Planning - Identify an implementation schedule based on the program and corresponding costs.
3© Life Cycle Engineering 2008 3© Life Cycle Engineering 2008 3© Life Cycle Engineering 2008
The Purpose
ASSET MANAGEMENT PLANThe Purpose
4© Life Cycle Engineering 2008 4© Life Cycle Engineering 2008 4© Life Cycle Engineering 2008
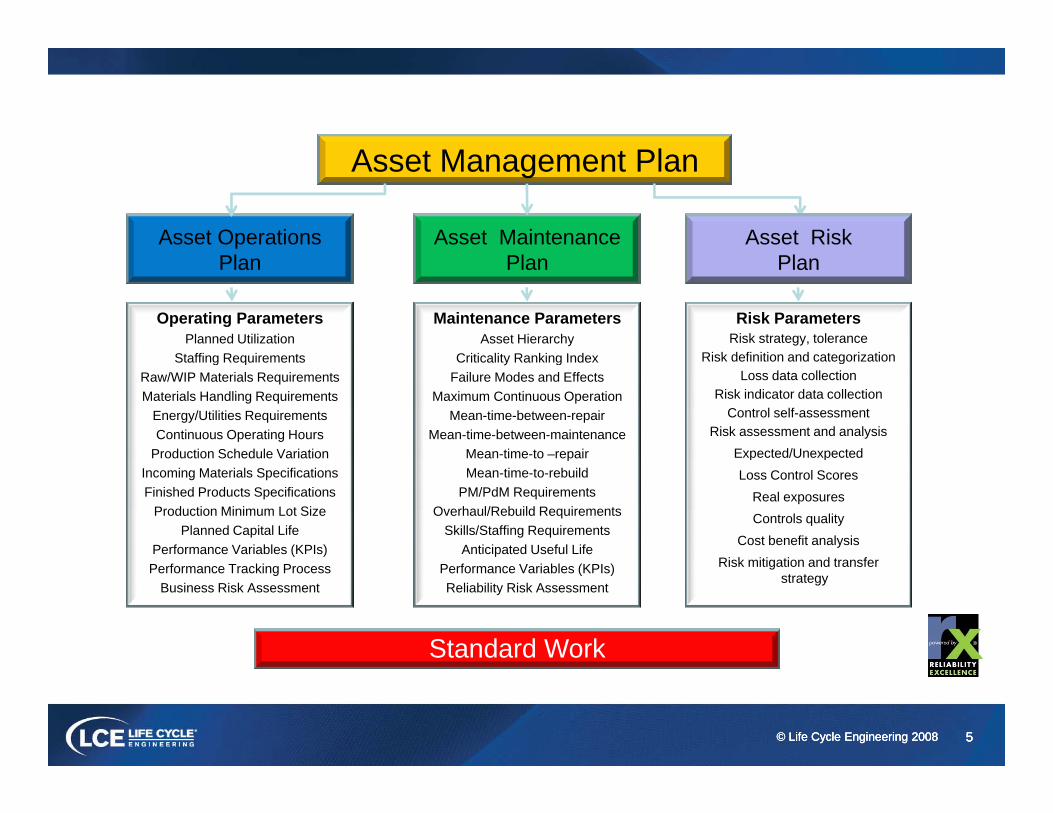
A t M t PlAsset Management Plan
Asset Operations Asset Maintenance Asset Risk Plan Plan
Operating ParametersPlanned Utilization
Staffing Req irements
Maintenance ParametersAsset Hierarchy
Criticalit Ranking Inde
Plan
Risk ParametersRisk strategy, tolerance
Risk definition and categorizationStaffing RequirementsRaw/WIP Materials RequirementsMaterials Handling Requirements
Energy/Utilities RequirementsContinuous Operating Hours
Production Schedule Variation
Criticality Ranking IndexFailure Modes and Effects
Maximum Continuous OperationMean-time-between-repair
Mean-time-between-maintenanceMean-time-to –repair
Risk definition and categorizationLoss data collection
Risk indicator data collection Control self-assessment
Risk assessment and analysisExpected/Unexpected Production Schedule Variation
Incoming Materials SpecificationsFinished Products Specifications
Production Minimum Lot SizePlanned Capital Life
Performance Variables (KPIs)
Mean time to repairMean-time-to-rebuild
PM/PdM RequirementsOverhaul/Rebuild Requirements
Skills/Staffing RequirementsAnticipated Useful Life
p pLoss Control Scores
Real exposuresControls quality
Cost benefit analysisRisk mitigation and transferPerformance Tracking Process
Business Risk AssessmentPerformance Variables (KPIs)Reliability Risk Assessment
Standard Work
Risk mitigation and transfer strategy
5© Life Cycle Engineering 2008 5© Life Cycle Engineering 2008 5© Life Cycle Engineering 2008
Asset Management Plan Key Components
THE OPERATING PLANAsset Management Plan Key Components
6© Life Cycle Engineering 2008 6© Life Cycle Engineering 2008 6© Life Cycle Engineering 2008
The Operating Plan
• Standard operating proceduresp g p• Start-up / Shut–down procedures• Materials proceduresMaterials procedures• Operator care procedures
7© Life Cycle Engineering 2008 7© Life Cycle Engineering 2008 7© Life Cycle Engineering 2008
Operating Envelope
• Boundary conditions, e.g. input-outputy , g p p• Startup and shutdown cycles• Permissible operating ranges and methodsPermissible operating ranges and methods• Operating campaigns• Specific procedures for abnormal operatingSpecific procedures for abnormal operating
modes
8© Life Cycle Engineering 2008 8© Life Cycle Engineering 2008 8© Life Cycle Engineering 2008
Asset Management Plan Key Components
THE RISK PLANAsset Management Plan Key Components
9© Life Cycle Engineering 2008 9© Life Cycle Engineering 2008 9© Life Cycle Engineering 2008
The Risk Plan
• Risk identification• Risk analysis• Risk mitigationRisk mitigation• Communication plan• Risk management tableRisk management table
10© Life Cycle Engineering 2008 10© Life Cycle Engineering 2008 10© Life Cycle Engineering 2008
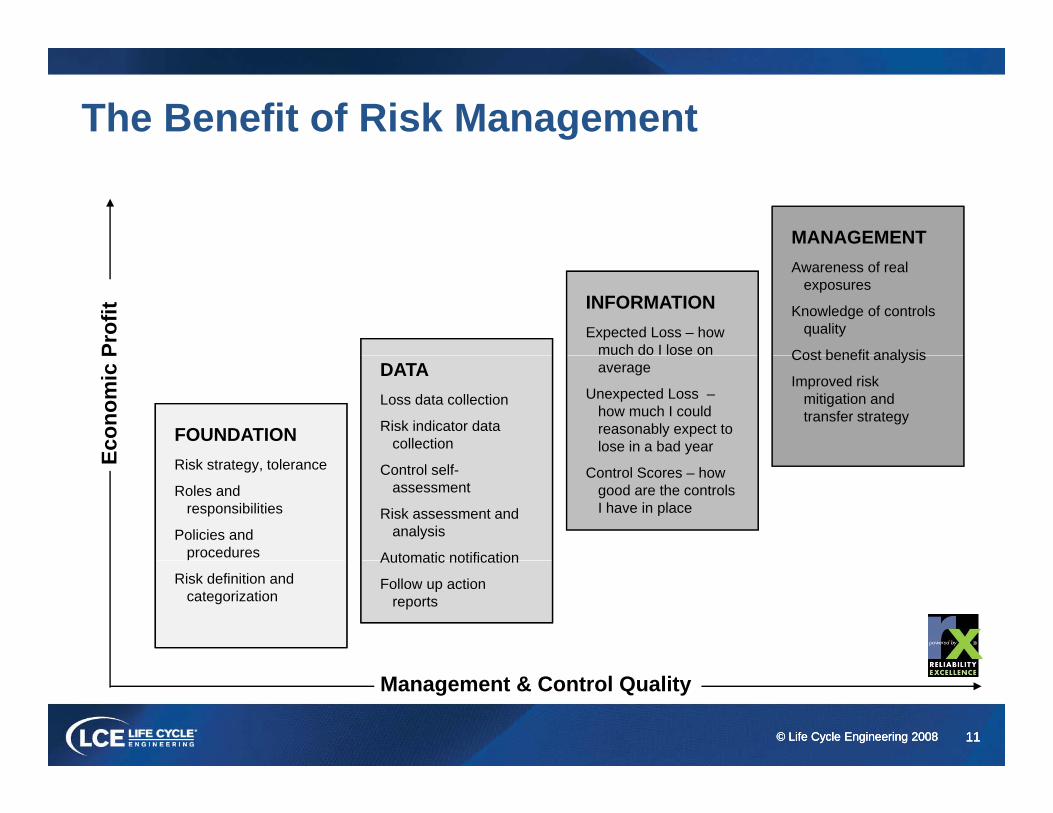
The Benefit of Risk Management
MANAGEMENT
INFORMATIONExpected Loss – how
much do I lose on
Awareness of real exposures
Knowledge of controls quality
Cost benefit analysisProf
it
FOUNDATION
average
Unexpected Loss –how much I could reasonably expect to lose in a bad year
DATALoss data collection
Risk indicator data collection
Cost benefit analysis
Improved risk mitigation and transfer strategy
Econ
omic
P
Risk strategy, tolerance
Roles and responsibilities
Policies and procedures
Control Scores – how good are the controls I have in place
Control self-assessment
Risk assessment and analysis
Automatic notification
E
Risk definition and categorization
Automatic notification
Follow up action reports
11© Life Cycle Engineering 2008 11© Life Cycle Engineering 2008 11© Life Cycle Engineering 2008
Management & Control Quality
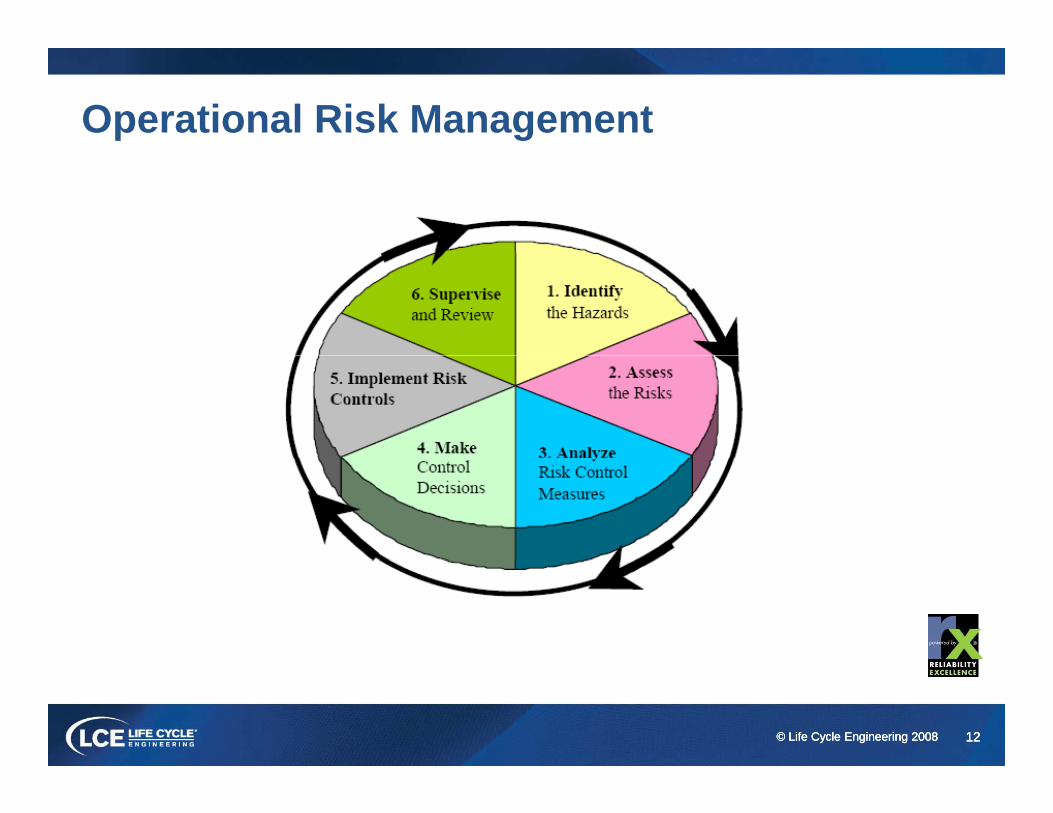
Operational Risk Management
12© Life Cycle Engineering 2008 12© Life Cycle Engineering 2008 12© Life Cycle Engineering 2008
Asset Management Plan Key Components
THE MAINTENANCE PLANAsset Management Plan Key Components
13© Life Cycle Engineering 2008 13© Life Cycle Engineering 2008 13© Life Cycle Engineering 2008
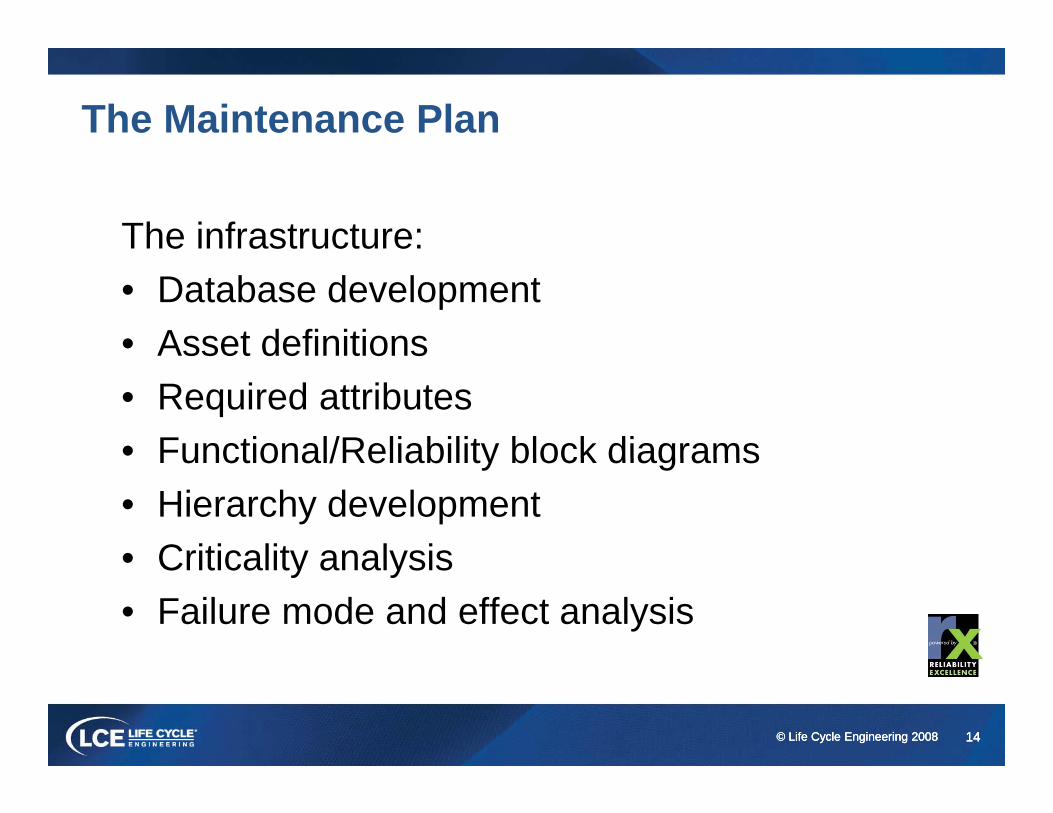
The Maintenance Plan
The infrastructure:• Database development• Asset definitionsAsset definitions• Required attributes• Functional/Reliability block diagramsFunctional/Reliability block diagrams• Hierarchy development• Criticality analysis• Criticality analysis• Failure mode and effect analysis
14© Life Cycle Engineering 2008 14© Life Cycle Engineering 2008 14© Life Cycle Engineering 2008
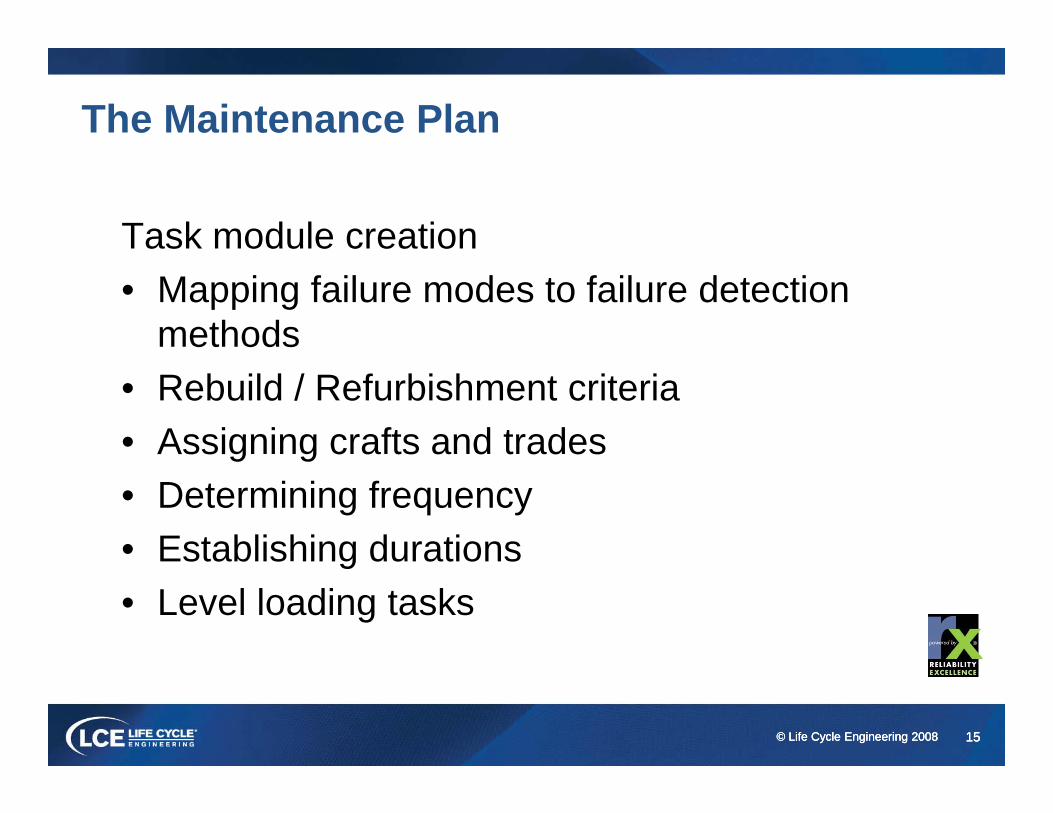
The Maintenance Plan
Task module creation• Mapping failure modes to failure detection
methods• Rebuild / Refurbishment criteria• Assigning crafts and tradesg g• Determining frequency• Establishing durationsEstablishing durations• Level loading tasks
15© Life Cycle Engineering 2008 15© Life Cycle Engineering 2008 15© Life Cycle Engineering 2008
Example of a Task Module
FACILITATOR ACTIVITYExample of a Task Module
16© Life Cycle Engineering 2008 16© Life Cycle Engineering 2008 16© Life Cycle Engineering 2008
17© Life Cycle Engineering 2008 17© Life Cycle Engineering 2008 17© Life Cycle Engineering 2008
The Maintenance Plan
Developing preventive maintenance tasksp g p• Failure based• Comprehensive procedureComprehensive procedure• Organized structure• Repeatable resultsRepeatable results• Acceptance criteria
18© Life Cycle Engineering 2008 18© Life Cycle Engineering 2008 18© Life Cycle Engineering 2008
The Maintenance Plan
Predictive technologies – The Big 5g g• Thermography• Oil analysisOil analysis• Ultrasonic analysis• Vibration analysisVibration analysis• Motor analysis
19© Life Cycle Engineering 2008 19© Life Cycle Engineering 2008 19© Life Cycle Engineering 2008
The Maintenance Plan
MRO supportpp• Developing bill of materials• Determining critical spare part thresholdsDetermining critical spare part thresholdsContinuous improvement• Value metricsValue metrics• Feedback process
20© Life Cycle Engineering 2008 20© Life Cycle Engineering 2008 20© Life Cycle Engineering 2008
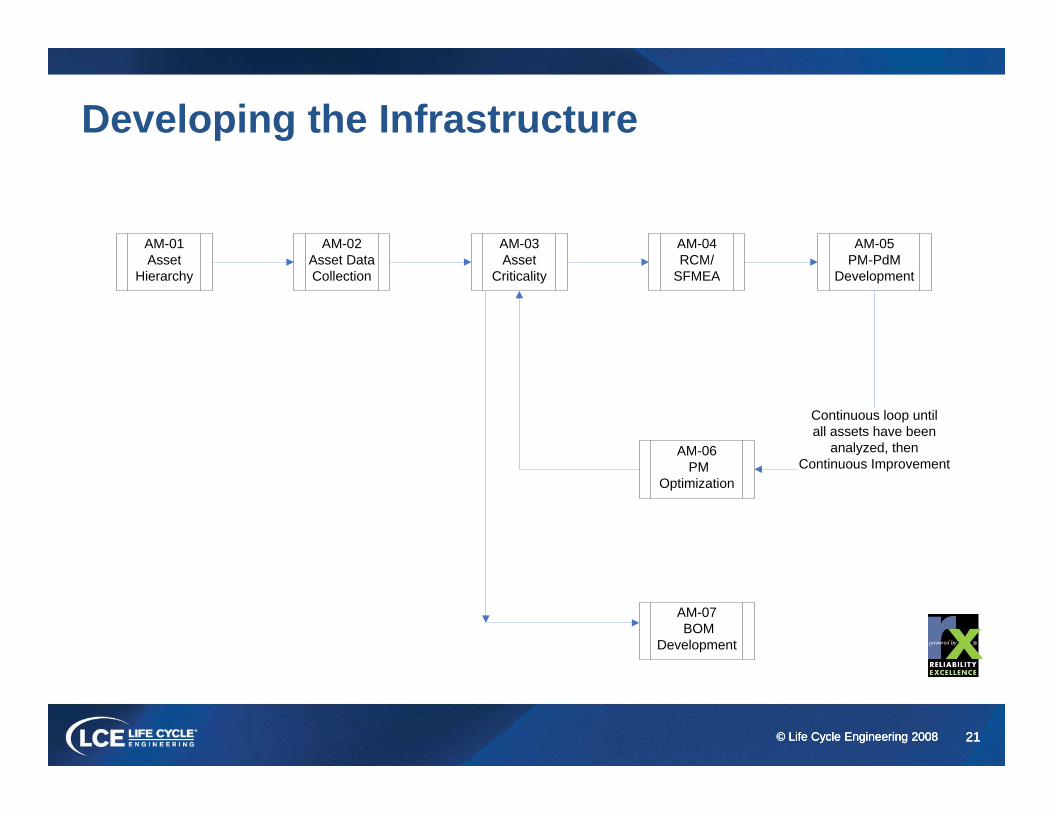
Developing the Infrastructure
AM-02AM-01 AM-03 AM-04 AM-05Asset Data Collection
Asset Hierarchy
Asset Criticality
RCM/SFMEA
PM-PdM Development
AM-06
Continuous loop until all assets have been
analyzed, then PM
OptimizationContinuous Improvement
AM-07 BOM
Development
21© Life Cycle Engineering 2008 21© Life Cycle Engineering 2008 21© Life Cycle Engineering 2008
Block Diagrams
The precursor to developing a functional p p ghierarchy and a maintenance strategy is the functional and reliability block diagrams
22© Life Cycle Engineering 2008 22© Life Cycle Engineering 2008 22© Life Cycle Engineering 2008
Block Diagrams
• Functional and reliability block diagrams illustrate the operation interrelationships andillustrate the operation, interrelationships, and interdependencies of functional entities.
• More than one block diagram will usually be• More than one block diagram will usually be required to display alternative modes of operation, depending upon the definition p , p g pestablished for the system.
23© Life Cycle Engineering 2008 23© Life Cycle Engineering 2008 23© Life Cycle Engineering 2008
Functional Block Diagram
• The primary purpose of the functional block diagram (FDB) is to ensure that the REdiagram (FDB) is to ensure that the RE determines all of the functions provided by and within the asset and/or system so that functional yfailures can be determined and analyzed.
• Includes:– major system components– interfaces to distributive systems
interfaces between subsystems– interfaces between subsystems– power, data, and structural interfaces
24© Life Cycle Engineering 2008 24© Life Cycle Engineering 2008 24© Life Cycle Engineering 2008
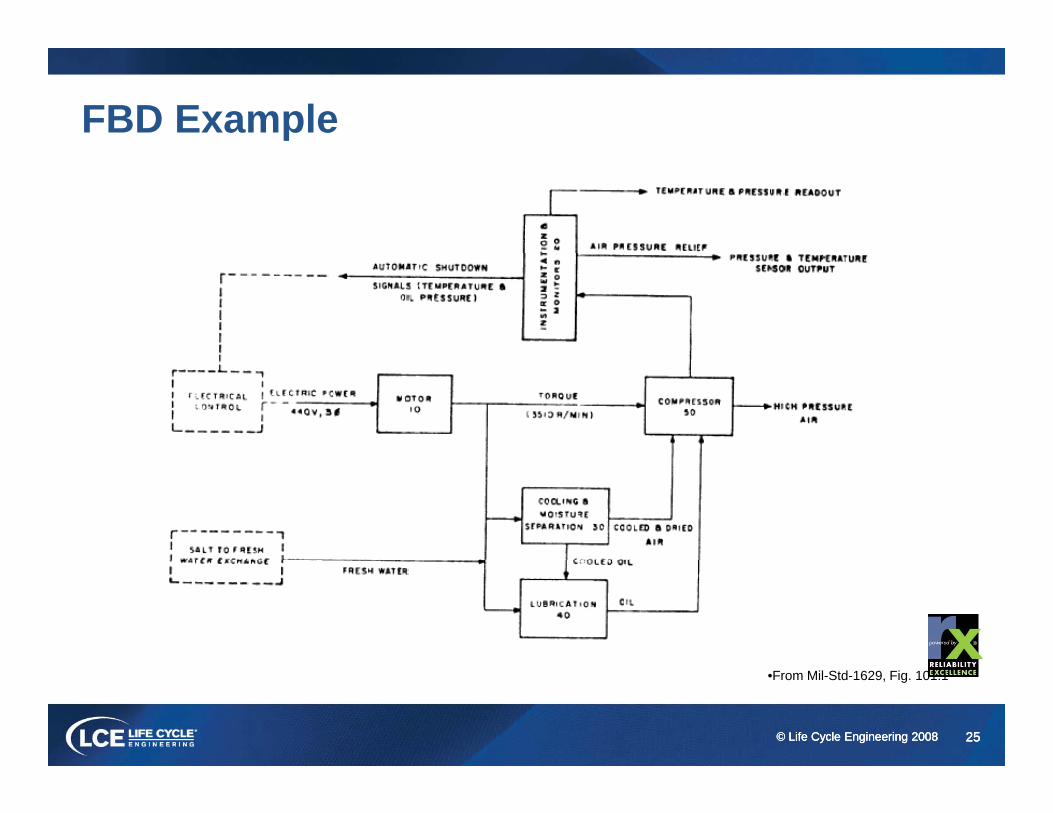
FBD Example
25© Life Cycle Engineering 2008 25© Life Cycle Engineering 2008 25© Life Cycle Engineering 2008
•From Mil-Std-1629, Fig. 101.1
Functional Block Diagram Development
FACILITATOR ACTIVITYFunctional Block Diagram Development
26© Life Cycle Engineering 2008 26© Life Cycle Engineering 2008 26© Life Cycle Engineering 2008

27© Life Cycle Engineering 2008 27© Life Cycle Engineering 2008 27© Life Cycle Engineering 2008
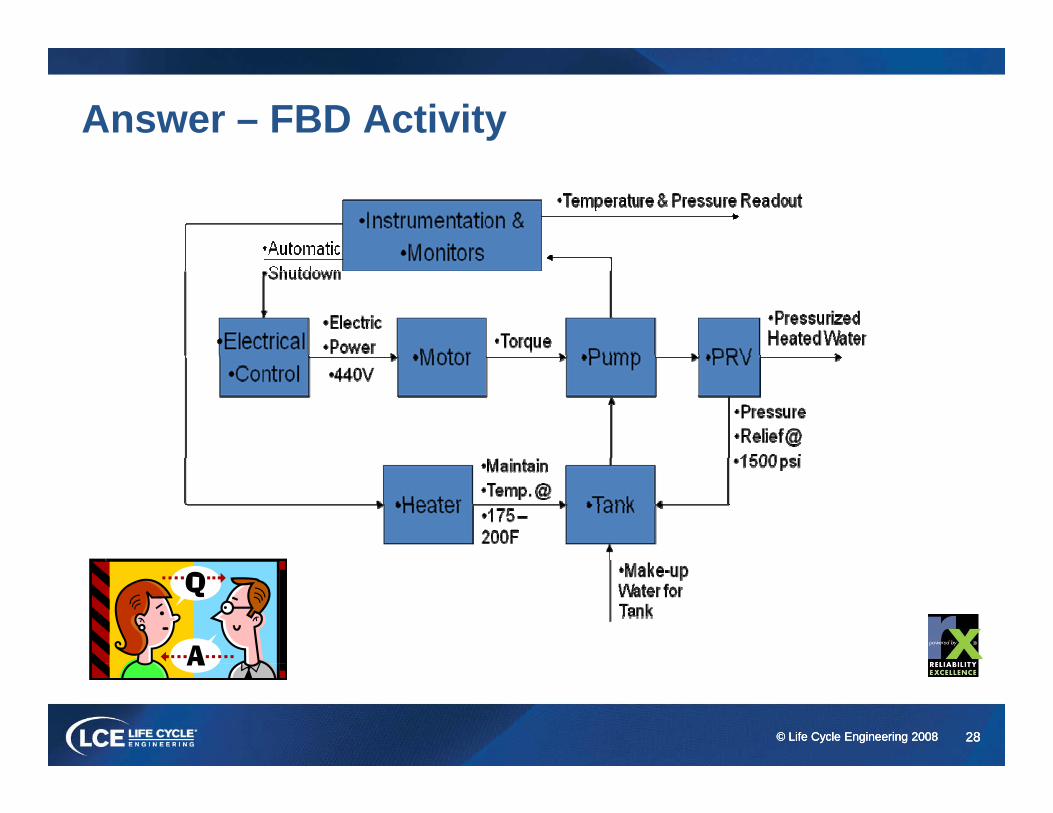
Answer – FBD Activity
28© Life Cycle Engineering 2008 28© Life Cycle Engineering 2008 28© Life Cycle Engineering 2008
Reliability Block Diagram
• The primary purpose of the reliability block p y p p ydiagram (RBD) is to allow asset and/or system reliability and availability analyses using block diagrams to show network relationships.
• The structure of the reliability block diagram d fi th l i l i t ti f f il ithidefines the logical interaction of failures within a system that are required to sustain system operationoperation.
29© Life Cycle Engineering 2008 29© Life Cycle Engineering 2008 29© Life Cycle Engineering 2008
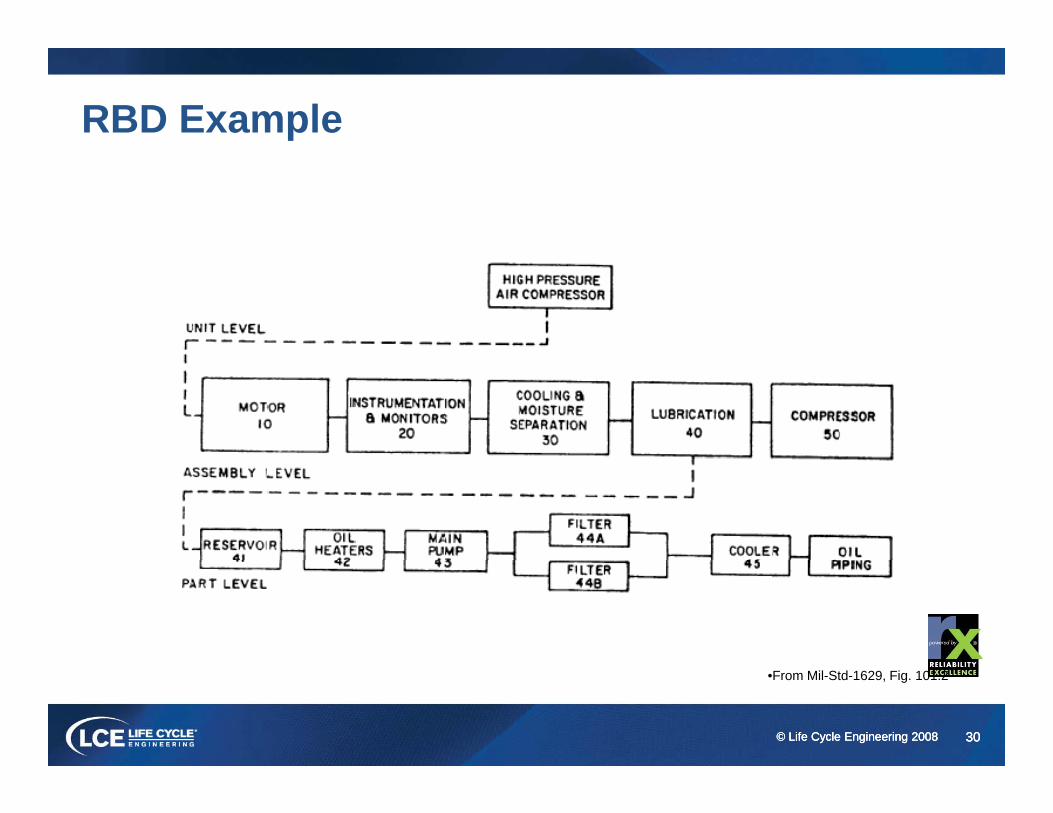
RBD Example
30© Life Cycle Engineering 2008 30© Life Cycle Engineering 2008 30© Life Cycle Engineering 2008
•From Mil-Std-1629, Fig. 101.2
Reliability Block Diagram Development
FACILITATOR ACTIVITY
Reliability Block Diagram Development
FACILITATOR ACTIVITY
31© Life Cycle Engineering 2008 31© Life Cycle Engineering 2008 31© Life Cycle Engineering 2008
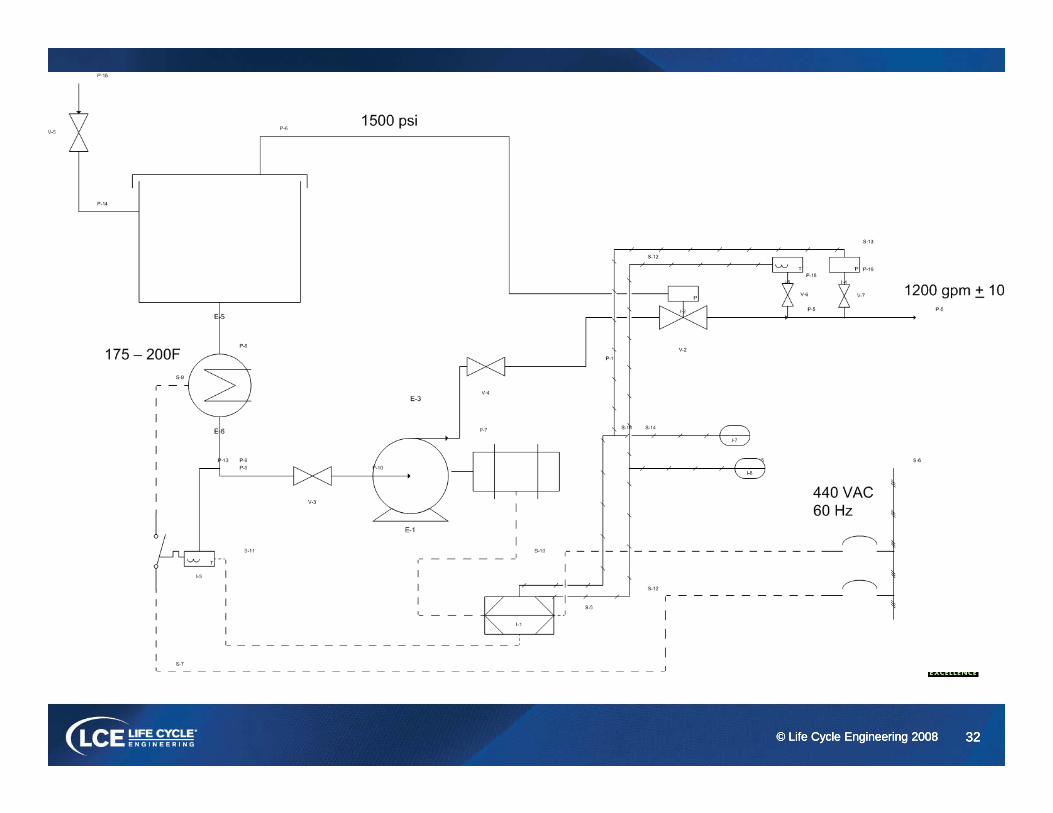
32© Life Cycle Engineering 2008 32© Life Cycle Engineering 2008 32© Life Cycle Engineering 2008
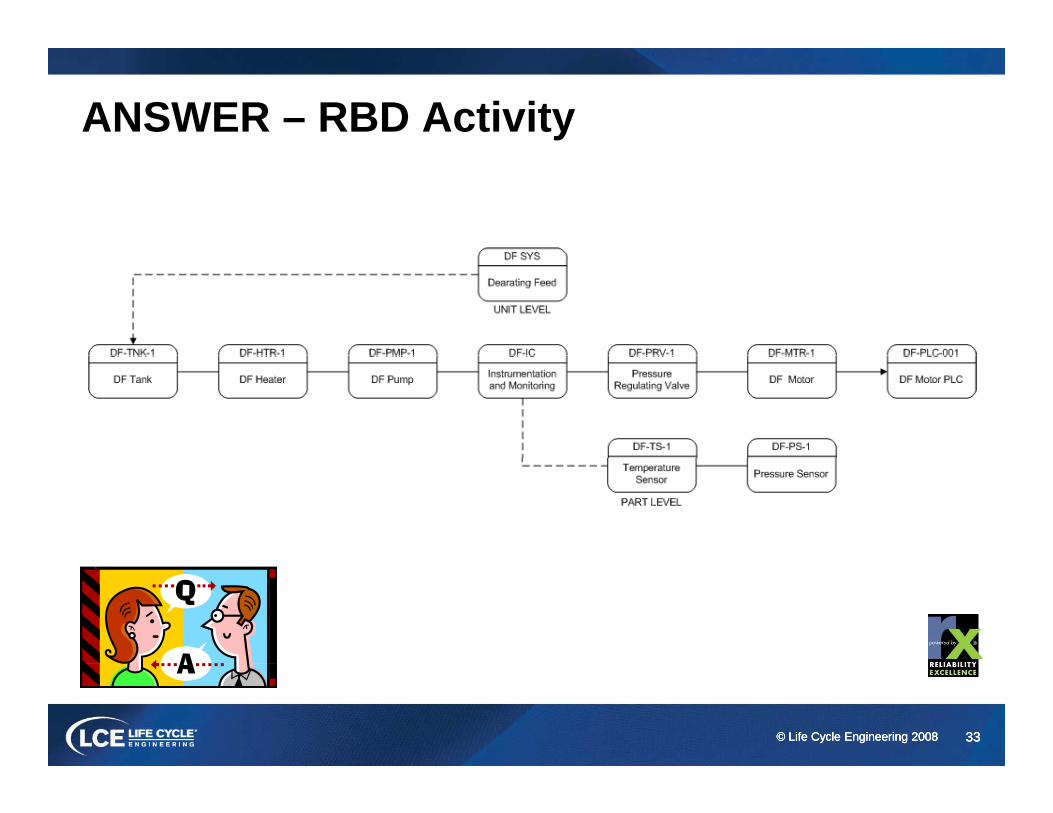
ANSWER – RBD Activity
33© Life Cycle Engineering 2008 33© Life Cycle Engineering 2008 33© Life Cycle Engineering 2008
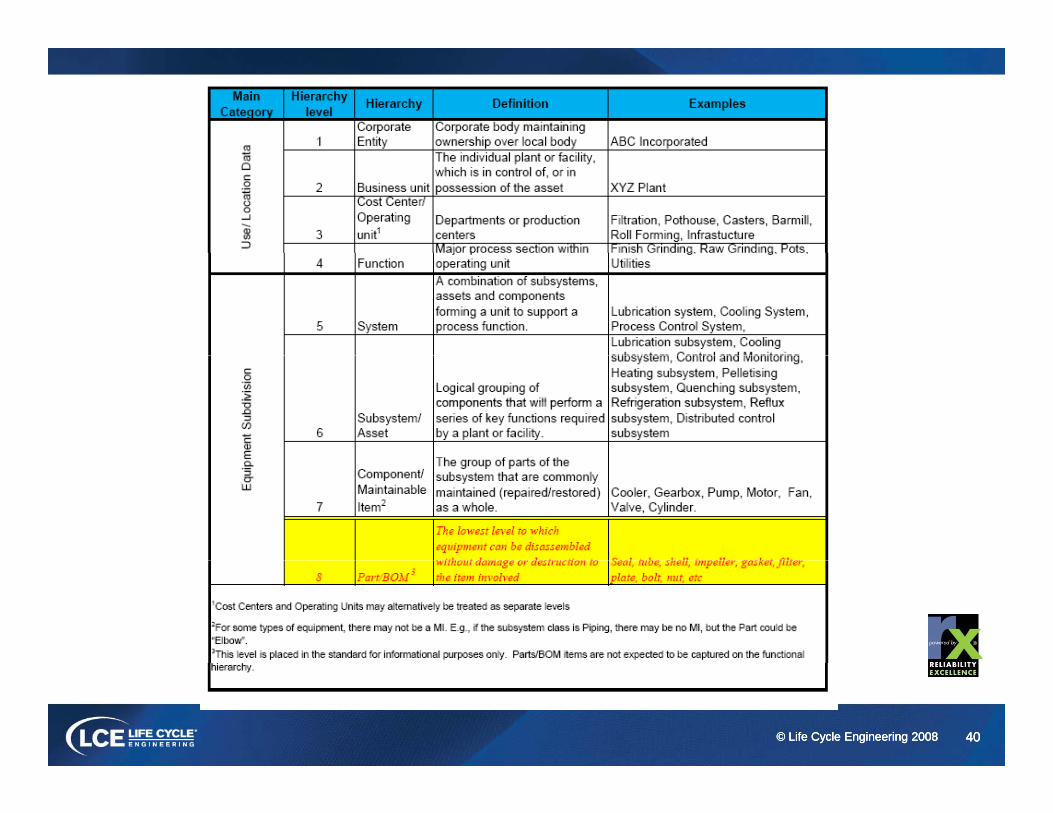
Hierarchy Development
Hierarchy is the systematic classification of y yitems into generic groups based on factors possibly common to several of the items ( )(location, use, equipment subdivision etc) in a parent – child relationship
34© Life Cycle Engineering 2008 34© Life Cycle Engineering 2008 34© Life Cycle Engineering 2008
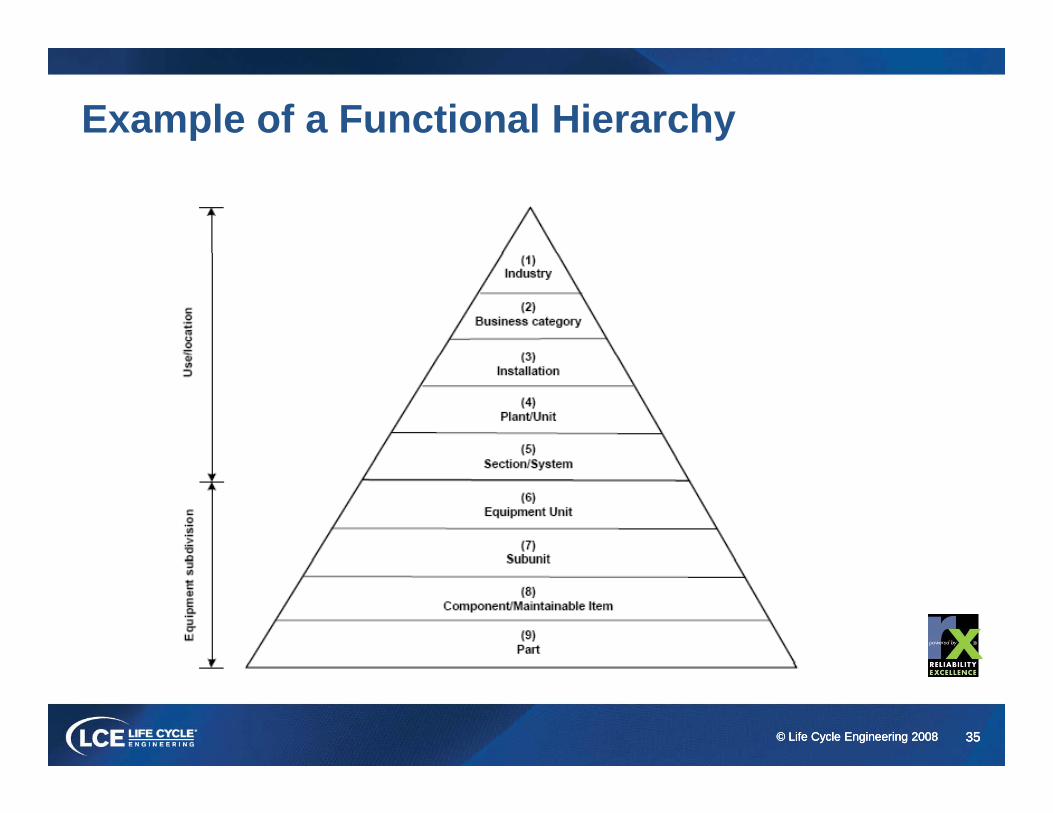
Example of a Functional Hierarchy
35© Life Cycle Engineering 2008 35© Life Cycle Engineering 2008 35© Life Cycle Engineering 2008
Create Functional Hierarchy
PARTICIPANT ACTIVITYCreate Functional Hierarchy
36© Life Cycle Engineering 2008 36© Life Cycle Engineering 2008 36© Life Cycle Engineering 2008
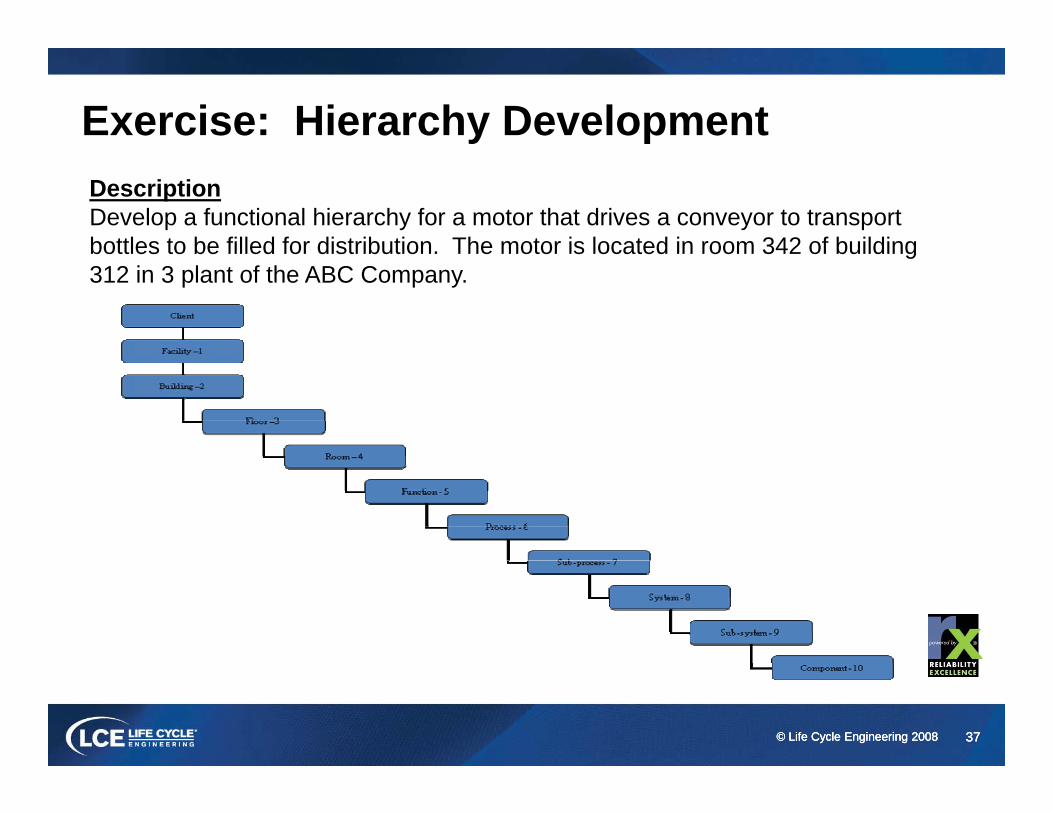
Exercise: Hierarchy DevelopmentDescriptionDevelop a functional hierarchy for a motor that drives a conveyor to transport bottles to be filled for distribution. The motor is located in room 342 of buildingbottles to be filled for distribution. The motor is located in room 342 of building 312 in 3 plant of the ABC Company.
37© Life Cycle Engineering 2008 37© Life Cycle Engineering 2008 37© Life Cycle Engineering 2008
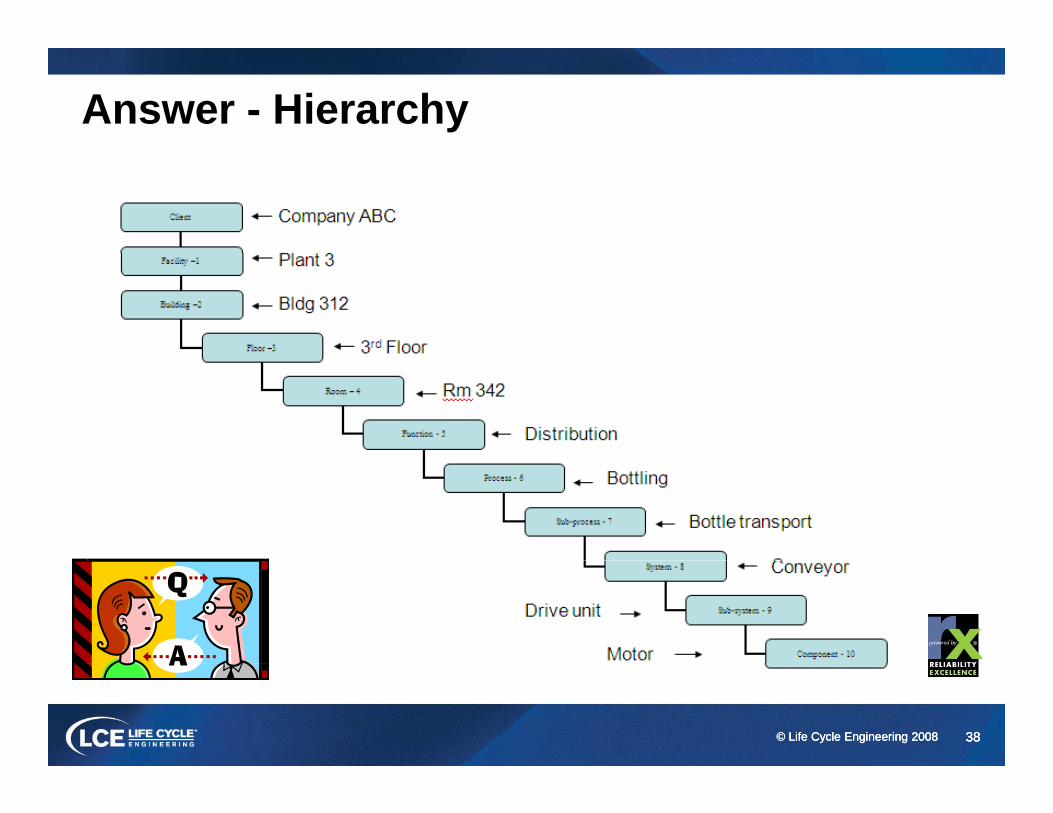
Answer - Hierarchy
38© Life Cycle Engineering 2008 38© Life Cycle Engineering 2008 38© Life Cycle Engineering 2008
Hand out LCE Hierarchy Guidelines
FACILITATOR ACTIVITYHand out LCE Hierarchy Guidelines
39© Life Cycle Engineering 2008 39© Life Cycle Engineering 2008 39© Life Cycle Engineering 2008
40© Life Cycle Engineering 2008 40© Life Cycle Engineering 2008 40© Life Cycle Engineering 2008
Asset Definition
Once the hierarchy is established, the level 7 y ,components are standardized into asset types and minimum attributes are assigned to support:
BOM developmentPM/PdM developmentFailure analysis
41© Life Cycle Engineering 2008 41© Life Cycle Engineering 2008 41© Life Cycle Engineering 2008
Asset Data
Detailed information such as:• Asset criticality• Nameplate dataNameplate data• Engineering specification• Property detailProperty detail• Other searchable characteristics
42© Life Cycle Engineering 2008 42© Life Cycle Engineering 2008 42© Life Cycle Engineering 2008
Criticality Analysis
Criticality is defined as a state of urgency.y g yAs a measure, it represents the severity of a
failure in relation to its consequences. qEquipment criticality is a ranking reflecting the
magnitude of the consequences resulting frommagnitude of the consequences resulting from an equipment failure.
43© Life Cycle Engineering 2008 43© Life Cycle Engineering 2008 43© Life Cycle Engineering 2008

Contributors to Criticality
The consequences usually considered are the q yimpact on:• Environment• Health• Safetyy• Production or Value Stream• ReputationReputation
44© Life Cycle Engineering 2008 44© Life Cycle Engineering 2008 44© Life Cycle Engineering 2008
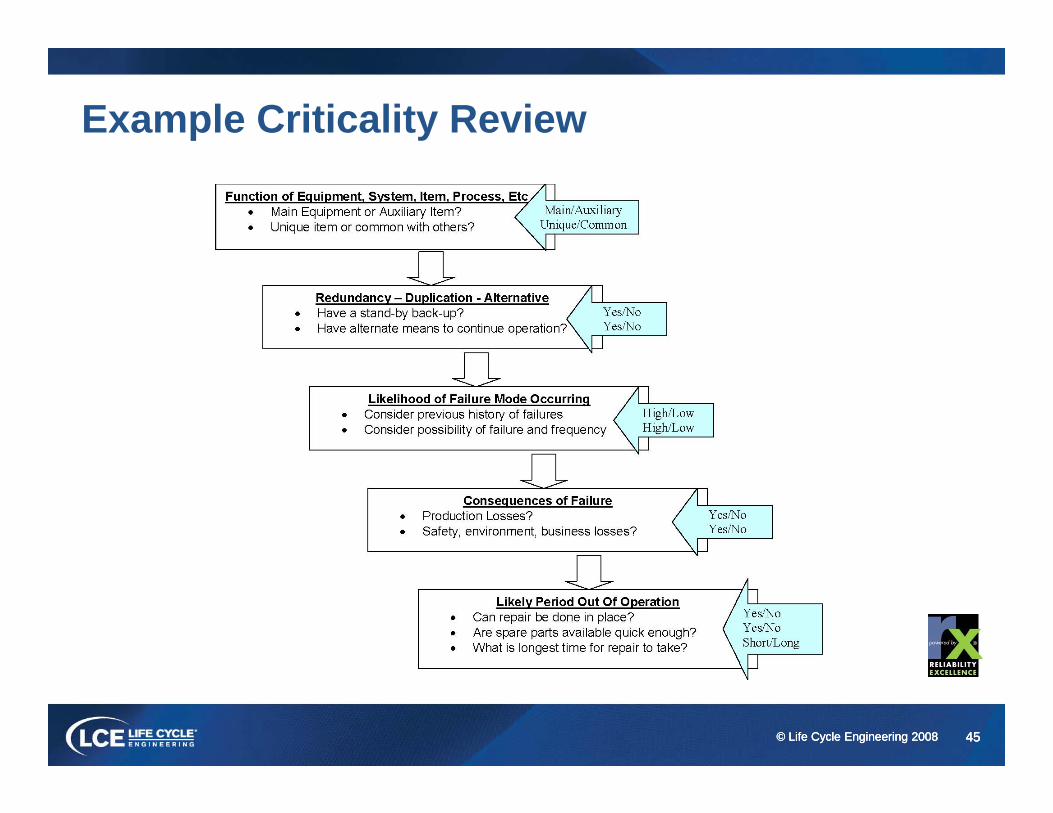
Example Criticality Review
45© Life Cycle Engineering 2008 45© Life Cycle Engineering 2008 45© Life Cycle Engineering 2008
Walk thru Asset Criticality Analysis Spread Sheet
FACILITATOR ACTIVITYWalk thru Asset Criticality Analysis Spread Sheet
46© Life Cycle Engineering 2008 46© Life Cycle Engineering 2008 46© Life Cycle Engineering 2008
ROOT CAUSE ANALYSISROOT CAUSE ANALYSIS
47© Life Cycle Engineering 2008 47© Life Cycle Engineering 2008 47© Life Cycle Engineering 2008
Terminology
Root Cause Analysis (RCA)– Logical, systematic means of resolving
problems, limiting factors or issues.Done proactively e g before a serious– Done proactively, e.g. before a serious problem or failure occurs
Root Cause Failure Analysis (RCFA)Root Cause Failure Analysis (RCFA)– Same– Done reactively, e.g. after a seriousDone reactively, e.g. after a serious
problem or failure occurs
48© Life Cycle Engineering 2008 48© Life Cycle Engineering 2008 48© Life Cycle Engineering 2008•PW4

THE RCA PROCESS
1. 2. 3.
NOTIFICATION CLARIFICATION/CLASSIFICATION
ROOT CAUSE ANALYSIS
4. 5. 6.
CORRECTIVE ACTION
EVALUATIONVERIFICATION DOCUMENATION
49© Life Cycle Engineering 2008 49© Life Cycle Engineering 2008 49© Life Cycle Engineering 2008
EVALUATION
•PW31

Simplified FMEA
• Developed by US Military and standardized by p y y yautomotive industry
• Top-down method• Based on industrial and in-plant historical data• Generally limited to major sub-systemsy j y
Can include components, but failure modes, probability of failure, etc. Based on experience, not
b bilit t blprobability tables
50© Life Cycle Engineering 2008 50© Life Cycle Engineering 2008 50© Life Cycle Engineering 2008
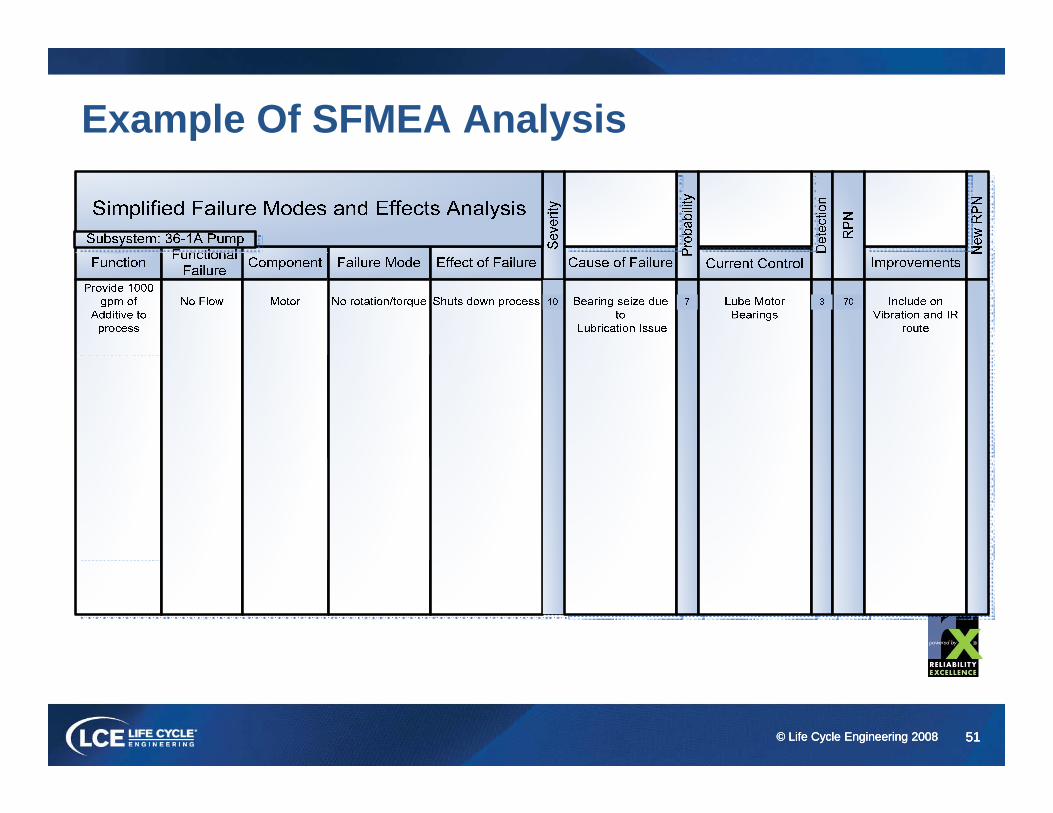
Example Of SFMEA Analysis
51© Life Cycle Engineering 2008 51© Life Cycle Engineering 2008 51© Life Cycle Engineering 2008
Terms
Occurrence ranking:gA subjective estimate of the likelihood that if a
defective part is installed it will cause the failure mode
A subjective estimate of the probability that a failure mode will occur
52© Life Cycle Engineering 2008 52© Life Cycle Engineering 2008 52© Life Cycle Engineering 2008
Terms
Detection ranking:gA subjective estimate of the probability that a
cause of a potential failure will be detected and corrected before reaching the end user
A subjective estimate of the probability that a cause of a potential failure will be detected and corrected before a failure can occur
53© Life Cycle Engineering 2008 53© Life Cycle Engineering 2008 53© Life Cycle Engineering 2008
Terms
Risk Priority Number (RPN):y ( )The product of severity, occurrence, and
detection rankingsSeverity x Occurrence x Detection = RPNSometime divided by 30 to give you a 100 y g y
scale
54© Life Cycle Engineering 2008 54© Life Cycle Engineering 2008 54© Life Cycle Engineering 2008•PW72
Uses of SFMEA
Root-cause failure analysisMethodology for understanding potential forcing functions thatMethodology for understanding potential forcing functions that
caused problem
Drives preventive maintenance programp p gIdentified forcing functions and failure modes determine the
specific PM inspections that should be done to preserve the asset and prevent failuresp
Drives Asset (Equipment) management programDetermines the fundamental requirements, e.g. operations and
maintenance, for the asset
Drives asset utilization plan
55© Life Cycle Engineering 2008 55© Life Cycle Engineering 2008 55© Life Cycle Engineering 2008
Drives asset utilization plan
Uses of SFMEA
Drives modifications and upgradespgMany of the identified forcing functions and failure modes can be eliminated by specific y pmodifications or changes in design
Drives Standard Work Practices (SWP)Drives Standard Work Practices (SWP) upgradesForcing functions or failures caused by setupForcing functions or failures caused by setup or operating methods can be eliminated
56© Life Cycle Engineering 2008 56© Life Cycle Engineering 2008 56© Life Cycle Engineering 2008
Reliability Engineering SFMEA
Engineer must understand the machine or gproduction systemMachine or operating dynamics
Inherent design strengths and limitations
Failure modes of components, sub-assemblies and p ,systems
Requires homework and self-study to gain this q y gknowledge
57© Life Cycle Engineering 2008 57© Life Cycle Engineering 2008 57© Life Cycle Engineering 2008
Reliability Engineering SFMEA
Must be driven or supported by datapp yFocus Team SFMEA relies exclusively on “native
knowledge”Engineering SFMEA also uses, but all three criteria
must be verified using existing historical dataLevel of detail must be as good as can beLevel of detail must be as good as can be
accomplishedFocus Team uses 80-20 ruleFocus Team uses 80 20 ruleEngineering must strive for at least 90-10
58© Life Cycle Engineering 2008 58© Life Cycle Engineering 2008 58© Life Cycle Engineering 2008
Centrifugal PumpO ti i t• Operating requirements:– Flow 100 GPM+/-10– Temp 175-200 F– Pressure 58 +/-5 PSI– Must contain product
PARTICIPANT ACTIVITYDevelop Pump SFMEA
PARTICIPANT ACTIVITY
59© Life Cycle Engineering 2008 59© Life Cycle Engineering 2008 59© Life Cycle Engineering 2008
Cause-and-Effect Analysis
• Graphical approach to failure analysis (I h k Di )(Ishakawa Diagram)
• Also called Fishbone or 4M Analysisbecause of graphic pattern andbecause of graphic pattern and classifications
60© Life Cycle Engineering 2008 60© Life Cycle Engineering 2008 60© Life Cycle Engineering 2008
Cause-and-Effect Analysis
• Plots relationship between various factors that contribute to specific event
• Factors are grouped in sub-classifications to facilitate analysis
61© Life Cycle Engineering 2008 61© Life Cycle Engineering 2008 61© Life Cycle Engineering 2008
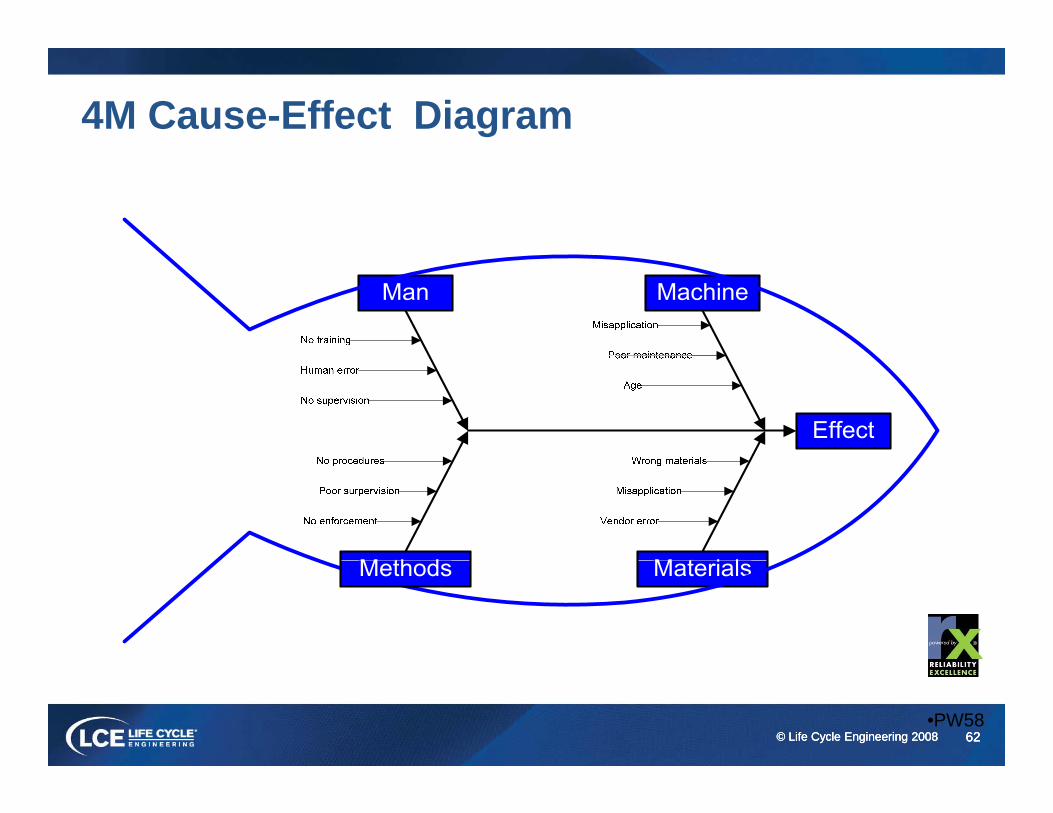
4M Cause-Effect Diagram
62© Life Cycle Engineering 2008 62© Life Cycle Engineering 2008 62© Life Cycle Engineering 2008•PW58
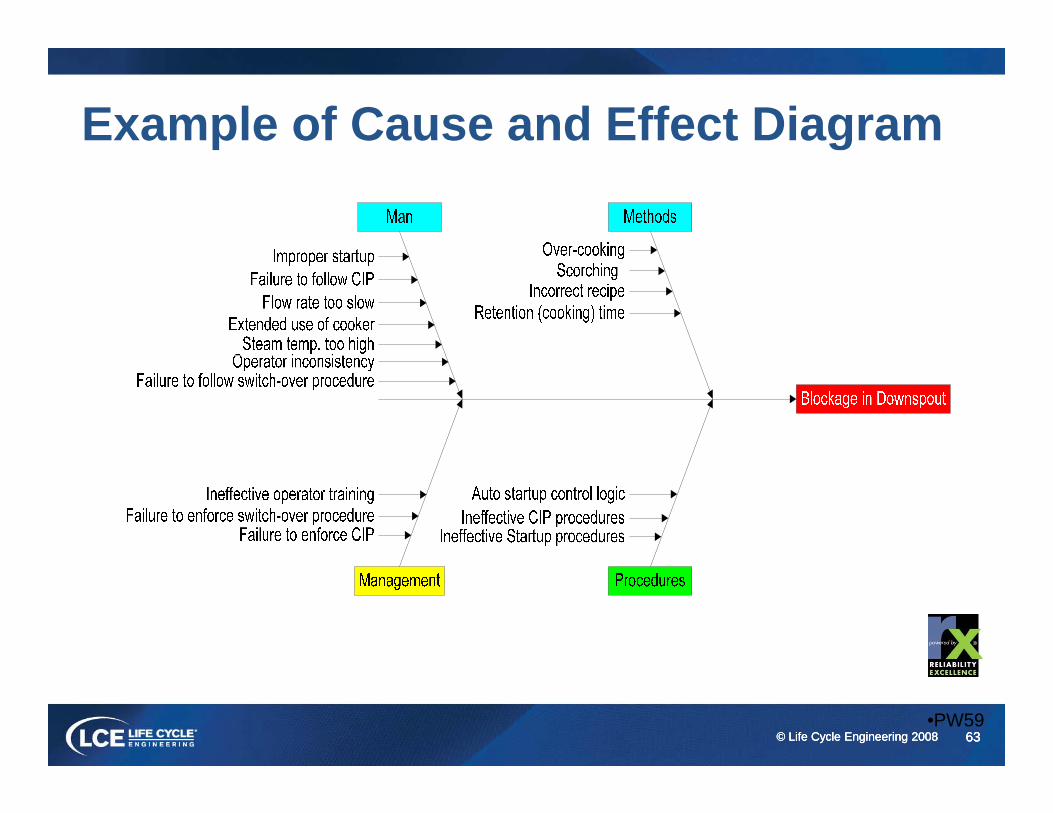
Example of Cause and Effect Diagram
63© Life Cycle Engineering 2008 63© Life Cycle Engineering 2008 63© Life Cycle Engineering 2008•PW59
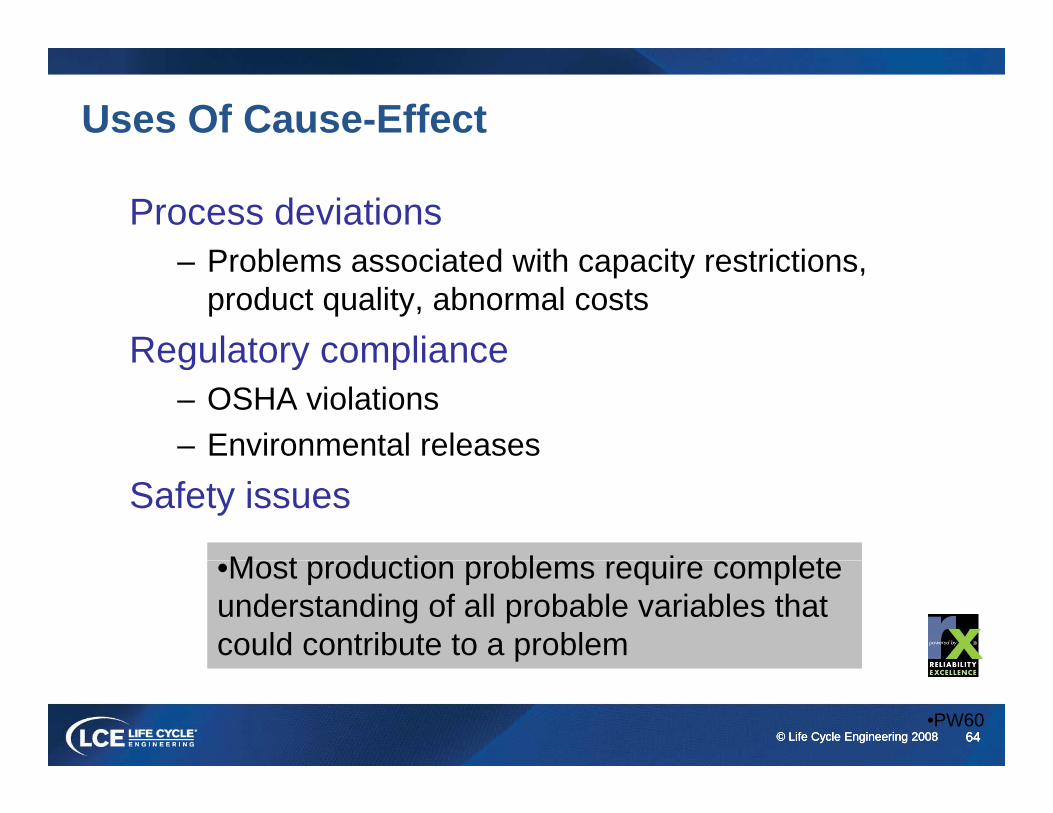
Uses Of Cause-Effect
Process deviationsP bl i t d ith it t i ti– Problems associated with capacity restrictions, product quality, abnormal costs
Regulatory complianceRegulatory compliance– OSHA violations– Environmental releases
Safety issues
M t d ti bl i l tM t d ti bl i l t•Most production problems require complete understanding of all probable variables that could contribute to a problem
•Most production problems require complete understanding of all probable variables that could contribute to a problem
64© Life Cycle Engineering 2008 64© Life Cycle Engineering 2008 64© Life Cycle Engineering 2008•PW60
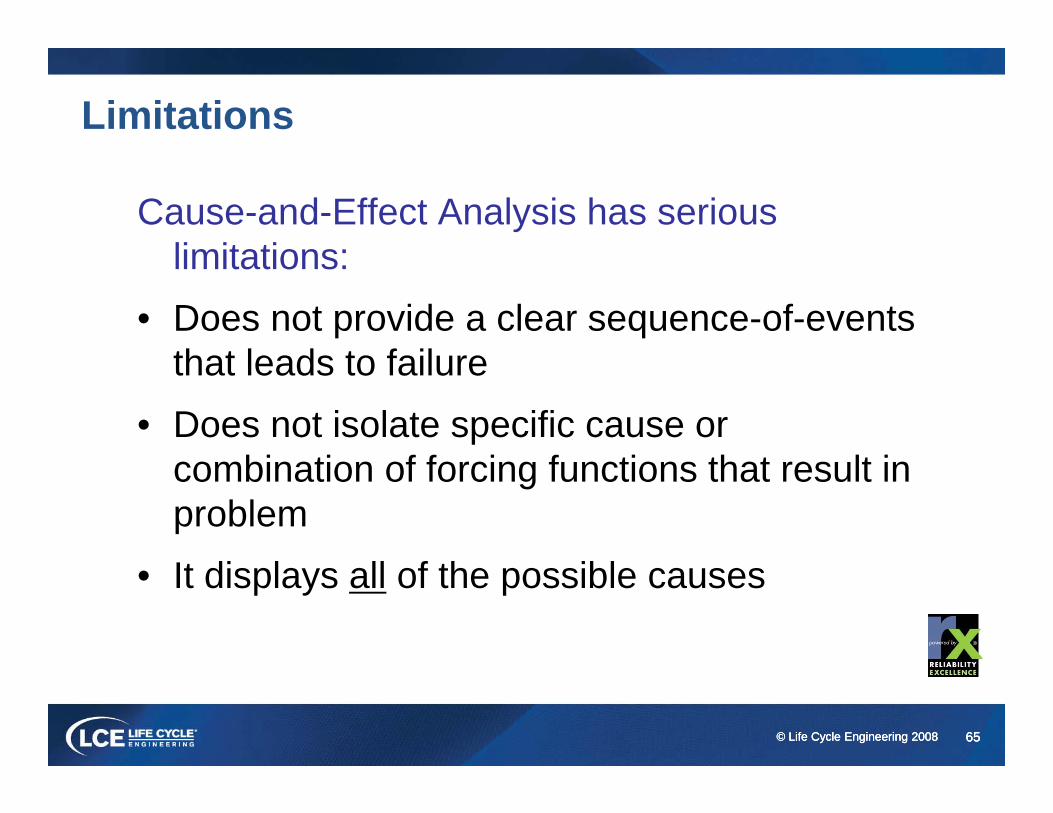
Limitations
Cause-and-Effect Analysis has serious limitations:limitations:
• Does not provide a clear sequence-of-events th t l d t f ilthat leads to failure
• Does not isolate specific cause or bi ti f f i f ti th t lt icombination of forcing functions that result in
problem• It displays all of the possible causes
65© Life Cycle Engineering 2008 65© Life Cycle Engineering 2008 65© Life Cycle Engineering 2008
Cause and Effect Exercise
Problem: A customer at your restaurant just complained that he was served a bad tasting cup of coffee. He asked for another cup and said the coffee was just as bad as the first cup he was servedas bad as the first cup he was served.
What are the possible causes?
66© Life Cycle Engineering 2008 66© Life Cycle Engineering 2008 66© Life Cycle Engineering 2008

Cause & Effect Analysis – Fishbone DiDiagram
Problem or “Effect”
Step 1 Identify the problem during one of your team’s brainstorming sessions. Draw a box around the problem. This is called the “effect”.
Bad Tasting Coffeep Coffee
Bad Step 2Draw a long process arrow leading into the box. This arrow represents the direction of influence.
Tasting Coffee
67© Life Cycle Engineering 2008 67© Life Cycle Engineering 2008 67© Life Cycle Engineering 2008PW55
Cause & Effect Analysis – Fishbone Di ( t )
St 3 D id th j t i f G ft t t b
Diagram (cont.)
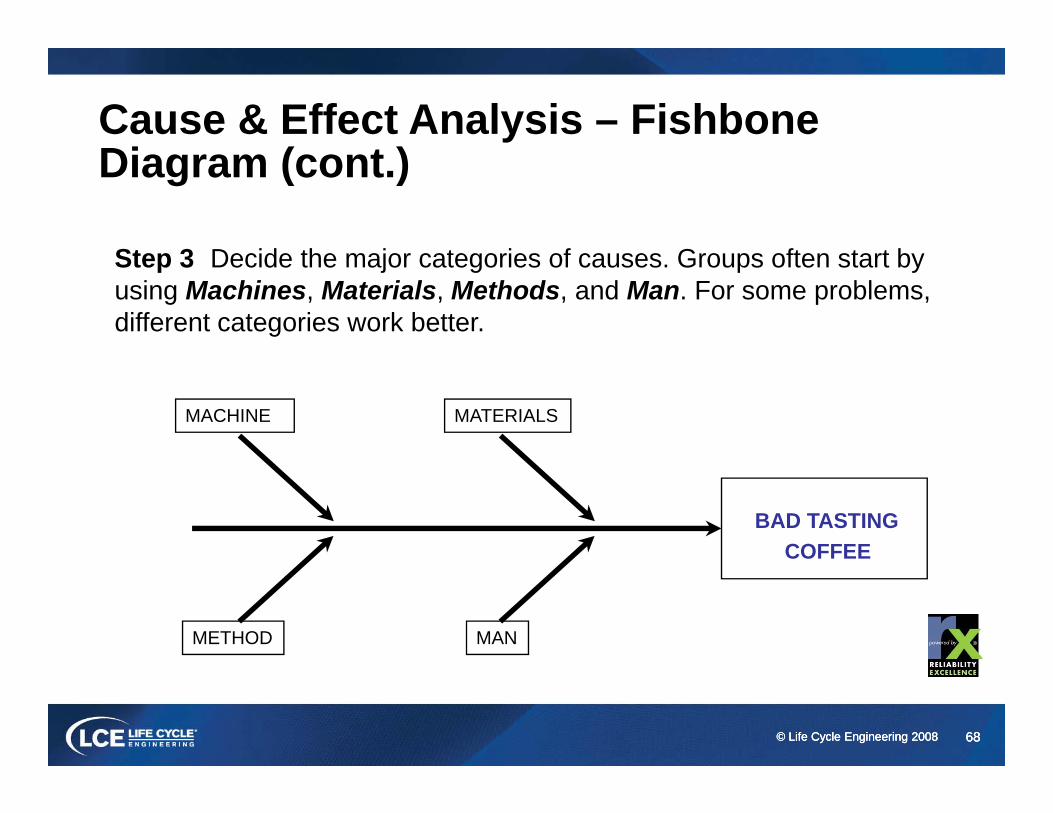
Step 3 Decide the major categories of causes. Groups often start by using Machines, Materials, Methods, and Man. For some problems, different categories work better.
MACHINE MATERIALS
BAD TASTINGCOFFEE
METHOD MAN
68© Life Cycle Engineering 2008 68© Life Cycle Engineering 2008 68© Life Cycle Engineering 2008
Cause & Effect Analysis – Fishbone Diagram (cont )
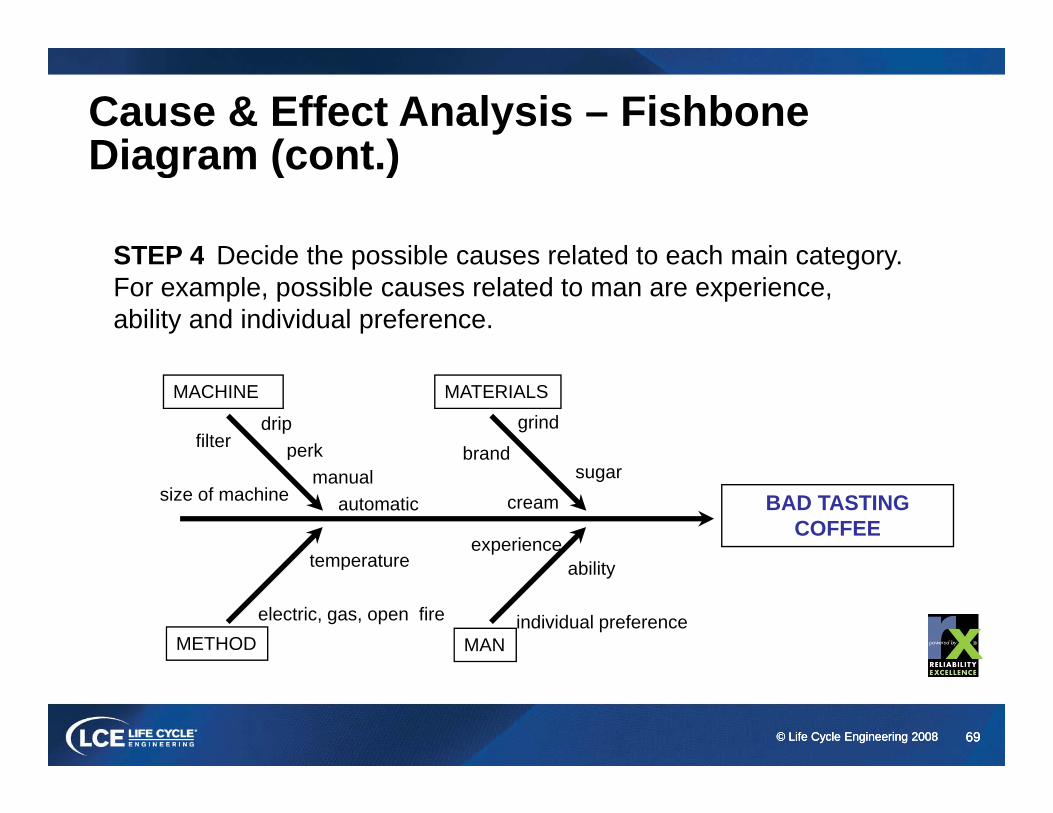
STEP 4 Decide the possible causes related to each main category
Diagram (cont.)
STEP 4 Decide the possible causes related to each main category. For example, possible causes related to man are experience, ability and individual preference.
MACHINE MATERIALS
dripperkfilter
grind
brandpmanual
automaticsize of machinesugar
cream
temperatureexperience
BAD TASTING COFFEE
brand
METHOD MAN
temperature
electric, gas, open fire
ability
individual preference
69© Life Cycle Engineering 2008 69© Life Cycle Engineering 2008 69© Life Cycle Engineering 2008
Cause & Effect Analysis – Fishbone Diagram (cont )Diagram (cont.)
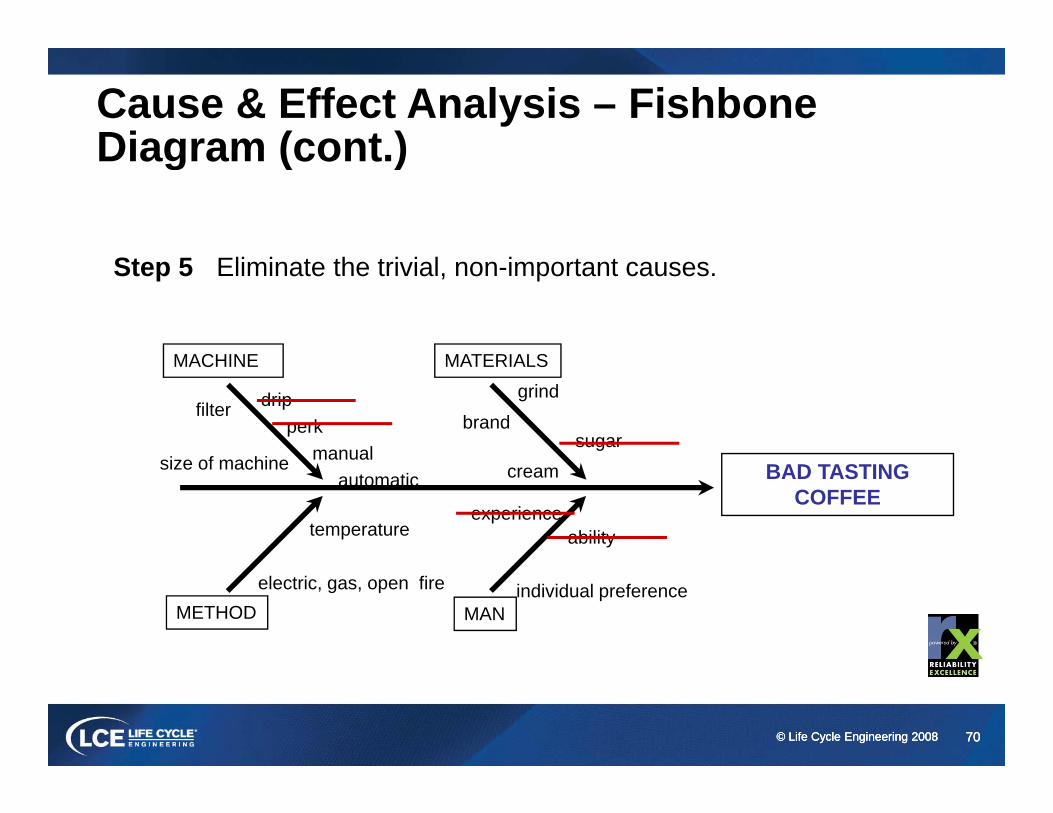
Step 5 Eliminate the trivial, non-important causes.
MACHINE MATERIALSMACHINE MATERIALS
dripperk
manual
filter
i f hisugar
grind
brand
manualautomatic
size of machine cream
temperatureexperience
ability
BAD TASTING COFFEE
METHOD MANelectric, gas, open fire individual preference
70© Life Cycle Engineering 2008 70© Life Cycle Engineering 2008 70© Life Cycle Engineering 2008
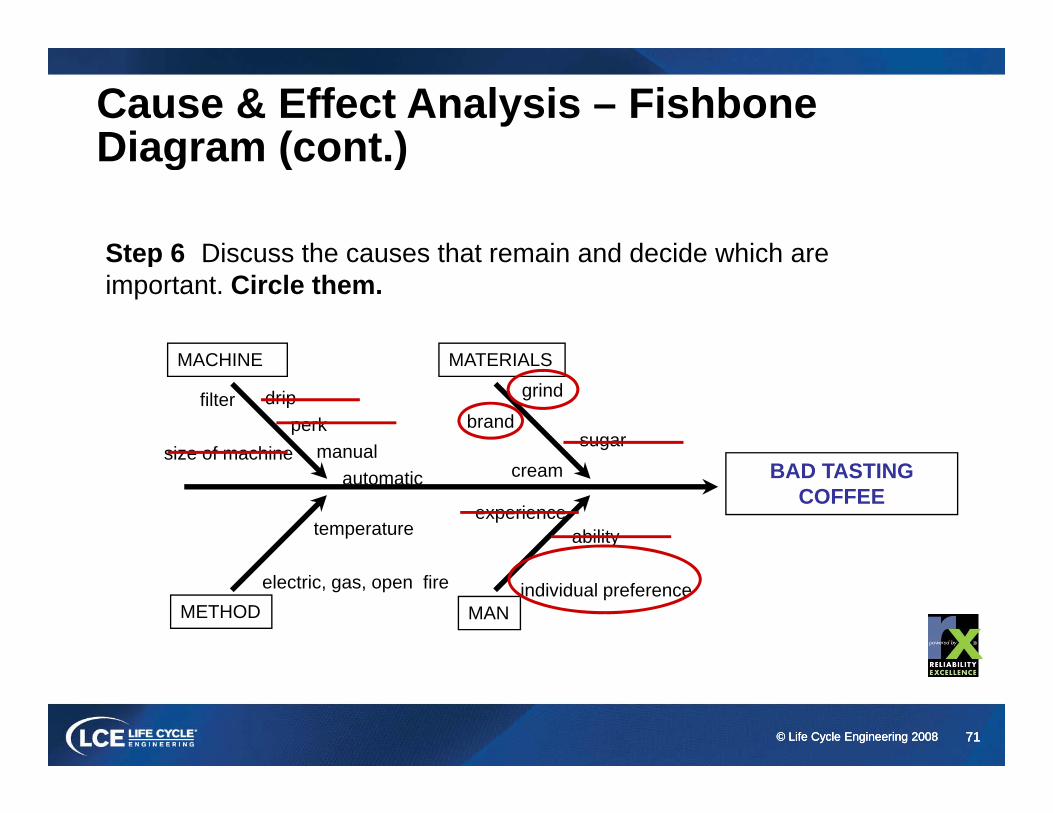
Cause & Effect Analysis – Fishbone Diagram (cont )Diagram (cont.)
Step 6 Discuss the causes that remain and decide which areStep 6 Discuss the causes that remain and decide which are important. Circle them.
MACHINE MATERIALSMACHINE MATERIALS
dripperk
manual
filter
size of machinesugar
grind
brand
automaticsize of machine
cream
temperatureexperience
ability
BAD TASTING COFFEE
METHOD MANelectric, gas, open fire individual preference
71© Life Cycle Engineering 2008 71© Life Cycle Engineering 2008 71© Life Cycle Engineering 2008
Questions?Questions?
72© Life Cycle Engineering 2008 72© Life Cycle Engineering 2008 72© Life Cycle Engineering 2008© Life Cycle Engineering 2008
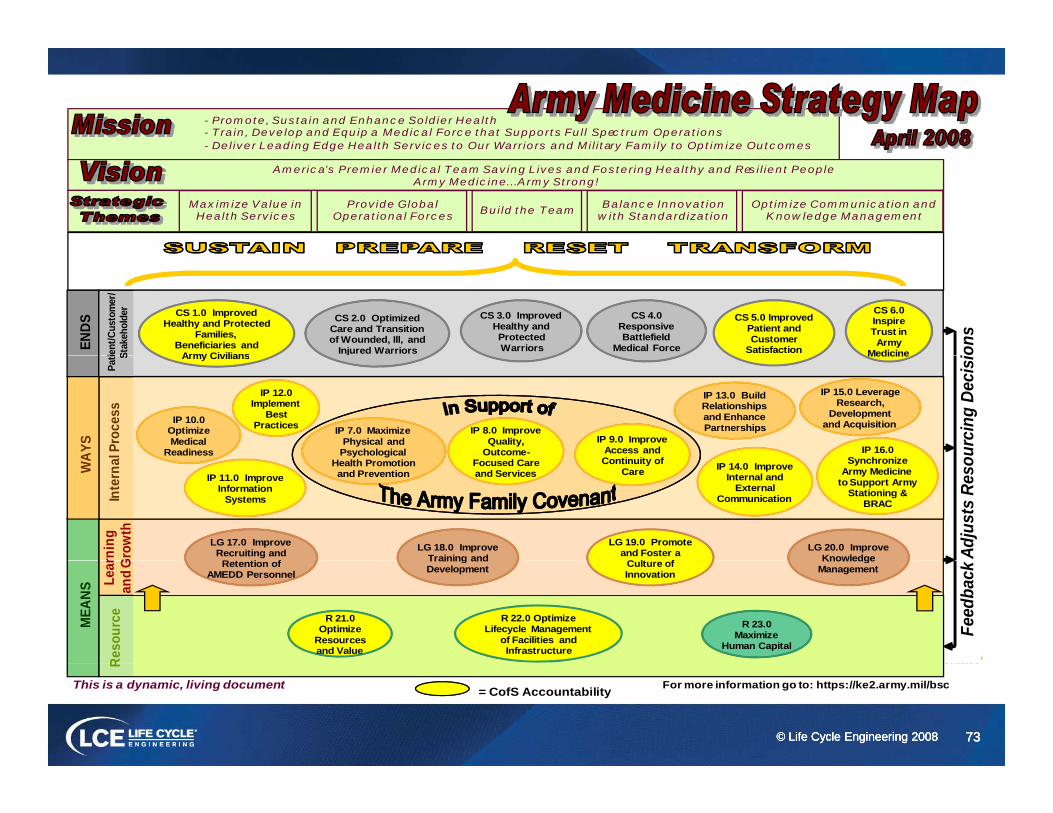
- Promote, Sustain and Enhance Soldier Health- Train, Develop and Equip a Medical Force that Supports Full Spectrum Operations - Deliver Leading Edge Health Services to Our Warriors and Military Family to Optimize Outcomesg g y y p
America’s Premier Medical Team Saving Lives and Fostering Healthy and Resilient PeopleArmy Medicine…Army Strong!
Maximize Value in Health Services
Provide Global Operational Forces Build the Team Balance Innovation
with StandardizationOptimize Communication and
Knowledge Management
ient
/Cus
tom
er/
Stak
ehol
der CS 6.0
Inspire Trust in Army
Medicine
CS 4.0 Responsive Battlefield
Medical Force
CS 1.0 Improved Healthy and Protected
Families, Beneficiaries and
Army Civilians
CS 3.0 Improved Healthy and Protected Warriors
CS 5.0 Improved Patient and Customer
Satisfaction
CS 2.0 Optimized Care and Transition of Wounded, Ill, and
Injured Warriors ionsEN
DS
Pati S MedicineArmy Civilians
IP 10.0 Optimize Medical
Readiness
IP 13.0 Build Relationships and Enhance Partnerships
j
IP 12.0 Implement
Best Practices
l Pro
cess
ourc
ing
Deci
si
IP 8.0 Improve Quality,
Outcome-
IP 7.0 Maximize Physical and
Psychological IP 9.0 Improve
Access and C ti it f
IP 16.0 S h iAY
S
IP 15.0 Leverage Research,
Development and Acquisition
LG 18.0 Improve Training and
IP 11.0 Improve Information
Systems
IP 14.0 Improve Internal and
External Communication
LG 20.0 Improve Knowledge
LG 17.0 Improve Recruiting and
R t ti f
Inte
rna
rnin
g G
row
th
LG 19.0 Promote and Foster a
C lt f
Adju
sts
ResoFocused Care
and ServicesHealth Promotion and Prevention
Continuity of Care
Synchronize Army Medicine
to Support Army Stationing &
BRAC
WA
Training and Development
Knowledge ManagementRetention of
AMEDD PersonnelLear
and
G Culture of Innovation
Feed
back
R 21.0 Optimize
Resources and Value
R 22.0 Optimize Lifecycle Management
of Facilities and Infrastructure
R 23.0 Maximize
Human Capital
MEA
NS
Reso
urce
73© Life Cycle Engineering 2008 73© Life Cycle Engineering 2008 73© Life Cycle Engineering 2008
For more information go to: https://ke2.army.mil/bscThis is a dynamic, living document
R
= CofS Accountability