Embed Size (px)
DESCRIPTION
Phenotypic variation in body size can result from within-cohort variation inbirth dates, among-individual growth variation and size-selective processes. Weexplore the relative effects of these processes on the maintenance of wideobserved body size variation in stream-dwelling brook trout (Salvelinus fontinalis).Based on the analyses of multiple recaptures of individual fish, it appearsthat size distributions are largely determined by the maintenance of early sizevariation. We found no evidence for size-dependent compensatory growth(which would reduce size variation) and found no indication that size-dependentsurvival substantially influenced body size distributions. Depensatory growth(faster growth by larger individuals) reinforced early size variation, but was relativelystrong only during the first sampling interval (age-0, fall). Maternaldecisions on the timing and location of spawning could have a major influenceon early, and as our results suggest, later (>age-0) size distributions. If this isthe case, our estimates of heritability of body size (body length = 0.25) will bedominated by processes that generate and maintain early size differences. As aresult, evolutionary responses to environmental change that are mediated bybody size may be largely expressed via changes in the timing and location ofreproduction.
Citation preview
ORIGINAL ARTICLE
Maintenance of phenotypic variation: repeatability,heritability and size-dependent processes in a wild brooktrout populationBenjamin H. Letcher,1 Jason A. Coombs1,2 and Keith H. Nislow3
1 S.O. Conte Anadromous Fish Research Center, US Geological Survey/Leetown Science Center, Turners Falls, MA, USA
2 Program in Organismic and Evolutionary Biology, University of Massachusetts, Amherst, MA, USA
3 Northern Research Station, USDA Forest Service, University of Massachusetts, Amherst, MA, USA
Introduction
Forecasting effects of environmental change on population
persistence, especially effects of climate change, can be
improved by incorporating evolutionary processes into
population models (Skelly et al. 2007). Forecasts that
ignore evolutionary processes may overestimate rates of
extinction or population decline because they do not
allow for adaptation to environmental change on contem-
porary time scales. The potential for evolutionary response
to environmental change can be evaluated using the bree-
der’s equation (Kruuk et al. 2008; Wilson et al. 2010),
which states that evolutionary rate of change (R) for a
trait depends on the strength of selection (S) and the
heritability (h2), where R = S · h2. Multivariate versions
of the breeder’s equation are also possible (usually
preferable, McGuigan 2006). In an effort to move toward
incorporation of evolutionary processes into population
models and to understand the relative importance of size-
dependent processes including growth and survival, we
provide estimates of quantitative genetic variables for the
key phenotypic traits of body size and growth from a wild
population of brook trout (BKT) (Salvelinus fontinalis).
Brook trout, a widespread but locally imperiled stream
fish in its native range (Hudy et al. 2008), faces multiple
threats to local persistence. As climate changes, BKT may
be forced into relatively cool, headwater streams to avoid
warming mainstem rivers and invasive competitors and
predators. While BKT appear to adapt to isolation
(Letcher et al. 2007), it is not known whether local
Keywords
brook trout, growth compensation,
heritability, repeatability, size-dependent
growth.
Correspondence
Benjamin H. Letcher, S.O. Conte Anadromous
Fish Research Center, US Geological Survey/
Leetown Science Center, Turners Falls, MA
01376, USA.
Tel.: 413 863 3803; fax: 413 863 9810;
e-mail: [email protected]
Received: 1 December 2010
Accepted: 26 January 2011
First published online: 8 March 2011
doi:10.1111/j.1752-4571.2011.00184.x
Abstract
Phenotypic variation in body size can result from within-cohort variation in
birth dates, among-individual growth variation and size-selective processes. We
explore the relative effects of these processes on the maintenance of wide
observed body size variation in stream-dwelling brook trout (Salvelinus fontinalis).
Based on the analyses of multiple recaptures of individual fish, it appears
that size distributions are largely determined by the maintenance of early size
variation. We found no evidence for size-dependent compensatory growth
(which would reduce size variation) and found no indication that size-dependent
survival substantially influenced body size distributions. Depensatory growth
(faster growth by larger individuals) reinforced early size variation, but was rel-
atively strong only during the first sampling interval (age-0, fall). Maternal
decisions on the timing and location of spawning could have a major influence
on early, and as our results suggest, later (>age-0) size distributions. If this is
the case, our estimates of heritability of body size (body length = 0.25) will be
dominated by processes that generate and maintain early size differences. As a
result, evolutionary responses to environmental change that are mediated by
body size may be largely expressed via changes in the timing and location of
reproduction.
Evolutionary Applications ISSN 1752-4571
602 Published 2011. This article is a US Government work and is in the public domain in the USA 4 (2011) 602–615
populations can adapt quickly enough to counteract the
potentially negative consequences of isolation resulting
from climate change.
Because many key demographic processes (growth, sur-
vival, movement, reproduction) are size-dependent in
BKT and in many other fish species, it is critical to
understand how BKT size distributions are structured to
provide a mechanistic basis for understanding population
response to environmental change. In general, BKT have
remarkably wide size distributions within an age class,
e.g. ranging from 61 to 140 mm at age-0 in the autumn
within a stream (McFadden 1961). Understanding the
source of this variation is complex, because many pro-
cesses can contribute to size variation, and the relative
importance of various sources can change over ontogeny.
In general, however, the development of size distributions
within a generation depends on three factors: (i) differ-
ences in initial sizes among individuals resulting from
variable birth dates, (ii) differences in body growth within
and among individuals, and (iii) losses or gains resulting
from size-dependent survival, emigration or immigration.
In BKT, birth or emergence dates can vary widely among
individuals (Snucins et al. 1992), providing the founda-
tion for broad size distributions. The wide range in emer-
gence dates in the spring results from a combination of
variation in fertilization dates in the previous autumn
and winter development rates during incubation in
stream beds. The emergence-based size differences in the
spring can be either magnified or reduced as the cohort
grows depending on the direction of size-dependent
growth; spreading out if size-dependent growth is posi-
tive, narrowing if it is negative. Size distributions can be
further shaped in complex ways by the repeatability of
individual growth within an individual, e.g. high repeat-
ability of individual growth can further accelerate the
spread of a size distribution because fast growers will
remain fast growers over time. Finally, size distributions
can be shaped by losses (mortality or emigration) or gains
(immigration) to the population, provided the losses or
gains are size-dependent. Combined with estimates of
size-dependent losses, the variance components approach
behind estimating heritability can provide useful estimates
of within- and among-individual variance in growth or
body size. These estimates can be used to determine the
extent to which the relative growth and body size of indi-
viduals varies over time, providing important insight into
mechanisms responsible for the generation of size distri-
butions.
Heritability can be estimated using parent–offspring
relationships in controlled settings, but this approach usu-
ally involves some level of artificial manipulation (Kruuk
and Hadfield 2007). Recently, researchers have taken
advantage of long-term field studies to estimate repeat-
ability and heritability in natural settings using multiple-
generation pedigrees (Wilson et al. 2010). In this
approach, heritability is simply the proportion of total
phenotypic variance that can be attributed to additive
genetic effects, and repeatability represents the proportion
of total phenotypic variance owing to both genetic and
nongenetic sources of among-individual phenotypic varia-
tion (Falconer and Mackay 1996; Wilson et al. 2010). The
pedigree is used to isolate phenotypic variance resulting
from additive genetic effects from other sources of vari-
ance (other sources of individual variance and residual
variance) in a mixed linear model (often called the ‘ani-
mal model’; Kruuk 2004). This is an extremely flexible
modeling approach that can be used for effective herita-
bility and repeatability estimation, but also to test hypoth-
eses in a linear modeling, model selection framework.
To date, most studies estimating heritability in the wild
have focused on species for which parent–offspring rela-
tionships can be observed, most notably ungulates and
birds (Garant et al. 2005; Pelletier et al. 2007). These
studies have yielded tremendous amounts of information
about heritability in the wild and about evolutionary pro-
cesses in general, but they represent a fairly narrow slice
of life history space (e.g. determinate growth, low fecun-
dity, size-independent fecundity). Studies with enough
detailed information on individual performance com-
bined with pedigree information for species across life
history space would be useful to inform the generality of
the existing results (Rodriguez-Munoz et al. 2010). A
major difficulty extending this approach to other life his-
tories is generating the pedigree when parent–offspring
relationships cannot be observed. This is a diminishing
roadblock, however, as multilocus genotypes with suffi-
cient power to resolve pedigrees and more rigorous geno-
type-based pedigree reconstruction tools become available
(Pemberton 2008).
In BKT, the relative importance of variation in emer-
gence dates and growth processes is not well known and
is difficult to sort out because studies combining nonle-
thal estimates of emergence dates and later individual
growth rates are challenging. Here, we focus on growth
processes and ask three main questions: (i) To what
extent do observed size distributions reflect repeatability
of individual body size and growth rate? (ii) How are
body sizes influenced by size-dependent growth and
losses? (iii) Is heritability of body size and growth rate
high enough that selection on size or growth could evoke
an evolutionary response? Overall, we ask whether an
evolutionary response to environmental change is likely
to act through body size/growth processes, and to what
extent early size differences, later growth rate variation,
and size-selective mortality contribute to the generation
of size distributions.
Letcher et al. Maintenance of phenotypic variation
Published 2011. This article is a US Government work and is in the public domain in the USA 4 (2011) 602–615 603
Methods
Study system
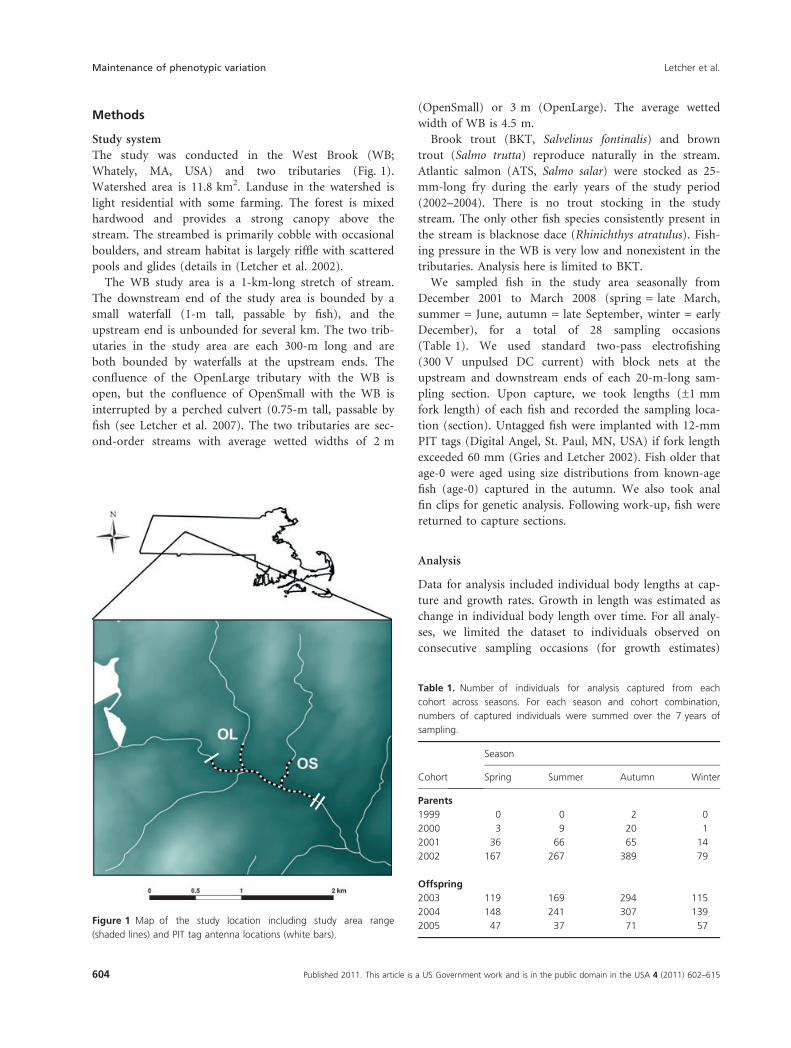
The study was conducted in the West Brook (WB;
Whately, MA, USA) and two tributaries (Fig. 1).
Watershed area is 11.8 km2. Landuse in the watershed is
light residential with some farming. The forest is mixed
hardwood and provides a strong canopy above the
stream. The streambed is primarily cobble with occasional
boulders, and stream habitat is largely riffle with scattered
pools and glides (details in (Letcher et al. 2002).
The WB study area is a 1-km-long stretch of stream.
The downstream end of the study area is bounded by a
small waterfall (1-m tall, passable by fish), and the
upstream end is unbounded for several km. The two trib-
utaries in the study area are each 300-m long and are
both bounded by waterfalls at the upstream ends. The
confluence of the OpenLarge tributary with the WB is
open, but the confluence of OpenSmall with the WB is
interrupted by a perched culvert (0.75-m tall, passable by
fish (see Letcher et al. 2007). The two tributaries are sec-
ond-order streams with average wetted widths of 2 m
(OpenSmall) or 3 m (OpenLarge). The average wetted
width of WB is 4.5 m.
Brook trout (BKT, Salvelinus fontinalis) and brown
trout (Salmo trutta) reproduce naturally in the stream.
Atlantic salmon (ATS, Salmo salar) were stocked as 25-
mm-long fry during the early years of the study period
(2002–2004). There is no trout stocking in the study
stream. The only other fish species consistently present in
the stream is blacknose dace (Rhinichthys atratulus). Fish-
ing pressure in the WB is very low and nonexistent in the
tributaries. Analysis here is limited to BKT.
We sampled fish in the study area seasonally from
December 2001 to March 2008 (spring = late March,
summer = June, autumn = late September, winter = early
December), for a total of 28 sampling occasions
(Table 1). We used standard two-pass electrofishing
(300 V unpulsed DC current) with block nets at the
upstream and downstream ends of each 20-m-long sam-
pling section. Upon capture, we took lengths (±1 mm
fork length) of each fish and recorded the sampling loca-
tion (section). Untagged fish were implanted with 12-mm
PIT tags (Digital Angel, St. Paul, MN, USA) if fork length
exceeded 60 mm (Gries and Letcher 2002). Fish older that
age-0 were aged using size distributions from known-age
fish (age-0) captured in the autumn. We also took anal
fin clips for genetic analysis. Following work-up, fish were
returned to capture sections.
Analysis
Data for analysis included individual body lengths at cap-
ture and growth rates. Growth in length was estimated as
change in individual body length over time. For all analy-
ses, we limited the dataset to individuals observed on
consecutive sampling occasions (for growth estimates)
Figure 1 Map of the study location including study area range
(shaded lines) and PIT tag antenna locations (white bars).
Table 1. Number of individuals for analysis captured from each
cohort across seasons. For each season and cohort combination,
numbers of captured individuals were summed over the 7 years of
sampling.
Cohort
Season
Spring Summer Autumn Winter
Parents
1999 0 0 2 0
2000 3 9 20 1
2001 36 66 65 14
2002 167 267 389 79
Offspring
2003 119 169 294 115
2004 148 241 307 139
2005 47 37 71 57
Maintenance of phenotypic variation Letcher et al.
604 Published 2011. This article is a US Government work and is in the public domain in the USA 4 (2011) 602–615
and scaled response variables across all captures to a
mean of 0 and a variance of 1. Scaling generates results
on relative, not absolute, body size and growth. In the
results, growth is labeled as growth from the previous to
the current sampling occasion.
Pedigree
Because we cannot observe parent/offspring pairs in the
field, we used individual genotypes to reconstruct the pedi-
gree structure among sampled individuals. All individuals
with at least one parent were included in the analyses
below. A panel of twelve microsatellite loci [SfoB52,
SfoC24, SfoC38, SfoC86, SfoC88, SfoC113, SfoC115,
SfoC129, SfoD75, SfoD91a, SfoD100 (King et al. 2003),
SsaD237 (King et al. 2005)] was selected based on its ability
to accurately reconstruct known full-sibling families and
assign parents for synthetic data (see below). Protocols for
DNA extraction and amplification were followed as
described by King et al. (2005). Loci were electrophoresed
on an ABI Prism 3100-Avant genetic analyzer (Applied Bio-
systems Inc., Foster City, CA, USA), and alleles were scored
using GENESCAN v3.7 software (Applied Biosystems Inc.).
Genotype error rate was assessed by randomly selecting
100 individuals and performing a second DNA extraction
and amplification of all twelve loci. Alleles were compared
between the two genotypes for each individual, and a per
allele error rate estimate was obtained.
The power of the loci panel to reconstruct full-sibling
families accurately and assign parents was assessed through
the use of simulated data generated by the program
PEDAGOG v1.2 (Coombs et al. 2010a). Genetic and
demographic parameters for the simulated population
were derived from field data for the BKT population in the
study site (Table S1). The simulated population was sub-
jected to a seasonal sampling scheme using field-derived
capture probability estimates. Sibship reconstruction and
initial parentage assignment analyses were performed on
the simulated population using the programs COLONY
v1.2 (Wang 2004) (sibship) and PEDAPP v1.1 (Almudevar
2007) (parentage). Final parentage assignments were
acquired using the sibship constraint method within the
program PEDAGREE v1.04 (Coombs et al. 2010b). The SC
method was run using a minimum threshold value of
0.2501 for full-sibling families with two members, and
0.1667 for full-sibling families with three or more mem-
bers. The results from the two runs were then merged.
Accuracy of reconstructed families and assigned parents
were calculated using PEDAGREE. A total of ten replicates
were simulated. The same methodology outlined above
was used to construct the pedigree for the WB dataset. In
the following analysis, we only included individuals that
were in the pedigree.
Quantitative genetics
We used the R package MCMCglmm (http://www.cran.
r-project.org) to estimate quantitative genetics parameters
(repeatability, heritability, genetic covariances). This pack-
age uses a mixed model approach in a Bayesian estimation
framework to estimate individual variance components
that are constrained by the relatedness matrix (derived
from the pedigree), individual effects that are uncon-
strained by the relatedness matrix and residual error (as
well as other possible random effects). Constrained effects
can be attributed to additive genetic variance (VA), uncon-
strained individual effects to ‘permanent environment
effects’ (VE) and other individual effects to residual error
(Ve). Repeatability can be estimated as the sum of individ-
ual variances divided by total variance [(VA + VE)/Vp) and
can be interpreted as the proportion of total variance
attributable to among-individual variation. Heritability is
estimated as the ratio of VA to the total variance Vp
(Vp = VA + VE + Ve) and can be interpreted as the pro-
portion of total variance stemming from among-individual
variance that derives from the pedigree.
Repeat measures estimates
Estimates for both repeatability and heritability will be
reduced when residual variance is relatively high. Because
within-individual variance in body size over time will
contribute to residual variance, repeat measures of indi-
viduals provide important longitudinal data that can
improve understanding of heritability estimates. The
mixed model animal model approach can easily accom-
modate repeat observations of individuals (Wilson et al.
2010). We included observations for each individual in a
repeat measures design. This approach takes advantage of
the recaptures of individual fish over time and does not
limit estimates of heritability and genetic covariances to a
single point in time. Including all seasons in the analyses,
however, has the potential to reduce the ability to detect
repeatability and heritability of body size and growth
because growth is quite low during three of four seasons
(see results and Xu et al. 2010a). Any growth signal may
be very difficult to detect during low-growth intervals
because individuals will have minimal opportunity to
express growth variation. Also, including intervals of low
growth may artificially inflate repeatability or heritability
estimates for body size because of limited opportunity for
individual change in size. To avoid the potential ‘dilution’
of repeatability and heritability estimates for growth and
the potential inflation for body size estimates, we con-
ducted analyses using growth data from just the fast
growth interval (spring) for age 1, 2 and 3 fish. For body
size, this includes six sampling occasions (age-1, age-2
Letcher et al. Maintenance of phenotypic variation
Published 2011. This article is a US Government work and is in the public domain in the USA 4 (2011) 602–615 605
and age-3, spring and summer) and for growth includes
three sampling intervals (age-1, age-2 and age-3 spring to
summer growth).
As a mixed model, the animal model can include both
fixed and random effects (Bolker et al. 2009). Because of
the highly seasonal BKT growth in our study stream, we
included an age · season [age = (1, 2, 3), season =
(spring, summer)] fixed effect interaction to account for
changes in body size over time. For the growth analyses,
we included an age fixed effect only (there was only one
season). Thus, our repeatability and heritability estimates
represent estimates after accounting for seasonal- (size)
and age-related (size and growth) variation.
Genetic covariances between body size and growth are
very close to 1 when analysis is limited to the fast growth
intervals. We ran ‘bivariate dependent variable’ models
across all sampling intervals to estimate sample-specific
covariances. In this model, the dependent variables were
body length and growth rate for length. To estimate
genetic covariances, we divided the additive genetic
covariance for a pair of dependent variables (here, size
and growth) by the square root of the product of the
additive genetic random effects for each variable (Wilson
et al. 2010).
Before running models, we tested the effect of prior
distributions on model outcome by varying priors from
noninformative to informative. We found a moderate
effect of priors on model outcome (results not shown),
especially on the variances. To minimize the effect of
priors on our analyses, we used completely noninforma-
tive priors for all parameters in both models. Models
were run with 30 000 burn-in iterations followed by
100 000 iterations and a thinning rate of 100. We sum-
marize posterior distributions for model results (repeat-
ability, heritability and genetic covariances) using
posterior modes and 95% credible intervals. It is impor-
tant to note that MCMCglmm only allows positive esti-
mates of variance components, making it difficult to
determine whether a variance component estimate or
derived parameters like repeatability or heritability are
different from 0. To help assess parameter estimates, we
provide representative traces and posterior distributions
of the Markov chain Monte Carlo (MCMC) samples gen-
erated by MCMCglmm.
Pairwise repeatability estimates
Repeat measures estimates of body size repeatability using
the animal model provide an overall estimate of the rela-
tive importance of among- to within-individual variance.
More detailed information on the time course of
repeatability can be generated from pairwise repeatability
estimates based on individuals captured in pairs of
sampling occasions. For pairwise analyses, the correlation
coefficient for each pair of sampling occasions provides
an estimate of repeatability over the time interval between
sampling occasions (Lessells and Boag 1987). We present
Pearson correlation coefficient estimates of body length
for each pair of sampling occasions in our analysis and
for body growth for each pair of sampling intervals.
Size-dependent survival
To determine the extent to which size-dependent survival
could influence size distributions, we estimated survival
of fish from different size bins using a multi-state
capture-mark-recapture model (Hestbeck et al. 1991;
Lebreton and Pradel 2002). Multi-state models offer a
flexible framework for estimating survival of individuals
belonging to different states, and are particularly useful
for estimating survival when the data contain missing
observations (Letcher and Horton 2008). We also chose
this approach over a method that incorporates size as a
continuous variable (such as selection gradients) because
it can account for variation in probability of capture and
emigration. In our case, the states were size bins (mm,
60–95, 96–115, 116–135, >135). Our analysis included
fish from the 2003–2005 cohorts. Some of these fish were
not genotyped, so the number of fish for the quantitative
genetics analysis does not equal the number of fish for
the survival analysis. We used program M-SURGE
(Choquet et al. 2004) for parameter estimates and esti-
mated goodness of fit of our data to the multi-state
model using program U-CARE (Choquet et al. 2009). We
attempted to minimize the confounding of emigration
and mortality by coding known permanent emigrants
from the study area in the model encounter history file
(the input file to the analysis). Known emigrants were
identified with PIT tag antennas at the top and the
bottom of the study area (Fig. 1). Tag read efficiency of
our array has been estimated at 91% (Zydlewski et al.
2006), suggesting that we were able to account for the
majority of emigrants from our study area. We used
model selection procedures to evaluate the overall effect
of body size on survival and compared 95% confidence
intervals of state-specific survival estimates (the logit link
‘beta’ values) to determine whether survival estimates
among size states were significantly different. Survival
estimates were scaled to a monthly time step.
Results
Body size distributions were wide, and growth was
strongly seasonal (Fig. 2). Typically, the central 50% of
the length range for a sampling occasion was about 1/3 of
the median size, and 95% size distributions for each
Maintenance of phenotypic variation Letcher et al.
606 Published 2011. This article is a US Government work and is in the public domain in the USA 4 (2011) 602–615
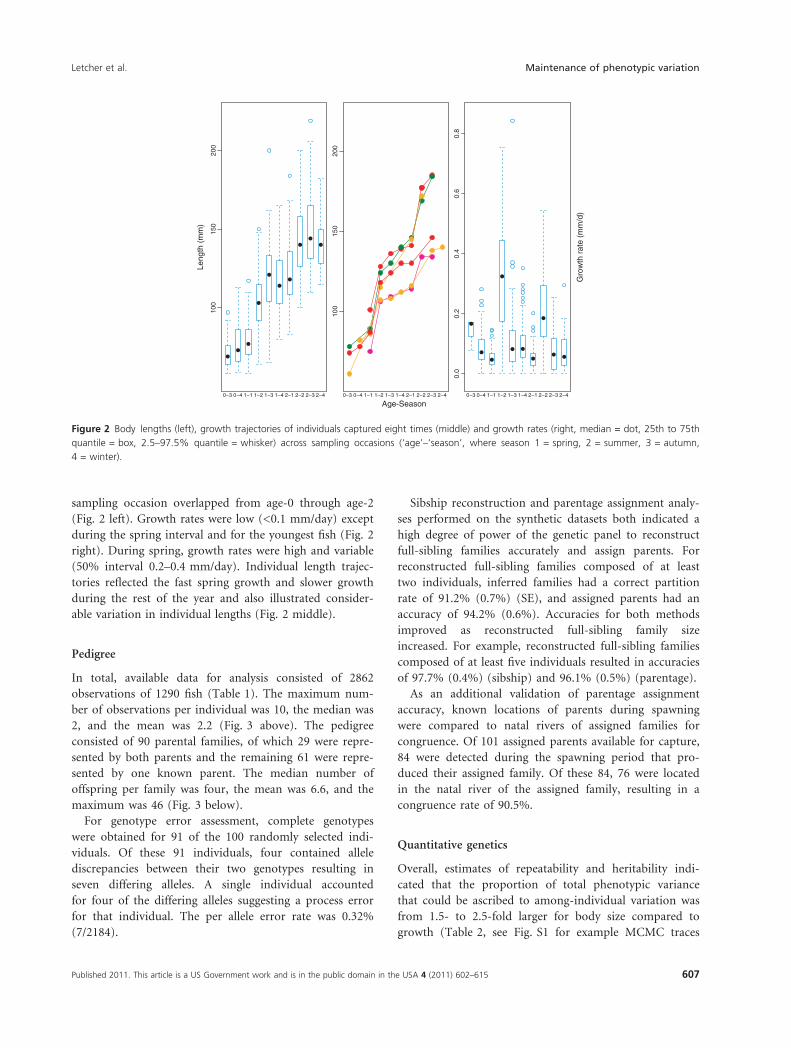
sampling occasion overlapped from age-0 through age-2
(Fig. 2 left). Growth rates were low (<0.1 mm/day) except
during the spring interval and for the youngest fish (Fig. 2
right). During spring, growth rates were high and variable
(50% interval 0.2–0.4 mm/day). Individual length trajec-
tories reflected the fast spring growth and slower growth
during the rest of the year and also illustrated consider-
able variation in individual lengths (Fig. 2 middle).
Pedigree
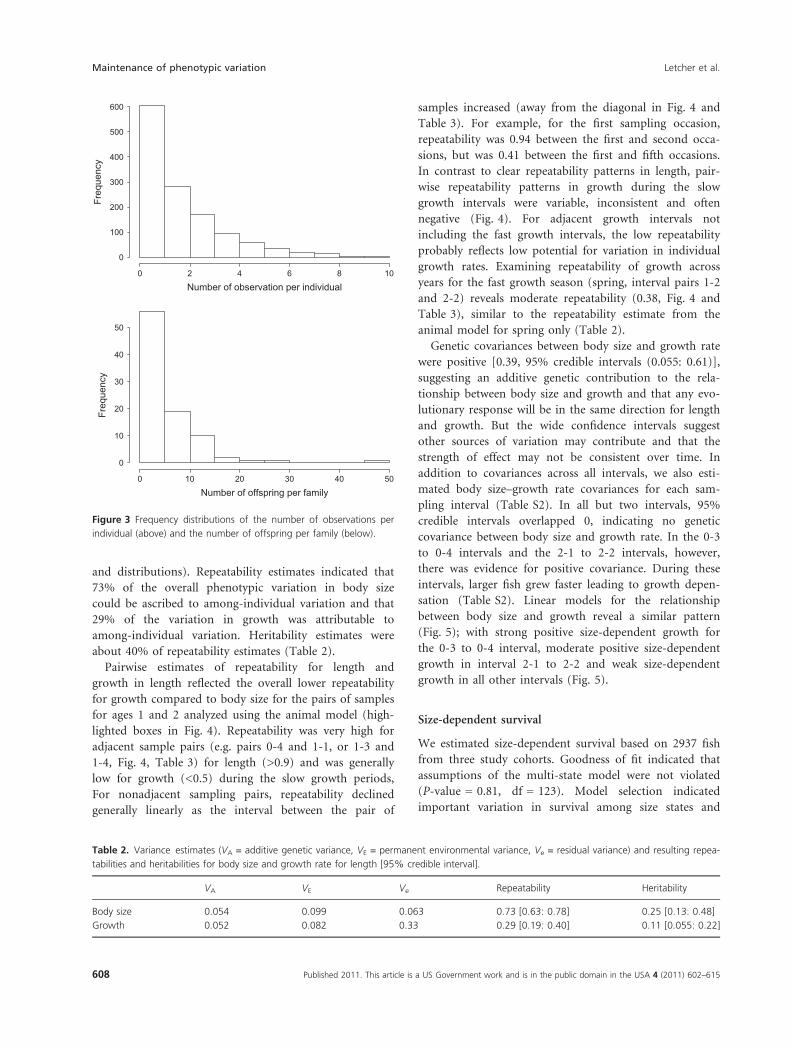
In total, available data for analysis consisted of 2862
observations of 1290 fish (Table 1). The maximum num-
ber of observations per individual was 10, the median was
2, and the mean was 2.2 (Fig. 3 above). The pedigree
consisted of 90 parental families, of which 29 were repre-
sented by both parents and the remaining 61 were repre-
sented by one known parent. The median number of
offspring per family was four, the mean was 6.6, and the
maximum was 46 (Fig. 3 below).
For genotype error assessment, complete genotypes
were obtained for 91 of the 100 randomly selected indi-
viduals. Of these 91 individuals, four contained allele
discrepancies between their two genotypes resulting in
seven differing alleles. A single individual accounted
for four of the differing alleles suggesting a process error
for that individual. The per allele error rate was 0.32%
(7/2184).
Sibship reconstruction and parentage assignment analy-
ses performed on the synthetic datasets both indicated a
high degree of power of the genetic panel to reconstruct
full-sibling families accurately and assign parents. For
reconstructed full-sibling families composed of at least
two individuals, inferred families had a correct partition
rate of 91.2% (0.7%) (SE), and assigned parents had an
accuracy of 94.2% (0.6%). Accuracies for both methods
improved as reconstructed full-sibling family size
increased. For example, reconstructed full-sibling families
composed of at least five individuals resulted in accuracies
of 97.7% (0.4%) (sibship) and 96.1% (0.5%) (parentage).
As an additional validation of parentage assignment
accuracy, known locations of parents during spawning
were compared to natal rivers of assigned families for
congruence. Of 101 assigned parents available for capture,
84 were detected during the spawning period that pro-
duced their assigned family. Of these 84, 76 were located
in the natal river of the assigned family, resulting in a
congruence rate of 90.5%.
Quantitative genetics
Overall, estimates of repeatability and heritability indi-
cated that the proportion of total phenotypic variance
that could be ascribed to among-individual variation was
from 1.5- to 2.5-fold larger for body size compared to
growth (Table 2, see Fig. S1 for example MCMC traces
Age-Season
Leng
th (
mm
)
Gro
wth
rat
e (m
m/d
)
100
150
200
0−3 0−4 1−1 1−2 1−3 1−4 2−1 2−2 2−3 2−4
100
150
200
0−3 0−4 1−1 1−2 1−3 1−4 2−1 2−2 2−3 2−4
0.0
0.2
0.4
0.6
0.8
0−3 0−4 1−1 1−2 1−3 1−4 2−1 2−2 2−3 2−4
Figure 2 Body lengths (left), growth trajectories of individuals captured eight times (middle) and growth rates (right, median = dot, 25th to 75th
quantile = box, 2.5–97.5% quantile = whisker) across sampling occasions (‘age’–‘season’, where season 1 = spring, 2 = summer, 3 = autumn,
4 = winter).
Letcher et al. Maintenance of phenotypic variation
Published 2011. This article is a US Government work and is in the public domain in the USA 4 (2011) 602–615 607
and distributions). Repeatability estimates indicated that
73% of the overall phenotypic variation in body size
could be ascribed to among-individual variation and that
29% of the variation in growth was attributable to
among-individual variation. Heritability estimates were
about 40% of repeatability estimates (Table 2).
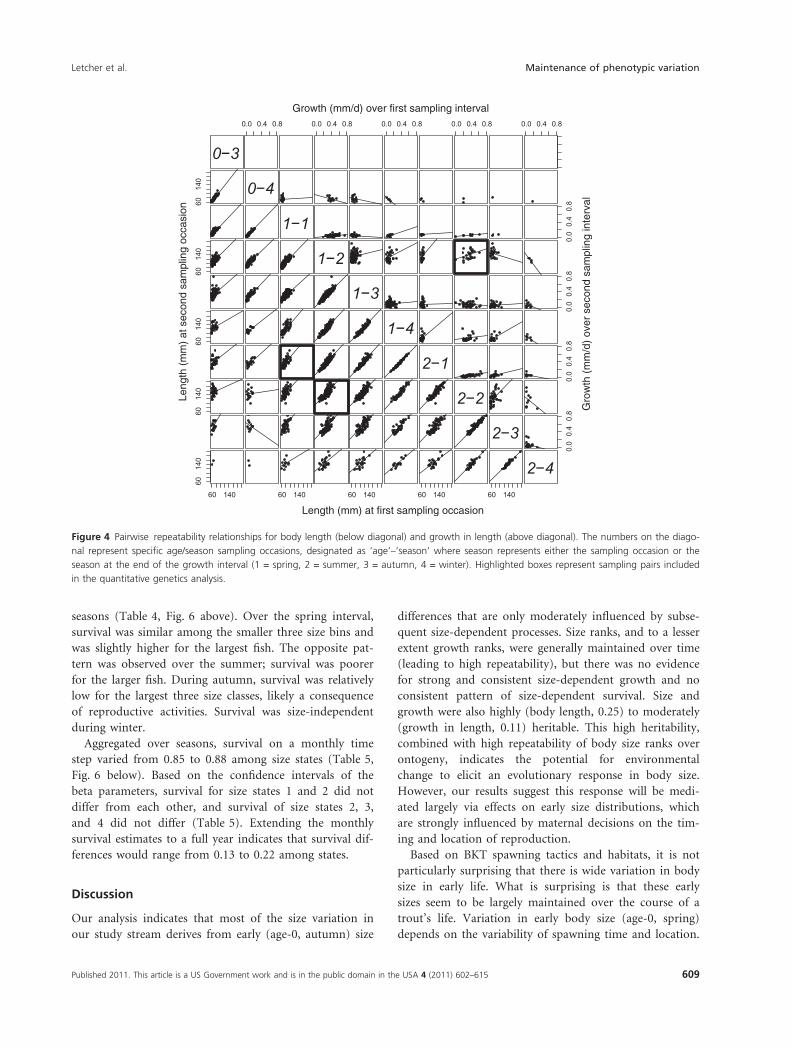
Pairwise estimates of repeatability for length and
growth in length reflected the overall lower repeatability
for growth compared to body size for the pairs of samples
for ages 1 and 2 analyzed using the animal model (high-
lighted boxes in Fig. 4). Repeatability was very high for
adjacent sample pairs (e.g. pairs 0-4 and 1-1, or 1-3 and
1-4, Fig. 4, Table 3) for length (>0.9) and was generally
low for growth (<0.5) during the slow growth periods,
For nonadjacent sampling pairs, repeatability declined
generally linearly as the interval between the pair of
samples increased (away from the diagonal in Fig. 4 and
Table 3). For example, for the first sampling occasion,
repeatability was 0.94 between the first and second occa-
sions, but was 0.41 between the first and fifth occasions.
In contrast to clear repeatability patterns in length, pair-
wise repeatability patterns in growth during the slow
growth intervals were variable, inconsistent and often
negative (Fig. 4). For adjacent growth intervals not
including the fast growth intervals, the low repeatability
probably reflects low potential for variation in individual
growth rates. Examining repeatability of growth across
years for the fast growth season (spring, interval pairs 1-2
and 2-2) reveals moderate repeatability (0.38, Fig. 4 and
Table 3), similar to the repeatability estimate from the
animal model for spring only (Table 2).
Genetic covariances between body size and growth rate
were positive [0.39, 95% credible intervals (0.055: 0.61)],
suggesting an additive genetic contribution to the rela-
tionship between body size and growth and that any evo-
lutionary response will be in the same direction for length
and growth. But the wide confidence intervals suggest
other sources of variation may contribute and that the
strength of effect may not be consistent over time. In
addition to covariances across all intervals, we also esti-
mated body size–growth rate covariances for each sam-
pling interval (Table S2). In all but two intervals, 95%
credible intervals overlapped 0, indicating no genetic
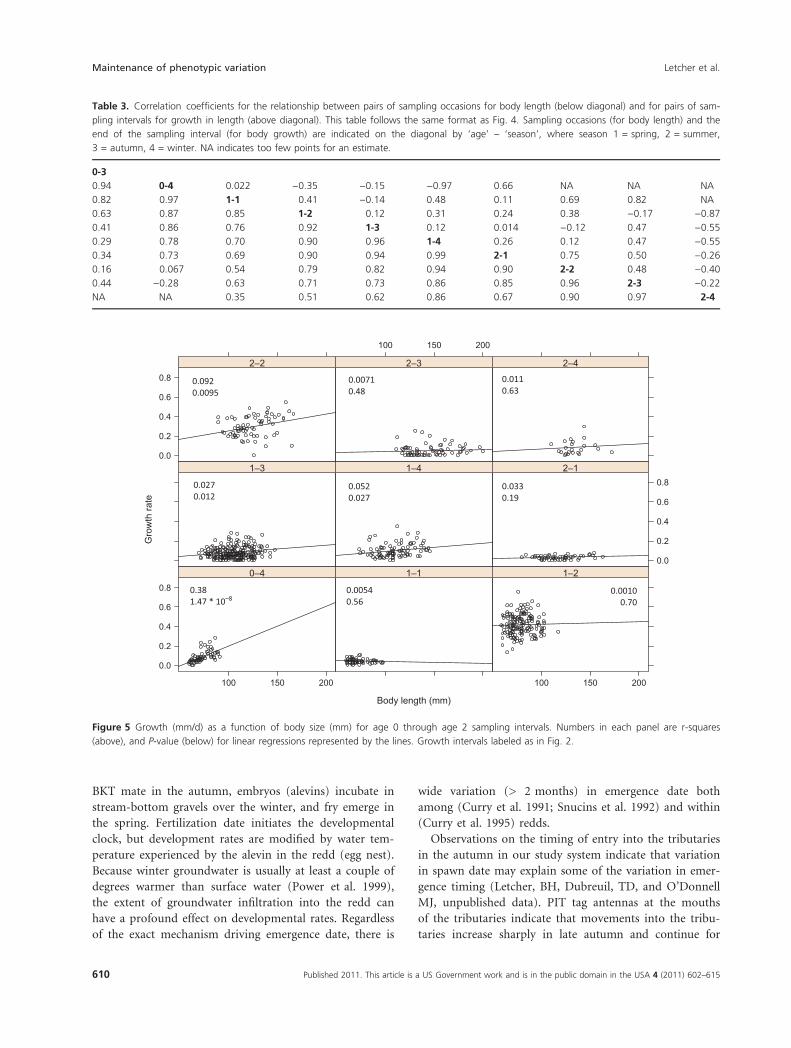
covariance between body size and growth rate. In the 0-3
to 0-4 intervals and the 2-1 to 2-2 intervals, however,
there was evidence for positive covariance. During these
intervals, larger fish grew faster leading to growth depen-
sation (Table S2). Linear models for the relationship
between body size and growth reveal a similar pattern
(Fig. 5); with strong positive size-dependent growth for
the 0-3 to 0-4 interval, moderate positive size-dependent
growth in interval 2-1 to 2-2 and weak size-dependent
growth in all other intervals (Fig. 5).
Size-dependent survival
We estimated size-dependent survival based on 2937 fish
from three study cohorts. Goodness of fit indicated that
assumptions of the multi-state model were not violated
(P-value = 0.81, df = 123). Model selection indicated
important variation in survival among size states and
Number of observation per individual
Freq
uenc
y
0 2 4 6 8 10
0
100
200
300
400
500
600
Number of offspring per family
Freq
uenc
y
0 10 20 30 40 50
0
10
20
30
40
50
Figure 3 Frequency distributions of the number of observations per
individual (above) and the number of offspring per family (below).
Table 2. Variance estimates (VA = additive genetic variance, VE = permanent environmental variance, Ve = residual variance) and resulting repea-
tabilities and heritabilities for body size and growth rate for length [95% credible interval].
VA VE Ve Repeatability Heritability
Body size 0.054 0.099 0.063 0.73 [0.63: 0.78] 0.25 [0.13: 0.48]
Growth 0.052 0.082 0.33 0.29 [0.19: 0.40] 0.11 [0.055: 0.22]
Maintenance of phenotypic variation Letcher et al.
608 Published 2011. This article is a US Government work and is in the public domain in the USA 4 (2011) 602–615
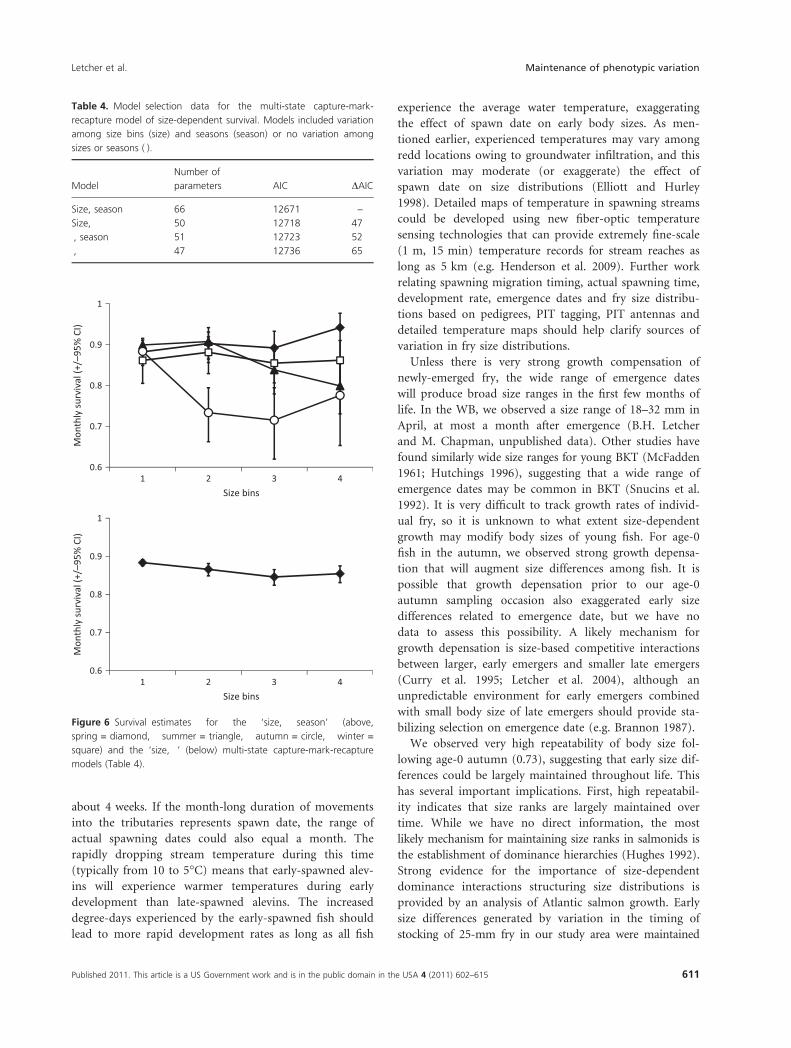
seasons (Table 4, Fig. 6 above). Over the spring interval,
survival was similar among the smaller three size bins and
was slightly higher for the largest fish. The opposite pat-
tern was observed over the summer; survival was poorer
for the larger fish. During autumn, survival was relatively
low for the largest three size classes, likely a consequence
of reproductive activities. Survival was size-independent
during winter.
Aggregated over seasons, survival on a monthly time
step varied from 0.85 to 0.88 among size states (Table 5,
Fig. 6 below). Based on the confidence intervals of the
beta parameters, survival for size states 1 and 2 did not
differ from each other, and survival of size states 2, 3,
and 4 did not differ (Table 5). Extending the monthly
survival estimates to a full year indicates that survival dif-
ferences would range from 0.13 to 0.22 among states.
Discussion
Our analysis indicates that most of the size variation in
our study stream derives from early (age-0, autumn) size
differences that are only moderately influenced by subse-
quent size-dependent processes. Size ranks, and to a lesser
extent growth ranks, were generally maintained over time
(leading to high repeatability), but there was no evidence
for strong and consistent size-dependent growth and no
consistent pattern of size-dependent survival. Size and
growth were also highly (body length, 0.25) to moderately
(growth in length, 0.11) heritable. This high heritability,
combined with high repeatability of body size ranks over
ontogeny, indicates the potential for environmental
change to elicit an evolutionary response in body size.
However, our results suggest this response will be medi-
ated largely via effects on early size distributions, which
are strongly influenced by maternal decisions on the tim-
ing and location of reproduction.
Based on BKT spawning tactics and habitats, it is not
particularly surprising that there is wide variation in body
size in early life. What is surprising is that these early
sizes seem to be largely maintained over the course of a
trout’s life. Variation in early body size (age-0, spring)
depends on the variability of spawning time and location.
0−3
60140
0−4
1−1
60140
1−2
1−3
60140
1−4
2−1
60140
2−2
2−3
60 140
60140
60 140 60 140 60 140 60 140
2−4
0.0 0.4 0.8 0.0 0.4 0.8 0.0 0.4 0.8 0.0 0.4 0.8 0.0 0.4 0.8
0.00.40.8
0.00.40.8
0.00.40.8
0.00.40.8
Length (mm) at first sampling occasion
Leng
th (
mm
) at
sec
ond
sam
plin
g oc
casi
on
Growth (mm/d) over first sampling interval
Gro
wth
(m
m/d
) ov
er s
econ
d sa
mpl
ing
inte
rval
Figure 4 Pairwise repeatability relationships for body length (below diagonal) and growth in length (above diagonal). The numbers on the diago-
nal represent specific age/season sampling occasions, designated as ‘age’–‘season’ where season represents either the sampling occasion or the
season at the end of the growth interval (1 = spring, 2 = summer, 3 = autumn, 4 = winter). Highlighted boxes represent sampling pairs included
in the quantitative genetics analysis.
Letcher et al. Maintenance of phenotypic variation
Published 2011. This article is a US Government work and is in the public domain in the USA 4 (2011) 602–615 609
BKT mate in the autumn, embryos (alevins) incubate in
stream-bottom gravels over the winter, and fry emerge in
the spring. Fertilization date initiates the developmental
clock, but development rates are modified by water tem-
perature experienced by the alevin in the redd (egg nest).
Because winter groundwater is usually at least a couple of
degrees warmer than surface water (Power et al. 1999),
the extent of groundwater infiltration into the redd can
have a profound effect on developmental rates. Regardless
of the exact mechanism driving emergence date, there is
wide variation (> 2 months) in emergence date both
among (Curry et al. 1991; Snucins et al. 1992) and within
(Curry et al. 1995) redds.
Observations on the timing of entry into the tributaries
in the autumn in our study system indicate that variation
in spawn date may explain some of the variation in emer-
gence timing (Letcher, BH, Dubreuil, TD, and O’Donnell
MJ, unpublished data). PIT tag antennas at the mouths
of the tributaries indicate that movements into the tribu-
taries increase sharply in late autumn and continue for
Table 3. Correlation coefficients for the relationship between pairs of sampling occasions for body length (below diagonal) and for pairs of sam-
pling intervals for growth in length (above diagonal). This table follows the same format as Fig. 4. Sampling occasions (for body length) and the
end of the sampling interval (for body growth) are indicated on the diagonal by ‘age’ – ‘season’, where season 1 = spring, 2 = summer,
3 = autumn, 4 = winter. NA indicates too few points for an estimate.
0-3
0.94 0-4 0.022 )0.35 )0.15 )0.97 0.66 NA NA NA
0.82 0.97 1-1 0.41 )0.14 0.48 0.11 0.69 0.82 NA
0.63 0.87 0.85 1-2 0.12 0.31 0.24 0.38 )0.17 )0.87
0.41 0.86 0.76 0.92 1-3 0.12 0.014 )0.12 0.47 )0.55
0.29 0.78 0.70 0.90 0.96 1-4 0.26 0.12 0.47 )0.55
0.34 0.73 0.69 0.90 0.94 0.99 2-1 0.75 0.50 )0.26
0.16 0.067 0.54 0.79 0.82 0.94 0.90 2-2 0.48 )0.40
0.44 )0.28 0.63 0.71 0.73 0.86 0.85 0.96 2-3 )0.22
NA NA 0.35 0.51 0.62 0.86 0.67 0.90 0.97 2-4
Body length (mm)
Gro
wth
rate
0.0
0.2
0.4
0.6
0.8
100 150 200
0–4 1–1
100 150 200
1–2
1–3 1–4
0.0
0.2
0.4
0.6
0.82–1
0.0
0.2
0.4
0.6
0.82–2
100 150 200
2–3 2–4
0.38 1.47 * 10–8
0.052 0.027
0.0054 0.56
0.0010 0.70
0.027 0.012
0.011 0.63
0.092 0.0095
0.033 0.19
0.0071 0.48
Figure 5 Growth (mm/d) as a function of body size (mm) for age 0 through age 2 sampling intervals. Numbers in each panel are r-squares
(above), and P-value (below) for linear regressions represented by the lines. Growth intervals labeled as in Fig. 2.
Maintenance of phenotypic variation Letcher et al.
610 Published 2011. This article is a US Government work and is in the public domain in the USA 4 (2011) 602–615
about 4 weeks. If the month-long duration of movements
into the tributaries represents spawn date, the range of
actual spawning dates could also equal a month. The
rapidly dropping stream temperature during this time
(typically from 10 to 5�C) means that early-spawned alev-
ins will experience warmer temperatures during early
development than late-spawned alevins. The increased
degree-days experienced by the early-spawned fish should
lead to more rapid development rates as long as all fish
experience the average water temperature, exaggerating
the effect of spawn date on early body sizes. As men-
tioned earlier, experienced temperatures may vary among
redd locations owing to groundwater infiltration, and this
variation may moderate (or exaggerate) the effect of
spawn date on size distributions (Elliott and Hurley
1998). Detailed maps of temperature in spawning streams
could be developed using new fiber-optic temperature
sensing technologies that can provide extremely fine-scale
(1 m, 15 min) temperature records for stream reaches as
long as 5 km (e.g. Henderson et al. 2009). Further work
relating spawning migration timing, actual spawning time,
development rate, emergence dates and fry size distribu-
tions based on pedigrees, PIT tagging, PIT antennas and
detailed temperature maps should help clarify sources of
variation in fry size distributions.
Unless there is very strong growth compensation of
newly-emerged fry, the wide range of emergence dates
will produce broad size ranges in the first few months of
life. In the WB, we observed a size range of 18–32 mm in
April, at most a month after emergence (B.H. Letcher
and M. Chapman, unpublished data). Other studies have
found similarly wide size ranges for young BKT (McFadden
1961; Hutchings 1996), suggesting that a wide range of
emergence dates may be common in BKT (Snucins et al.
1992). It is very difficult to track growth rates of individ-
ual fry, so it is unknown to what extent size-dependent
growth may modify body sizes of young fish. For age-0
fish in the autumn, we observed strong growth depensa-
tion that will augment size differences among fish. It is
possible that growth depensation prior to our age-0
autumn sampling occasion also exaggerated early size
differences related to emergence date, but we have no
data to assess this possibility. A likely mechanism for
growth depensation is size-based competitive interactions
between larger, early emergers and smaller late emergers
(Curry et al. 1995; Letcher et al. 2004), although an
unpredictable environment for early emergers combined
with small body size of late emergers should provide sta-
bilizing selection on emergence date (e.g. Brannon 1987).
We observed very high repeatability of body size fol-
lowing age-0 autumn (0.73), suggesting that early size dif-
ferences could be largely maintained throughout life. This
has several important implications. First, high repeatabil-
ity indicates that size ranks are largely maintained over
time. While we have no direct information, the most
likely mechanism for maintaining size ranks in salmonids is
the establishment of dominance hierarchies (Hughes 1992).
Strong evidence for the importance of size-dependent
dominance interactions structuring size distributions is
provided by an analysis of Atlantic salmon growth. Early
size differences generated by variation in the timing of
stocking of 25-mm fry in our study area were maintained
0.6
0.7
0.8
0.9
1
1 2 3 4
Mon
thly
sur
viva
l (+/
–95%
CI)
Size bins
0.6
0.7
0.8
0.9
1
1 2 3 4
Mon
thly
sur
viva
l (+/
–95%
CI)
Size bins
Figure 6 Survival estimates for the ‘size, season’ (above,
spring = diamond, summer = triangle, autumn = circle, winter =
square) and the ‘size, Æ’ (below) multi-state capture-mark-recapture
models (Table 4).
Table 4. Model selection data for the multi-state capture-mark-
recapture model of size-dependent survival. Models included variation
among size bins (size) and seasons (season) or no variation among
sizes or seasons (Æ).
Model
Number of
parameters AIC DAIC
Size, season 66 12671 –
Size, Æ 50 12718 47
Æ, season 51 12723 52
Æ, Æ 47 12736 65
Letcher et al. Maintenance of phenotypic variation
Published 2011. This article is a US Government work and is in the public domain in the USA 4 (2011) 602–615 611
over the course of 2 years (Letcher et al. 2004). Labora-
tory studies from the same study also demonstrated that
early-stocked fish could suppress sizes of late-stocked fish,
suggesting that size-based competition made a large con-
tribution to the maintenance of early size structure. Simi-
larly, salmon stocked at high density (Ward et al. 2008)
or emerging from high-density nests (Einum and Nislow
2005) exhibited a higher level of size variation than when
stocked at low densities, further supporting the impor-
tance of size-based competition. At the same time, repeat-
ability of size ranks indicates that processes that would
narrow size distributions are insufficient to counter early-
established ranges of variation. High individual growth
variation could swamp size differences if growth was con-
sistently compensatory over multiple intervals among
individuals in a population or if a subset of individuals
expressed strong compensatory growth (Metcalfe and
Monaghan 2001). We did not observe evidence for either
possibility. Growth among individuals was actually depen-
satory during the first sampling interval (age-0, autumn),
and there was limited evidence for size-dependent growth
for any other interval. In the WB, compensatory growth
appears to be insufficient to overcome size differences
established by age-0 autumn.
Second, repeatability generally sets an upper limit to
the estimates of heritability (Lessells and Boag 1987;
Dohm 2002), suggesting the potential for high heritability
of body size in our system. We estimated heritability
(0.25) that was about one-third of the repeatability, indi-
cating that one-third of the among-individual variation in
length could be attributed to additive genetic effects. Our
estimate of 0.25 for body length is similar to the median
value of 0.29 for body length from a review of heritability
estimates in salmonids (Carlson and Seamons 2008) and
is also similar to a field estimate for BKT (Wilson et al.
2003), but is about one-half of the estimate for a popula-
tion containing sea-run fish (Theriault et al. 2007). Fur-
ther, high repeatability of body length suggests that repeat
measures may not be necessary for heritability estimates
of length. In contrast, like many behavioral traits (Bell
et al. 2009), growth in our system had relatively low val-
ues of repeatability. When repeatability is low, single
observations will not characterize an individual well and
repeat observations are required for reliable estimates of
heritability.
Finally, because we observed high repeatability for body
length and early (age-0, autumn) size differences were lar-
gely maintained over time, a large portion of heritability
for length could actually represent heritability for pro-
cesses that generate the early size differences rather than
those affecting sizes for fish older than age-0. If this is the
case, an evolutionary response to changing environmental
conditions may not act primarily through body size itself,
but more through variation in spawning timing and loca-
tion. In many species of salmonids, there is strong evi-
dence for additive genetic variation for spawning date,
especially for anadromous species (Su et al. 1997; Hendry
et al. 1999; Einum and Fleming 2000; Quinn et al. 2000;
Hendry and Day 2005; Crozier et al. 2008). While little is
known about the evolutionary biology of spawning date
for BKT, our results suggest a focus on the relationships
between autumn spawning date, developmental rate of
alevins and emergence date. Further development of rela-
tionships between experienced water temperature and
otolith microchemistry (Godisksen et al. 2010) of devel-
oping fish will be useful for sorting out relative contribu-
tions of fertilization date and developmental rate on early
body size in BKT.
The wide observed size variation presents a template
upon which size selection can act. We found evidence for
seasonal variation in size selection, but variable strengths
and directions resulted in limited directional selection
over the course of the life of a BKT in our study stream.
Strong environmental change (e.g. climate change or
increased groundwater extraction) or increased anthropo-
genic pressure (e.g. size-selective fishing), however, could
introduce strong selection. Both these sources will reduce
survival of larger fish; climate change through poorer sur-
vival of large fish during dryer, warmer summers (Xu
et al. 2010b), and fishing through the direct removal of
larger fish (Naish and Hard 2008). If large fish produce
large offspring (high heritability), large fish spawn first
and produce early emergers (Doctor and Quinn 2009),
and early emergers also end up large [high repeatability,
(Letcher et al. 2004)], selection against large fish could
result in a shift in average body size directly through
Table 5. Monthly survival estimates and beta parameter (logit link) estimates for the ‘size, Æ’ multi-state capture-mark-recapture model (Table 4).
Beta value confidence intervals of states with the same letters in the final column overlap.
Size state
Survival Beta
Value SE Lower 95% CI Upper 95% CI Value SE Lower 95% CI Upper 95% CI
1 0.88 0.004 0.88 0.89 2.03 0.04 1.95 2.10 A
2 0.87 0.008 0.85 0.88 1.87 0.07 1.73 2.01 AB
3 0.85 0.010 0.82 0.87 1.70 0.08 1.55 1.86 B
4 0.85 0.011 0.83 0.88 1.77 0.09 1.59 1.95 B
Maintenance of phenotypic variation Letcher et al.
612 Published 2011. This article is a US Government work and is in the public domain in the USA 4 (2011) 602–615
heritable pathways. Our results suggest that an important
indirect pathway to an evolutionary response in body size
may be variation in emergence timing, in addition to
direct selection on body size of older fish. In this sce-
nario, the critical, but largely unknown, link is between
adult body size and emergence time. In anadromous spe-
cies, larger fish tend to migrate up rivers earlier and
spawn earlier (Doctor and Quinn 2009), but the relation-
ship between body size and spawn time/emergence date
has not been well studied in stream-dwelling populations
of BKT. For example, we do not know whether BKT that
are large either spawn early or spawn in locations that
produce early emergence. Whatever the exact mechanism,
reduction in variation of body size distributions acting
through changes in emergence timing could have direct
effects on population persistence by limiting contributions
of large fish. Importantly, the reduction in variation of
size distributions could also limit adaptability to future
environmental challenges if loss of phenotypic variation
reflects loss of genotypic variation.
Our results suggest that natural resource management
needs to recognize that actions which affect variation in
body size can affect variation in emergence timing, and
vice versa. Management actions that affect body size are
particularly important for species like BKT that have a
very strong relationship between body size and fecun-
dity. One example of how management actions could
have unanticipated and delayed effects on body size act-
ing through emergence date is stream flow regulation.
In north temperate streams, salmonids emerge during a
highly dynamic flow environment, with high among-year
variation. As a result, the emergence time that best
‘matches’ the requirements of emerging fry varies from
year to year (Armstrong and Nislow 2006). Flow regula-
tion, depending on the timing and magnitude of spring
releases, could select against early-emerging fish (Letcher
et al. 2004; Armstrong and Nislow 2006) that are likely
to achieve large body size. Another management target
with likely strong ecological and evolutionary responses,
size-dependent harvest (Conover and Munch 2002;
Olsen et al. 2004; Theriault et al. 2008), not only will
directly reduce body size range of older fish, but it
could also indirectly limit the range of emergence dates
if larger fish spawn earlier. If body sizes of older fish
are, in fact, highly correlated with emergence dates and
there is body size-related adaptive variation for emer-
gence date, the combined effect of loss of larger fish
with truncation of emergence dates could magnify antic-
ipated evolutionary responses to size-dependent harvest
in BKT. These considerations suggest that maintenance
of variation in emergence timing will be critical for
enhancing future probabilities of BKT population persis-
tence in streams.
Acknowledgements
We thank Matt O’Donnell, Todd Dubreuil, Tyler Evans
and many field assistants. Michael Morrissey and Krzysz-
tof Sakrejda-Leavitt provided assistance with heritability
estimates. The USFS Northern Research Station, the
USGS Conte Anadromous Fish Research Center, and The
Nature Conservancy’s Connecticut River program pro-
vided funding for the project.
Literature cited
Almudevar, A. 2007. A graphical approach to relatedness inference.
Theoretical population biology 71:213–229.
Armstrong, J. D., and K. H. Nislow. 2006. Critical habitat during the
transition from maternal provisioning in freshwater fish, with
emphasis on Atlantic salmon (Salmo salar) and brown trout (Salmo
trutta). Journal of Zoology 269:403–413.
Bell, A. M., S. J. Hankison, and K. L. Laskowski. 2009. The repeatabil-
ity of behaviour: a meta-analysis. Animal Behaviour 77:771–783.
Bolker, B. M., M. E. Brooks, C. J. Clark, S. W. Geange, J. R. Poulsen,
M. H. H. Stevens, and J. S. White. 2009. Generalized linear mixed
models: a practical guide for ecology and evolution. Trends in
ecology & evolution 24:127–135.
Brannon, E. L. 1987. Mechanisms stabilizing salmonid fry emergence
timing. Canadian Special Publication of Fisheries and Aquatic
Sciences 96:120–124.
Carlson, S. M., and T. R. Seamons. 2008. A review of quantitative
genetic components of fitness in salmonids: implications for
adaptation to future change. Evolutionary Applications 1:222–238.
Choquet, R., A. M. Reboulet, R. Pradel, O. Gimenez, and J. D.
Lebreton. 2004. M – SURGE: new software specifically designed for
multistate capture – recapture models. Animal Biodiversity and
Conservation 1:207–215.
Choquet, R., J.-D. Lebreton, O. Gimenez, A.-M. Reboulet, and R.
Pradel. 2009. U-CARE: utilities for performing goodness of fit tests
and manipulating capture recapture data. Ecography 32:1071–1074.
Conover, D. O., and S. B. Munch. 2002. Sustaining fisheries yields over
evolutionary time scales. Science 297:94–96.
Coombs, J. A., B. H. Letcher, and K. H. Nislow. 2010a. PEDAGOG:
software for simulating eco-evolutionary population dynamics.
Molecular Ecology Resources 10:558–563.
Coombs, J. A., B. H. Letcher, and K. H. Nislow. 2010b. PedAgree:
software to quantify error and assess accuracy and congruence for
genetically reconstructed pedigree relationships. Conservation
Genetics Resources 2:147–150.
Crozier, L. G., A. P. Hendry, P. W. Lawson, T. P. Quinn, N. J.
Mantua, J. Battin, R. G. Shaw et al. 2008. Potential responses to
climate change in organisms with complex life histories: evolution
and plasticity in Pacific salmon. Evolutionary Applications 1:252–
270.
Curry, R. A., P. M. Powles, J. M. Gunn, and V. A. Liimatainen. 1991.
Emergence chronology of brook charr, Salvenus fontinalis, alevins in
an acidic stream. Environmental Biology of Fishes 31:25–31.
Curry, R. A., D. L. G. Noakes, and G. E. Morgan. 1995. Groundwater
and the incubation and emergence of brook trout (Salvelinus
fontinalis). Canadian Journal of Fisheries and Aquatic Sciences
52:1741–1749.
Letcher et al. Maintenance of phenotypic variation
Published 2011. This article is a US Government work and is in the public domain in the USA 4 (2011) 602–615 613
Doctor, K. K., and T. P. Quinn. 2009. Potential for adaptation-by-time
in sockeye salmon (Oncorhynchus nerka): the interactions of body
size and in-stream reproductive life span with date of arrival and
breeding location. Canadian Journal of Zoology 87:708–717.
Dohm, M. R. 2002. Repeatability estimates do not always set an upper
limit to heritability. Functional Ecology 16:273–280.
Einum, S., and I. A. Fleming. 2000. Selection against late emergence
and small offspring in Atlantic salmon (Salmo salar). Evolution
54:628–639.
Einum, S., and K. H. Nislow. 2005. Local-scale density-dependent sur-
vival of mobile organisms in continuous habitats: an experimental
test using Atlantic salmon. Oecologia 143:203–210.
Elliott, J. M., and M. A. Hurley. 1998. An individual-based model for
predicting the emergence period of sea trout in a Lake District
stream. Journal of fish Biology 53:414–433.
Falconer, D. S., and T. F. C. Mackay. 1996. Introduction to Quantita-
tive Genetics, 4th edn. Longman Group, Essex, UK.
Garant, D., L. E. B. Kruuk, T. A. Wilkin, and R. H. Mccleery. 2005.
Evolution driven by differential dispersal within a wild bird
population. Nature 433:60–64.
Godisksen, J. A., M. A. Svenning, J. B. Dempson, M. Martilla, A.
Storm-Suke, and M. Power. 2010. Development of a species-specific
fractionation equation for Arctic charr [Salvelinus alpinus (L.)]: an
experimental approach. Hydrobiologia 650:67–77.
Gries, G., and B. H. Letcher. 2002. Tag retention and survival of Age-0
Atlantic Salmon following surgical implantation with passive inte-
grated transponder tags. North American Journal of Fisheries
Management 22:219–222.
Henderson, R. D., F. Day-Lewis, and C. F. Harvey. 2009. Investigation
of aquifer-estuary interaction using wavelet analysis of fiber-optic
temperature data. Geophysical Research Letters 36:L06403.
Hendry, A. P., and T. Day. 2005. Population structure attributable to
reproductive time: isolation by time and adaptation by time.
Molecular ecology 14:901–916.
Hendry, A. P., O. K. Berg, and S. S. Qian. 1999. Condition dependence
and adaptation-by-time: breeding date, life history, and energy
allocation within a population of salmon. Oikos 85:499–514.
Hestbeck, J. B., J. D. Nichols, and R. A. Malecki. 1991. Estimates of
movement and site fidelity using mark-resight data of wintering
Canada geese. Ecology 72:523.
Hudy, M., T. M. Thieling, N. Gillespie, and E. P. Smith. 2008. Distri-
bution, status, and land use characteristics of subwatersheds within
the native range of Brook Trout in the Eastern United States. North
American Journal of Fisheries Management 28:1069–1085.
Hughes, N. F. 1992. Ranking of feeding positions by drift-feeding
Arctic Grayling (Thymallus arcticus) in dominance hierarchies.
Canadian Journal of Fisheries and Aquatic Sciences 49:1994–1998.
Hutchings, J. A. 1996. Adaptive phenotypic plasticity in brook trout,
Salvelinus fontinalis, life histories. Ecoscience 3:25–32.
King, T. L., S. E. Julian, R. L. Coleman, and M. K. Burnham-Curtis.
2003. Isolation and characterization of novel tri- and tetra-nucleo-
tide microsatellite DNA markers for brook trout Salvelinus fontinalis.
Genbank submission numbers: AY168186, AY168187, AY168189,
AY168191, AY168192, AY 168193, AY168194, AY168195, AY168197,
AY168198, AY168199. Available at http://www.ncbi.nlm.nih.gov/
nucleotide/.
King, T. L., M. S. Eackles, and B. H. Letcher. 2005. Microsatellite DNA
markers for the study of Atlantic salmon (Salmo salar) kinship,
population structure, and mixed-fishery analyses. Molecular Ecology
Notes 5:130–132.
Kruuk, L. E. B. 2004. Estimating genetic parameters in natural popula-
tions using the ‘‘animal model’’. Philosophical transactions of the
Royal Society of London. Series B, Biological sciences 359:873–890.
Kruuk, L. E. B., and J. D. Hadfield. 2007. How to separate genetic and
environmental causes of similarity between relatives. Journal of evo-
lutionary biology 20:1890–1903.
Kruuk, L. E. B., J. Slate, and A. J. Wilson. 2008. New answers for old
questions: the evolutionary quantitative genetics of wild animal
populations. Annual Review of Ecology Evolution and Systematics
39:525–548.
Lebreton, J. D., and R. Pradel. 2002. Multistate recapture models:
modelling incomplete individual histories. Journal of Applied Statis-
tics 29:353–369.
Lessells, C. M., and P. T. Boag. 1987. Unrepeatable repeatabilities: a
common mistake. The Auk 104:116–121.
Letcher, B. H., and G. E. Horton. 2008. Seasonal variation in size-
dependent survival of juvenile Atlantic salmon (Salmo salar):
performance of multistate capture-mark-recapture models. Canadian
Journal of Fisheries and Aquatic Sciences 65:1649–1666.
Letcher, B. H., G. Gries, and F. Juanes. 2002. Survival of stream-dwelling
Atlantic Salmon: effects of life history variation, season, and age.
Transactions of the American Fisheries Society 131:838–854.
Letcher, B. H., T. L. Dubreuil, M. J. O’Donnell, M. Obedzinski, K.
Griswold, and K. H. Nislow. 2004. Long-term consequences of
variation in timing and manner of fry introduction on juvenile Atlan-
tic salmon (Salmo salar) growth, survival, and life-history expression.
Canadian Journal of Fisheries and Aquatic Sciences 61:2288–2301.
Letcher, B. H., K. H. Nislow, J. A. Coombs, M. J. O’Donnell, and T. L.
Dubreuil. 2007. Population response to habitat fragmentation in a
stream-dwelling brook trout population. PLoS ONE 2:e1139.
McFadden, J. T. 1961. A population study of the brook trout, Salveli-
nus fontinalis. Wildlife Monographs 7:3–73.
McGuigan, K. 2006. Studying phenotypic evolution using multivariate
quantitative genetics. Molecular ecology 15:883–896.
Metcalfe, N. B., and P. Monaghan. 2001. Compensation for a bad start:
grow now, pay later. Trends in Ecology and Evolution 16:254–260.
Naish, K. A., and J. J. Hard. 2008. Bridging the gap between the geno-
type and the phenotype: linking genetic variation, selection and
adaptation in fishes. Fish and Fisheries 9:396–422.
Olsen, E. M., M. Heino, G. R. Lilly, M. J. Morgan, J. Brattey, and B.
Ernande, U. Dieckmann. 2004. Maturation trends indicative of rapid
evolution preceded the collapse of northern cod. Nature 428:4–7.
Pelletier, F., T. Clutton-Brock, J. Pemberton, S. Tuljapurkar, and T.
Coulson. 2007. The evolutionary demography of ecological change:
linking trait variation and population growth. Science 315:1571–
1574.
Pemberton, J. M. 2008. Wild pedigrees: the way forward. Proceedings
of Biological sciences/The Royal Society 275:613–621.
Power, G., R. S. Brown, and J. G. Imhof. 1999. Groundwater and fish
– insights from northern North America. Hydrological processes
13:401–422.
Quinn, T. P., M. J. Unwin, and M. T. Kinnison. 2000. Evolution of
temporal isolation in the wild: genetic divergence in timing of
migration and breeding by introduced chinook salmon populations.
Evolution 54:1372–1385.
Rodriguez-Munoz, R., A. Bretman, J. Slate, C. A. Walling, and T.
Tregenza. 2010. Natural and sexual selection in a wild insect
population. Science 328:1269–1272.
Skelly, D. K., L. N. Joseph, H. P. Possingham, L. K. Freidenburg, T.
J. Farrugia, M. T. Kinnison, and A. P. Hendry. 2007. Evolution-
Maintenance of phenotypic variation Letcher et al.
614 Published 2011. This article is a US Government work and is in the public domain in the USA 4 (2011) 602–615
ary responses to climate change. Conservation Biology 21:1353–
1355.
Snucins, E. J., R. A. Curry, and J. M. Gunn. 1992. Brook trout
(Salvelinus fontinalis) embryo habitat and timing of alevin
emergence in a lake and a stream. Canadian Journal of Zoology
70:423–427.
Su, G., L. Liljedahl, and G. A. E. Gall. 1997. Genetic and environmen-
tal variation of female reproductive traits in rainbow trout
(Oncorhynchus mykiss). Aquaculture 154:115–124.
Theriault, V., D. Garant, L. Bernatchez, and J. J. Dodson. 2007. Herita-
bility of life-history tactics and genetic correlation with body size in
a natural population of brook charr (Salvelinus fontinalis). Journal
of evolutionary biology 20:2266–2277.
Theriault, V., E. S. Dunlop, U. Dieckmann, L. Bernatchez, and J. J.
Dodson. 2008. The impact of fishing-induced mortality on the evo-
lution of alternative life-history tactics in brook charr. Evolutionary
Applications 1:409–423.
Wang, J. L. 2004. Sibship reconstruction from genetic data with typing
errors. Genetics 166:1963–1979.
Ward, D. M., K. H. Nislow, and C. L. Folt. 2008. Predators reverse the
direction of density dependence for juvenile salmon mortality.
Oecologia 156:515–522.
Wilson, A. J., J. A. Hutchings, and M. M. Ferguson. 2003. Selective
and genetic constraints on the evolution of body size in a stream-
dwelling salmonid fish. Journal of evolutionary biology 16:584–594.
Wilson, A. J., D. Reale, M. N. Clements, M. M. Morrissey, E. Postma,
C. A. Walling, L. E. B. Kruuk et al. 2010. An ecologists guide to the
animal model. Journal of Animal Ecology 79:13–26.
Xu, C. L., B. H. Letcher, and K. H. Nislow. 2010a. Context-specific
influence of water temperature on brook trout growth rates in the
field. Freshwater Ecology 55:2253–2264.
Xu, C. L., B. H. Letcher, and K. H. Nislow. 2010b. Size-dependent
survival of brook trout Salvelinus fontinalis in summer: effects of
water temperature and stream flow. Journal of Fish Biology
76:2342–2369.
Zydlewski, G. B., G. Horton, T. L. Dubreuil, B. H. Letcher, S. Casey,
and J. Zydlewski. 2006. Remote monitoring of fish in small streams:
a unified approach using PIT tags. Fisheries 31:492–502.
Supporting Information
Additional Supporting Information may be found in the online version
of this article:
Figure S1. Traces and densities of body length (X1) and growth rate
in length (X2) for repeatabilities (above) and heritabilities (below).
Table S1. Single locus summary statistics for young-of-year brook
trout captured in the West Brook stream complex.
Table S2. Genetic covariances between growth rate in length and
body size at the beginning of the growth interval (2.5% and 97.5%
credible interval).
Please note: Wiley-Blackwell are not responsible for the content or
functionality of any supporting materials supplied by the authors. Any
queries (other than missing material) should be directed to the corre-
sponding author for the article.
Letcher et al. Maintenance of phenotypic variation
Published 2011. This article is a US Government work and is in the public domain in the USA 4 (2011) 602–615 615