Embed Size (px)
Citation preview

Maintenance Costs for Aging Aircraft
2018
1st Edition

Maintenance Costs for Aging Aircraft, 1st editionISBN 978-92-9229-637-7© 2018 International Air Transport Association. All rights reserved.Montreal—Geneva
NOTICEDISCLAIMER. The information contained in this publication is subject to constant review in the light of changing government requirements and regulations. No subscriber or other reader should act on the basis of any such information without referring to applicable laws and regulations and/or without taking appropriate professional ad-vice. Although every effort has been made to ensure accuracy, the International Air Transport Association shall not be held responsible for any loss or damage caused by errors, omissions, mis-prints or misinterpretation of the contents hereof. Furthermore, the International Air Transport As-sociation expressly disclaims any and all liabil-ity to any person or entity, whether a purchaser of this publication or not, in respect of anything done or omitted, and the consequences of any-thing done or omitted, by any such person or en-tity in reliance on the contents of this publication.
Opinions expressed in advertisements appearing in this publication are the advertiser’s opinions and do not necessarily reflect those of IATA. The mention of specific companies or products in advertisement does not imply that they are endorsed or recom-mended by IATA in preference to others of a simi-lar nature which are not mentioned or advertised.
© International Air Transport Association. All Rights Reserved. No part of this publication may be reproduced, recast, reformatted or trans-mitted in any form by any means, electronic or mechanical, including photocopying, record-ing or any information storage and retrieval sys-tem, without the prior written permission from:
Vice-PresidentSafety and Filight Operations
International Air Transport Association800 Place VictoriaMontreal, QuebecCANADA H4Z 1M1

1st Edition 2018 i
Table of Contents
Introduction ................................................................................................................................................. 1 Section 1—
Aging Defined ............................................................................................................................................ 2 Section 2—
2.1 Technical Aging ...............................................................................................................................................................................2
2.2 Economic Aging ............................................................................................................................................................................. 3
2.3 Financial Aging ............................................................................................................................................................................... 4
2.4 The Purposes of Technical, Economic and Financial Aging .................................................................................... 4
Elements Affecting Aging ....................................................................................................................... 5 Section 3—
3.1 Routine Maintenance ................................................................................................................................................................... 5
3.2 Non-Routine Maintenance ........................................................................................................................................................ 6
3.3 Airworthiness Directives and Service Bulletins .............................................................................................................. 6
Challenges of Collecting Data ............................................................................................................... 8 Section 4—
4.1 Accuracy ............................................................................................................................................................................................. 8
4.2 Consistency ...................................................................................................................................................................................... 8
4.3 Automation........................................................................................................................................................................................ 9
4.4 Operational Changes ................................................................................................................................................................... 9
Guidelines to Produce an Aging Curve ............................................................................................... 11 Section 5—
5.1 Approach ............................................................................................................................................................................................11
5.2 Guidelines ......................................................................................................................................................................................... 12
5.2.1 Using the Maintenance Information System ........................................................................................................... 12
5.2.2 Step by Step Methodology ............................................................................................................................................... 12
Glossary .................................................................................................................................................... 16 Section 6—
Contributors .............................................................................................................................................. 17 Section 7—
Maintenance Costs for Aging Aircraft
ii 1st Edition 2018
INTENTIONALLY LEFT BLANK

1st Edition 2018 1
Introduction Section 1—
Estimating the evolution of maintenance costs through the entire life of an aircraft can be a challenge. The
purpose of this paper is to provide a standardized methodology for industry stakeholders to determine the
long term impact of airframe aging on maintenance costs.
This publication defines three types of aircraft aging (technical, economic and financial), what factors can
influence them, and how they can be measured.
Various parameters influence maintenance costs, such as routine and non-routine maintenance, service
bulletins (SB) and airworthiness directives (AD).
Quantifying the evolution of maintenance costs requires to collect data throughout the life of the airframe.
Data accuracy and consistency are critical.
This document proposes an approach and guidelines to produce curves based on direct maintenance costs
by tail number.
This paper is intended for airline personnel in technical divisions, especially fleet managers, and cost control
personnel.
It is the first attempt to quantify the effect of aging on maintenance costs; therefore, any comments are
encouraged, and will possibly be incorporated in a future revised edition.
IATA’s Maintenance Cost Task Force (MCTF) is the owner of this publication, which was written in
collaboration with airlines and IATA strategic partners. Comments from other industry stakeholders are
welcome at: [email protected].

Maintenance Costs for Aging Aircraft
2 1st Edition 2018
Aging Defined Section 2—
It is necessary to define the term Aging to characterize the long term impact on aircraft maintenance costs.
The following types of aging are used for different purposes:
● Technical Aging
● Economic Aging
● Financial Aging
2.1 Technical Aging
Technical aging is the inherent effect of age on the aircraft over time. Materials degrade with time, and each
aircraft sub-assembly ages at its own rate depending on calendar time and flight hours and cycles. The total
aircraft’s aging is found by the combination of the aging of all its individual components.
Technical aging is influenced by the following factors, which define the operator’s context:
● Aircraft design, technology and material (aluminum, titanium, steel, composites…)
● Scope of the maintenance (MPD, cabin, specific operator program, modifications)
● Maintenance program (check interval: block concept, semi or fully equalized)
● Maintenance planning: tasks packaging, out of phase tasks
● Maintenance and engineering: organization, staff, number of mechanics, shift
● Maintenance practices and policies
● Operating parameters: aircraft utilization (cyclic and hourly effects) and operations (network)
● Aircraft performance, reliability
● Geographical location (region) and operational environment (temperature, humidity, salt, dust, pollution,
etc.)
The following technical aging parameters can be measured:
● Number of Routine tasks
● Routine MHs
● Number of Non-Routine tasks
● Non-Routine MHs
● Finding rates
● Part replacement rates
● Grounding time (A/C operational availability)
Aging Defined
1st Edition 2018 3
Based on the operator’s context, technical aging can be characterized by generating some profiles of the
measured parameters over time.
As a result, for a specific aircraft type, technical aging may vary depending on the operator’s context, leading
to dispersion in the results.
Certain operator's decisions affect overall aircraft work. These decisions are not directly linked to technical
aging; however, many times, it is not easy to segregate them from other activities. Such examples include:
aircraft leasing (especially related to lease return conditions and, in certain cases, to operational/
maintenance conditions), marketing, etc.
2.2 Economic Aging
Economic aging is the inherent effect of age on the aircraft over time factored by economic data.
The cost of the maintenance is paid at the time that each maintenance event occurs.
Economic Aging = Technical Aging (operator context) × $
Economic aging is influenced by the following factors:
● Maintenance market and geographical region of the maintenance activities
● Labor rates
● Labor efficiencies
● Economic conditions, such as price escalations and exchange rates
● Make-or-Buy policy: in-house/subcontracted, Time & Material, Power By the Hour
● Contracts (when maintenance is sub-contracted: man-hour caps, material caps, reduction factors)
The following economic aging parameters can be measured over time:
● Labor costs
● Material and inventory-related costs
● In-house, subcontracted costs
● Maintenance costs by segment: Line, Base, Heavy, Components, Engine
● Total aircraft maintenance costs
Based on a set of economic factors, the economic aging can be characterized by generating maintenance
event cash flows of the measured parameters over time.
These economic factors generate further dispersion in the results.

Maintenance Costs for Aging Aircraft
4 1st Edition 2018
2.3 Financial Aging
When the maintenance costs are not paid at the time that the maintenance event occurs, they may be
provisioned. Financial aging is the method used to account for these provisions.
Financial aging is influenced by various factors such as:
● Operator financial policy
● Profit and loss
● Accounting system
● Budget
The following financial aging parameters can be measured over time:
● Provision for labor costs, material costs
● Provision for routine costs, non-routine costs
● Provision for maintenance costs by segment: line, base, heavy, components, engine
● Provision for in-house, subcontracted costs
There are as many financial aging profiles as financial policies, resulting in as many different cash flow
distributions over the aircraft life.
2.4 The Purposes of Technical, Economic and Financial Aging
Technical, economic and financial aging have different purposes. Technical and economic aging are used to
estimate the aging effect on the aircraft itself. The purpose of financial aging is to plan the budget and build
provisions for future expenses (although very difficult to predict).
Understanding aircraft aging is critical for the fleet management to decide when an aircraft needs to be
replaced. This decision process has to be performed with a global approach, considering:
● The aircraft direct operating costs, with a focus on:
o the maintenance event cost cash flow (Economic Aging), in particular the engine fleet maintenance
policy
o the fuel costs
o other costs (training, inventory/spares, tooling, leasing/financing, etc.)
● The supply and demand for the substitute aircraft: new aircraft from OEM (slots availability) or leased
aircraft (new, mature, old with associated lease costs, and the cabin reconfiguration cost to integrate the
existing fleet).
● The aircraft residual value (engine, major components, LRUs, airframe) influenced by the market

1st Edition 2018 5
Elements Affecting Aging Section 3—
It is recognized that maintenance costs increase with the age of the aircraft, also known as the Aging effect
on direct maintenance costs. This increase can be explained by three main reasons, each of them being
influenced by various parameters.
3.1 Routine Maintenance
The first reason for the increase in Maintenance cost due to age is linked to the Routine maintenance1: the
number of Routine tasks to maintain the aircraft increases with age. This is mechanical: independently of the
aircraft utilization, as the aircraft ages, and there are additional tasks to perform. This is driven by the
scheduled maintenance as defined by the maintenance program documents such as the A/C manufacturer’s
MPD, the OEMs' requirements and the specific operator’s maintenance related program for the aircraft and
the cabin.
Standard Routine Maintenance
The OEM’s maintenance planning document provides inspection thresholds and intervals for the various
parts of the aircraft. These inspections will result in more frequent findings as the aircraft gets older, thus
increasing the costs of repair during these standard maintenance times (line checks and heavy maintenance
visits). The rectification of these findings leads to non-routine maintenance, as described in the section 3.2.
Third Party Component Routine Maintenance
Third party components represent a substantial part of the maintenance costs. The engines routine
maintenance typically comprises about half of the total maintenance costs of an aircraft. Additionally, the
APU and the landing gear are also components that have expensive routine maintenance. These components
tend to have costly full overhauls at specific times in their life cycle that return them to a nearly new state.
When investigating the retirement of an aircraft, determining if there are any upcoming major overhauls is
highly recommended in order not to pay for an overhaul just before retiring an aircraft.
Limit of Validity Incurred Maintenance
FAR 25.571, 26.21 and 26.23 require the development of a Limit of Validity (LOV) for aircraft above 75,000 lbs
MTGW. The LOV represents the period of time (expressed in FC, FH) during which it has been demonstrated
that widespread fatigue damage (WFD) will not occur in the airplane structure. The aircraft cannot be
operated beyond the LOV without structural modifications that will preclude the WFD and defer the LOV.
1 That maintenance performed at defined intervals to retain an item in a serviceable condition, by systematic inspection, detection
replacement of wearout items, adjustment, calibration, cleaning, etc. (Source: ATA CSSD Revision 2014-1; 2200, WATOG)

Maintenance Costs for Aging Aircraft
6 1st Edition 2018
The LOV is limited to subset of structures only (fatigue critical structures declared as WFD sensitive). System
components and other structural elements may have different limits.
When investigating the costs of maintaining an aging aircraft, the mandatory maintenance activities to
comply with WFD regulations represents significant costs.
First, there is the Inspection Start Point (ISP). This is the point in time when special inspections are initiated
due to a specific probability of having WFD. At this point, regular repeat structural inspections are required.
These inspections often result in high costs associated with unexpected downtime for repairs when a
problem is found, plus the costs of the repairs themselves.
Additionally, there is a cost associated with the Structural Modification Point (SMP). The SMP is the point in
time when a mandatory structural modification has to be performed to preclude WFD. The SMP traditionally
takes the form of a mandated SB that must occur before a specific cycle. The nature of these modifications
generally makes them a very expensive one-time investment on the aircraft. SMP modifications can be
scheduled during heavy maintenance to avoid extensive additional ground time.
Once the SMP SB is implemented, there may be additional SMPs at higher cycles to continue to extend the
life of the airplane. After all of these investments in the aircraft are completed, the aircraft will eventually
reach LOV and will be no longer deemed airworthy, safe for service.
3.2 Non-Routine Maintenance
The second reason for increasing costs is linked to the Non-Routine maintenance: the material properties
weaken over time due to the environment, the stress of normal operation and the system utilization. This can
generate findings (fatigue, damage tolerance) like cracks or corrosion, which are expected to increase over
time, until the part is repaired or replaced.
The need for Non-Routine maintenance can be identified by Routine maintenance inspections or by
unexpected faults and failures. Though structures are qualified for continuous airworthiness requirements,
the aircraft structures are been sized for a design life objective, when the aircraft is approaching this target
the probability of having findings increases. Cracks may initiate but are controlled through inspections to
prevent failure of material.
3.3 Airworthiness Directives and Service Bulletins
As the aircraft ages, mandatory maintenance actions and component replacements tend to increase in the
form of additional Service Bulletins (SBs) and Airworthiness Directives (ADs). These will increase the ongoing
maintenance costs.

Elements Affecting Aging
1st Edition 2018 7
These ADs and SBs affect costs in 2 major ways:
● One-time cost when a solution has been developed for a specific limitation of a component. The airline
then replaces or modifies the part, and there are no additional costs beyond that.
● Ongoing costs when a safety issue is discovered and no fix is readily available, repetitive inspections are
often required. There may also be repairs which are not permanent and which will call for additional
inspections. These can be expensive because they can be time consuming. Additionally, when an issue is
discovered, there can be unplanned ground time in order to fix the issue.
Structural issues develop over time with crack and corrosion findings increasing with the age of the aircraft.
These issues require regular updates of the baseline maintenance program (MRBR, ALS and CPCP) as well
as the creation of SBs and ADs to mitigate future occurrences if it affects the continuous airworthiness of the
airplane. As the crack and corrosion findings become more severe or occur in critical areas, the costs of
individual repairs increase as does the downtime.
Other issues related to aging aircraft and additional work required are related to electric wiring and to the
fuel tanks.
Additionally, the regulatory agency may mandate new requirements that were not part of the original OEM
design and must be retrofitted into the aircraft. Items like the ATN-Datalink, lavatory oxygen, and cockpit
security door are some of the many examples of these types of ADs. These tend to increase in the mid-life of
the aircraft then taper off as they approach their end of life.

Maintenance Costs for Aging Aircraft
8 1st Edition 2018
Challenges of Collecting Data Section 4—
Collecting data related to the maintenance trends over the life of the aircraft represents a sizable challenge
for a number of interrelated reasons: data accuracy, data consistency, and airline maintenance operational
consistency. Ideally, in order to accurately assess the evolution of the maintenance costs over the life of the
aircraft, consistent data over a span of at least two decades would be required from multiple operators in
multiple global regions. As a best practice, it is recommended to collect and analyze data during an aircraft's
maintenance cycle (usually around 6 years - the interval between major airframe events).
4.1 Accuracy
The first critical factor of data collection is the accuracy of the data itself.
This issue results from processes and procedures that are both top-down and bottom-up. Inherently, the
accuracy of the data is related to the mechanic that is doing the work, as well as the inventory tracking
system associated with it. If the hours required to complete a task are not properly documented and the
associated material cost not properly tied to that specific task and aircraft, then the accuracy of the reported
numbers is already in question.
This effect can be magnified by a multitude of other causes, including costs that are allocated to maintenance
without being tied to the actual maintenance work. This may include training costs, initial and ongoing
tooling costs, or spares costs, including engine spares. It can also take the form of overhead costs being
rolled into the direct maintenance costs. These overhead costs may be allocated as the total overhead costs
divided by either the number of aircraft in the fleet (or the flight hours or another useful parameter).
While these issues are numerous, additional layers of interactions by different groups may diminish the
quality of the data even further before it has reached the person preparing the operational and maintenance
cost dataset.
4.2 Consistency
Data consistency relates to the capacity of the data to be examined over time using the same approach and
methodology.
The first obstacle to this is the relatively minimal chance that an airline will be able to report these costs every
year or even every other year for 20 or more years. To accurately assess the impact of aging, data must be
collected over a wide timeframe. This difficulty is compounded by the fact that the person reporting this data
may change over time. This may result in another data source being used, a different methodology, or the
complete cessation of reporting activity. Accounting for these changes is a significantly more difficult task, as
it requires a deep level of interaction with the staff in charge of reporting.

Challenges of Collecting Data
1st Edition 2018 9
The airlines performing the work may be classifying their checks differently as well. This makes comparing
them very difficult.
For this exercise and for accurate benchmarking purpose, maintenance checks should be classified as
follows:
● Transit check - line: pre-flight check, including ETOPS
● Daily/Overnight check - line: performed every 24 to 48 hours
● Weekly check – line: performed every 7 to 14 days
● A-check: performed every 300-500 flight hours which usually happens every 3-4 months
● Heavy check:
o C-check: usually performed every 18-24 months or 5,000-6,000 FH. Also known as Light C-check
o D-check: usually happening every 5-6 years (also known as Heavy C-check or Heavy Maintenance
check)
● Out-of-phase events
Airlines with large fleets of aircraft manufactured at different times may have a unique opportunity to assess
effects of aging. Taking a snapshot of various events (and related man-hours and costs) over 2-3 years can
produce enough data points that cover many different aircraft ages.
4.3 Automation
The development of IT solutions for maintenance information systems over the last few years represent a
significant progress. However, there is still a lack of automation in data collection. Many times, various legacy
airline systems keep different records, making it a challenge to integrate them.
4.4 Operational Changes
Perhaps the most difficult task to overcome relates to how an airline handles maintenance operations for an
aircraft over time.
This, in particular, can be examined in relation to MRO involvement. The industry has seen an increasing
amount of maintenance performed by MROs in the past decades. If there is an attempt to examine aircraft
aging and the impact on check costs, any data reported by an airline that moved from in-house to MRO or
vice versa, or used different MROs would be very difficult. If enough data is reported from different airlines
with important changes in maintenance procedures, it might be possible to derive correlations between the
subcontract/in-house split and maintenance costs. However, this is not the only example of such operational
changes. These could range from changes in MPD via check escalation to changes in worker productivity or
global parts’ prices. Even partially normalizing for all of these factors is a significant task that would
necessitate an in-depth knowledge of the maintenance operations of each reporting airline. It will also require
large numbers of data to ensure statistically significant results.

Maintenance Costs for Aging Aircraft
10 1st Edition 2018
Is maintenance cost data impossible to collect in sufficient quality, accuracy, and consistency to produce
aging curves from the data? This question must drive the approach to creating an industry standard aging
curve.
While this process may be difficult now, the situation moving forward may be very different. Collecting
maintenance cost data from a central, standardized electronic database would provide the means to ensure
the data quality is sufficient for use in preparing actual aging curves.
Furthermore, employing a standard approach to cataloging maintenance costs, even prior to their collection,
is beneficial for airlines in that it would help them track costs more accurately on their own. Presenting the
data collection procedures as being a benefit to both the industry as a whole and the individual reporting
airlines is key to ensure that there is enough data for meaningful analysis.

1st Edition 2018 11
Guidelines to Produce an Aging Curve Section 5—
5.1 Approach
In this section, guidelines are provided to produce aging curves for the aircraft direct maintenance cost
(DMC) over time, using the operator’s data in its context. Based on the type of data available, accuracy,
quality, format and granularity, the aging curves can cover the total aircraft direct maintenance costs (Labor
+ Material) or a more limited portion of the direct maintenance costs (ex: A-check MHs only).
The data has to allow the characterization of the direct maintenance costs according to the operator’s
maintenance program (Routine, Non-Routine). Each maintenance category (line, A-check, C-check, etc.) can
be segregated into different scope of maintenance: MPD, Additional Work, Cabin, Specifics..., whether the
requirement is coming from the OEMs, the operator, the authorities/regulations or other stakeholder (e.g.
lessor).
Figure 1: Cost Breakdown by Maintenance Category and Scope
Each cell of the grid in Fig. 1 (ex: C-check MPD) can be characterized by its direct maintenance costs as the
sum of the Labor and Material costs.
Considering this data over the years, it is possible to produce aging curves.

Maintenance Costs for Aging Aircraft
12 1st Edition 2018
5.2 Guidelines
The aim is to produce an aging curve using the DMC for individual aircraft (i.e. tail number) over time.
5.2.1 Using the Maintenance Information System
Ideally, the data will be exported from the airline's MIS. The system can be configurated appropriately to
provide data points automatically by aircraft tail number. This will ensure the best possible data quality and
consistency.
Example of MIS requirements:
● aircraft tail number
● aircraft age
● type of maintenance event (as described in section 4.2)
● date of event
● duration of event
● content (man-hours, material consumption, outside repairs, etc.)
● operational data (flight hours, flight cycles, etc.)
5.2.2 Step by Step Methodology
This section describes the steps to produce the aging curves.
● Describe your context:
o aircraft type,
o aircraft annual utilization,
o maintenance program (checks, interval),
o maintenance concept (block/equalized/…),
o maintenance make-or-buy policy (in-house/sub-contracted/mix),
o region,
o labor rate,
o yearly economic escalation,
o etc.
● Define the framework of your analysis:
o the same aircraft and engine type

Guidelines to Produce an Aging Curve
1st Edition 2018 13
o similar maintenance (program, planning, …)
o similar utilization
● Collect the costs per event and categorize your data (MHs, Labor cost, Material cost, …)
o by maintenance category (Line, A-check, C-check, Heavy check, Components, Engine)
o scope (MPD, Cabin, Specifics, …)
o with the split Routine / Non-Routine
o per year
According to the data available, the scope can be reduced to a limited portion of the aircraft DMC.
● Clean the data if necessary: remove any obvious outliers (e.g. the minimum and maximum values) by
looking at the data distribution
● Apply your own yearly escalation factor to put all the costs in the same year of study: only on costs,
not on MHs
● Plot the raw data: one graph per maintenance category, per scope, per Routine / Non-Routine or
Routine + Non-Routine, and based on the points, identify a preliminary trend to model the points
Figure 2: Reported Man-hours
In this case (Fig. 2), it looks like a linear trend would fit.
● Normalize the data: Consider the initial value of period, then divide all the data by this value. For
example, if you have 1,000 man-hours during the first year of operations, divide all the values by 1,000 to
get normalized man-hours.
● Plot the normalized data

Maintenance Costs for Aging Aircraft
14 1st Edition 2018
Figure 3: Normalized Man-hours
In this example (Fig. 3), the average is taken over the period 0-20 Years.
● Identify trends: Least square method (R-squared to be the closest to 1), inflexion points, and aging
factors. There can be different factors according different periods considered.
Figure 4: Trend Lines
In this example (Fig. 4), it is possible to model the same batch of data with different trends. Linear and
polynomial approaches show the highest R-squared values close to 1, so both trends are acceptable to model
the data. The linear trend shows an increase of 3.24% per year. Note that R-squared computation is
Guidelines to Produce an Aging Curve
1st Edition 2018 15
theoretically valid for linear trend only, however Microsoft Excel derives this method to compute R-squared for
other trends as well.
In most cases (and for an experienced user), an overview of all plotted data may provide a best curve fit.
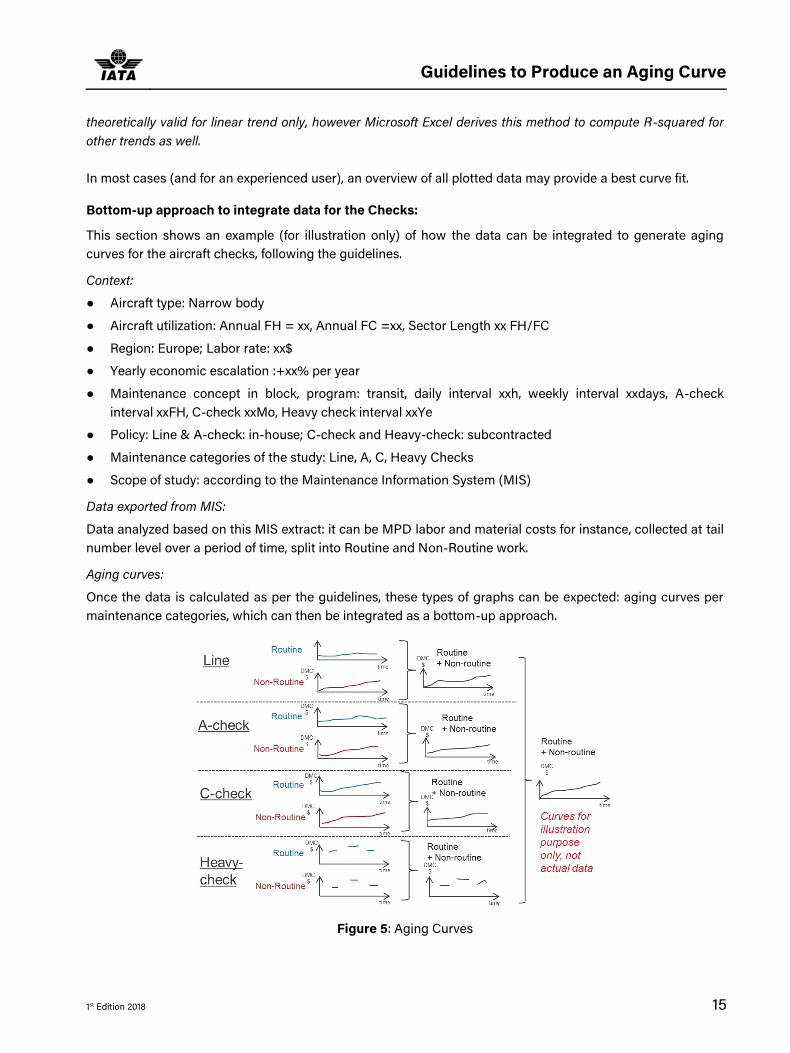
Bottom-up approach to integrate data for the Checks:
This section shows an example (for illustration only) of how the data can be integrated to generate aging
curves for the aircraft checks, following the guidelines.
Context:
● Aircraft type: Narrow body
● Aircraft utilization: Annual FH = xx, Annual FC =xx, Sector Length xx FH/FC
● Region: Europe; Labor rate: xx$
● Yearly economic escalation :+xx% per year
● Maintenance concept in block, program: transit, daily interval xxh, weekly interval xxdays, A-check
interval xxFH, C-check xxMo, Heavy check interval xxYe
● Policy: Line & A-check: in-house; C-check and Heavy-check: subcontracted
● Maintenance categories of the study: Line, A, C, Heavy Checks
● Scope of study: according to the Maintenance Information System (MIS)
Data exported from MIS:
Data analyzed based on this MIS extract: it can be MPD labor and material costs for instance, collected at tail
number level over a period of time, split into Routine and Non-Routine work.
Aging curves:
Once the data is calculated as per the guidelines, these types of graphs can be expected: aging curves per
maintenance categories, which can then be integrated as a bottom-up approach.
Figure 5: Aging Curves

Maintenance Costs for Aging Aircraft
16 1st Edition 2018
Glossary Section 6—
A/C Aircraft
ALS Approach/Landing System
APU Auxiliary Power Unit
ATN Aeronautical Telecommunications Network
CPCP Corrosion Prevention and Control Program
AD Airworthiness Directives
DMC Direct Maintenance Cost
ETOPS Extended-range Twin-engine Operation Performance Standards
FAR Federal Aviation Regulation
FC Flight Cycle
FH Flight Hour
ISP Inspection Start Point
LOV Limit of Validity
LRU Line Replacement Unit
MH Man-hour
MIS Maintenance Information System
MRBR Maintenance Review Board Report
MPD Maintenance Planning Document
MRO Maintenance, Repair and Overhaul
MTGW Maximum Takeoff Gross Weight
OEM Original Equipment Manufacturer
SB Service Bulletin
SMP Structural Modification Point
WFD Widespread Fatigue Damage
1st Edition 2018 17
Contributors Section 7—
Thibaut CONTAMIN (Airbus)
Geraldine CROS (IATA)
Philippe L. HORN (Boeing)
Kenneth J. MAGILL (Boeing)
Rafael MARIN-SEBASTIAN (Airbus)
Chris MARKOU (IATA)
Maintenance Costs for Aging Aircraft
18 1st Edition 2018
INTENTIONALLY LEFT BLANK