Embed Size (px)
Citation preview
OR I G I N A L R E S E ARCH
Maintaining Glycemic Control When Transitioning From InfusionInsulin: A Protocol-Driven, Multidisciplinary ApproachPedro Ramos, MD
1
Diana Childers, MD1
Greg Maynard, MD, MSc1
Kevin Box, Pharm D2
Jennifer Namba, Pharm D2
Kelli Stadalman, Pharm D2
Marian Renvall, MS3
1Division of Hospital Medicine, UCSD Medical Center, San Diego, California.
2Department of Pharmacy, Skaggs School of Pharmacy and Pharmaceutical Sciences,University of California San Diego, San Diego, California.
3Division of General Internal Medicine, UCSD Medical Center, San Diego, California.
Disclosure: This study was funded by a research grant from the American Society of Health-SystemPharmacists (ASHP) Research and Education Foundation.
Background: An observational pilot study of 41 medical and surgical intensive care patients on infusion insulin at our own
institution found that glycemic control rapidly deteriorated within 48 hours of stopping infusion insulin. This prompted the
design and testing of a transition protocol.
Methods: The transition protocol identified appropriate patients for subcutaneous (SC) insulin along with the insulin dose
and schedule. A pharmacist-hospitalist improvement team offered protocol guidance but adherence was left to the discretion
of the provider. The primary endpoints were mean blood glucose the first and second day after stopping the insulin infusion
and the number of patients with hypoglycemia (41-70 mg/dL) and severe hypoglycemia (<40 mg/dL) during the 48-hour
transition. Secondary endpoints include severe hyperglycemia (>300 mg/dL), length of stay (LOS), re-initiation of the
infusion insulin, day-weighted glucose mean 12 days following transition for patients with diabetes, and identification of a
new diagnosis of diabetes.
Results: Patients with diabetes transitioned by protocol (n ¼ 33) had better glycemic control than those (n ¼ 39)
transitioned without the protocol (Day 1 population glucose mean of 168 mg/dL vs. 211 mg/dL [P<0.001], Day 2 means of
176 mg/dL vs 218 mg/dL [P<0.001]). Severe hypoglycemia occurred once in each group. There were 14 patients newly
diagnosed with diabetes based on an A1c �6%. Patients with stress hyperglycemia maintained good glycemic control with
correctional insulin only.
Conclusion: Protocol adherence improved glycemic control, reduced unnecessary use of insulin, and identified patients with
previously undiagnosed diabetes, without any increase in hypoglycemia. Journal of Hospital Medicine 2010;5:446–451.
VC 2010 Society of Hospital Medicine.
KEYWORDS: diabetes mellitus, hyperglycemia management/DKA, infusion insulin, transition protocol.
Additional Supporting Information may be found in the online version of this article.
Hyperglycemia due to diabetes or stress is prevalent in the
intensive care unit (ICU) and general ward setting. Umpier-
rez et al.1 reported hyperglycemia in 38% of hospitalized
ward patients with 26% having a known history of diabetes.
While patients with hyperglycemia admitted to the ICU are
primarily treated with infusion insulin, those on the general
wards usually receive a subcutaneous regimen of insulin.
How best to transition patients from infusion insulin to a
subcutaneous regimen remains elusive and under evaluated.
A recent observational pilot study of 24 surgical and 17
cardiac/medical intensive care patients at our university-
based hospital found that glycemic control significantly
deteriorated when patients with diabetes transitioned from
infusion insulin to subcutaneous insulin. A total of 21 criti-
cal care patients with a history of diabetes failed to receive
basal insulin prior to discontinuation of the drip and devel-
oped uncontrolled hyperglycemia (mean glucose Day 1 of
216 mg/dL and Day 2 of 197 mg/dL). Patients without a his-
tory of diabetes did well post transition with a mean glucose
of 142 mg/dL Day 1 and 133 mg/dL Day 2. A similar study
by Czosnowski et al.2 demonstrated a significant increase in
blood glucose from 123 6 26 mg/dL to 168 6 50 mg/dL
upon discontinuation of infusion insulin.
This failed transition is disappointing, especially in view
of the existence of a reliable subcutaneous (SC) insulin order
set at our institution, but not surprising, as this is an inher-
ently complex process. The severity of illness, the amount
and mode of nutritional intake, geographic location, and pro-
vider team may all be in flux at the time of this transition. A
few centers have demonstrated that a much improved transi-
tion is possible,3–6 however many of these solutions involve
technology or incremental personnel that may not be avail-
able or the descriptions may lack sufficient detail to imple-
ment theses strategies with confidence elsewhere.
Therefore, we designed and piloted a protocol, coordinated
by a multidisciplinary team, to transition patients from
2010 Society of Hospital Medicine DOI 10.1002/jhm.810
View this article online at wileyonlinelibrary.com.
446 Journal of Hospital Medicine Vol 5 No 8 October 2010
infusion insulin to SC insulin. The successful implementation
of this protocol could serve as a blueprint to other institutions
without the need for additional technology or personnel.
MethodsPatient Population/SettingThis was a prospective study of patients admitted to either
the medical/cardiac intensive care unit (MICU/CCU) or sur-
gical intensive care unit (SICU) at an academic medical fa-
cility and placed on infusion insulin for >24 hours. The
Institutional Review Board (IRB) approved the study for pro-
spective chart review and anonymous results reporting with-
out individual consent.
Patients in the SICU were initiated on infusion insulin af-
ter 2 blood glucose readings were above 150 mg/dL,
whereas initiation was left to the discretion of the attending
physician in the MICU/CCU. A computerized system cre-
ated in-house recommends insulin infusion rates based on
point-of-care (POC) glucose measurements with a target
range of 91 mg/dL to 150 mg/dL.
Inclusion/Exclusion CriteriaAll patients on continuous insulin infusion admitted to the
SICU or the MICU/CCU between May 2008 and September
2008 were evaluated for the study (Figure 1). Patients were
excluded from analysis if they were on the infusion for less
than 24 hours, had a liver transplant, were discharged within
48 hours of transition, were made comfort care or transitioned
to an insulin pump. All other patients were included in the final
analysis.
Transition ProtocolStep 1: Does the Patient Need Basal SC Insulin?Patients were recommended to receive basal SC insulin if
they either: (1) were on medications for diabetes; (2) had an
A1c �6%; or (3) received the equivalent of �60 mg of pred-
nisone; AND had an infusion rate �1 unit/hour (Supporting
Information Appendix 1). Patients on infusion insulin due to
stress hyperglycemia, regardless of the infusion rate, were
not placed on basal SC insulin. Patients on high dose ste-
roids due to spinal injuries were excluded because their du-
ration of steroid use was typically less than 48 hours and
usually ended prior to the time of transition. The protocol
recommends premeal correctional insulin for those not
qualifying for basal insulin.
In order to establish patients in need of basal/nutritional
insulin we opted to use A1c as well as past medical history
to identify patients with diabetes. The American Diabetes
Association (ADA) has recently accepted using an A1c
�6.5% to make a new diagnosis of diabetes.7 In a 2-week
trial prior to initiating the protocol we used a cut off A1c of
6.5%. However, we found that patients with an A1c of 6% to
6.5% had poor glucose control post transition; therefore we
chose �6% as our identifier. In addition, using a cut off A1c
of 6% was reported by Rohlfing et al.8 and Greci et al.9 to be
more than 97% sensitive at identifying a new diagnosis of
diabetes.
To ensure an A1c was ordered and available at the time
of transition, critical care pharmacists were given Pharmacy
and Therapeutics Committee authorization to order an A1c
at the start of the infusion. Pharmacists would also guide
the primary team through the protocol’s recommendations
as well as alert the project team when a patient was
expected to transition.
Step 2: Evaluate the Patient’s Nutritional Intake toCalculate the Total Daily Dose (TDD) of InsulinTDD is the total amount of insulin needed to cover both the
nutritional and basal requirements of a patient over the
course of 24 hours. TDD was calculated by averaging the
hourly drip rate over the prior 6 hours and multiplying by
20 if taking in full nutrition or 40 if taking minimal nutrition
while on the drip. A higher multiplier was used for those on
minimal nutrition with the expectation that their insulin
requirements would double once tolerating a full diet. ‘‘Full
nutrition’’ was defined as eating >50% of meals, on goal
tube feeds, or receiving total parenteral nutrition (TPN).
‘‘Minimal nutrition’’ was defined as taking nothing by
mouth (or NPO), tolerating <50% of meals, or on a clear liq-
uid diet.
Step 3: Divide the TDD Into the Appropriate Components ofInsulin Treatment (Basal, Nutritional and Correction),Depending on the Nutritional StatusIn Step 3, the TDD was evenly divided into basal and nutri-
tional insulin. A total of 50% of the TDD was given as glar-
gine (Lantus) 2 hours prior to stopping the infusion. The
remaining 50% was divided into nutritional components as
either Regular insulin every 6 hours for patients on tube
feeds or lispro (Humalog) before meals if tolerating an oral
diet. For patients on minimal nutrition, the 50% nutritional
insulin dose was not initiated until the patient was tolerat-
ing full nutrition.
The protocol recommended basal insulin administration
2 hours prior to infusion discontinuation as recommended
by the American Association of Clinical Endocrinologists
(AACE) and ADA consensus statement on inpatient glycemic
control as well as pharmacokinetics.10,11 For these reasons,
failure to receive basal insulin prior to transition was viewed
as failure to follow the protocol.
Safety features of the protocol included a maximum TDD
of 100 units unless the patient was on >100 units/day of in-
sulin prior to admission. A pager was carried by rotating
hospitalists or pharmacist study investigators at all hours
during the protocol implementation phase to answer any
questions regarding a patient’s transition.
Data Collection/MonitoringA multidisciplinary team consisting of hospitalists, ICU
pharmacists, critical care physicians and nursing
2010 Society of Hospital Medicine DOI 10.1002/jhm.810
View this article online at wileyonlinelibrary.com.
Transitioning From Infusion Insulin Ramos et al. 447
representatives was assembled during the study period. This
team was responsible for protocol implementation, data col-
lection, and surveillance of patient response to the protocol.
Educational sessions with house staff and nurses in each
unit were held prior to the beginning of the study as well as
continued monthly educational efforts during the study. In
addition, biweekly ‘‘huddles’’ to review ongoing patient tran-
sitions as well as more formal monthly reviews were held.
The primary objective was to improve glycemic control,
defined as the mean daily glucose, during the first 48 hours
post transition without a significant increase in the percent-
age of patients with hypoglycemia (41-70 mg/dL) or severe
hypoglycemia (�40 mg/dL). Secondary endpoints included
the percent of patients with severe hyperglycemia (�300
mg/dL), length of stay (LOS) calculated from the day of
transition, number of restarts back onto infusion insulin
within 72 hours of transition, and day-weighted glucose
mean up to 12 days following transition for patients with
diabetes.
Glucose values were collected and averaged over 6-hour
periods for 48 hours post transition. For patients with diabe-
tes, POC glucose values were collected up to 12 days of
TABLE 1. Patient Demographics
Patients With Diabetes
P Value
Patients Without Diabetes
P Value
Protocol Followed,
n ¼ 29 Patients*
Protocol NOT
Followed, n ¼ 33 Patients
Protocol Followed,
n ¼ 30 Patients
Protocol NOT Followed,
n ¼ 9 Patients
Average age, years, mean 6 SD 57.7 6 12.1 57.8 6 12.3 0.681 56.5 6 18.1 62.4 6 15.5 0.532
Male patients 21 (72%) 21 (63%) 0.58 20 (66%) 7 (77%) 0.691
BMI 30.7 6 7.2 28.6 6 6.8 0.180 27 6 5.4 25.2 6 3 0.081
History of diabetes* 18 (64%) 25 (86%) 0.07 0 0 z
Mean Hgb A1c (%) 6.6 61.2 7.3 6 1.8 0.136 5.6 6 0.3 5.4 6 0.4 0.095
Full nutritiony 26 (79%) 24 (61%) 0.131 23 (70%) 9 (100%) z
On hemodialysis 5 (17%) 9 (27%) 0.380 3 (10%) 0 z
On >60 mg prednisone or equivalent per day 7 (24%) 10 (30%) 0.632 0 0 z
Abbreviations: BMI, body mass index; SD, standard deviation; TPN, total parenteral nutrition.
*One patient followed the protocol requiring basal insulin solely because they were on high dose steroids. They did not have a medical history of diabetes or an A1c �6%.yFull Nutrition: Patient is eating >50% of their meals, on goal tube feeds, or on TPN.zToo small of cell size to conduct chi-square analysis.
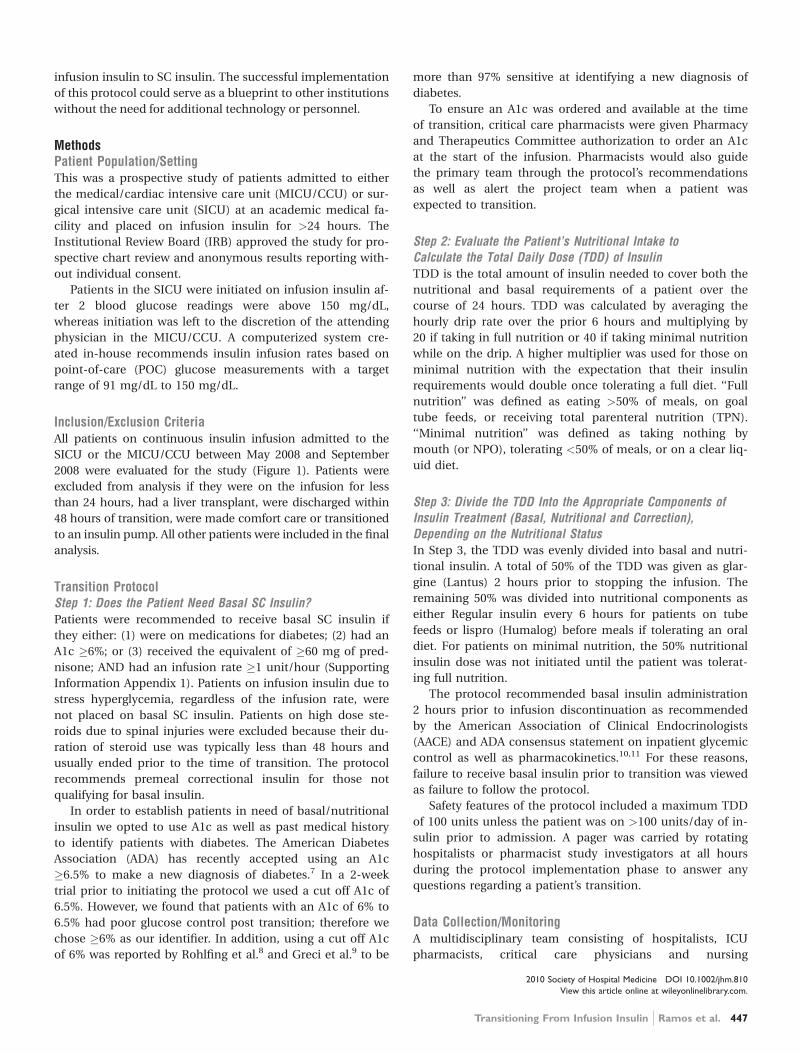
FIGURE 1. Patient Flow Chart. *Failure to follow the protocol for diabetic patients was defined as: receiving <80% of therecommended basal insulin or receiving insulin after stopping infusion insulin. **Failure to follow the protocol for non-diabetics was defined as: receiving basal or nutritional insulin when none was recommended.
2010 Society of Hospital Medicine DOI 10.1002/jhm.810
View this article online at wileyonlinelibrary.com.
448 Journal of Hospital Medicine Vol 5 No 8 October 2010
hospitalization. Day-weighted means were obtained by cal-
culating the mean glucose for each hospital day, averaged
across all hospital days.12
AnalysisSubjects were divided by the presence or absence of diabe-
tes. Those with diabetes were recommended to receive basal
SC insulin during the transition period. Within each group,
subjects were further divided by adherence to the protocol.
Failure to transition per protocol was defined as: not receiv-
ing at least 80% of the recommended basal insulin dose,
receiving the initial dose of insulin after the drip was dis-
continued, or receiving basal insulin when none was
recommended.
Descriptive statistics within subgroups comparing age,
gender, LOS by analysis of variance for continuous data and
by chi-square for nominal data, were compared. Twenty-four
and 48-hour post transition mean glucose values and the 12
day weighted-mean glucose were compared using analysis of
variance (Stata ver. 10). All data are expressed as mean6 stand-
ard deviation with a significance value established at P< 0.05.
ResultsA total of 210 episodes of infusion insulin in ICU patients were
evaluated for the study from May of 2008 to September 2008
(Figure 1). Ninety-six of these episodes were excluded, most
commonly due to time on infusion insulin <24 hours or tran-
sition to comfort care. The remaining 114 infusions were eligi-
ble to use the protocol. Because the protocol recommends in-
sulin therapy based on a diagnosis of diabetes, patients were
further divided into these subcategories. Of these 114 transi-
tions, the protocol was followed 66 times (58%).
Patients With Diabetes(Table 1: Patient Demographics; Table 2: Insulin Use and
Glycemic Control; Figure 2: Transition Graph).
A total of 62 individual patients accounted for 72 sepa-
rate transitions in patients with diabetes based on past
medical history or an A1c �6% (n ¼ 14). Of these 72 transi-
tions, 33 (46%) adhered to the protocol while the remaining
39 (54%) transitions varied from the protocol at the treat-
ment team’s discretion. Despite similar insulin infusion rates
and mean glucose values pretransition, patients with diabe-
tes following the protocol had better glycemic control at
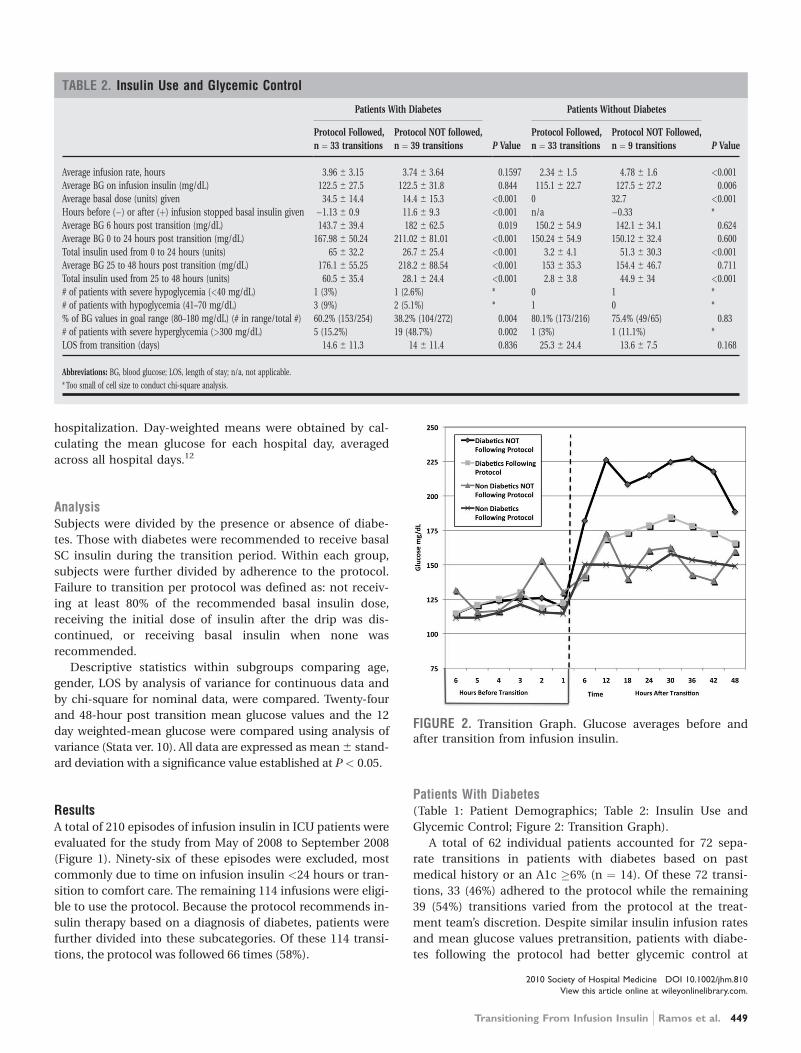
TABLE 2. Insulin Use and Glycemic Control
Patients With Diabetes
P Value
Patients Without Diabetes
P Value
Protocol Followed,
n ¼ 33 transitions
Protocol NOT followed,
n ¼ 39 transitions
Protocol Followed,
n ¼ 33 transitions
Protocol NOT Followed,
n ¼ 9 transitions
Average infusion rate, hours 3.96 6 3.15 3.74 6 3.64 0.1597 2.34 6 1.5 4.78 6 1.6 <0.001
Average BG on infusion insulin (mg/dL) 122.5 6 27.5 122.5 6 31.8 0.844 115.1 6 22.7 127.5 6 27.2 0.006
Average basal dose (units) given 34.5 6 14.4 14.4 6 15.3 <0.001 0 32.7 <0.001
Hours before (�) or after (þ) infusion stopped basal insulin given �1.13 6 0.9 11.6 6 9.3 <0.001 n/a �0.33 *
Average BG 6 hours post transition (mg/dL) 143.7 6 39.4 182 6 62.5 0.019 150.2 6 54.9 142.1 6 34.1 0.624
Average BG 0 to 24 hours post transition (mg/dL) 167.98 6 50.24 211.02 6 81.01 <0.001 150.24 6 54.9 150.12 6 32.4 0.600
Total insulin used from 0 to 24 hours (units) 65 6 32.2 26.7 6 25.4 <0.001 3.2 6 4.1 51.3 6 30.3 <0.001
Average BG 25 to 48 hours post transition (mg/dL) 176.1 6 55.25 218.2 6 88.54 <0.001 153 6 35.3 154.4 6 46.7 0.711
Total insulin used from 25 to 48 hours (units) 60.5 6 35.4 28.1 6 24.4 <0.001 2.8 6 3.8 44.9 6 34 <0.001
# of patients with severe hypoglycemia (<40 mg/dL) 1 (3%) 1 (2.6%) * 0 1 *
# of patients with hypoglycemia (41–70 mg/dL) 3 (9%) 2 (5.1%) * 1 0 *
% of BG values in goal range (80–180 mg/dL) (# in range/total #) 60.2% (153/254) 38.2% (104/272) 0.004 80.1% (173/216) 75.4% (49/65) 0.83
# of patients with severe hyperglycemia (>300 mg/dL) 5 (15.2%) 19 (48.7%) 0.002 1 (3%) 1 (11.1%) *
LOS from transition (days) 14.6 6 11.3 14 6 11.4 0.836 25.3 6 24.4 13.6 6 7.5 0.168
Abbreviations: BG, blood glucose; LOS, length of stay; n/a, not applicable.
* Too small of cell size to conduct chi-square analysis.
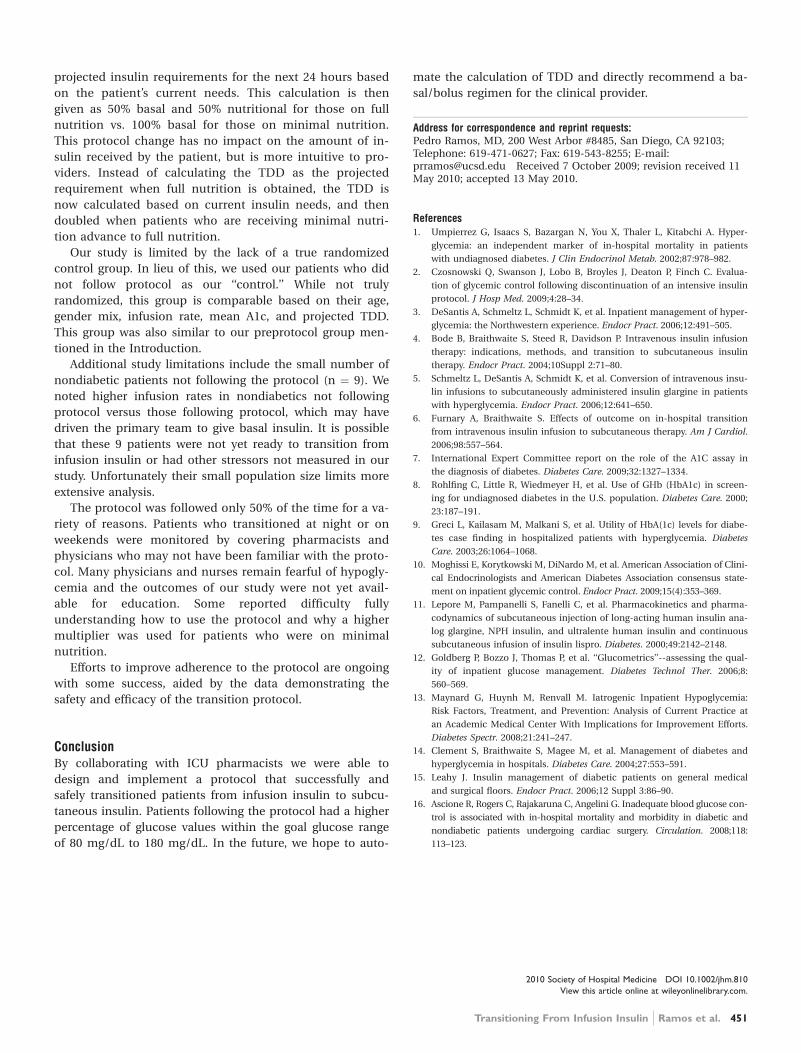
FIGURE 2. Transition Graph. Glucose averages before andafter transition from infusion insulin.
2010 Society of Hospital Medicine DOI 10.1002/jhm.810
View this article online at wileyonlinelibrary.com.
Transitioning From Infusion Insulin Ramos et al. 449

both 24 hours and 48 hours after transition than those
patients transitioned without the protocol. Day 1 mean
blood glucose was 168 mg/dL vs. 211 mg/dL (P ¼ <0.001)
and day 2 mean blood glucose was 176 mg/dL vs. 218 mg/
dL (P ¼ <0.001) in protocol vs. nonprotocol patients with
diabetes respectively (Figure 2).
There was a severe hypoglycemic event (�40 mg/dL) in 1
patient with diabetes following the protocol and 1 patient
not following the protocol within 48 hours of transition.
Both events were secondary to nutritional-insulin mismatch
with emesis after insulin in one case and tube feeds being
held in the second case. These findings were consistent with
our prior examination of hypoglycemia cases.13 Severe
hyperglycemia (glucose �300mg/dL) occurred in 5 (15 %)
patients following the protocol vs. 19 (49%) patients not fol-
lowing protocol (P ¼ 0.002.) Patients with diabetes following
the protocol received significantly more insulin in the first
24 hours (mean of 65 units vs. 27 units, P � 0.001) and 24
to 48 hours after transition (mean of 61 units vs. 28 units,
p�0.001) than those not following protocol.
An alternate method used at our institution and others14,15
to calculate TDD is based on the patient’s weight and body
habitus. When we compared the projected TDD based on
weight with the TDD using the transition protocol, we found
that the weight based method was much less aggressive. For
patients following the protocol, the weight based method pro-
jected a mean TDD of 46.3 6 16.9 units whereas the protocol
projected a mean TDD of 65 6 33.2 units (P ¼ 0.001).
Patients with diabetes following protocol received basal
insulin an average of 1.13 hours prior to discontinuing the
insulin infusion versus 11.6 hours after for those not follow-
ing protocol.
Three patients with diabetes following the protocol and 3
patients with diabetes not following the protocol were
restarted on infusion insulin within 72 hours of transition.
LOS from final transition to discharge was similar between
protocol vs. nonprotocol patients (14.6 vs. 14 days, P ¼ 0.836).
Figure 3 demonstrates that when used correctly, the pro-
tocol provides an extended period of glycemic control up to
12 days post transition. Patients transitioned per protocol
had a day-weighted mean glucose of 155 mg/dL vs. 184 mg/
dL (P ¼ 0.043) in patients not following protocol. There was
only 1 glucose value less than 40 mg/dL between days 2 to
12 in the protocol group.
Patients Without DiabetesOf the 39 individual patients without diabetes there were 42
transition events, 33 transitions (78.6%) were per protocol
and placed on correctional insulin only. The remaining 9
transitions failed to follow protocol in that basal insulin was
prescribed, but these patients maintained comparable glyce-
mic control without an increase in hypoglycemic events.
Following transition, patients without diabetes on protocol
maintained a mean glucose of 150 mg/dL in the first 24
hours and 153 mg/dL in 24 to 48 hours post transition.
They required a mean daily correctional insulin dose of 3.2
units on Day 1 and 2.8 units on Day 2 despite having an av-
erage drip rate of 2.3 units/hour at the time of transition
(Table 2). There were no severe hypoglycemic events and
80% of blood sugars were within the goal range of 80 mg/dL
to 180 mg/dL. Only 1 patient had a single blood glucose of
>300mg/dL. No patient was restarted on infusion insulin
once transitioned.
Patients without diabetes had a longer LOS after transi-
tion off of infusion insulin when compared to their diabetic
counterparts (22 vs. 14 days).
DiscussionThis study demonstrates the utility of hospitalist-pharmacist
collaboration in the creation and implementation of a safe
and effective transition protocol for patients on infusion in-
sulin. The protocol identifies patients appropriate for transi-
tion to a basal/nutritional insulin regimen versus those who
will do well with premeal correctional insulin alone. Daily
mean glucose was improved post transition for diabetic
patients following the protocol compared to those not follow-
ing the protocol without an increase in hypoglycemic events.
We found an equal number of insulin infusion restarts
within 72 hours of transition and a similar LOS in protocol
vs. nonprotocol patients with diabetes. The LOS was
increased for patients without diabetes. This may be due to
worse outcomes noted in patients with stress hyperglycemia
in other studies.1,16
The use of the higher multiplier for patients on minimal
nutrition led to confusion among many protocol users. The
protocol has since been modified to start by averaging the
infusion rate over the prior 6 hours and then multiplying by
20 for all patients. This essentially calculates 80% of
FIGURE 3. Day weighted mean in patients with diabetes for12-days post transition.
2010 Society of Hospital Medicine DOI 10.1002/jhm.810
View this article online at wileyonlinelibrary.com.
450 Journal of Hospital Medicine Vol 5 No 8 October 2010
projected insulin requirements for the next 24 hours based
on the patient’s current needs. This calculation is then
given as 50% basal and 50% nutritional for those on full
nutrition vs. 100% basal for those on minimal nutrition.
This protocol change has no impact on the amount of in-
sulin received by the patient, but is more intuitive to pro-
viders. Instead of calculating the TDD as the projected
requirement when full nutrition is obtained, the TDD is
now calculated based on current insulin needs, and then
doubled when patients who are receiving minimal nutri-
tion advance to full nutrition.
Our study is limited by the lack of a true randomized
control group. In lieu of this, we used our patients who did
not follow protocol as our ‘‘control.’’ While not truly
randomized, this group is comparable based on their age,
gender mix, infusion rate, mean A1c, and projected TDD.
This group was also similar to our preprotocol group men-
tioned in the Introduction.
Additional study limitations include the small number of
nondiabetic patients not following the protocol (n ¼ 9). We
noted higher infusion rates in nondiabetics not following
protocol versus those following protocol, which may have
driven the primary team to give basal insulin. It is possible
that these 9 patients were not yet ready to transition from
infusion insulin or had other stressors not measured in our
study. Unfortunately their small population size limits more
extensive analysis.
The protocol was followed only 50% of the time for a va-
riety of reasons. Patients who transitioned at night or on
weekends were monitored by covering pharmacists and
physicians who may not have been familiar with the proto-
col. Many physicians and nurses remain fearful of hypogly-
cemia and the outcomes of our study were not yet avail-
able for education. Some reported difficulty fully
understanding how to use the protocol and why a higher
multiplier was used for patients who were on minimal
nutrition.
Efforts to improve adherence to the protocol are ongoing
with some success, aided by the data demonstrating the
safety and efficacy of the transition protocol.
ConclusionBy collaborating with ICU pharmacists we were able to
design and implement a protocol that successfully and
safely transitioned patients from infusion insulin to subcu-
taneous insulin. Patients following the protocol had a higher
percentage of glucose values within the goal glucose range
of 80 mg/dL to 180 mg/dL. In the future, we hope to auto-
mate the calculation of TDD and directly recommend a ba-
sal/bolus regimen for the clinical provider.
Address for correspondence and reprint requests:Pedro Ramos, MD, 200 West Arbor #8485, San Diego, CA 92103;Telephone: 619-471-0627; Fax: 619-543-8255; E-mail:[email protected] Received 7 October 2009; revision received 11May 2010; accepted 13 May 2010.
References1. Umpierrez G, Isaacs S, Bazargan N, You X, Thaler L, Kitabchi A. Hyper-
glycemia: an independent marker of in-hospital mortality in patients
with undiagnosed diabetes. J Clin Endocrinol Metab. 2002;87:978–982.
2. Czosnowski Q, Swanson J, Lobo B, Broyles J, Deaton P, Finch C. Evalua-
tion of glycemic control following discontinuation of an intensive insulin
protocol. J Hosp Med. 2009;4:28–34.
3. DeSantis A, Schmeltz L, Schmidt K, et al. Inpatient management of hyper-
glycemia: the Northwestern experience. Endocr Pract. 2006;12:491–505.
4. Bode B, Braithwaite S, Steed R, Davidson P. Intravenous insulin infusion
therapy: indications, methods, and transition to subcutaneous insulin
therapy. Endocr Pract. 2004;10Suppl 2:71–80.
5. Schmeltz L, DeSantis A, Schmidt K, et al. Conversion of intravenous insu-
lin infusions to subcutaneously administered insulin glargine in patients
with hyperglycemia. Endocr Pract. 2006;12:641–650.
6. Furnary A, Braithwaite S. Effects of outcome on in-hospital transition
from intravenous insulin infusion to subcutaneous therapy. Am J Cardiol.
2006;98:557–564.
7. International Expert Committee report on the role of the A1C assay in
the diagnosis of diabetes. Diabetes Care. 2009;32:1327–1334.
8. Rohlfing C, Little R, Wiedmeyer H, et al. Use of GHb (HbA1c) in screen-
ing for undiagnosed diabetes in the U.S. population. Diabetes Care. 2000;
23:187–191.
9. Greci L, Kailasam M, Malkani S, et al. Utility of HbA(1c) levels for diabe-
tes case finding in hospitalized patients with hyperglycemia. Diabetes
Care. 2003;26:1064–1068.
10. Moghissi E, Korytkowski M, DiNardo M, et al. American Association of Clini-
cal Endocrinologists and American Diabetes Association consensus state-
ment on inpatient glycemic control. Endocr Pract. 2009;15(4):353–369.
11. Lepore M, Pampanelli S, Fanelli C, et al. Pharmacokinetics and pharma-
codynamics of subcutaneous injection of long-acting human insulin ana-
log glargine, NPH insulin, and ultralente human insulin and continuous
subcutaneous infusion of insulin lispro. Diabetes. 2000;49:2142–2148.
12. Goldberg P, Bozzo J, Thomas P, et al. ‘‘Glucometrics’’--assessing the qual-
ity of inpatient glucose management. Diabetes Technol Ther. 2006;8:
560–569.
13. Maynard G, Huynh M, Renvall M. Iatrogenic Inpatient Hypoglycemia:
Risk Factors, Treatment, and Prevention: Analysis of Current Practice at
an Academic Medical Center With Implications for Improvement Efforts.
Diabetes Spectr. 2008;21:241–247.
14. Clement S, Braithwaite S, Magee M, et al. Management of diabetes and
hyperglycemia in hospitals. Diabetes Care. 2004;27:553–591.
15. Leahy J. Insulin management of diabetic patients on general medical
and surgical floors. Endocr Pract. 2006;12 Suppl 3:86–90.
16. Ascione R, Rogers C, Rajakaruna C, Angelini G. Inadequate blood glucose con-
trol is associated with in-hospital mortality and morbidity in diabetic and
nondiabetic patients undergoing cardiac surgery. Circulation. 2008;118:
113–123.
2010 Society of Hospital Medicine DOI 10.1002/jhm.810
View this article online at wileyonlinelibrary.com.
Transitioning From Infusion Insulin Ramos et al. 451