Embed Size (px)
Citation preview
Mainland China and Hong Kong
2017 Mid-Year Review:IPOs and othermarket trends
2© 2017 KPMG, a Hong Kong partnership and a member firm of the KPMG network of independent member firms affiliated with KPMG International Cooperative (“KPMG International”), a Swiss entity. All rights reserved. Printed in Hong Kong.
Apr May Jun
Foreword
In the first half of 2017, the Mainland China stock market remained stable amid a balanced control of liquidity risks and regulatory measures. The A-share IPO market carried its momentum from 2016 Q4 with significant increases in the number of new listings and funds raised.
In Hong Kong, capital inflows from Chinese investors are pushing up the Hong Kong stock market with both the Hang Seng Index and the average P/E ratio of the Main Board hitting two year highs. The Hong Kong IPO market remained active and was dominated by small to medium sized deals.
This mid-year report contains our analysis of the H1 Hong Kong and A-share IPO markets and our outlook for the rest of 2017. It also includes an update of both Stock and Bond Connect.
3© 2017 KPMG, a Hong Kong partnership and a member firm of the KPMG network of independent member firms affiliated with KPMG International Cooperative (“KPMG International”), a Swiss entity. All rights reserved. Printed in Hong Kong.
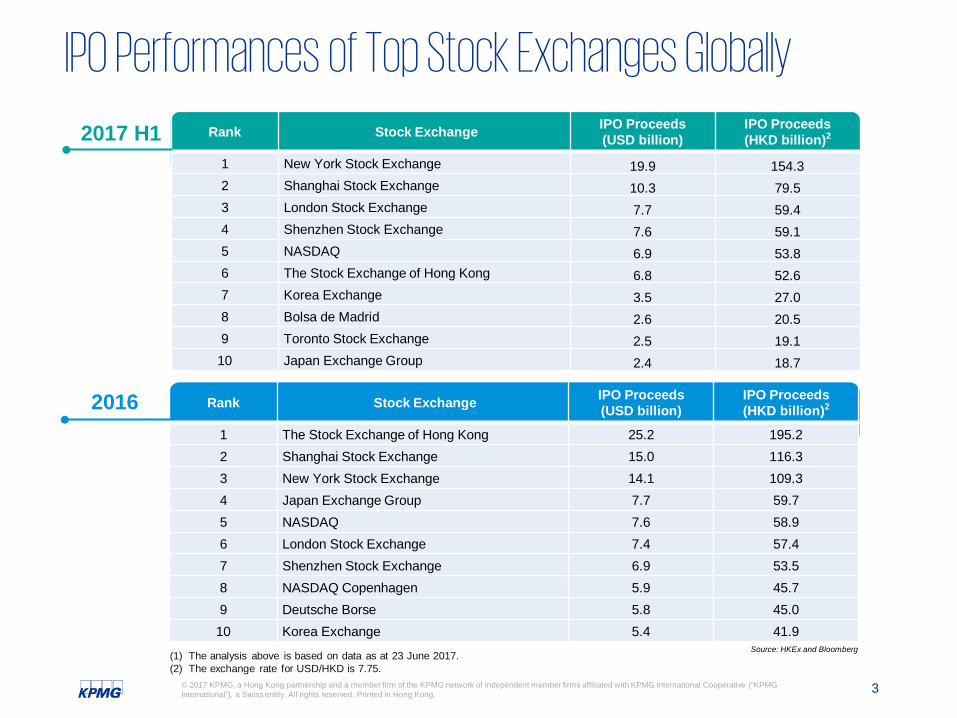
IPO Performances of Top Stock Exchanges Globally
Source: HKEx and Bloomberg
Rank Stock Exchange IPO Proceeds(USD billion)
IPO Proceeds(HKD billion)2
1 The Stock Exchange of Hong Kong 25.2 195.22 Shanghai Stock Exchange 15.0 116.33 New York Stock Exchange 14.1 109.34 Japan Exchange Group 7.7 59.75 NASDAQ 7.6 58.96 London Stock Exchange 7.4 57.47 Shenzhen Stock Exchange 6.9 53.58 NASDAQ Copenhagen 5.9 45.79 Deutsche Borse 5.8 45.0
10 Korea Exchange 5.4 41.9
Rank Stock Exchange IPO Proceeds(USD billion)
IPO Proceeds(HKD billion)2
1 New York Stock Exchange 19.9 154.3 2 Shanghai Stock Exchange 10.3 79.5 3 London Stock Exchange 7.7 59.4 4 Shenzhen Stock Exchange 7.6 59.1 5 NASDAQ 6.9 53.8 6 The Stock Exchange of Hong Kong 6.8 52.6 7 Korea Exchange 3.5 27.0 8 Bolsa de Madrid 2.6 20.5 9 Toronto Stock Exchange 2.5 19.1
10 Japan Exchange Group 2.4 18.7
(1) The analysis above is based on data as at 23 June 2017.(2) The exchange rate for USD/HKD is 7.75.
2016
2017 H1
Mainland China IPO MarketHong Kong IPO MarketStock ConnectBond Connect
Mainland China IPO Market
6© 2017 KPMG, a Hong Kong partnership and a member firm of the KPMG network of independent member firms affiliated with KPMG International Cooperative (“KPMG International”), a Swiss entity. All rights reserved. Printed in Hong Kong.
A-share IPO Market – Highlights of 2017 H1
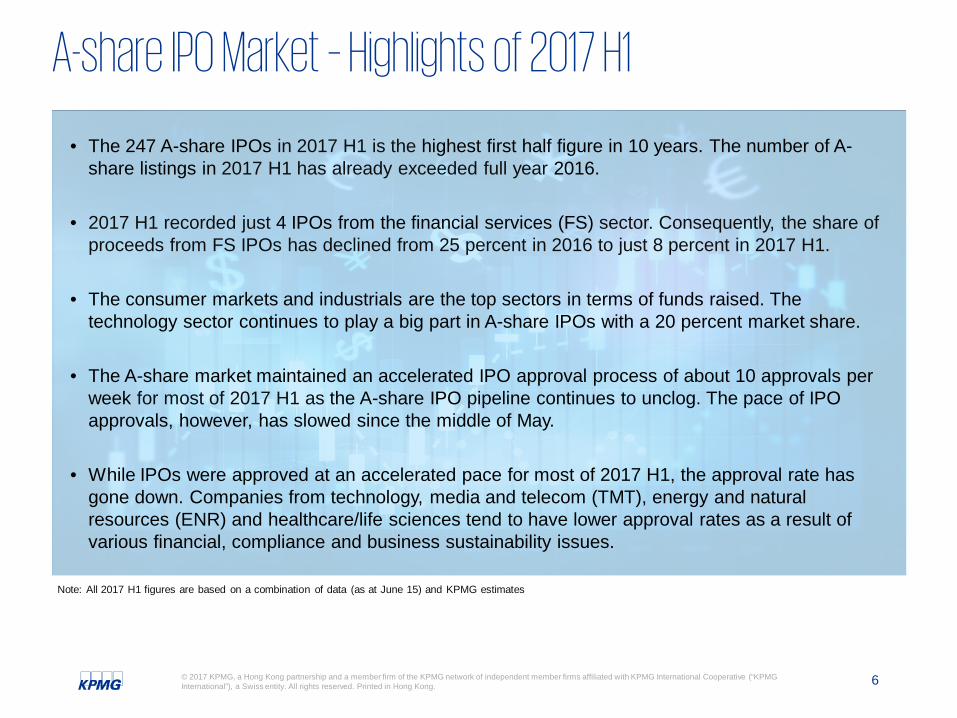
• The 247 A-share IPOs in 2017 H1 is the highest first half figure in 10 years. The number of A-share listings in 2017 H1 has already exceeded full year 2016.
• 2017 H1 recorded just 4 IPOs from the financial services (FS) sector. Consequently, the share of proceeds from FS IPOs has declined from 25 percent in 2016 to just 8 percent in 2017 H1.
• The consumer markets and industrials are the top sectors in terms of funds raised. The technology sector continues to play a big part in A-share IPOs with a 20 percent market share.
• The A-share market maintained an accelerated IPO approval process of about 10 approvals per week for most of 2017 H1 as the A-share IPO pipeline continues to unclog. The pace of IPO approvals, however, has slowed since the middle of May.
• While IPOs were approved at an accelerated pace for most of 2017 H1, the approval rate has gone down. Companies from technology, media and telecom (TMT), energy and natural resources (ENR) and healthcare/life sciences tend to have lower approval rates as a result of various financial, compliance and business sustainability issues.
Note: All 2017 H1 figures are based on a combination of data (as at June 15) and KPMG estimates
7© 2017 KPMG, a Hong Kong partnership and a member firm of the KPMG network of independent member firms affiliated with KPMG International Cooperative (“KPMG International”), a Swiss entity. All rights reserved. Printed in Hong Kong.
SSE SZSE A-share (SSE & SZSE)
Funds raised (RMB billion) # of IPOs Funds raised
(RMB billion) # of IPOs# of IPOs
< RMB 1 billion
RMB 1-5billion
> RMB 5 billion
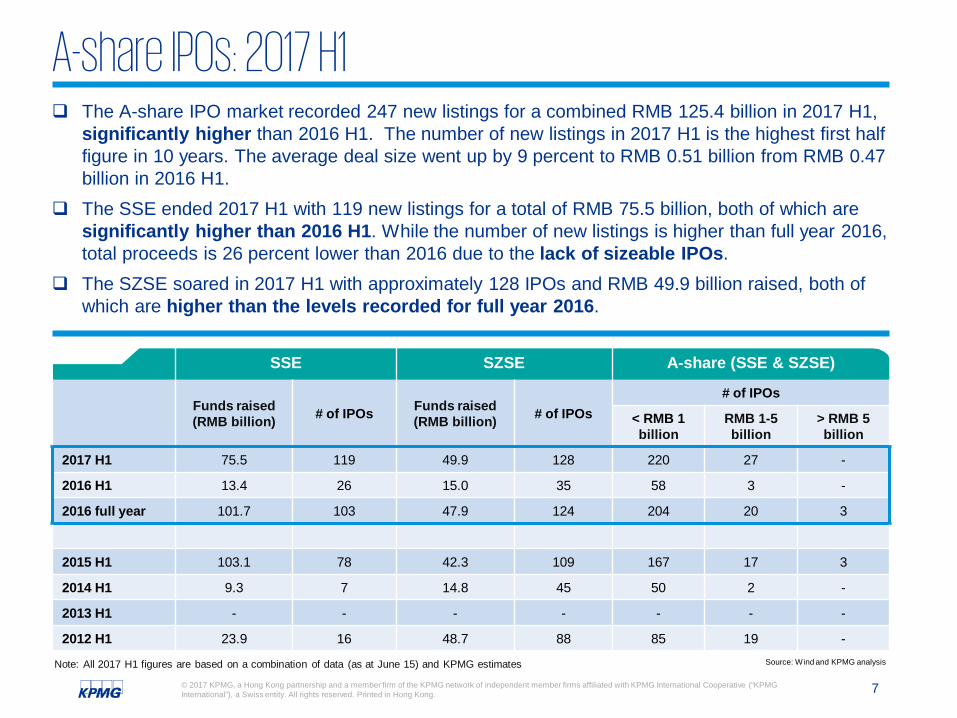
2017 H1 75.5 119 49.9 128 220 27 -
2016 H1 13.4 26 15.0 35 58 3 -
2016 full year 101.7 103 47.9 124 204 20 3
2015 H1 103.1 78 42.3 109 167 17 3
2014 H1 9.3 7 14.8 45 50 2 -
2013 H1 - - - - - - -
2012 H1 23.9 16 48.7 88 85 19 -
A-share IPOs: 2017 H1
Source: Wind and KPMG analysis
records…
The A-share IPO market recorded 247 new listings for a combined RMB 125.4 billion in 2017 H1, significantly higher than 2016 H1. The number of new listings in 2017 H1 is the highest first half figure in 10 years. The average deal size went up by 9 percent to RMB 0.51 billion from RMB 0.47 billion in 2016 H1.
The SSE ended 2017 H1 with 119 new listings for a total of RMB 75.5 billion, both of which are significantly higher than 2016 H1. While the number of new listings is higher than full year 2016, total proceeds is 26 percent lower than 2016 due to the lack of sizeable IPOs.
The SZSE soared in 2017 H1 with approximately 128 IPOs and RMB 49.9 billion raised, both of which are higher than the levels recorded for full year 2016.
Note: All 2017 H1 figures are based on a combination of data (as at June 15) and KPMG estimates
8© 2017 KPMG, a Hong Kong partnership and a member firm of the KPMG network of independent member firms affiliated with KPMG International Cooperative (“KPMG International”), a Swiss entity. All rights reserved. Printed in Hong Kong.
A-share IPOs: 2017 H1 – Sectors Analysis
Financial services
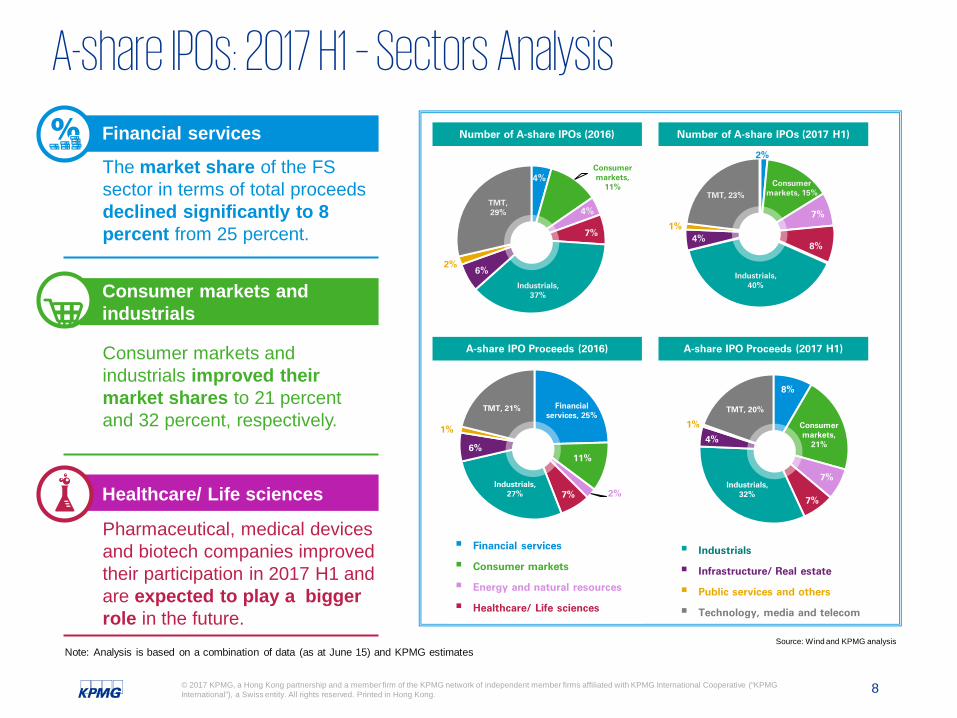
The market share of the FS sector in terms of total proceeds declined significantly to 8 percent from 25 percent.
Consumer markets and industrials improved their market shares to 21 percent and 32 percent, respectively.
Healthcare/ Life sciences
Pharmaceutical, medical devices and biotech companies improved their participation in 2017 H1 and are expected to play a bigger role in the future.
Consumer markets and industrials
Number of A-share IPOs (2016)
4%Consumer markets,
11%
4%
7%
Industrials, 37%
6%2%
TMT, 29%
Financial services, 25%
11%
2%7%Industrials,
27%
6%
1%
TMT, 21%
2%
Consumer markets, 15%
7%
8%
Industrials, 40%
4%1%
TMT, 23%
8%
Consumer markets,
21%
7%
7%
Industrials, 32%
4%
1%
TMT, 20%
Financial services
Consumer markets
Energy and natural resources
Healthcare/ Life sciences
Industrials
Infrastructure/ Real estate
Public services and others
Technology, media and telecom
Number of A-share IPOs (2017 H1)
A-share IPO Proceeds (2016) A-share IPO Proceeds (2017 H1)
Source: Wind and KPMG analysisNote: Analysis is based on a combination of data (as at June 15) and KPMG estimates
9© 2017 KPMG, a Hong Kong partnership and a member firm of the KPMG network of independent member firms affiliated with KPMG International Cooperative (“KPMG International”), a Swiss entity. All rights reserved. Printed in Hong Kong.
2016 H1 Company Exchange
Proceeds(RMB
billion)
IPO P/E Ratio Sector
1 First Capital Securities SZSE 2.3 23.0x Financial Services
2 China Nuclear Engineering SSE 1.8 15.6x Infrastructure / Real Estate
3 Southern Publishing and Media SSE 1.0 23.0x TMT
4 Guangdong Kinlong Hardware Products SZSE 1.0 21.7x Infrastructure / Real Estate
5 Chongqing Sokon Industry Group SSE 0.8 18.2x Industrials
6 Eastern Pioneer Driving School SSE 0.8 21.7x Education
7 Shanghai Flyco Electrical Appliance SSE 0.8 16.5x Consumer Markets
8 Jinhui Liquor SSE 0.8 18.5x Consumer Markets
9 Hangzhou Zhongya Machinery SZSE 0.7 23.0x Industrials
10 Tongyu Communication SZSE 0.7 9.7x TMT
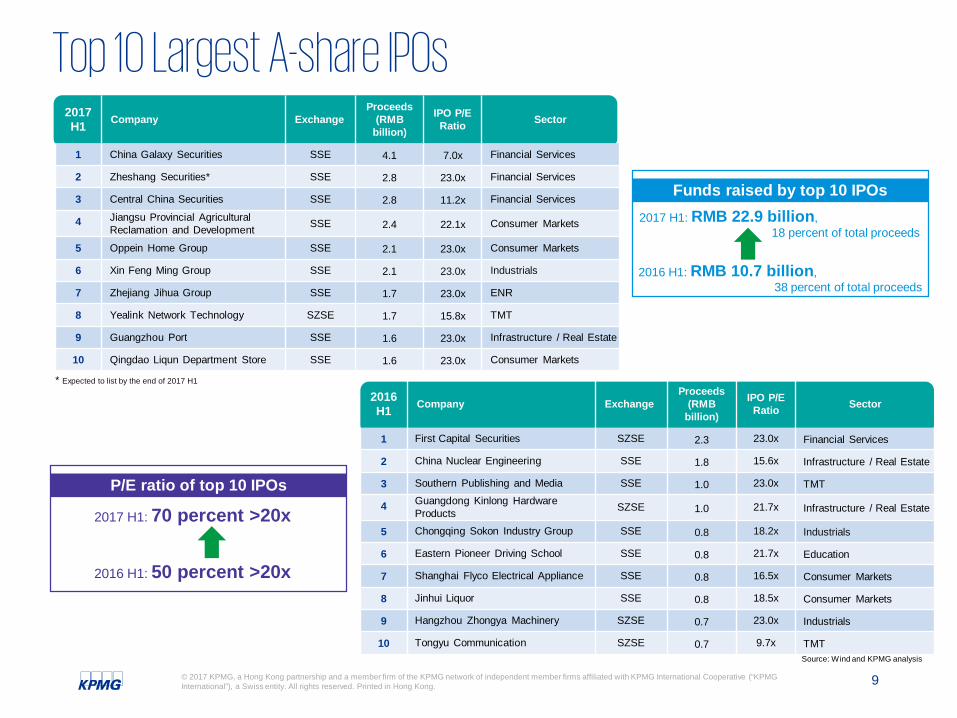
2017 H1 Company Exchange
Proceeds(RMB
billion)
IPO P/E Ratio Sector
1 China Galaxy Securities SSE 4.1 7.0x Financial Services
2 Zheshang Securities* SSE 2.8 23.0x Financial Services
3 Central China Securities SSE 2.8 11.2x Financial Services
4 Jiangsu Provincial Agricultural Reclamation and Development SSE 2.4 22.1x Consumer Markets
5 Oppein Home Group SSE 2.1 23.0x Consumer Markets
6 Xin Feng Ming Group SSE 2.1 23.0x Industrials
7 Zhejiang Jihua Group SSE 1.7 23.0x ENR
8 Yealink Network Technology SZSE 1.7 15.8x TMT
9 Guangzhou Port SSE 1.6 23.0x Infrastructure / Real Estate
10 Qingdao Liqun Department Store SSE 1.6 23.0x Consumer Markets
Top 10 Largest A-share IPOs
Source: Wind and KPMG analysis
Funds raised by top 10 IPOs
2016 H1: RMB 10.7 billion,38 percent of total proceeds
2017 H1: RMB 22.9 billion, 18 percent of total proceeds
P/E ratio of top 10 IPOs
2016 H1: 50 percent >20x
2017 H1: 70 percent >20x
* Expected to list by the end of 2017 H1
10© 2017 KPMG, a Hong Kong partnership and a member firm of the KPMG network of independent member firms affiliated with KPMG International Cooperative (“KPMG International”), a Swiss entity. All rights reserved. Printed in Hong Kong.
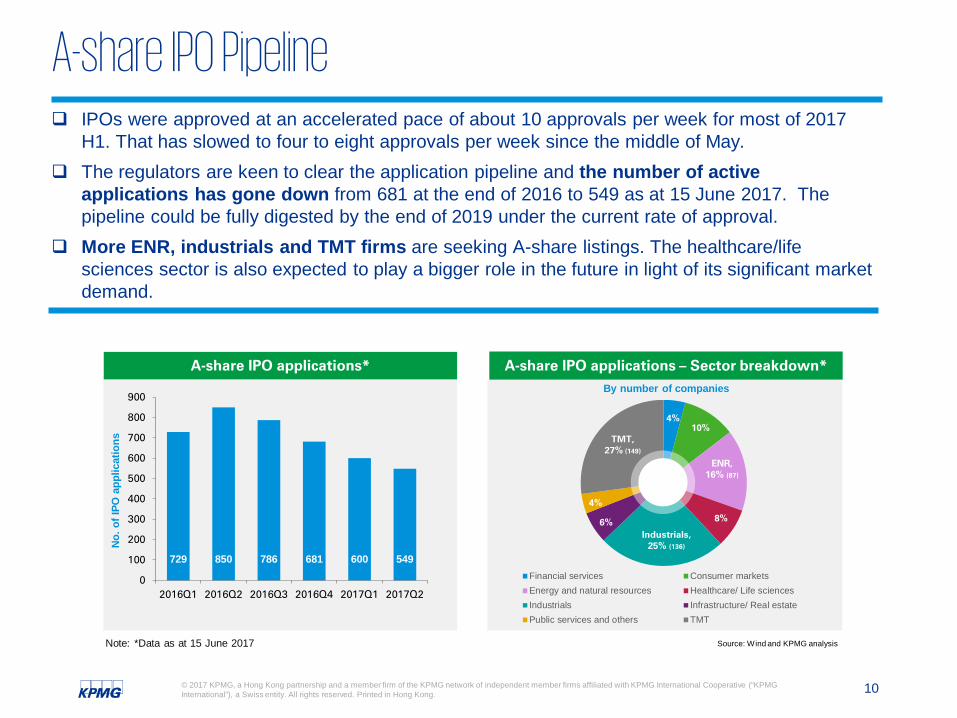
A-share IPO Pipeline IPOs were approved at an accelerated pace of about 10 approvals per week for most of 2017
H1. That has slowed to four to eight approvals per week since the middle of May. The regulators are keen to clear the application pipeline and the number of active
applications has gone down from 681 at the end of 2016 to 549 as at 15 June 2017. The pipeline could be fully digested by the end of 2019 under the current rate of approval.
More ENR, industrials and TMT firms are seeking A-share listings. The healthcare/life sciences sector is also expected to play a bigger role in the future in light of its significant market demand.
A-share IPO applications – Sector breakdown*By number of companies
Source: Wind and KPMG analysis
729 850 786 681 600 549
0
100
200
300
400
500
600
700
800
900
2016Q1 2016Q2 2016Q3 2016Q4 2017Q1 2017Q2
No.
of I
PO a
pplic
atio
ns
4%10%
ENR,16% (87)
8%
Industrials, 25% (136)
6%
4%
TMT, 27% (149)
Financial services Consumer marketsEnergy and natural resources Healthcare/ Life sciencesIndustrials Infrastructure/ Real estatePublic services and others TMT
Note: *Data as at 15 June 2017
A-share IPO applications*
11© 2017 KPMG, a Hong Kong partnership and a member firm of the KPMG network of independent member firms affiliated with KPMG International Cooperative (“KPMG International”), a Swiss entity. All rights reserved. Printed in Hong Kong.
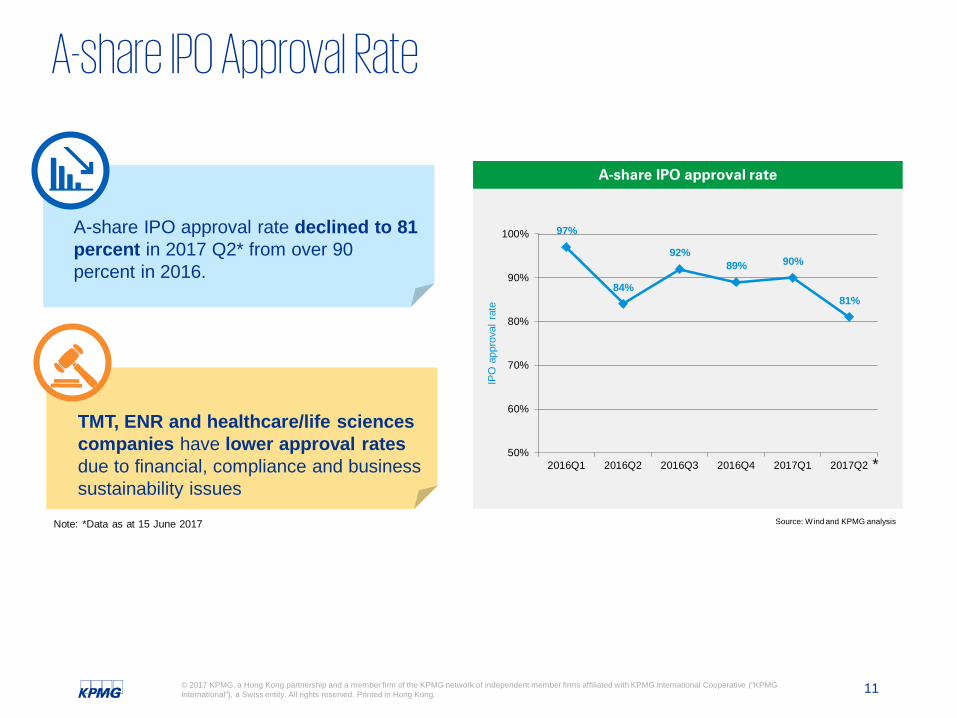
A-share IPO Approval Rate
Source: Wind and KPMG analysis
97%
84%
92%89% 90%
81%
50%
60%
70%
80%
90%
100%
2016Q1 2016Q2 2016Q3 2016Q4 2017Q1 2017Q2
IPO
app
rova
l rat
e
A-share IPO approval rate
A-share IPO approval rate declined to 81 percent in 2017 Q2* from over 90 percent in 2016.
TMT, ENR and healthcare/life sciences companies have lower approval rates due to financial, compliance and business sustainability issues
*
Note: *Data as at 15 June 2017
12© 2017 KPMG, a Hong Kong partnership and a member firm of the KPMG network of independent member firms affiliated with KPMG International Cooperative (“KPMG International”), a Swiss entity. All rights reserved. Printed in Hong Kong.
A-share IPOs: Outlook for the rest of 2017
IPO activity will continue to be strong in the second half of the year as the regulators continue to focus on clearing the pipeline. The number of new listings is expected to hit a 10-year high by year end. The two Mainland Stock Exchanges are expected to strengthen their leading positions in the global IPO rankings this year.
Industrials, consumer markets and TMT sectors will lead both in terms of the number of transactions and funds raised.
KPMG China expects the number of A-share IPOs in the second half to be similar to 2017 H1. Our year end forecast is around 400 IPOs, raising approximately RMB 220 billion.
Hong Kong IPO Market
14© 2017 KPMG, a Hong Kong partnership and a member firm of the KPMG network of independent member firms affiliated with KPMG International Cooperative (“KPMG International”), a Swiss entity. All rights reserved. Printed in Hong Kong.
Hong Kong IPO Market – Highlights of 2017 H1
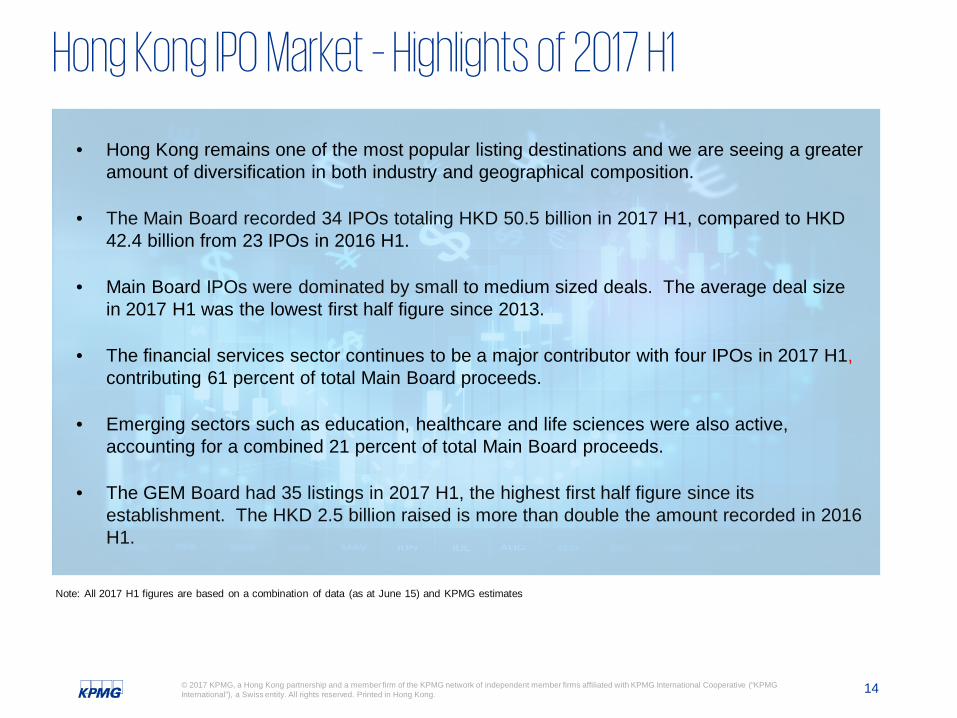
• Hong Kong remains one of the most popular listing destinations and we are seeing a greater amount of diversification in both industry and geographical composition.
• The Main Board recorded 34 IPOs totaling HKD 50.5 billion in 2017 H1, compared to HKD 42.4 billion from 23 IPOs in 2016 H1.
• Main Board IPOs were dominated by small to medium sized deals. The average deal size in 2017 H1 was the lowest first half figure since 2013.
• The financial services sector continues to be a major contributor with four IPOs in 2017 H1,contributing 61 percent of total Main Board proceeds.
• Emerging sectors such as education, healthcare and life sciences were also active, accounting for a combined 21 percent of total Main Board proceeds.
• The GEM Board had 35 listings in 2017 H1, the highest first half figure since its establishment. The HKD 2.5 billion raised is more than double the amount recorded in 2016 H1.
Note: All 2017 H1 figures are based on a combination of data (as at June 15) and KPMG estimates
15© 2017 KPMG, a Hong Kong partnership and a member firm of the KPMG network of independent member firms affiliated with KPMG International Cooperative (“KPMG International”), a Swiss entity. All rights reserved. Printed in Hong Kong.
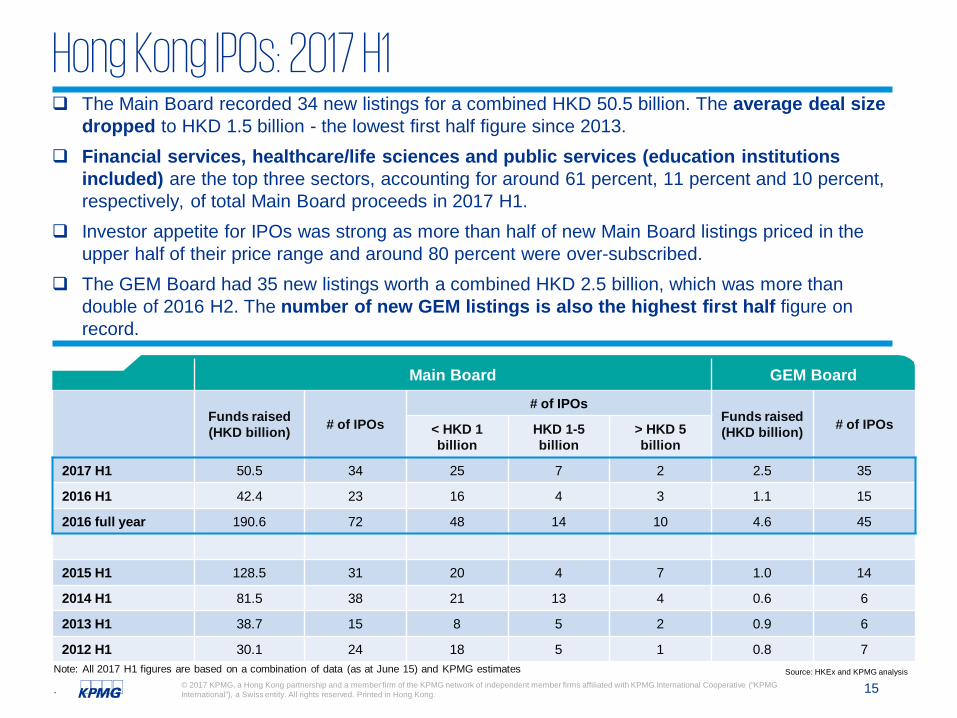
Main Board GEM Board
Funds raised (HKD billion) # of IPOs
# of IPOsFunds raised (HKD billion) # of IPOs< HKD 1
billionHKD 1-5billion
> HKD 5 billion
2017 H1 50.5 34 25 7 2 2.5 35
2016 H1 42.4 23 16 4 3 1.1 15
2016 full year 190.6 72 48 14 10 4.6 45
2015 H1 128.5 31 20 4 7 1.0 14
2014 H1 81.5 38 21 13 4 0.6 6
2013 H1 38.7 15 8 5 2 0.9 6
2012 H1 30.1 24 18 5 1 0.8 7
Hong Kong IPOs: 2017 H1
records…
Source: HKEx and KPMG analysis
The Main Board recorded 34 new listings for a combined HKD 50.5 billion. The average deal size dropped to HKD 1.5 billion - the lowest first half figure since 2013.
Financial services, healthcare/life sciences and public services (education institutions included) are the top three sectors, accounting for around 61 percent, 11 percent and 10 percent, respectively, of total Main Board proceeds in 2017 H1.
Investor appetite for IPOs was strong as more than half of new Main Board listings priced in the upper half of their price range and around 80 percent were over-subscribed.
The GEM Board had 35 new listings worth a combined HKD 2.5 billion, which was more than double of 2016 H2. The number of new GEM listings is also the highest first half figure on record.
Note: All 2017 H1 figures are based on a combination of data (as at June 15) and KPMG estimates
.
16© 2017 KPMG, a Hong Kong partnership and a member firm of the KPMG network of independent member firms affiliated with KPMG International Cooperative (“KPMG International”), a Swiss entity. All rights reserved. Printed in Hong Kong.
Hong Kong IPOs: 2017 H1 – Main Board Sector Analysis
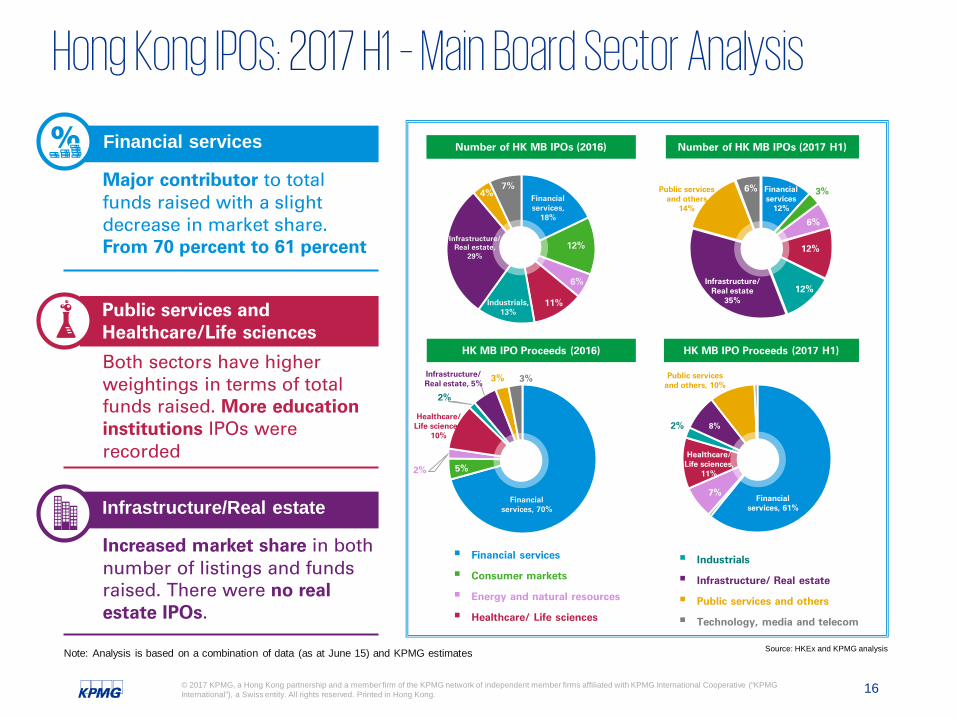
Financial services
Major contributor to total funds raised with a slight decrease in market share. From 70 percent to 61 percent
Public services and Healthcare/Life sciences
Both sectors have higher weightings in terms of total funds raised. More education institutions IPOs were recorded
Infrastructure/Real estate
Increased market share in both number of listings and funds raised. There were no real estate IPOs.
Financial services,
18%
12%
6%
11%Industrials, 13%
Infrastructure/ Real estate,
29%
4%7%
HK MB IPO Proceeds (2016)
Number of HK MB IPOs (2016)
Financial services
12%
3%
6%
12%
12%Infrastructure/
Real estate35%
Public services and others
14%
6%
Number of HK MB IPOs (2017 H1)
Financial services, 61%
7%
Healthcare/ Life sciences,
11%
2% 8%
Public services and others, 10%
HK MB IPO Proceeds (2017 H1)
Financial services
Consumer markets
Energy and natural resources
Healthcare/ Life sciences
Industrials
Infrastructure/ Real estate
Public services and others
Technology, media and telecom
Financial services, 70%
5%2%
Healthcare/ Life sciences,
10%
2%
Infrastructure/ Real estate, 5%
3% 3%
Note: Analysis is based on a combination of data (as at June 15) and KPMG estimates Source: HKEx and KPMG analysis
17© 2017 KPMG, a Hong Kong partnership and a member firm of the KPMG network of independent member firms affiliated with KPMG International Cooperative (“KPMG International”), a Swiss entity. All rights reserved. Printed in Hong Kong.
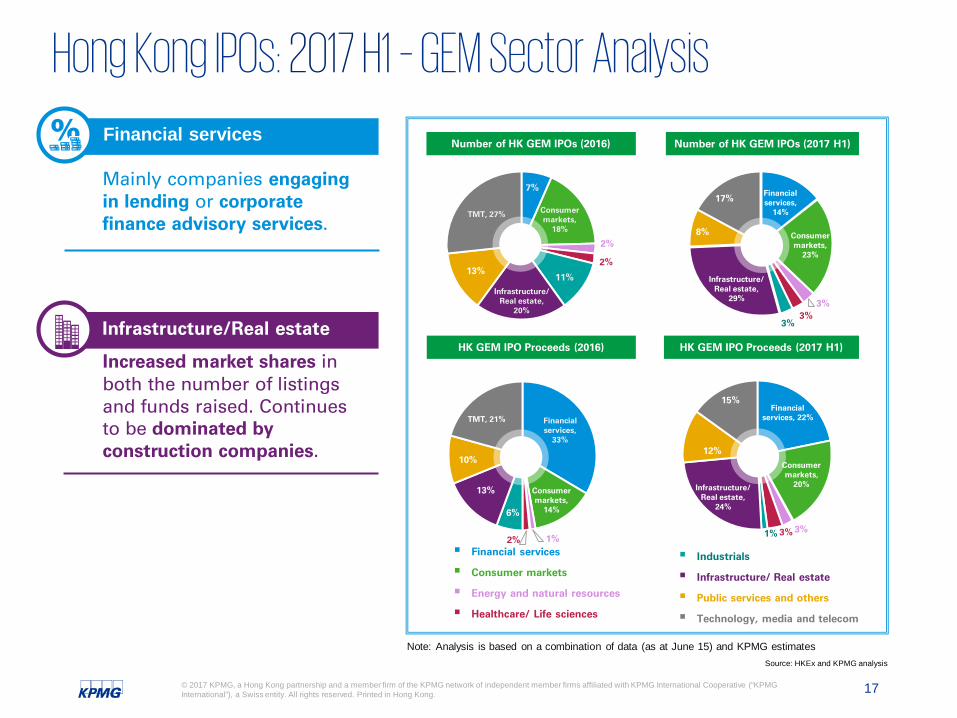
Hong Kong IPOs: 2017 H1 – GEM Sector Analysis
Financial services
Mainly companies engaging in lending or corporate finance advisory services.
Infrastructure/Real estate
Increased market shares in both the number of listings and funds raised. Continues to be dominated by construction companies.
7%
Consumer markets,
18%
2%
2%
11%Infrastructure/
Real estate, 20%
13%
TMT, 27%
HK GEM IPO Proceeds (2016)
Number of HK GEM IPOs (2016)
Financial services,
14%
Consumer markets,
23%
3%3%
3%
Infrastructure/ Real estate,
29%
8%
17%
Number of HK GEM IPOs (2017 H1)
Financial services, 22%
Consumer markets,
20%
3%3%1%
Infrastructure/ Real estate,
24%
12%
15%
HK GEM IPO Proceeds (2017 H1)
Financial services
Consumer markets
Energy and natural resources
Healthcare/ Life sciences
Industrials
Infrastructure/ Real estate
Public services and others
Technology, media and telecom
Financial services,
33%
Consumer markets,
14%
1%2%
6%
13%
10%
TMT, 21%
Note: Analysis is based on a combination of data (as at June 15) and KPMG estimatesSource: HKEx and KPMG analysis
18© 2017 KPMG, a Hong Kong partnership and a member firm of the KPMG network of independent member firms affiliated with KPMG International Cooperative (“KPMG International”), a Swiss entity. All rights reserved. Printed in Hong Kong.
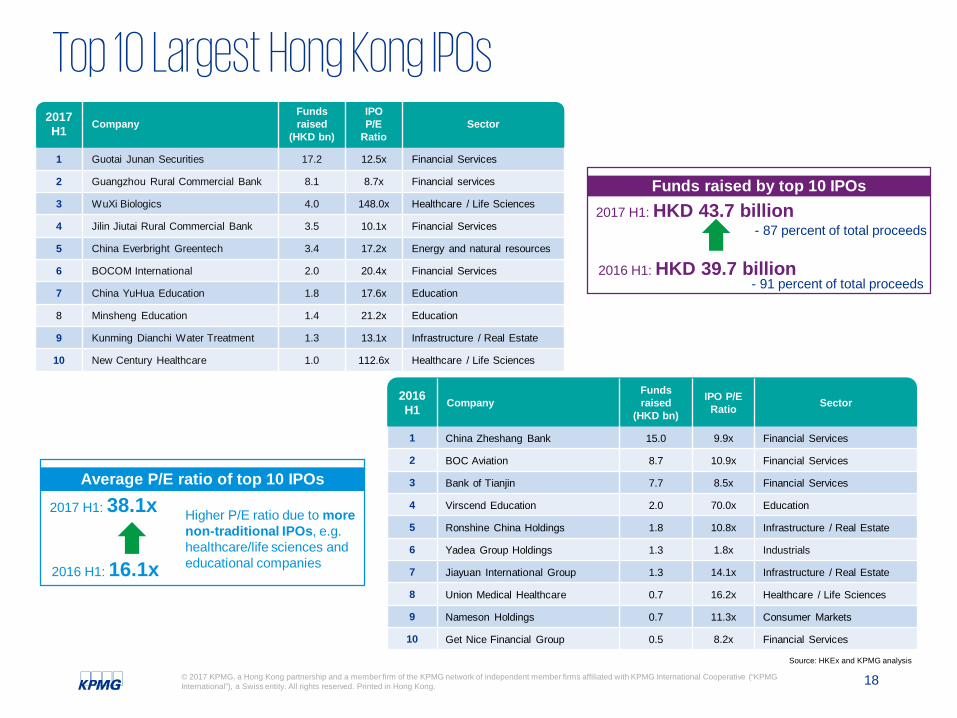
2016 H1 Company
Funds raised
(HKD bn)
IPO P/E Ratio Sector
1 China Zheshang Bank 15.0 9.9x Financial Services
2 BOC Aviation 8.7 10.9x Financial Services
3 Bank of Tianjin 7.7 8.5x Financial Services
4 Virscend Education 2.0 70.0x Education
5 Ronshine China Holdings 1.8 10.8x Infrastructure / Real Estate
6 Yadea Group Holdings 1.3 1.8x Industrials
7 Jiayuan International Group 1.3 14.1x Infrastructure / Real Estate
8 Union Medical Healthcare 0.7 16.2x Healthcare / Life Sciences
9 Nameson Holdings 0.7 11.3x Consumer Markets
10 Get Nice Financial Group 0.5 8.2x Financial Services
Top 10 Largest Hong Kong IPOs2017H1 Company
Funds raised
(HKD bn)
IPO P/E
RatioSector
1 Guotai Junan Securities 17.2 12.5x Financial Services
2 Guangzhou Rural Commercial Bank 8.1 8.7x Financial services
3 WuXi Biologics 4.0 148.0x Healthcare / Life Sciences
4 Jilin Jiutai Rural Commercial Bank 3.5 10.1x Financial Services
5 China Everbright Greentech 3.4 17.2x Energy and natural resources
6 BOCOM International 2.0 20.4x Financial Services
7 China YuHua Education 1.8 17.6x Education
8 Minsheng Education 1.4 21.2x Education
9 Kunming Dianchi Water Treatment 1.3 13.1x Infrastructure / Real Estate
10 New Century Healthcare 1.0 112.6x Healthcare / Life Sciences
Funds raised by top 10 IPOs
Average P/E ratio of top 10 IPOs
2017 H1: HKD 43.7 billion
2016 H1: HKD 39.7 billion
2017 H1: 38.1x
2016 H1: 16.1x
- 87 percent of total proceeds
- 91 percent of total proceeds
Source: HKEx and KPMG analysis
Higher P/E ratio due to more non-traditional IPOs, e.g. healthcare/life sciences and educational companies
19© 2017 KPMG, a Hong Kong partnership and a member firm of the KPMG network of independent member firms affiliated with KPMG International Cooperative (“KPMG International”), a Swiss entity. All rights reserved. Printed in Hong Kong.
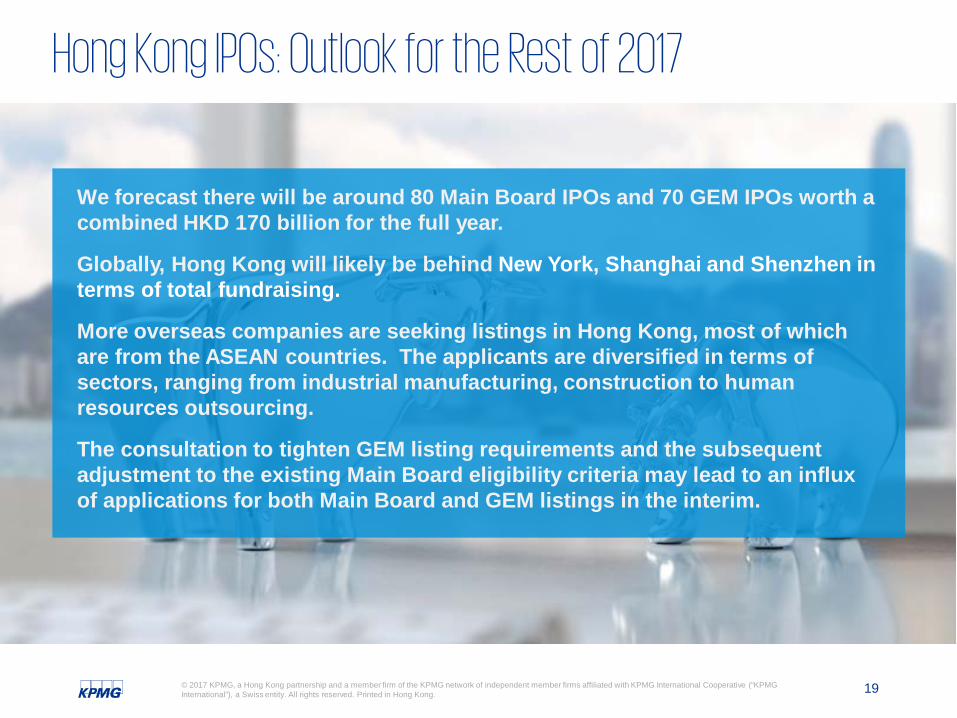
Hong Kong IPOs: Outlook for the Rest of 2017
We forecast there will be around 80 Main Board IPOs and 70 GEM IPOs worth a combined HKD 170 billion for the full year.
Globally, Hong Kong will likely be behind New York, Shanghai and Shenzhen in terms of total fundraising.
More overseas companies are seeking listings in Hong Kong, most of which are from the ASEAN countries. The applicants are diversified in terms of sectors, ranging from industrial manufacturing, construction to human resources outsourcing.
The consultation to tighten GEM listing requirements and the subsequent adjustment to the existing Main Board eligibility criteria may lead to an influx of applications for both Main Board and GEM listings in the interim.

Stock Connect
21© 2017 KPMG, a Hong Kong partnership and a member firm of the KPMG network of independent member firms affiliated with KPMG International Cooperative (“KPMG International”), a Swiss entity. All rights reserved. Printed in Hong Kong.
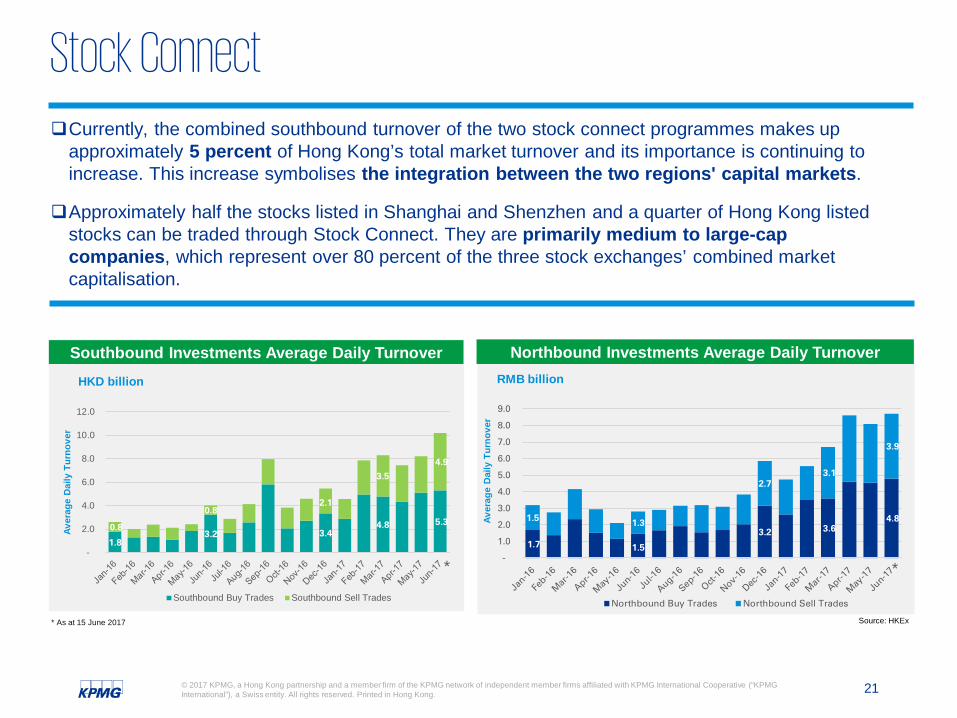
Stock Connect
Northbound Investments Average Daily TurnoverRMB billion
Southbound Investments Average Daily TurnoverHKD billion
Source: HKEx
1.8 3.2 3.4
4.8 5.3 0.8
0.8 2.1
3.5
4.9
-
2.0
4.0
6.0
8.0
10.0
12.0
Aver
age
Dai
ly T
urno
ver
Southbound Buy Trades Southbound Sell Trades
1.7 1.5
3.2 3.6 4.8 1.5 1.3
2.7 3.1
3.9
-
1.0
2.0
3.0
4.0
5.0
6.0
7.0
8.0
9.0
Aver
age
Dai
ly T
urno
ver
Northbound Buy Trades Northbound Sell Trades
Currently, the combined southbound turnover of the two stock connect programmes makes up approximately 5 percent of Hong Kong’s total market turnover and its importance is continuing to increase. This increase symbolises the integration between the two regions' capital markets.
Approximately half the stocks listed in Shanghai and Shenzhen and a quarter of Hong Kong listed stocks can be traded through Stock Connect. They are primarily medium to large-cap companies, which represent over 80 percent of the three stock exchanges’ combined market capitalisation.
* *
* As at 15 June 2017
Bond Connect
23© 2017 KPMG, a Hong Kong partnership and a member firm of the KPMG network of independent member firms affiliated with KPMG International Cooperative (“KPMG International”), a Swiss entity. All rights reserved. Printed in Hong Kong.
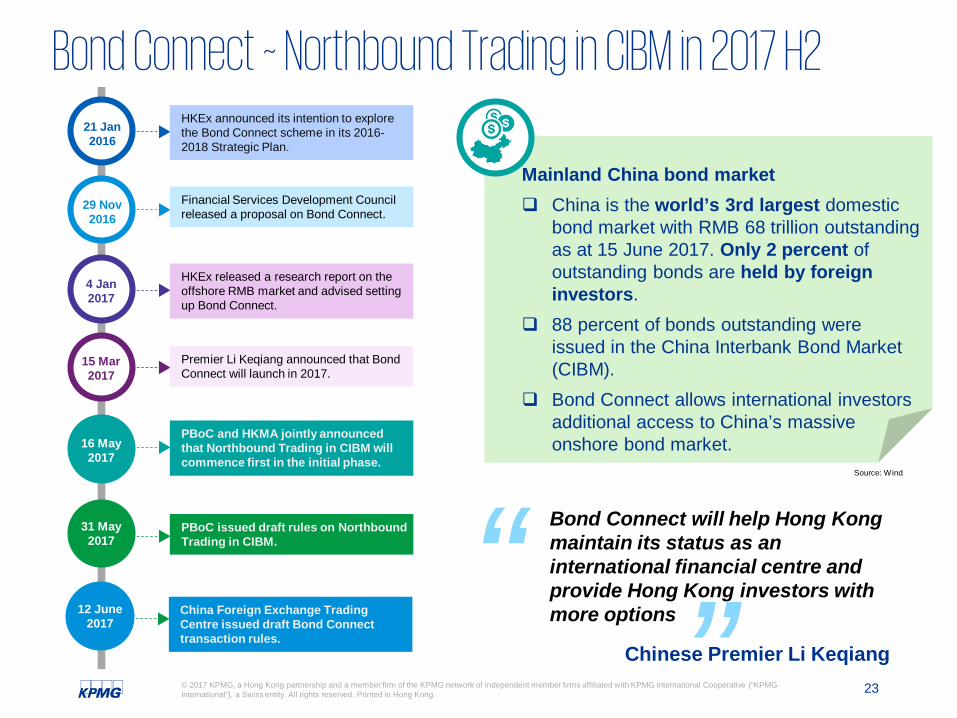
PBoC issued draft rules on Northbound Trading in CIBM.
PBoC and HKMA jointly announced that Northbound Trading in CIBM will commence first in the initial phase.
Premier Li Keqiang announced that Bond Connect will launch in 2017.
HKEx announced its intention to explore the Bond Connect scheme in its 2016-2018 Strategic Plan.
Bond Connect ~ Northbound Trading in CIBM in 2017 H2
Bond Connect will help Hong Kong maintain its status as an international financial centre and provide Hong Kong investors with more options
Chinese Premier Li Keqiang
21 Jan 2016
29 Nov 2016
Financial Services Development Council released a proposal on Bond Connect.
4 Jan 2017
HKEx released a research report on the offshore RMB market and advised setting up Bond Connect.
15 Mar 2017
16 May 2017
31 May 2017
Mainland China bond market China is the world’s 3rd largest domestic
bond market with RMB 68 trillion outstanding as at 15 June 2017. Only 2 percent of outstanding bonds are held by foreign investors.
88 percent of bonds outstanding were issued in the China Interbank Bond Market (CIBM).
Bond Connect allows international investors additional access to China’s massive onshore bond market.
“ “
China Foreign Exchange Trading Centre issued draft Bond Connect transaction rules.
12 June 2017
Source: Wind
24© 2017 KPMG, a Hong Kong partnership and a member firm of the KPMG network of independent member firms affiliated with KPMG International Cooperative (“KPMG International”), a Swiss entity. All rights reserved. Printed in Hong Kong.
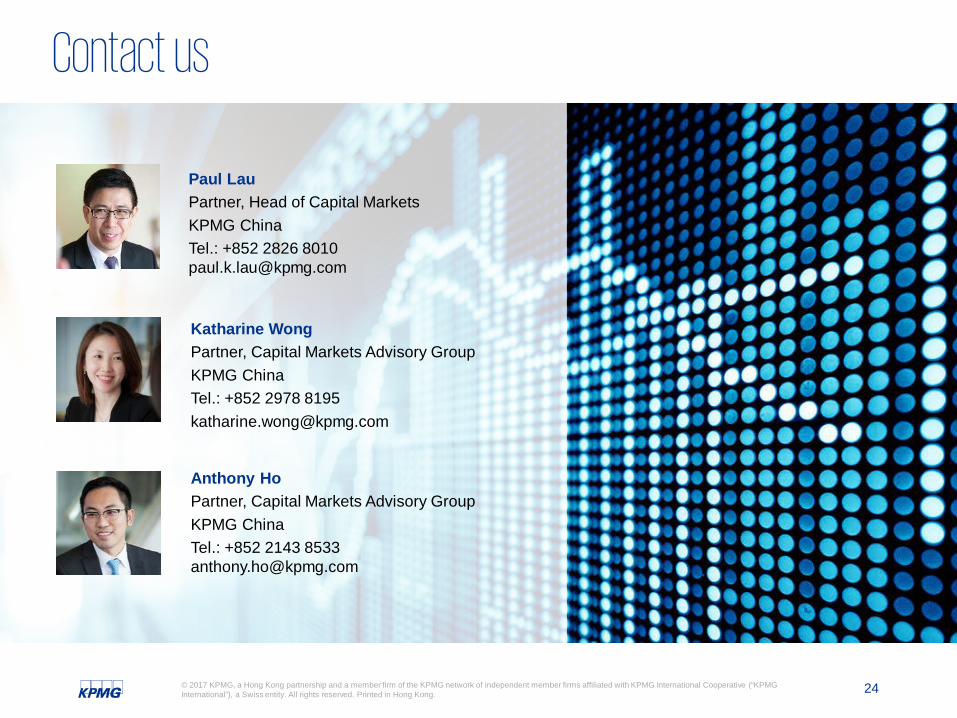
Contact us
Paul LauPartner, Head of Capital Markets KPMG ChinaTel.: +852 2826 [email protected]
Katharine WongPartner, Capital Markets Advisory GroupKPMG ChinaTel.: +852 2978 [email protected]
Anthony HoPartner, Capital Markets Advisory GroupKPMG ChinaTel.: +852 2143 [email protected]
The information contained herein is of a general nature and is not intended to address the circumstances of any particular individual or entity. Although we endeavor to provide accurate and timely information, there can be no guarantee that such information is accurate as at the date it is received or that it will continue to be accurate in the future. No one should act on such information without appropriate professional advice after a thorough examination of the particular situation.
© 2017 KPMG, a Hong Kong partnership and a member firm of the KPMG network of independent member firms affiliated with KPMG International Cooperative (“KPMG International”), a Swiss entity. All rights reserved. Printed in Hong Kong.
The KPMG name, logo are registered trademarks or trademarks of KPMG International.
kpmg.com/socialmedia
Thank you