Embed Size (px)
Citation preview

2006 Healthcare Occupations Report
By: Matthew Kruk
January 31, 2007
MAINE DEPARTMENT OF LABOR
Special Report
STATE OF MAINE
DEPARTMENT OF LABOR
DIVISION OF LABOR MARKET INFORMATION SERVICES 19 UNION STREET AUGUSTA, MAINE
04330-6826
LAURA A. FORTMANCOMMISSIONER
JOHN DORRER DIVISION DIRECTOR
JOHN ELIAS BALDACCI GOVERNOR
2006 Healthcare Occupations Report
Prepared by
Maine Department of Labor Labor Market Information Services
Matthew Kruk
Economic Research Analyst
Issued January 31, 2007 Augusta, Maine
PHONE: (207) 287-2271 TTY 1-800-794-1110 FAX: (207) 287-2947

The Maine Department of Labor provides equal opportunity in employment and programs.
Auxiliary aids and services are available to individuals with disabilities upon request
Tel: (207) 287-2271 TTY: 1-800-794-1110 Fax: (207) 287-2947

Preface The Maine Legislature, through the deliberations of the Joint Standing Committee on Health and Human Services, passed “An Act to Ensure an Adequate Supply of a Skilled Health Care Workforce (L.D. Document 892). This legislation charged the Maine Department of Labor, Division of Labor Market Information Services (LMIS) in conjunction with the Office of Health Data and Program Management, Office of Data, Research and Vital Statistics to compile a health care occupations report. Health services represent not only a vital component for protecting the physical well being of Maine’s people, but also generate over 75,000 jobs and payrolls totaling $2.7 billion dollars annually. One of the keys to a healthy Maine population is the availability of a health care workforce with the skills and qualifications needed to perform complex technical work, patient care and growing number of professional specialties involved in the delivery of health care services. As Maine faces the prospects of growing retirements by baby boomers over the next 30 years, we will face significant challenges in replacing the knowledge, skills and experience of this critical segment of Maine’s workforce. Close monitoring is needed to ensure that workforce availability and skills match the needs of the health care sector. This collaborative effort between the Maine Departments of Labor and Health, and Human Services, Office of Data, Research and Vital Statistics represents the first time that such a comprehensive array of data related to health services employment has been assembled in one report. Funding for this effort was provided through a transfer of Homeland Security emergency funds from the Maine Center for Disease Control, Office of Public Health and Emergency Preparedness to the Maine Department of Labor, Division of Labor Market Information Services The report draws together a wide array of data sources including employment, earnings and occupational projections maintained by the Maine Department of Labor and detailed survey data on licensed, registered and certified professionals collected by the Department of Health and Human Services. Together, these data sources permit more detailed and improved workforce analysis. While every effort was made to compile all the data available, there are some exceptions that must be noted. The multi-year rotational aspect and year-end schedules for license renewals prevented us from including all the data required under the legislation. A complete listing of data inclusions and exclusions is provided in the Appendix of the report. We are pleased to transmit this report in cooperation with the Health Workforce Forum, established under LD 892, section 257. The Forum, made up of representatives of health professions, licensing boards, employers, health education programs and Maine Department of Labor, was convened by the Department of Health and Human Services to review this report and to provide guidance on critical workforce issues confronting this

vital sector. We are indebted to members of the Forum who provided critical guidance in preparing this report. We would also like to acknowledge the valuable review and suggestions that came from the Governor’s Office of Health Policy and Finance and the Maine Health Access Foundation. John Dorrer, Director Labor Market Information Services

Table of ContentsCHAPTER 1 INTRODUCTION Introduction 1 Highlights 3 Recommendations 5 CHAPTER 2 HEALTHCARE INDUSTRY Healthcare Industry 9 Maine’s Healthcare Industry 17 CHAPTER 3 PHYSICIANS, SURGEONS, AND RELATED Physicians and Surgeons, All 25 Physicians and Surgeons, Specialties 35 Physician Assistants 41 Surgical Technologists 45 CHAPTER 4 DENTISTRY AND RELATED Dentist 51 Dental Hygienists 61 Dental Assistants 65 CHAPTER 5 OTHER DOCTORAL-LEVEL PRACTITIONERS Chiropractors 69 Optometrists 73 Podiatrists 77 CHAPTER 6 NURSING Registered Nurses 83 Licensed Practical Nurses 95
CHAPTER 7 DIRECT CARE WORKERS Direct Care Workers 103 CHAPTER 8 THERAPISTS AND RELATED Occupational Therapists 113 Occupational Therapist Assistants 117 Occupational Therapist Aides 121 Physical Therapists 123 Physical Therapist Assistants 127 Physical Therapist Aides 131 Radiation Therapist 133 Recreational Therapists 135 Respiratory Care Therapists and Technicians 139 Massage Therapists 143 CHAPTER 9 PHARMACISTS AND RELATED Pharmacists 147 Pharmacy Technicians 153 CHAPTER 10 HEALTH TECHNOLOGISTS AND TECHNICIANS Medical and Clinical Laboratory Technologists 159 Medical and Clinical Laboratory Technicians 163 Cardiovascular Technologists and Technicians 167 Diagnostic Medical Sonographers 171 Nuclear Medicine Technologists 175 Radiologic Technologists and Technicians 179 Emergency Medical Technicians and Paramedics 183

Table of ContentsCHAPTER 11 DIETITIANS, NUTRITIONISTS, AND RELATED Dietitians and Nutritionists 189 Dietetic Technicians 193 CHAPTER 12 SPEECH-LANGUAGE PATHOLOGY AND AUDIOLOGY Audiologists 199 Speech-Language Pathologists 203 CHAPTER 13 MENTAL HEALTH PROFESSIONALS Social Workers 209 Substance Abuse and Behavioral Disorder Counselors 215 Psychologists 219 CHAPTER 14 OTHER HEALTHCARE OCCUPATIONS Medical Equipment Preparers 225 Medical Records and Health Information Technicians 227 Athletic Trainers 231 Medical Assistants 235 Medical Transcriptionists 239 Opticians 243 Orthotists and Prosthetists 245
WORKS CITED Works Cited 247 APPENDIX Methodology for Data Collection 251 Data Processing 253 Data Editing 253 Sample Survey 255 Table: Physicians and Surgeons, County of Employment and Residence 257

1
Introduction This report is the first in what is anticipated to be a series highlighting the healthcare industry and related workforce data. For optimal use of this report by policymakers, the following sections are provided to explain what data is available and from where it is obtained.
Occupational Description This section describes the featured occupation, as defined by the U.S. Bureau of Labor Statistics. Where applicable, descriptions of subspecialties are provided.
Characteristic Data This data was obtained through surveys of licensed healthcare professionals. During the relicensure process of healthcare workers, surveys were administered and the results of these surveys are presented here. However, many occupations have yet to be surveyed or lack complete data sets; only full data sets were used for this inaugural report.
The methodology for the survey and data collection can be found in the Appendix.
Educational Requirements
This section describes typical educational requirements, as well as licensing requirements, as provided by Choices, an interactive career decision-making program that provides interest and skill profiling as well as career and educational information.
Schools The schools in Maine offering the featured programs are listed in this section. If no program is offered in Maine for a particular occupation, some out-of-state schools are provided—many of which take part in the New England Board of Higher Education’s Regional Student Program, which allows Maine residents access to degree programs not available in Maine. Also provided in this section is completer data for specified programs. This data, provided by IPEDS (Integrated Postsecondary Education Data System), indicates the
Chapter
1

1 I N T R O D U C T I O N
2
number of graduates from the specified program by institution. In some instances, this data is either unclear or incomplete, and, as a result, is not included in this report.
Statewide Employment This information, taken from Labor Market Information Services’ Maine Employment Outlook to 2012, provides 2002 estimated employment, 2012 projected employment, the net change over this ten-year period, the annual growth rate, the annual openings attributed to both growth and replacement needs, and the top industries (in terms of employment) in which the featured occupation is employed.
Maine Job Vacancies As part of a national effort to develop a state and local job vacancy information system, Labor Market Information Services conducted a survey of Maine employers in 2002 and 2005. This survey, the Maine Job Vacancy Survey, approximates the number of job vacancies by occupation and by major industry, as well as at statewide and regional levels. It is important to note that occupations may have information available for 2002, 2005, both years or neither years due to confidentiality reasons.
Wages Wage data is provided from the Occupational Employment Statistics (OES) survey, which produces occupational employment and wage estimates on a semi-annual basis. This section presents entry and experienced wage levels (both hourly and annual) for the state of Maine. A mean wage for Maine and the nation are also provided, as well as the relationship between Maine and national mean wages.
National Employment Taken from U.S. Bureau of Labor Statistics employment projections, this section provides 2002 estimated employment, 2012 projected employment, the net change over this ten-year period, and the annual growth rate.
Supply/Demand/Analysis/Outlook Outlook sections provide narrative outlooks as found in the Occupational Outlook Handbook. Supply, Demand, and Analysis sections are more in-depth than outlook sections and based largely on the characteristic and workforce data available.
1 I N T R O D U C T I O N
3
Highlights erving as a valuable source of workforce information for the healthcare industry, this report is full of important data. This data is largely based upon the surveys completed during the relicensure process of various healthcare professionals. Because relicensure dates differ greatly between occupations, only four datasets are currently complete. As
a result, most of the following highlights focus on these four occupations and represent the depth of information that may be obtained for all licensed occupations in the future. The following items are particularly noteworthy and reflect findings for Maine:
The healthcare industry is the single largest industry in Maine with an average employment of over 75,000 in 2004; this accounted for 13% of all wage and salary employment in the state.1 Wages paid within this industry totaled nearly $2.7 billion, which was 14% of total wages paid in Maine. Nationally, healthcare accounted for nine percent of both employment and total wages—significantly less than that of Maine; this further emphasizes the importance of the healthcare industry to Maine’s economy and its people.
Maine, as a state, is aging rapidly and at a rate faster than that of the rest of the country. Age is often associated as the most significant driver in the demand for healthcare-related services, and, subsequently, employment in healthcare occupations. Thus, the importance of an adequate supply of skilled healthcare professionals should be paramount in Maine, a state nearly unrivaled nationally in terms of aging.
MaineCare, the state-managed program that is funded jointly by the state and federal government to provide health insurance and long-term care to eligible, low-income individuals, insures one out of every five people in Maine.
Inactive licensed healthcare professionals generally report not intending to return to work; these individuals, ultimately, may not be a likely source of labor market participants—although they do maintain current licenses.
A great deal of gender disparity exists within all of the occupations that possessed complete survey data sets.
There are two types of Physicians: MDs—Doctors of Medicine—and DOs—Doctors of Osteopathic Medicine. In Maine, 79% of Physicians are MDs, yet Maine’s only medical school—the University of New England’s College of Osteopathic Medicine—graduates only DOs.
Residency opportunities in Maine are relatively limited as only 26.4% of responding Physicians and Surgeons completed his or her residency in Maine. This is important as residency opportunities are one of the best tools in recruiting and retaining Physicians—especially when one considers how few Maine Physicians are educated in-state.
S

1 I N T R O D U C T I O N
4
Roughly one out of every three Surgeons in Maine is over the age of 60, and one out of every five physicians is at or nearing typical retirement age.
Physician recruitment for rural areas is challenged by lower earning potential, longer hours, and isolation from medical colleagues, coupled with heavy debt loads from over ten years of training, including college, medical school, internship and residency.
The distribution of Specialty Dentists (Oral & Maxillofacial Surgeons, Orthodontists, and Prosthodontists) among Maine counties is extremely concentrated. Survey responses indicate that several counties do not even have one active specialist.
Populations in rural communities find it proportionally more difficult to access dental care than urban populations.
Over 30% of all Dentists in Maine are over the age of 60, and over 68% are over the age of 50. Clearly, impending retirements will have a significant impact on the supply of Dentists.
The demand for Dentists is expected to grow substantially through the year 2012.
Dental Hygienists are expected to be one of the fastest growing healthcare occupations in Maine through the year 2012.
The number of job vacancies for Registered Nurses increased significantly from 2002 to 2005; in 2005 there were an estimated 853 vacancies—an increase of 215 from 2002.
The average age of Registered Nurses in Maine is 48.9 years old. The age distribution of these professionals is uneven and ensuring an adequate supply of Registered Nurses in the future may prove problematic as over 13% of all Registered Nurses over the age of 52 expect to leave nursing within the next five years.
There were 610 total graduates of Maine Nursing Programs during the 2004-2005 academic year.
Over half of all Licensed Practical or Vocational Nurses (LPNs) are between the ages of 52 and 71. Thus, retirement concerns similar to that of RNs exist.
Nursing Aides, Orderlies, and Attendants, a subset of Direct Care Workers, have experienced a persistence of significant vacancies. In 2005, the job vacancy rate has dropped only slightly from 2002, and there were an estimated 1,038 vacancies. Additionally, Personal and Home Care Aides, another subset of Direct Care Workers, has also experienced a persistence of significant vacancies. In 2005, there were an estimated 720 vacancies for this occupation.

1 I N T R O D U C T I O N
5
Recommendations The following recommendations refer to the methodology of the project and are made to the Healthcare Workforce Forum. Continue report
The continuation of this report and associated survey efforts by the Office of Data, Research, and Vital Statistics, Division of Public Health Systems, Maine Center for Disease Control and Prevention (Maine CDC) will allow for longitudinal analysis to identify trends within the industry and individual occupations. These trends may prove to be incredibly important in ensuring an adequate supply of skilled healthcare professionals. It is suggested that this comprehensive report be completed every four years, and that situational reports be completed annually. Focus on key occupations
The vast number of specialized occupations within the healthcare industry limits the level of analysis of any one particular occupation. By focusing on key occupations, a deeper level of analysis can occur. Although this additional analysis may come at the expense of the scope of the project, some occupations are obviously of greater concern to policymakers. The identification of these occupations would allow the report to narrow its focus and, ultimately, improve the information available to—and needed by—policymakers. Per advice of the Healthcare Workforce Forum, these key occupations are as follows:
• Physicians and Surgeons, All • Physician Assistants • Surgical Technologists • Dentists • Dental Hygienists • Registered Nurses, including Nurse Practitioners • Direct Care Workers • Occupational Therapists • Physical Therapists • Radiation Therapists • Respiratory Care Therapists and Technicians • Pharmacists • Pharmacy Technicians • Speech-Language Pathologists • Social Workers

1 I N T R O D U C T I O N
6
Improve collaboration with other organizations
Ensuring an adequate supply of healthcare professionals is an important objective of numerous organizations and affiliations. As a result, overlap exists between this report and the efforts of other organizations. An effort should be made to reduce duplicative work and to foster collaboration among organizations to improve data and analysis. Although some of these organizations may have an agenda or platform, resources and knowledge may be shared in a mutually beneficial relationship. Increase emphasis on skills
In addition to assessing supply, identifying potential labor market entrants would provide policymakers with information valuable in ensuring an adequate supply of healthcare professionals. To accomplish this, an increased emphasis on skills, rather than job titles, would highlight those occupations with skill sets best suited to work in healthcare occupations. Those with desired skill sets may prove invaluable as potential stopgaps during periods characterized by shortages of healthcare professionals. Explore Career Ladders
The exploration of career ladders in a subsequent report could identify the feasibility and potential of developing existing entry-level healthcare workers into higher-level professionals (e.g. LPN to RN) through the further development of knowledge, skills, and abilities. Turnover, specifically that of Registered Nurses, should be analyzed by sector
Within the RN labor market, significant vacancies exist—possibly as the result of turnover. The level of turnover for the various industries in which RNs are employed should be determined to find which industries are in need of systemic or fundamental change. Increase the use of job vacancy data
Existing job vacancy data, or perhaps a survey of job vacancies within the healthcare industry, should be further utilized to help identify supply concerns with factual—rather than anecdotal—evidence. Extend wage and employment data, as well as subsequent analysis, to the industry level
Many healthcare occupations operate within several industries, and industry conditions may differ greatly from one to another. To address this, employment and wage data should be presented not only as an aggregate, but at the industry level as well.

1 I N T R O D U C T I O N
7
Improve educational data
Assessing Maine’s graduate capacity of healthcare programs is very difficult as enrollment data at a program level—as well as wait-list data—is unavailable from the Integrated Postsecondary Education Data System. As a major source of healthcare professionals, the enrollment and completer data for all healthcare-related educational programs is a very important component when assessing present and future supply. The finest source of this data is the 2005 Survey of Maine Nursing Education Programs—an actual survey of Maine schools. To do this for all healthcare-related programs would be a significant effort, but not prohibitive as there are relatively few schools in Maine. Improve and standardize surveys
The surveys should no longer allow respondents to write-in his or her specialty or occupations; instead, respondents should be asked to select the SOC-defined occupation or specialty under which they fit best. This form of self-reporting will aid in the reconciliation of occupations recognized by the licensing boards and those used by the Department of Labor and the U.S. Bureau of Labor Standards. Numerous occupations are surveyed for this report, and, although surveys need to be occupation-specific, some information should be common to all. These common fields should be identified and made standard in all surveys to ease in the parsing and analysis of large datasets.

9
Healthcare Industry The healthcare industry is vital to the state of Maine, not only as a provider of services, but also as an employer. The healthcare industry is the single largest industry in Maine with an average employment of over 75,000 in 2004; this accounted for 13% of all wage and salary employment in the state.1 Wages paid within this industry totaled nearly $2.7 billion, which was 14% of total wages paid in Maine. Nationally, healthcare accounted for nine percent of both employment and total wages—significantly less than that of Maine; this further emphasizes the importance of the healthcare industry to Maine’s economy and its people. With the healthcare industry serving such a vital role in both the health of the economy and the health of Maine’s people, it is imperative to understand the forces which influence this industry. These forces are numerous, and, often, very complex, and, as the inaugural report in what is intended to be a series, many of these forces are not addressed in this report; however, some major forces are addressed. The overall healthiness of Maine’s people, the relationship between age and health services demanded, the overall supply of healthcare workers, the economics of health insurance coverage, the role of MaineCare, and the structure of the industry are all addressed in this report, as well as the implications for each of these forces.
The Health of Maine’s Population The healthiness-or, rather, unhealthiness—of a state’s population is a significant force within the healthcare industry that ultimately impacts the industry in two particular ways—the direct demand for services related to unhealthy behaviors and the systemic and policy changes resulting from assessments of the state’s overall health.
Unhealthy behaviors directly impact the healthcare industry as these behaviors inevitably require healthcare and, often, years of prolonged care. As the healthcare industry is likely to become increasingly overburdened, care necessitated by unhealthy behaviors will be a poignant issue as much of this care could be avoided through improved public awareness, education, and, ultimately, lifestyle changes. Four particular areas in which significant opportunities for improvement exist: tobacco use, physical inactivity, nutrition, and obesity.
Chapter
2

2 H E A L T H C A R E I N D U S T R Y
10
One Healthy Maine Partnerships release notes that almost one-quarter (24%) of Maine adults are current smokers.2 The health risks associated with smoking are well documented and often require prolonged treatment, thus placing a greater burden on the healthcare system. However, Maine high school smoking rates have dropped significantly from 38% in 1995 to 25% in 20012; this downward trend bodes well for a healthcare industry that may experience difficulty in meeting demand.
Physical inactivity is an unhealthy behavior that is much more prevalent in Maine than tobacco use. Although the health risks associated with physical inactivity may not be as well documented or publicized as those associated with tobacco use, they are serious, and due to the large number of individuals that are physically inactive, will have a significant impact on the healthcare industry. The magnitude of this issue is evident as “over half (56%) of Maine adults have a sedentary lifestyle.”2
Nutrition is another issue that may impact the healthcare industry and, more specifically, the demand for healthcare services. Poor and unbalanced diets can be a source of many health problems—which is especially concerning when one considers that “only one-quarter (25%) of Maine adults eat the recommended five servings of fruits and vegetables daily.”2
Obesity is a significant health concern that will likely further impact the demand for healthcare services. According to one Healthy Maine Partnerships release, “over half (56%) of Maine adults are either overweight or obese,” and, disturbingly, from 1988 to 1998, “the percentage of Maine adults who are either overweight or obese has increased 20%.”2 This trend is especially disturbing when one considers the increased health risks associated with obesity—heart disease, stroke, Type-2 diabetes, fatty liver disease, gallbladder disease, breathing problems, and arthritis—and the healthcare necessary to treat these potential problems in over half of Maine’s adult population.
Income levels are also strongly correlated with health status and, thus, the intensity of use of healthcare services. Taking all other demographic factors into account, income has, by far, the greatest impact on mortality—even greater than high risk behaviors such as smoking, drinking, lack of exercise or obesity.3 Additionally, there are persistent gaps in health status between low income and higher income people, leading some to note that income “inequality is a health hazard.”4 The impact of income on health status is especially important as Maine’s people are poorer than the rest of the nation, with a 2003 median household income of $39,212 versus $43,318, according to the U.S. Census Bureau.
Also, Maine has high rates of largely preventable chronic illnesses. Four leading causes of death—cardiovascular disease (heart disease and stroke), diabetes, chronic lung disease, and cancer—account for approximately 70% of Maine deaths each year.5 These conditions also account for a good deal of the disability of experienced by Maine people each year. The burden of morbidity and mortality associated with these conditions totaled almost $2.5 billion in Maine in 1999.5

2 H E A L T H C A R E I N D U S T R Y
11
As demand for healthcare services increases and the healthcare system becomes increasingly burdened, the aforementioned health concerns are likely to become even more prominent issues. These issues, along with other indicators of public health, are captured in health assessment indices—which, combined with public interest and opinion, often help dictate policy decisions regarding health.
In America’s Health Rankings-2005 Edition, Maine ranked 8th overall (as seen in table at right).6 This type of ranking can be viewed as “a measure of the health promotive capacity of a state,” and, specifically, what resources exist and what actions the state government is taking to help people realize improved health.7 The fact that Maine scores so high is indicative of the state’s commitment to the health of its people, as well as a strong indicator of the potential impact of systemic and policy changes on the healthcare industry in Maine.
2005 America's Health Rankings: Top 10 States
Rank State 1 Minnesota 2 Vermont 3 New Hampshire 4 Utah 5 Hawaii 6 North Dakota 7 Connecticut 8 Maine 9 Massachusetts 10 Iowa
Age and Demand Age is also a significant determinant of healthcare demand, and this relationship is especially noteworthy in Maine, a state that, by all accounts, is aging rapidly. In 2000, 14.4% of all Maine residents were aged 65 and older; this was the seventh highest percentage among all states. The state median age for that same year was 38.6 years old.8 In 2005, the average age of Maine residents was 41.1 years old, which makes Maine the oldest state in the country. In 2030, the U.S. Census Bureau predicts that 26.5% of all Maine residents will be aged 65, and the median age at this time would be 46.9 years old. Clearly, Maine, as a state, is aging rapidly and at a rate faster than that of the rest of the country. Age is often associated as the most significant driver in the demand for healthcare-related services, and, subsequently, employment in healthcare occupations. Thus, the importance of an adequate supply of skilled healthcare professionals should be paramount in Maine, a state which is nearly unrivaled nationally in terms of median age and aging. The direct relationship between age and healthcare services required is apparent in the U.S. Census Bureau report Health Status, Health Insurance, and Health Services Utilization: 2001. One aspect of this report presents health service utilization rates by economic and demographic characteristics—with age being the primary concern for this analysis.

2 H E A L T H C A R E I N D U S T R Y
12
The results of this survey corroborate widely held beliefs regarding the relationship between aging and health services required. The following figures illustrate healthcare services utilized by age group, and indicate that as one ages, his or her frequency of doctor visits and use of prescription medications increase dramatically.9 The survey also indicates that the percentage of people with no hospital stays in a year decreases as one ages, further corroborating the direct relationship between aging and healthcare services required. Clearly, a direct relationship exists: as one ages, one’s utilization of healthcare resources increases. Establishing and accepting this relationship underscores the importance of the healthcare industry in Maine—particularly in the future as the state ages and the demand for healthcare services increases.
Percentage Distribution of Frequency of Doctor Visits Over the Previous 12 Months by Age: 2001
9.3
20.5
29.6
35.3
34.4
33.0
43.2
43.3
45.2
57.7
36.4
26.5
21.4
20.4
43.9
Aged 65 and above
Aged 45 to 64
Aged 25 to 44
Aged 18 to 24
Aged 0 to 17
Never 1 to 3 times More than 3 times
Percentage Distribution of Frequency of Prescription Medicine Over the Previous 12
Months by Age: 2001
16.3
37.7
56.0
65.9
64.7
5.2
11.4
17.2
25.2
78.6
50.9
25.2
16.9
10.2
18.8
Aged 65 and above
Aged 45 to 64
Aged 25 to 44
Aged 18 to 24
Aged 0 to 17
Never Ever, not regularly Regularly
Percentage With No Hospitals Stays Over the Previous 12 Months by Age: 2001
81.3%
90.9%
92.2%
92.6%
94.7%
Aged 65 and above
Aged 45 to 64
Aged 25 to 44
Aged 18 to 24
Aged 0 to 17

2 H E A L T H C A R E I N D U S T R Y
13
Supply of Healthcare Workers Not only does the aging population of Maine create a significant demand for healthcare services, but it also greatly affects the supply of skilled healthcare professionals in the state. As the median age in Maine increases, a larger and larger portion of Maine’s population will be reaching typical retirement age; thus, a mass exodus of workers from the workforce—a large portion of which are healthcare professionals—will occur. Unfortunately, for many of these occupations an adequate supply of replacements at a given time may not exist for a number of reasons other than the skewing demographics of the state.
One particular reason why an adequate supply of healthcare professionals may not exist is the lag time that occurs between policy changes and the arrival into the workforce of program completers generated by the changes. Policymakers may make changes to remedy shortages in specific occupations, but healthcare professionals generally require a significant amount of technical training. The time required to complete such training creates a lag, and, during this time, those requiring healthcare services may experienced decreased levels of service as a shortage occurs. Because of this lag time associated with healthcare service occupations, policymakers must be proactive and progressive in decision-making.
Ensuring an adequate supply of all healthcare workers—specifically entry-level direct care workers—will continue to be a major difficulty as healthcare facilities are facing reduced reimbursements from private insurance companies and other payers. These reduced reimbursement levels are reflected in the wages for several healthcare occupations (mostly entry level positions), and these wages are too often less than those paid in other, non-healthcare occupations requiring similar skills and training.10 As a result of reduced reimbursements, healthcare service providers are finding themselves unable to offer the necessary wages to attract workers at a time when higher wages are needed to close the gap between supply and demand.
The Economics of the Healthcare Industry A range of other factors also affect the utilization of healthcare services. These factors include the design of health insurance policies, the phenomenon of supply driving the demand and use of healthcare services and the variation in healthcare practice attributable in part to the failure to use evidence-based practices to guide healthcare choices.
The very design of health insurance policies can result in increased utilization. The fundamental concept of health insurance is that those seeking coverage are choosing to pay a predictable monthly premium—plus some sort of co-pay each time they use services—rather than assume the risk of paying the full amount associated with illness and injury they would face if uninsured. Consistent with national averages, roughly 60% of Maine’s population is enrolled in insurance offered by employers as part of employee compensation plans.

2 H E A L T H C A R E I N D U S T R Y
14
A well known study known as the RAND Health Insurance Experiment11 found that by insulating patients from the true cost of services—that is, from the full amount that health care providers are actually paid—insurance can lead to an increased use of services. Specifically, RAND found that those with lower cost-sharing used more services than those with higher cost-sharing. Increased use of services leads to an increase in insurance premiums to cover the payments that insurance companies make to healthcare providers.
This has lead to proposals by some to promote high-deductible policies, which, supporters argue, will introduce market forces to healthcare consumption, encouraging patients to “shop around” for services, which, in turn, will promote providers to improve their quality and lower their prices, as well as encouraging patients to limit their use of services to only necessary services.
Skeptics of high deductible policies argue, on the other hand, that because the vast majority of healthcare spending is incurred on behalf of a small segment of the population (often referred to as the “80/20 rule”), high deductible policies would have only a very small impact on overall health spending, since the discretionary care that healthier people may choose to forego under a high deductible policy is only a small part of total healthcare spending; sicker people—on whose behalf the majority of healthcare spending is incurred—would not end up consuming less care, so the reduction on overall healthcare spending would be only minimal.
Further, the RAND Health Insurance Experiment also found that the reduced use of services that accompanied higher cost sharing had a harmful effect on the health of lower income populations. A more recent study by the Commonwealth Fund found that those enrolled in high-deductible policies are more likely to forego necessary care because of cost.12 This may lead to these individuals becoming sicker and eventually requiring treatment in a higher cost settings for which they cannot afford to pay. Providers then pass these unpaid costs on to other premium payers, thus making premiums even higher.
In any case, more and more people in Maine—and the nation—are being covered by higher deductible policies as employers and individuals seek to curb annual premium increases. This increased enrollment will assist in evaluating such policies’ effect on health status and the healthcare market as the debate regarding such policies’ value continues.
Equally important in understanding healthcare utilization is the well-documented phenomenon that—unlike in traditional economics, in which the amount consumed is ultimately determined by providers’ and consumers’ willingness to supply and consume different quantities at different prices—in health care, supply actually drives demand, even when additional utilization provides no improvement in health outcomes.13 This means that utilization can be influenced by managing the healthcare infrastructure (i.e. investing only in infrastructure that is matched to the needs of the population) so as not to induce unnecessary utilization. Such management is the purpose of the state’s Certificate of Need program.
Finally, research has show that there is tremendous variation in how medicine is practiced in different geographic areas,13 and Maine is not exempt from this as similar patients in different towns are receiving different care, even if there are no differences in patient health.14
2 H E A L T H C A R E I N D U S T R Y
15
MaineCare Medicaid, known in Maine as MaineCare, is a state-managed program that is funded jointly by the state and federal government to provide health insurance and long-term care to eligible, low-income individuals. Those eligible and served by MaineCare include parents, children, seniors, and people with disabilities. Currently, MaineCare insures one out of every five people in Maine.15
The economic impact of the MaineCare program extends far beyond the 20% of Maine’s population that it actively insures. This program, in providing health insurance to those otherwise unable to afford coverage, also reduces the state’s total healthcare costs, and, ultimately, prevents the health insurance premiums of those with coverage from increasing even more dramatically. This is accomplished by lessening the number of uninsured individuals whose healthcare costs are often passed on by hospitals and service providers to private insurance companies or those who pay for services. These insurance companies then, in turn, pass these costs on to consumers in the form of higher premiums. MaineCare, through its coverage of those unlikely to be otherwise insured, essentially reduces the costs of charity care and bad debt, and, thus, prevents the shifting of these costs to the insured.
Additionally, the MaineCare program also reduces the state’s total healthcare costs in that it enables individuals to seek treatment in a lower-cost setting that may not have been utilized had the individual been uninsured. For example, an individual covered by MaineCare may seek treatment for an illness, injury or ailment early in its onset, whereas an individual without coverage with the same affliction may go untreated. This uninsured individual’s condition, without proper treatment (such as that received by those covered), may worsen, and, ultimately, require treatment in a higher-cost setting—such as the emergency room. Thus, the MaineCare program effectively helps shift treatment from high-cost settings to low-cost settings, and this benefit is enjoyed by everyone—including the insured.
Clearly, the impact of MaineCare on the healthcare industry in Maine is substantial; not only does the program serve 20% of the state’s population, but it also enables these individuals to pursue treatment in lower-cost settings, which provides both social and economic benefits for all. However, the impact that MaineCare has on this industry in the future may differ greatly from that of today as state decision-makers alter the government’s role in healthcare.
As a program partly funded by the federal government, MaineCare is subject to federal regulation. Federal law dictates that states must provide coverage through Medicaid programs to specific groups of people, and requires that this coverage must include specific services; however, states can choose to make other services and categories of people eligible. In these areas that are at the discretion of the states, MaineCare may experience changes in the future. Although politics are largely beyond the scope of this project, it must be noted that the MaineCare program is highly sensitive to political pressures and this must be considered when attempting to analyze future demand. MaineCare plays a significant role within this industry and
2 H E A L T H C A R E I N D U S T R Y
16
the effects of changes to this program will likely reverberate throughout the healthcare industry, which will affect the demand for services and products.
Analysis Overall, the healthcare industry is characterized by inefficiencies and the misalignment of resources, consumers, and incentives, as well as political pressures. A range of factors contribute to utilization levels that do not fit the true health care needs of the population. Increased utilization leads to increases in premiums. Those no longer able to afford coverage join the ranks of the uninsured—some of whom, luckily, will receive coverage through MaineCare or Dirigo Choice. Those individuals left without coverage may find themselves receiving future treatments in high-cost settings, as low-cost preventative services may have been seemingly inaccessible. As the correlation between insurance coverage and the cost settings associated with treatment or prevention becomes clear, pressures for the expansion of MaineCare or other health insurance programs may intensify. And while all of these factors impact demand, which is central to this report’s theme, there are the powerful impacts of health status, income, and age on demand for healthcare in Maine.
While public health efforts to lessen unhealthy behaviors—as well as economic development efforts, through their impact on income—can improve health status and thus lessen the growth in demand for healthcare services, the age of the population is a factor over which we have less control. A direct correlation between age and healthcare services required exists, and this, as well as the fact that in 2030 Maine will be the second oldest state in the nation, makes it apparent how important the healthcare industry is—and will be—as a service to the people of this state.
Compounding this importance is the fact that the healthcare industry is a “captive”; while national trends show people increasingly seeking out cheaper care across state and even country lines, as long as most individuals requiring healthcare services do not leave Maine, the majority of occupations within this industry can’t be outsourced or relocated. This fact provides a level of security and stability for the industry, which is something that many Maine industries have not had the recent luxury of experiencing. This industry is unique in that it is guaranteed to be here for quite some time (until the effects of the baby-boom generation ebb), and is very likely to experience continued growth during this same time.
However, we must also be aware that it is our taxes and premiums that pay for healthcare. Thus, while the industry can provide jobs, the healthcare industry is paid for by resources that could be directed elsewhere in Maine’s economy, so healthcare expenses can also be a drag on the economy, since as businesses pay higher health insurance premiums, they are less likely to increase wages or hire new workers.16
Currently, the healthcare industry is one chronicled by the misalignment of healthcare needs and healthcare services. Those requiring treatment, but without health insurance, may often wait for or delay treatment after an injury or illness occurs, which may result in placing themselves in higher-cost care settings—the costs of which may end up being paid for by everyone. While this

2 H E A L T H C A R E I N D U S T R Y
17
occurs, a variety of factors often result in people with insurance receiving care that they do not need, which results in higher premiums. In an industry that may potentially experience an inadequate supply of skilled workers—and in which healthcare costs can be a drag on the economy—aligning individuals with the appropriate level of care is paramount in maintaining costs for everyone.
In understanding the potential outcomes for this industry, one must first understand the industry as it exists now; this information is provided in the following section.
Maine’s Healthcare Industry
Industry StructureThe employment structure within the Maine healthcare industry is somewhat different from the nation, with a larger share of jobs in nursing and residential care facilities, and a smaller share in ambulatory health care services. The higher share of jobs in nursing and residential care facilities is largely attributed to Maine’s higher than average share of the elderly population. In Maine, 7.2% of the population is aged 75 and over, compared to only 6.1% nationally.1 Also contributing to the high share of jobs in nursing and residential care services is the interesting fact that Maine, compared to the nation, has nearly three times as many jobs in residential mental health facilities relative to its population.

2 H E A L T H C A R E I N D U S T R Y
18
Growth
Employment in health care grew at nearly three times the all-industries average between 1994 and 2004. The fastest growth was among ambulatory health care providers and the slowest growth was in hospitals.
Ambulatory Healthcare Services The structure of ambulatory healthcare services in Maine is similar to the nation, with nearly 68 percent of the 24,027 jobs in offices of physicians, home health care services, and offices of dentists in 2004.

2 H E A L T H C A R E I N D U S T R Y
19
Between 1994 and 2004 the fastest ambulatory care job growth was among the smaller providers, particularly medical and diagnostic labs, up 141 percent; outpatient care centers, up 156 percent; and offices of other health care providers, up 102 percent. Other health care providers include offices of chiropractors, optometrists, mental health practitioners, specialty therapists, and podiatrists.
Nursing and Residential Care
The structure of Maine nursing and residential care employment differed somewhat from the nation, with a higher share in residential mental health care and a lower share in nursing care. Although Maine had a lower share in nursing care, the state still possessed a higher number of nursing care jobs relative to the size of its population.

2 H E A L T H C A R E I N D U S T R Y
20
Between 1994 and 2004, the fastest job growth was among residential mental health, up 101 percent; community care facilities for the elderly, up 106 percent; and other residential care, up 165 percent. The number of jobs in nursing care facilities declined roughly four percent, partly due to the Medicare program shifting to lower cost types of care for the elderly. Employment estimates for nursing and residential care, as well as ten-year growth rates, are illustrated in the following chart.

2 H E A L T H C A R E I N D U S T R Y
21
Wages The average wage in the health care industry in Maine was $35,690 in 2004, twelve percent higher than the all-industries average. This was likely a major contributor to lower-than-average job turnover within this industry, and turnover, as evidenced in the following chart, was generally highest in the lowest paying industries.


23
Physicians, Surgeons, and Related This chapter focuses on Physicians and Surgeons—both Allopathic and Osteopathic—and those directly assisting them. It is important to note that this group of Physicians and Surgeons has historically been surveyed by the Maine CDC and a complete dataset for these occupations exists and is used in the following analysis. Other doctoral-level health professions that are not surveyed by the Maine CDC are found in Chapter 5.
Physicians and Surgeons, All 25 Physicians and Surgeons, Specialties 35 Physician Assistants 41 Surgical Technologists 45
Chapter
3

3 P H Y S I C I A N S , S U R G E O N S , A N D R E L A T E D
25
Physicians and Surgeons, All Physicians and Surgeons serve a fundamental role within the healthcare industry and society. This group of healthcare professionals—which includes numerous specialties—diagnose illnesses and prescribe and administer treatment for people suffering from injury or disease. The importance of the care provided by these individuals is evident—as is the importance of ensuring an adequate supply of Physicians and Surgeons. However, ensuring this supply may also prove challenging as Physicians and Surgeons are part of an international—rather than national—labor market and the recruitment of needed specialists to specific geographic areas may prove problematic. Further complicating matters is the fact that, as a group, Physicians and Surgeons are comprised of numerous specialty-defined labor markets (e.g. anesthesiology or pediatrics) that may experience differing levels of supply, demand, and compensation, as well as differing needs of labor market participants.
In addressing the need for information to help ensure an adequate supply of Physicians and Surgeons, this report provides data at both the group (All Physicians and Surgeons) and specialty levels from the Occupational Employment Statistics (OES) Survey and a survey developed and administered during the relicensure process by the Maine CDC.
Characteristic Data The licensure of Physicians and Surgeons in Maine is carried out by two separate, autonomous boards of licensure, the Board of Licensure in Medicine for allopaths and the Board of Osteopathic Licensure for osteopaths. The Maine CDC, in collaboration with these boards, designed a survey to be enclosed with the relicensure application, mailed, filled out voluntarily by licensees, and returned to the boards. The data from these responses was then entered and maintained in a data file by the Maine CDC. This data file contained 1,975 responses for the 2004 renewal, which indicated response rates of 97.0% for allopathic physicians and 93.7% for osteopathic physicians. The following data for Physicians and Surgeons, and, when possible, broken down by specialty, is designed to address the needs of health planners, educators, researchers, and policymakers, and is obtained from the aforementioned data file, which is updated every two years.
Additional data is provided from the Occupational Employment Statistics (OES) survey, which produces occupational employment and wage estimates on a semi-annual basis.

3 P H Y S I C I A N S , S U R G E O N S , A N D R E L A T E D
26
Both surveys indicate a consistent distribution by specialty among Physicians and Surgeons, as shown in the following table.
Survey Results: Physician Distribution by Specialty Maine CDC OES
Specialty Total
Responses Percentage Employment Percentage Anesthesiologists 91 4.6% 124 3.9% Family & General Practitioners 414 21.1% 825 25.8% Internists, general 255 13.0% 291 9.1% Obstetricians & Gynecologists 82 4.2% 134 4.2% Pediatricians 125 6.4% 142 4.4% Psychiatrists 170 8.6% 198 6.1% Surgeons 179 9.1% 450 14.1% Physicians & Surgeons, all other 650 33.1% 1,033 32.3% Total 1,966 100.0% 3,197 100.0%
Physician and Surgeons are typically male-dominated occupations, and this, in fact, is the case in Maine. Of those Physicians and Surgeons either living in or working in Maine, 72.3% are male, and only 27.7% are female. This disparity may be a significant issue in the future as demand for Physicians and Surgeons increases. As demand rises, women will be a largely untapped resource of potential medical school, and, later, labor market entrants. In determining and ensuring an adequate supply of healthcare professionals, age is a very important component as retirement will be a significant source of attrition for Physicians and Surgeons. Roughly one out of every five physicians is at or nearing typical retirement age in Maine.
Physicians & Surgeons: Characteristic Data Age Mean Over 60 50.9 21.3% Gender Male Female 72.3% 27.7% Activity Status Number Inactive Percentage
108 5.5% The number of inactive (or non-practicing) licensed Physicians also impacts supply as these individuals may renew their licenses, yet do not provide direct patient care. Although these individuals maintain licenses, they may work in fields such as administration, research or policy.

3 P H Y S I C I A N S , S U R G E O N S , A N D R E L A T E D
27
It is important to understand how many licensed, inactive professionals exist and their reasons for not practicing as these individuals could help fill critical gaps between supply and demand. Those reasons cited for inactivity, as well as age data for those reporting inactivity, are provided in the following table.
Licensed Physicians and Surgeons: Reasons Why Inactive Reason Number Percentage Mean Age Age Range
Working in another field and seeking work as a physician
2 1.9% 66 64 – 68
Working in another field and not seeking work as a physician
5 4.6% 57.6 46 – 74
Unemployed and seeking work as a physician
4 3.7% 54.5 34 – 66
Retired/not intending to return to work
79 73.1% 75.5 54 – 94
Not working due to household responsibilities
10 9.3% 45.1 38 – 50
In training 1 0.93% 50 NA
Other 6 5.6% 57.8 52 – 69 Of the 108 inactive Physicians and Surgeons, only six are actively seeking work as a physician. Thus, the impact of inactive licensees on the labor market may be minimal. Another aspect of supply is the number of healthcare professionals licensed and living in Maine, but practicing elsewhere. Fifteen Physicians and Surgeons responded that they live in Maine, but work out-of-state; as expected, nearly half of these individuals are employed in New Hampshire. Out-of-state employment numbers, by state, are provided in the table below for Physicians and Surgeons living in Maine
Physicians & Surgeons: Residing in Maine, Working Out-of-State
State Number Connecticut 2 Kansas 1 Massachusetts 2 Minnesota 1 New Hampshire 7 New York 1 Rhode Island 1
Of the seven Physician and Surgeons working in New Hampshire, five (71.4%) reside in York County.

3 P H Y S I C I A N S , S U R G E O N S , A N D R E L A T E D
28
Educational Requirements
It takes many years of education and training to become a physician: four years of undergraduate school, four years of medical school, and three to eight years of residency training, depending on the specialty selected. The minimum educational requirement for entry into a medical school is three years of college; most applicants, however, have at least a bachelor's degree, and many have advanced degrees. All States, the District of Columbia, and U.S. territories license physicians. When Physicians complete training, most take national certifying board examinations in their specialty and must meet license requirements to practice in a specific state or U.S. territory.
Schools In looking at the schools in Maine’s physician workforce, it is important to understand that there are two types of medical schools and physicians: MD—Doctor of Medicine—and DO—Doctor of Osteopathic Medicine. MDs are also known as allopathic physicians. While both MDs and DOs may use all accepted methods of treatment, including drugs and surgery, DOs place special emphasis on the body’s musculoskeletal system, preventative medicine, and holistic patient care. DOs are more likely than MDs to be primary care specialists, although they can be found in all specialties. About half of DOs practice general or family medicine, general internal medicine, or general pediatrics. The role and distribution of MDs and DOs in Maine is especially noteworthy as Maine’s only medical school is osteopathic—yet nearly four out of five physicians and surgeons are MDs; this indicates that nearly 80% of physicians in Maine attend school outside of the state. The following table indicates the percentage distribution of MDs and DOs in Maine.
Percentage Distribution of MDs and DOs Total MD DO All Physicians & Surgeons 1,966 79.0% 21.0%
As the only provider of a medical program in Maine, the graduate capacity of the University of New England’s Osteopathic Medicine program is an important factor in ensuring an adequate supply of Physicians and Surgeons in Maine. Graduation data for the academic year 2003-2004 is provided in the following table.
Physicians & Surgeons: Educational Programs and Completers Institution Program Credential/Degree/Award Completers
University of New England
Osteopathic Medicine/Osteopathy
First-professional degree 104
3 P H Y S I C I A N S , S U R G E O N S , A N D R E L A T E D
29
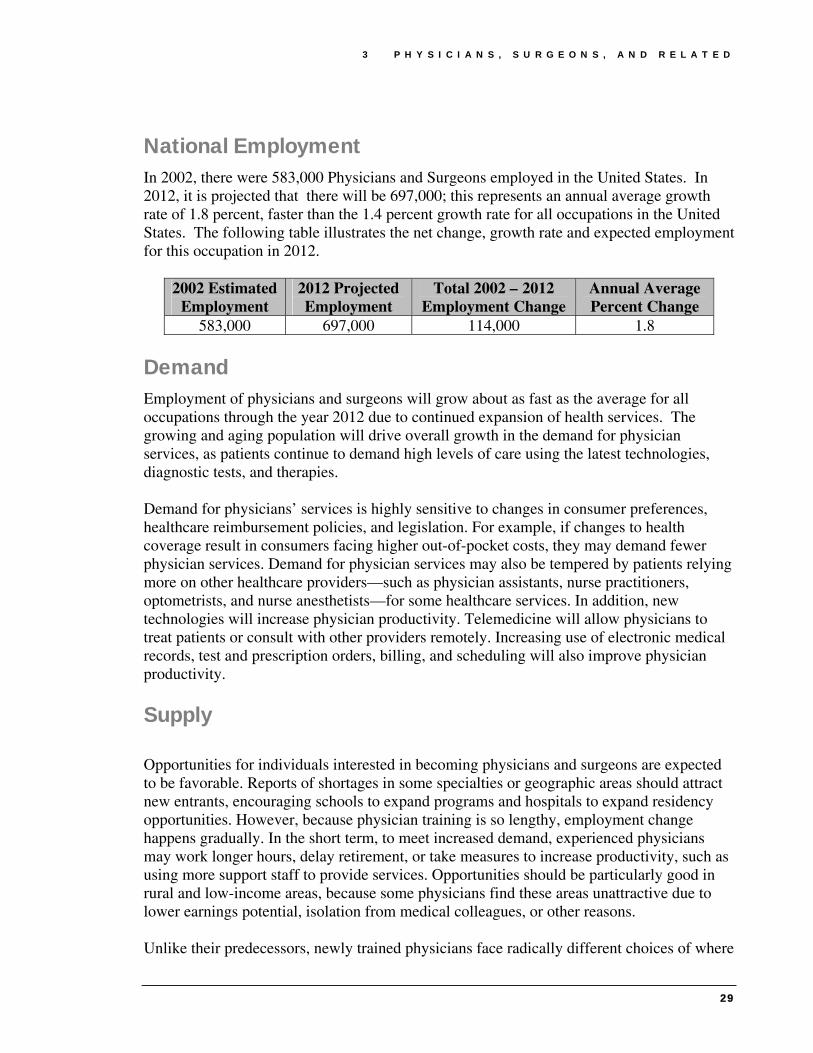
National Employment In 2002, there were 583,000 Physicians and Surgeons employed in the United States. In 2012, it is projected that there will be 697,000; this represents an annual average growth rate of 1.8 percent, faster than the 1.4 percent growth rate for all occupations in the United States. The following table illustrates the net change, growth rate and expected employment for this occupation in 2012.
2002 Estimated Employment
2012 Projected Employment
Total 2002 – 2012 Employment Change
Annual Average Percent Change
583,000 697,000 114,000 1.8
Demand Employment of physicians and surgeons will grow about as fast as the average for all occupations through the year 2012 due to continued expansion of health services. The growing and aging population will drive overall growth in the demand for physician services, as patients continue to demand high levels of care using the latest technologies, diagnostic tests, and therapies. Demand for physicians’ services is highly sensitive to changes in consumer preferences, healthcare reimbursement policies, and legislation. For example, if changes to health coverage result in consumers facing higher out-of-pocket costs, they may demand fewer physician services. Demand for physician services may also be tempered by patients relying more on other healthcare providers—such as physician assistants, nurse practitioners, optometrists, and nurse anesthetists—for some healthcare services. In addition, new technologies will increase physician productivity. Telemedicine will allow physicians to treat patients or consult with other providers remotely. Increasing use of electronic medical records, test and prescription orders, billing, and scheduling will also improve physician productivity.
Supply Opportunities for individuals interested in becoming physicians and surgeons are expected to be favorable. Reports of shortages in some specialties or geographic areas should attract new entrants, encouraging schools to expand programs and hospitals to expand residency opportunities. However, because physician training is so lengthy, employment change happens gradually. In the short term, to meet increased demand, experienced physicians may work longer hours, delay retirement, or take measures to increase productivity, such as using more support staff to provide services. Opportunities should be particularly good in rural and low-income areas, because some physicians find these areas unattractive due to lower earnings potential, isolation from medical colleagues, or other reasons. Unlike their predecessors, newly trained physicians face radically different choices of where

3 P H Y S I C I A N S , S U R G E O N S , A N D R E L A T E D
30
and how to practice. New physicians are much less likely to enter solo practice and more likely to take salaried jobs in group medical practices, clinics, and health networks. In Maine, medical school opportunities are limited to the University of New England—and this school is New England’s (rather than just Maine’s) medical school. As a result, many Maine students are forced to leave the state for over ten years to obtain education, training, and residency. During these years, the aspiring physicians and surgeons establish lives outside of Maine, and may, ultimately, decide against returning to their home state. However, with the University of New England producing 104 annual completers of the Osteopathic Medicine program, it is important to consider that about half of all DOs practice general medicine.17 These facts indicate that ensuring an adequate supply of Family and General Practitioners may be far easier than that of other specialties with far lower percentages of DOs.
Analysis
Physicians & Surgeons: 2002-2012 Estimated Annual Employment Needs
Specialty Needs Anesthesiologists 5 Family & General Practitioners 30 Internists, General 10 Obstetricians & Gynecologists 5 Pediatricians 5 Psychiatrists 7 Surgeons 17 Physicians & Surgeons, All Other 35 Total 114
2003-2004 UNE Osteopathy Completers 104
The total estimated annual employment needs for all Physicians and Surgeons is expected to be 114; although this figure only slightly exceeds the graduate capacity of Maine’s only medical program, limited residency opportunities will have a dramatic effect on the supply of these healthcare professionals.
After the completion of medical school, three to eight years of internship and residency, depending on the specialty, are required. Residency opportunities have a dramatic impact on the supply of physicians and surgeons in Maine.
Currently, there are five Family Practice Residency Programs in Maine: Maine Medical Center (Portland), Central Maine Medical Center (Lewiston), Maine-Dartmouth Residency (Augusta), Eastern Maine Medical Center (Bangor), and the University of New England (Biddeford). Each of these residency programs has between five and ten family practice residents per year, and several of these positions are reserved for University of New England students. In addition to these Family Practice Residency Programs, Maine Medical Center also offers Internal Medicine,

3 P H Y S I C I A N S , S U R G E O N S , A N D R E L A T E D
31
Anesthesia, General Surgery, and Pediatrics residency programs, as well as a number of subspecialty fellowship programs.18
It must be noted that several of the aforementioned hospitals have relationships with out-of-state medical schools and provide residency opportunities for those students. Specifically, Maine Medical Center is a teaching site for the University Of Vermont School Of Medicine. The Family Practice Residency in Augusta is a rural training site for Dartmouth Medical Students. Also, Eastern Maine Medical Center has a relationship with Tufts Medical School.18
Importantly, the residency programs report that 50% or more of their graduates remain in-state after residency18; this retention is paramount in ensuring an adequate supply of these healthcare professionals. Survey data indicates that 26.4% of all Physicians and Surgeons in Maine completed residences in Maine. Residency program data for Physicians and Surgeons is provided in the following table.
Physicians & Surgeons: State of Residency Program State Number Percentage
Maine 481 26.4% Massachusetts 212 11.6% New York 207 11.4% Pennsylvania 116 6.4% Michigan 73 4.0% California 70 3.8%
A significant portion of Physicians and Surgeons in Maine completed their residency in Maine. The relationship between state of residency program completed and state where practicing is unclear, but as the inaugural report in what is to be an annual series, this report is more indicative of the breadth of work possible rather than the depth. Over time, longitudinal analysis and refinement of the survey may indicate trends and uncover data useful in determining and maintaining the supply of healthcare professionals.
The supply of Physicians and Surgeons in Maine is clearly impacted by educational opportunities, residency opportunities, and the recruitment of physicians from outside the state. Facts and the general relationships among these factors are presented in the following figure.

3 P H Y S I C I A N S , S U R G E O N S , A N D R E L A T E D
32
Residency opportunities are especially vital to the supply of Physicians and Surgeons in Maine, as these programs report that 50% or more of their graduates remain in-state after residency; survey data indicates that of all responding licensed physicians and surgeons, 26.4% completed their residency in Maine.
Where in-state educational opportunities and, later, residency opportunities fail to provide the necessary supply of Physicians and Surgeons, recruitment of these professionals by hospitals and healthcare providers must succeed. One major step in the recruitment of Physicians and Surgeons to Maine occurred with the formation of the Maine Recruitment Center in 1999.
Representing the needs of the vast majority of hospitals and practices across the state, the Maine Recruitment Center (MRC) is staffed by specialists who are salaried employees of the Maine Hospital Association. This collaborative effort between hospitals and the Maine Hospital Association operates as an easy, one-step resource for job seekers interested in healthcare employment opportunities in Maine.19 One particular service provided by the MRC is the maintenance of a database of candidates interested in specific situations within Maine. A physician registers to indicate interest in a particular setting or region of the state, and the MRC alerts the registrant when an opening meeting the those criteria arises.19
While the formation of the MRC has been an important recruiting tool, a general shift in desired professional setting among physicians and salary levels has made it increasingly difficult to attract Physicians to Maine—particularly in rural areas. Physicians are less interested in private practices because of the business, legal, regulatory, and human resource demands inherent in running a private practice. Also, “rural physician, on average, work more and earn less than their urban counterparts.”17 In ensuring an adequate supply of Physicians and Surgeons in Maine, two

3 P H Y S I C I A N S , S U R G E O N S , A N D R E L A T E D
33
issues are glaringly important—the number of residency opportunities available and the placement of Physicians and Surgeons in medically underserved, rural areas.
Given the high cost of physician recruitment, as well as the social costs associated with patients forced to wait for treatment, an increase in the number of residency opportunities could facilitate the recruitment and placement of physicians in Maine.
Ensuring an adequate supply of Physicians and Surgeons extends far beyond the mere number of these professionals and into the geographic distribution of Physicians and Surgeons across Maine—particularly in medically underserved, rural areas.
Rural primary care has become of lesser interest to those physicians and surgeons just entering the workforce. At this point in their careers, these professionals are saddled with the incredible costs of medical school, which, often, are in excess of $200,000. This tremendous financial burden encourages students to consider more lucrative careers in specialty medicine.
To improve the distribution, supply, and quality of healthcare professionals in medically underserved areas, private, state, and federal loan repayment initiatives must be undertaken. Four such loan repayment programs already exist: The National Health Service Corps (NHSC) Loan Repayment Program, the State Loan Repayment Program (SLRP), the Finance Authority of Maine (FAME), and Maine hospitals. All are repayment options for those who want to practice primary care in Maine, and all are contingent upon geography; the NHSC loan repayment program, SLRP, and FAME all offer repayment options for those working in medically underserved areas (as designated by the federal government). Loan repayments by select Maine hospitals are used as market equalizers in attracting physicians and surgeons. Not coincidentally, those in underserved areas offer repayment options, while those in southern Maine, which possesses adequate staffing levels, do not.
The extent that these programs are necessary and their impact on the supply of Physicians and Surgeons are evident when one considers the Federally Designated Primary Care Health Professional Shortage Areas, which are depicted in the map at left. A full size map can be found at www.maine.gov/dhhs/bohodr/links.htm.
A Health Professional Shortage Area (HPSA) is defined as population groups and facilities with a shortage of health professionals according to rural and geographic areas. This designation allows both public and non-profit organizations to apply for National Health Service Corps personnel as well as other federally funded programs.

3 P H Y S I C I A N S , S U R G E O N S , A N D R E L A T E D
34
Ensuring an adequate supply of Physicians and Surgeons in Maine will likely require increased educational and training opportunities, as well as the continued efforts of the Maine Recruitment Center. In turn, this supply, through the successful application of loan repayment programs, will need to be distributed accordingly so that an adequate supply of physicians and surgeons is met at both state and sub-state levels.
Complicating these efforts to ensure an adequate supply of Physicians and Surgeons in Maine is the fact that this labor market is comprised of smaller, specialty-defined labor markets; thus, occupational data at the specialty level is necessary to address labor market concerns. The need for information at the specialty level is addressed in the following section.

3 P H Y S I C I A N S , S U R G E O N S , A N D R E L A T E D
35
Physicians and Surgeons: Specialty Labor Markets Physicians work in one or more of several specialties, including, but not limited to, anesthesiology, family and general medicine, general internal medicine, general pediatrics, obstetrics and gynecology, psychiatry, and surgery. It is important to note that each of these specialties operates as a unique labor market, and, as such, numerous differences exist; many of these differences are captured in the following content.
Occupational Descriptions Anesthesiologists focus on the care of surgical patients and pain relief. These critical specialists are responsible for the maintenance of the patient’s vital life functions—heart rate, body temperature, blood pressure, and breathing—through continued monitoring and assessment during surgery.
Family and General Practitioners are often the first point of contact for people seeking healthcare and act as the traditional family doctor. They assess and treat a wide range of conditions, ailments, and injuries, from sinus and respiratory infections to broken bones and scrapes. Patients with more serious conditions are referred to specialists or other healthcare facilities for more intensive care.
General Internists diagnose and provide care mainly for adults who have a wide range of problems associated with the internal organs, such as the stomach, kidneys, liver, and digestive tract. Like General Practitioners, General Internists are commonly looked upon as primary care specialists, referring patients to other specialists when more complex care is needed.
Obstetricians and Gynecologists (Ob/Gyns) are specialists whose focus is on women’s health. They are responsible for general medical care for women, but also provide care related to pregnancy, the reproductive system, and childbirth.
Pediatricians provide care from birth to adulthood. These professionals specialize in the diagnosis and treatment of a variety of ailments specific to young people and track their patients’ growth to adulthood.
Psychiatrists are the primary caregivers in the area of mental health. They assess and treat mental illnesses through a combination of psychotherapy, psychoanalysis, hospitalization, and medication.
Surgeons are physicians who specialize in the treatment of injury, disease, and deformity through operations. Using a variety of instruments, and with patients under general or local anesthesia, a surgeon corrects physical deformities, repairs bone and tissue after injuries, or performs preventive surgeries on patients with debilitating diseases or disorders.

3 P H Y S I C I A N S , S U R G E O N S , A N D R E L A T E D
36
Specialty Characteristic DataObtained from the 2004 Physicians and Surgeons data file, the information provided in the table at right is presented at the specialty level and is designed to address the needs of health planners, educators, researchers, and policy makers. Highlights of this data are presented below.
• Roughly one out of every three Surgeons is over the age of 60
• Psychiatrists tend to be over 60 (28.2%)
• General Practitioners have the smallest percentage of those over 60 (15.2%)
• Gender distribution varies a great deal between specialties
• Almost 90% of Surgeons are male, whereas only 51.6% of Pediatricians are male
• Pediatricians and Ob-Gyns have the largest percentages of inactive licensees
• The percentage and number of inactive licensees for Internists are significant
Physicians & Surgeons: Characteristic Data
Age Mean Over 60 Anesthesiologists 50.6 18.7% General Practitioners 49.4 15.2% Internists 49.6 18.8% Ob-Gyn 51.1 22.0% Pediatricians 49.3 22.4% Psychiatrists 53 28.2%
Spec
ialt
y Surgeons 53.5 35.2%
Gender Male Female Anesthesiologists 78.9% 21.1% General Practitioners 62.0% 38.0% Internists 68.5% 31.5% Ob-Gyn 56.1% 43.9% Pediatricians 51.6% 48.4% Psychiatrists 68.1% 31.9%
Spec
ialt
y
Surgeons 89.9% 10.1%
Activity Status Number Inactive Percent
Anesthesiologists 3 3.3% General Practitioners 20 4.8% Internists 20 7.8% Ob-Gyn 8 9.8% Pediatricians 13 10.4% Psychiatrists 7 4.1%
Spec
ialt
y
Surgeons 11 6.1%

3 P H Y S I C I A N S , S U R G E O N S , A N D R E L A T E D
37
Percentage Distribution of MDs and DOs
Total MD DO Anesthesiologists 91 91.2% 8.8% General Practitioners 414 54.6% 45.4% Internists 255 85.1% 14.9% Ob-Gyn 82 85.4% 14.6% Pediatricians 125 92.0% 8.0% Psychiatrists 170 86.5% 13.5% Surgeons 179 93.9% 6.1% All Physicians & Surgeons 1,966 79.0% 21.0%
The distribution of MDs and DOs differs greatly among specialties. Considering that Maine’s only medical program produces on DOs, it is clear that ensuring an adequate supply of General Practitioners (45.4% of whom are DOs) will be much easier than that of Surgeons, Pediatricians, and Anesthesiologists (of whom only 6.1%, 8.0%, and 8.8%, respectively, are DOs).
Identifying where Physicians and Surgeons live and work can add insight to the identification of areas that may be underserved or experiencing difficulties in recruiting specialists. Residence and employment information, as reported through the survey of Physicians and Surgeons, indicates the following key points. • 97.8% of responding
Anesthesiologists reported working in Maine; 100% reported living in Maine
• 9.3% of Anesthesiologists reported
living in York county, but only 4.3% reported working in York county
• 97.8% of responding Family and
General Practitioners reported working in Maine; 99.2% reported living in Maine.
• 100% of Internists reported working
in Maine; 99.2% reported living in Maine.
• 98.6% of responding Ob-Gyns
reported working in Maine; 100% reported living in Maine
• 0 Ob-Gyns reported living or working
in Piscataquis county
• 100% of responding Pediatricians live and work in Maine
• 100% of responding Psychiatrists live
and work in Maine • 98.2% of responding Surgeons
reported working in Maine; 100% reported living in Maine
• For Family and General Practitioners,
in terms of both residence and employment, all 16 counties were represented.
• Cumberland and Penobscot counties,
generally, were the largest counties in terms of both employment and residence.
Complete county employment and residence data by specialty is provided in the Appendix.

3 P H Y S I C I A N S , S U R G E O N S , A N D R E L A T E D
38
Statewide Employment The annual growth rate for all specialties is roughly 2.0 percent. This number exceeds the 1.0 percent growth rate for all occupations in Maine. Estimated state employment for 2002, projected employment for 2012, net employment change, and annual average percent change for each specialty are provided in the following table.
Physicians & Surgeons: Estimated and Projected State Employment By Specialty
2002 Estimated
Employment
2012 Projected
Employment
Net Employment
Change
Annual Average Percent Change
Anesthesiologists 124 152 28 2.1% General Practitioners 825 1,012 187 2.1% Internists 291 355 64 2.0% Ob-Gyn 134 165 31 2.1% Pediatricians 142 175 33 2.1% Psychiatrists 198 242 44 2.0% Surgeons 450 556 106 2.1%
Growth and Replacement Needs Job openings arise from both employment growth and replacement needs.
Physicians & Surgeons: Growth and Replacement Needs By Specialty
Total Annual Average Openings
Annual Openings Due To Growth
Annual Openings Due
To Replacement
Anesthesiologists 5 3 2 General Practitioners 30 19 11 Internists 10 6 4 Ob-Gyn 5 3 2 Pediatricians 5 3 2 Psychiatrists 7 4 3 Surgeons 17 11 6
Replacement needs arise as workers leave occupations to retire, return to school, assume household responsibilities or transfer to other occupations.
Openings due to growth reflect the growth of the occupation, as well as the industry.

3 P H Y S I C I A N S , S U R G E O N S , A N D R E L A T E D
39
Wages Physicians and Surgeons have among the highest earnings of any occupation. Maine and national wage data at the specialty level is provided in the following table.
Physicians & Surgeons: Maine and National Wages By Specialty
Average Wage Maine
Hourly National Hourly
Maine Annual
National Annual
Percent of
National Anesthesiologists $92.16 $83.95 $191,693 $174,610 109.8% General Practitioners $60.27 $66.33 $125,362 $137,980 90.9% Internists $70.29 $75.38 $146,203 $156,790 93.2% Ob-Gyn $88.89 $83.89 $184,891 $174,490 106.0% Pediatricians $66.04 $67.31 $137,363 $140,000 98.1% Psychiatrists $76.64 $72.78 $159,411 $151,380 105.3%
Spec
ialt
y
Surgeons $94.69 $87.43 $196,955 $181,850 108.3%
State wages for General Practitioners, Internists, and Pediatricians all are below that of national averages.


3 P H Y S I C I A N S , S U R G E O N S , A N D R E L A T E D
41
Physician Assistants Physician Assistants are formally trained to provide diagnostic, therapeutic, and preventive healthcare services, as delegated by a Physician.
Occupational Description Physician Assistants work under the supervision of a physician; however, they may be the principal care providers in rural or inner city clinics, where a physician is present for only one or two days each week. These individuals may take medical histories, examine and treat patients, order and interpret laboratory tests and x-rays, make diagnoses, and prescribe medications.
Characteristic Data The licensure of Physician Assistants in Maine is carried out by two separate, autonomous boards of licensure, the Board of Licensure in Medicine for those supervised by allopaths and the Board of Osteopathic Licensure for those supervised by osteopaths. The Maine CDC has developed a survey to accompany the relicensure process, and survey efforts have been undertaken, and, assuming acceptable response rates, data will be available in the following edition of this report.
Educational Requirements
All states require that new Physician Assistants complete an accredited, formal education program. As of July 2001, there were 129 accredited or provisionally accredited educational programs in the U.S. for physician assistants; 64 of these programs offered a master's degree. The rest offered either a bachelor's degree or an associate degree. Most PA graduates have at least a bachelor's degree. PA programs usually last at least 2 years. Admission requirements vary, but many programs require 2 years of college and some work experience in the healthcare field.
Schools Only the University of New England offers a Physician Assistant program in Maine. For the 2003 -2004 academic year, this program had 43 graduates.
Provider Title Credential Attained
Completers
UNE Physician Assistant
Master’s Degree 43

3 P H Y S I C I A N S , S U R G E O N S , A N D R E L A T E D
42
Statewide Employment There were 624 Physician Assistants employed in Maine in 2002, and this occupation is expected to experience more rapid growth (4.5% annually) that that of the all occupations average (1.0%). The following table lists relevant employment and projection data.
2002 Estimated Employment
2012 Projected Employment
Total 2002 – 2012 Employment Change
Annual Average Percent Change
624 967 343 4.5 The above 10-year employment change reflects the growth that this occupation is expected to experience, but replacement needs must also be considered. An additional 10 annual openings for Physician Assistants are projected and attributed to replacement needs. The following table illustrates annual growth and replacement needs for Physician Assistants.
Total Annual
Average Openings
Annual Average Openings Due to
Growth
Annual Average Openings Due to
Replacement Physician Assistants (Total) 44 34 18
Physician Assistants (%) 100% 77.4% 22.6% All Occupations (%) 100% 33.7% 66.3%
Most Physician Assistants are employed in ambulatory healthcare services (with 59.5% of all Physician Assistants), and hospitals (36.1%).
Maine Job Vacancies For Physician Assistants, there were an estimated 19 job vacancies in 2005, which, when compared to total employment for the occupation, yielded a job vacancy rate of 2.8%. Data for 2002 for this occupation is unavailable.
Wages The average wage for Physician Assistants in Maine is more than $3.00 an hour greater than the national average. Annual and hourly wage data for entry-level and experienced Physician Assistants, as well average state and national wages, are shown in the following table.
Maine Maine National Entry Experienced Mean Mean
% of National
Hourly $28.40 $40.01 $36.14 $32.93 Annual $59,070 $83,230 $75,171 $68,494
109.7%

3 P H Y S I C I A N S , S U R G E O N S , A N D R E L A T E D
43
National Employment In 2002, there were an estimated 63,000 Physician Assistants employed in the United States. In 2012, it is projected that there will be 94,000; this represents an annual average growth rate of 4.1 percent, significantly faster than the 1.4 percent growth rate for all occupations in the United States, as shown in the following table.
2002 Estimated Employment
2012 Projected Employment
Total 2002 – 2012 Employment Change
Annual Average Percent Change
63,000 94,000 31,000 4.1
Outlook Employment of Physician Assistants is expected to grow much faster than the average for all occupations through the year 2012, due to anticipated expansion of the health services industry and an emphasis on cost containment, resulting in increasing utilization of Physician Assistants by physicians and healthcare institutions. Physicians and institutions are expected to employ more Physician Assistants to provide primary care and to assist with medical and surgical procedures because Physician Assistants are cost-effective and productive members of the healthcare team. Physician assistants can relieve physicians of routine duties and procedures. Telemedicine—using technology to facilitate interactive consultations between physicians and physician assistants—also will expand the use of physician assistants. Job opportunities for Physician Assistants should be good, particularly in rural and inner city clinics, because those settings have difficulty attracting physicians. Besides the traditional office-based setting, Physician Assistants should find a growing number of jobs in institutional settings such as hospitals, academic medical centers, public clinics, and prisons. Additional Physician Assistants may be needed to augment medical staffing in inpatient teaching hospital settings as the number of hours physician residents are permitted to work is reduced, encouraging hospitals to use Physician Assistants to supply some physician resident services. Opportunities will be best in states that allow Physician Assistants a wider scope of practice.

3 P H Y S I C I A N S , S U R G E O N S , A N D R E L A T E D
45
Surgical Technologists Surgical Technologists, also called scrubs and surgical or operating room technicians, are members of operating room teams and perform many functions within the operating room before, during, and after surgery.
Occupational Description Surgical Technologists assist in operations, under the supervision of surgeons, registered nurses, or other surgical personnel. May help set up operating room, prepare and transport patients for surgery, adjust lights and equipment, pass instruments and other supplies to surgeons and surgeon's assistants, hold retractors, cut sutures, and help count sponges, needles, supplies, and instruments.
Educational Requirements
Surgical technologists receive their training in formal programs offered by community and junior colleges, vocational schools, universities, hospitals, and the military. High school graduation normally is required for admission. Programs last 9 to 24 months and lead to a certificate, diploma, or associate degree.
Schools A cooperative effort between Southern Maine Community College (SMCC) and the Maine Medical Center (MMC) in Portland is the state’s only program for surgical technology. This “One-Plus-One” program leads to an associate in applied science degree. The first year of the program, a one year surgical technology program, is provided by MMC and prepares highly qualified and motivated students as members of a modern surgical team. Upon completion of the MMC surgical technology program, students can apply to SMCC’s associate degree program for a second year of study. The associate degree enhances career opportunities through vertical mobility, practitioner levels refinement, and maximized employment prospects. Upon acceptance to the associate degree program, the candidate is awarded 44 credits advanced standing that serve as the technical core of the associate degree. SMCC then requires a minimum of 18 general education and allied health credits to meet the associate in applied science degree requirements.
Provider City Southern Maine Community College/Maine Medical Center South Portland

3 P H Y S I C I A N S , S U R G E O N S , A N D R E L A T E D
46
The number of completers of this program during the 2003-2004 academic year is illustrated in the table below.
Surgical Technology Program Completers: 2003-2004 Institution Award Level Completers
SMCC Associate’s Degree 2
Statewide Employment There were 347 Surgical Technologists employed in Maine in 2002, and this occupation is expected to experience more rapid growth (2.7% annually) than the all occupations average (1.0%). The following table lists relevant employment and projection data.
2002 Estimated Employment
2012 Projected Employment
Total 2002 – 2012 Employment Change
Annual Average Percent Change
347 454 107 2.7 The above 10-year employment change reflects the growth that this occupation is expected to experience, but replacement needs must also be considered. An additional 5 annual openings for Surgical Technologists are projected and attributed to replacement needs. The following table illustrates annual growth and replacement needs for Surgical Technologists and the percentage of openings attributed to growth and replacement for both Surgical Technologists and all occupations.
Total Annual
Average Openings
Annual Average Openings Due to
Growth
Annual Average Openings Due to
Replacement Surgical Technologist
16 11 (68.8%) 5 (31.2%)
All Occupations (%)
100% 33.7% 66.3%
The top two industries that employ Surgical Technologists in Maine are hospitals (with 91.6% of all Surgical Technologists), and ambulatory health care services (8.4%).
Maine Job Vacancies For Surgical Technologists, the number of job vacancies in 2005 was dramatically lower than the number of job vacancies in 2002. Also, the job vacancy rate for this occupation plummeted to 3.4%. The findings are summarized in following table.
2002 Vacancies
2002 Job Vacancy
Rate
2005 Vacancies
2005 Job Vacancy
Rate
Change in Vacancies
Change in Job Vacancy
Rate 64 27.8% 12 3.4% -52 -24.4%

3 P H Y S I C I A N S , S U R G E O N S , A N D R E L A T E D
47
Wages Annual and hourly wage data for entry-level and experienced Surgical Technologists, as well average state and national wages, are shown in the following table. Maine wages are slightly below the national average.
Maine Maine National Entry Experienced Mean Mean
% of National
Hourly $13.89 $18.06 $16.67 $17.10 Annual $28,890 $37,560 $34,674 $35,560
97.5%
National Employment In 2002, there were an estimated 72,000 Surgical Technologists employed in the United States. In 2012, it is projected that there will be 92,000; this represents an annual average growth rate of 2.5 percent, faster than the 1.4 percent growth rate for all occupations in the United States. The following table illustrates the net change, growth rate and expected employment for Surgical Technologists in 2012.
2002 Estimated Employment
2012 Projected Employment
Total 2002 – 2012 Employment Change
Annual Average Percent Change
72,000 92,000 20,000 2.5
Outlook Job opportunities are expected to be favorable, and employment of surgical technologists is expected to grow faster than the average for all occupations through the year 2012 as the volume of surgery increases. The number of surgical procedures is expected to rise as the population grows and ages. As members of the baby boom generation approach retirement age, the over-50 population, who generally require more surgical procedures, will account for a larger portion of the general population. Technological advances, such as fiber optics and laser technology, will also permit new surgical procedures to be performed. Hospitals will continue to be the primary employer of surgical technologists, although much faster employment growth is expected in offices of physicians and in outpatient care centers, including ambulatory surgical centers.


49
Dentistry and Related A general shift is occurring within dentistry as Dental Hygienists and Assistants—rather than Dentists—are increasingly providing routine services. This shift is so dramatic that all annual openings for Dentists are attributed to replacement needs—not growth. As a result, employment opportunities for Dental Hygienists and Dental Assistants should increase. However, even with this shifting of duties, oral health needs in Maine continue to be underserved.
Dentists 51 Dental Hygienists 61 Dental Assistants 65
Chapter
4


4 D E N T I S T R Y A N D R E L A T E D
51
Dentists Most dentists are general practitioners, handling a variety of dental needs. Other dentists practice in any of nine specialty areas. Orthodontists, the largest group of specialists, straighten teeth by applying pressure to the teeth with braces or retainers. The next largest group, oral and maxillofacial surgeons, operates on the mouth and jaws. The remainder may specialize as pediatric dentists (focusing on dentistry for children); periodontists (treating gums and bone supporting the teeth); prosthodontists (replacing missing teeth with permanent fixtures, such as crowns and bridges, or removable fixtures, such as dentures); endodontists (performing root canal therapy); public-health dentists (promoting good dental health and preventing dental diseases within the community); oral pathologists (studying oral diseases); or oral and maxillofacial radiologists (diagnosing diseases in the head and neck through the use of imaging technologies).
Also, dentists in private practice oversee a variety of administrative tasks, including bookkeeping and buying equipment and supplies. They may employ and supervise dental hygienists, dental assistants, dental laboratory technicians, and receptionists.
Occupational Description Dentists diagnose, prevent, and treat problems with teeth or mouth tissue. They remove decay, fill cavities, examine x rays, place protective plastic sealants on children’s teeth, straighten teeth, and repair fractured teeth. They also perform corrective surgery on gums and supporting bones to treat gum diseases. Dentists extract teeth and make models and measurements for dentures to replace missing teeth. They provide instruction on diet, brushing, flossing, the use of fluorides, and other aspects of dental care. They also administer anesthetics and write prescriptions for antibiotics and other medications.
Characteristics Data The licensure of Dentists in Maine is carried out by the Maine State Board of Dental Examiners and is updated every two years. This board and the Maine CDC cooperatively designed a survey which would be enclosed with the relicensure application, mailed, filled out voluntarily by licensees, and returned to the board. The data from these responses was then entered and maintained in a data file by the Maine CDC. This data file contained 624 responses for the 2002 renewal, which represents a response rate of 98.9%. This report includes detailed characteristics data for Dentists, and, when possible, specialties.
Additional data is provided from the Occupational Employment Statistics (OES) survey, which produces occupational employment and wage estimates on a semi-annual basis.

4 D E N T I S T R Y A N D R E L A T E D
52
Characteristics Specialty distributions from the relicensure survey are provided in the following table
Survey Results: Dentists Distribution by Specialty Licensing Board
Specialty Total
Responses PercentageDentists, General 457 83.2% Oral & Maxillofacial Surgeons 30 5.5% Orthodontists 40 7.3% Prosthodontists 12 2.2% Dentists, all other 10 1.8% Total 549 100%
549 Dentists indicated the hours that he or she spent performing specific duties in the course of providing direct patient care. These hours were used to place respondents in appropriate specialties. There were 75 non-responders.
In determining and ensuring an adequate supply of Dentists, age is a very important component as retirement will be a major source of attrition for Dentists. A significant percentage of Dentists are at or nearing typical retirement age in Maine, and the replacement of these individuals in the coming years will be a challenge. Of particular concern are Prosthodontists; of these specialists, half are over the age of 60. In every specialty, the vast majority of Dentists in Maine are male. Also, the number of inactive (or non-practicing) licensed healthcare professionals also impacts supply as these individuals may renew their licenses, yet not work in activities related to this profession. Although these individuals maintain licenses, many have no intention of reentering the labor market.
Dentists: Characteristic Data Age Mean Over 60 Dentists, General 54.4 28.7% Oral & Maxillofacial 51.6 23.3% Orthodontists 56.7 37.5% Prosthodontists 58.5 50.0% Dentists, all other 52.3 30.0% Gender Male Female Dentists, General 90.9% 9.1% Oral & Maxillofacial 89.3% 10.7% Orthodontists 94.9% 5.1% Prosthodontists 100% 0% Dentists, all other 71.4% 28.6%
Activity Status Number Inactive Percentage
All Dentists 19 3.0%

4 D E N T I S T R Y A N D R E L A T E D
53
It is important to understand how many licensed, inactive Dentists exist and their reasons for not practicing as these individuals may possibly help fill workforce needs. Those reasons cited for inactivity, as well as age data for those reporting inactivity, are provided in the following table.
Dentists: Reasons Why Inactive Reason Number Percentage Mean Age Age Range
Working in another field and seeking work as a dentist
1 5.3% 55 NA
Working in another field and not seeking work as a dentist
5 26.3% 61 55 - 75
Unemployed and seeking work as a dentist
0 0% NA NA
Retired/not intending to return to work
8 42.1% 75.6 66 - 85
Not working due to household responsibilities
1 5.3% 52.0 NA
In training 1 5.3% 33 NA
Other 0 0% NA NA
No response 3 15.8 75.3 71 - 84 Of the 19 inactive Dentists, only one is actively seeking work as a Dentist. Thus, the impact of inactive licensees on the labor market may be minimal.
Dentists: Residing in Maine, Working Out-of-State Location Number
Maryland 1 New Hampshire 1 Washington, DC 1
Another aspect of supply is the number of healthcare professionals licensed and living in Maine, but practicing elsewhere. For Dentists, this is a small component of supply as only three Dentists responded that they live in Maine, but work out-of-state. .

4 D E N T I S T R Y A N D R E L A T E D
54
Identifying where Dentists live and work can add insight to the identification of areas that may be underserved or experiencing difficulties in recruiting specialists. Residence and employment information, as reported through the survey of Dentists, is provided in the following table.
Dentists: Employment and Residence by County and Specialty
Dentists, General
Oral & Maxillofacial
Surgeons Orthodontists Prosthodontists Dentists, all
other
Work Live Work Live Work Live Work Live Work Live
Androscoggin 7.0% 5.9% 20.0% 20.0% 7.5% 2.5% 0.0% 0.0% 10.0% 10.0%Aroostook 3.7% 3.9% 6.7% 6.7% 10.0% 10.0% 0.0% 0.0% 0.0% 0.0% Cumberland 33.3% 35.7% 30.0% 33.3% 32.5% 32.5% 58.3% 50.0% 70.0% 70.0%Franklin 1.8% 2.6% 0.0% 0.0% 0.0% 0.0% 0.0% 0.0% 0.0% 0.0% Hancock 4.6% 4.4% 0.0% 0.0% 2.5% 2.5% 0.0% 0.0% 0.0% 0.0% Kennebec 10.7% 9.4% 10.0% 10.0% 15.0% 17.5% 8.3% 8.3% 0.0% 0.0% Knox 2.9% 3.1% 6.7% 3.3% 2.5% 5.0% 0.0% 0.0% 10.0% 10.0%Lincoln 2.9% 2.4% 0.0% 3.3% 2.5% 2.5% 0.0% 0.0% 0.0% 0.0% Oxford 2.6% 2.6% 0.0% 0.0% 0.0% 0.0% 0.0% 0.0% 0.0% 0.0% Penobscot 10.7% 10.3% 13.3% 13.3% 12.5% 12.5% 16.6% 16.7% 0.0% 0.0% Piscataquis 0.9% 1.1% 0.0% 0.0% 0.0% 0.0% 0.0% 0.0% 0.0% 0.0% Sagadahoc 2.2% 1.8% 6.7% 3.3% 2.5% 0.0% 0.0% 0.0% 0.0% 0.0% Somerset 2.4% 2.0% 0.0% 0.0% 2.5% 2.5% 8.3% 8.3% 0.0% 0.0% Waldo 1.3% 1.8% 0.0% 0.0% 0.0% 0.0% 0.0% 0.0% 0.0% 0.0% Washington 2.0% 2.0% 0.0% 0.0% 0.0% 0.0% 0.0% 0.0% 0.0% 0.0%
York 11.0% 11.2% 6.7% 6.7% 10.0% 12.5% 8.3% 16.7% 10.0% 10.0%
Responses 456 457 30 30 40 40 12 12 10 10
Educational Requirements
All 50 states and the District of Columbia require dentists to be licensed. Most State licenses permit dentists to engage in both general and specialized practice. Dentists who want to teach or do research usually spend an additional two to five years in advanced dental training, in programs operated by dental schools or hospitals. Dental schools require a minimum of two years of college-level pre-dental education. However, most dental students have at least a bachelor's degree.
Schools There are no dental schools in Maine, but the New England Board of Higher Education’s Regional Student Program allows Maine residents access to degree programs in academic areas

4 D E N T I S T R Y A N D R E L A T E D
55
not available in Maine. Through this program, Maine students typically pay 150% of the admitting state’s resident tuition. The University of Connecticut is the only public dental school in New England and takes part in this program.
Provider City University of Connecticut Farmington, CT Tufts University Boston, MA
Statewide Employment Most dentists are solo practitioners, meaning that they own their own businesses and work alone or with a small staff. Some dentists have partners, and a few work for other dentists as associate dentists. According to the American Dental Association (ADA), about 80 percent of dentists in private practice are sole proprietors, and 13 percent belong to a partnership. A small number of salaried dentists work in hospitals and offices of physicians. The 2002 estimated employment and 2012 projected employment for this occupation are provided in the following table.
2002 Estimated Employment
2012 Projected Employment
Total 2002 – 2012 Employment Change
Annual Average Percent Change
607 599 -8 -1.3
Employment of dentists is not expected to grow as rapidly as the demand for dental services, because, as their practices expand, dentists are likely to hire more dental hygienists and dental assistants to handle routine services. As a result, most jobs will result from the need to replace the large number of dentists projected to retire. Projected annual openings due to growth and replacement are provided in the table below.
Total Annual Average Openings
Annual Average
Openings Due to Growth
Annual Average
Openings Due to Replacement
Dentists 10 0 10

4 D E N T I S T R Y A N D R E L A T E D
56
Wages Earnings among Dentists vary according to number of years in practice, location, hours worked, and specialty. Average national and state wages for dentists (excluding those self-employed), by specialty, are provided in the following table.
Dentists: State and National Wages By Specialty
Average Wage
State Hourly
National Hourly
State Annual
National Annual
Percent of National
Dentists, General $62.20 $63.78 $129,376 $132,660 97.5% Oral & Maxillofacial Surgeons $81.25 $81.54 $169,000 $169,600 99.6% Orthodontists NA $73.67 NA $153,240 NA Prosthodontists NA $75.34 NA $156,710 NA Sp
ecia
lty
Dentists, all other NA $50.98 NA $106,040 NA
National Employment In 2002, there were 153,000 Dentists (data for each specific type of dentist is unavailable) employed in the United States. In 2012, it is projected that there will be 159,000; this represents an annual average growth rate of 0.4 percent, much slower than the 1.4 percent growth rate for all occupations in the United States. The following table illustrates the net change, growth rate and expected employment for this occupation in 2012.
2002 Estimated Employment
2012 Projected Employment
Total 2002 – 2012 Employment Change
Annual Average Percent Change
153,000 159,000 6,000 0.4
Demand Demand for dental care should grow substantially through 2012. As members of the baby-boom generation advance into middle age, a large number will need maintenance on complicated dental work, such as bridges. In addition, elderly people are more likely to retain their teeth than were their predecessors, so they will require much more care than in the past. The younger generation will continue to need preventive checkups despite treatments such as fluoridation of the water supply, which decreases the incidence of tooth decay. Dentists will increasingly provide care that is aimed at preventing the loss of teeth—rather than simply providing treatments, such as fillings. Although demand for dental care will increase, employment of dentists, interestingly, is not expected to grow as rapidly. This will be due largely to the fact that as their practices expand, dentists are likely to hire more dental hygienists and dental assistants—occupations

4 D E N T I S T R Y A N D R E L A T E D
57
both expected to grow rapidly—to handle routine services. As a result of the changing structure of dentistry (i.e. the shifting of routine services from dentists to dental hygienists and assistants), most employment opportunities will result from the need to replace the large number of dentists projected to retire. In fact, employment projections for Maine attribute all openings within this occupation to be the result of replacement needs rather than growth. The impact of retirees on the labor market is evident as 31.7% of all dentists are over the age of 60 and 68.6% are over the age of 50. With so many Maine dentists in the latter portion of their careers, ensuring an adequate supply of dentists will be very important.
Supply Even though increased emphasis on preventive care and the shifting of routine services will lessen the demand for new dentists, ensuring an adequate supply of these Dentists may still be difficult. One reason for this difficulty is the fact that, currently, Maine does not have a dental school or a dental residency program. This is important as these programs are typically the best sources for newly trained dentists who want to continue living and practicing in the state where they train. With no in-state source of training for aspiring dentists, these individuals are forced to pursue out-of-state opportunities—opportunities which may become increasingly difficult for Maine students to obtain as state dental schools reevaluate the mix of resident-to-nonresident students accepted into their programs. With an increase in the designation of Dental Health Professional Shortage Areas (DPHSA), “many states are forced to consider initiatives that would increase dental care access for their respective populations,” and one suggestion is that “state dental schools increase the percentage of first-year slots reserved for non-resident students”.20 Currently, “59 percent of the 4,315 first-year slots available in U.S. dental schools are reserved for in-state residents;”20 further increasing this percentage will only make it more difficult for Maine students to gain admission into dental school. Diminished opportunities for Maine students will adversely affect the future supply of dentists in Maine as “studies have shown that graduates are most likely to establish practices in their state of origin.”20 The combined effect of fewer out-of-state educational opportunities for Maine students and no in-state source of new dentists will require the successful recruitment of out-of-state dentists to Maine in order to ensure an adequate supply of these healthcare professionals. However, the recruitment of these individuals may be difficult given Maine’s rural makeup and low proportion of residents who have dental insurance coverage. Populations residing in rural communities typically find it “proportionally more difficult to access dental care” than their urban counterparts, and income is largely responsible for this disparity.20 In urban areas, many individuals have dental insurance or possess the ability to pay for dental services outright, in contrast to many in rural communities. Many new

4 D E N T I S T R Y A N D R E L A T E D
58
dentists, fresh out of school and preparing to open a private practice, face “a $200,000 student loan debt and another three quarters of a million dollars to set up a practice; clearly, in many parts of Maine, “the math doesn’t add up for new graduates from dental programs.”21 Overcoming these conditions in the recruitment of dentists will be important in ensuring an adequate supply of dentists in Maine. Compounding the difficulty associated with the recruitment of dentists to Maine is the establishment of dental practices in specific medically underserved, rural areas. Although, as of January 2005, nearly all of Maine was federally designated as a Dental Health Professional Shortage, a great deal of variety exists in the extent to which these areas are underserved. The table at right indicates the ratio of residents to dentists working in each county. From this data, it is apparent that the need for dentists is not—and will not be—similar in all parts of Maine. Establishing dental practices in areas where these services are needed most will be vital to improving oral health throughout the state.
Dentist to Population Ratio By Counties
County Ratio Androscoggin 1:2306 Aroostook 1:3081 Cumberland 1:1302 Franklin 1:3274 Hancock 1:2158 Kennebec 1:1859 Knox 1:1801 Lincoln 1:2241 Oxford 1:3422 Penobscot 1:2337 Piscataquis 1:3447 Sagadahoc 1:2709 Somerset 1:3635 Waldo 1:4535 Washington 1:3394 York 1:3061 Maine, total 1:2143

4 D E N T I S T R Y A N D R E L A T E D
59
Analysis Overall, the Maine labor market for dentists is characterized by incomplete information and many concerns—particularly on the supply side. One such concern is the impending retirements of many dentists. With nearly one-third of all Maine dentists over the age of 60 and roughly two-thirds of all dentists over the age of 50, retirement will be a significant force in this labor market. However, many dentists continue practice beyond typical retirement age and “a considerable number continue in part-time practice.”17 Future surveying of dentists’ intent to remain in practice would provide better information and an accurate picture of the impact of impending retirements on the labor market. Even without this information, it is apparent that jobs prospects will remain positive as many openings will arise out of replacement needs. Supply side concerns for this labor market are significant. Of primary concern is the state’s lack of a dental education and residency program, which is typically the best source for newly trained dentists. Without these programs, the state must rely on Maine dental students attending out-of-state schools and returning home to practice or the recruitment of dentists both trained and from out of state. Both of these options are somewhat disconcerting. Sending Maine students to dental schools may be harder in the future as many state dental schools are beginning to further limit the enrollment of out-of-state students in response to potential shortages in those states. Slots that once were available to out-of-state students may now be reserved for in-state students. The recruitment of new dentists without any ties to Maine may be increasingly difficult as dentists look to establish practices in urban—rather than rural—settings. The costs to attend dental school and the establishment of a private practice makes locating in very rural areas prohibitive, as the populations in these areas may be at or below poverty income levels and rely heavily on state Medicaid programs—which are characterized by low reimbursement rates and slow reimbursement turnarounds. As a result, those who may need dental care the most may find its availability limited in rural areas. With the designation of dental healthcare professional shortage areas, it is apparent that some efforts are being made to address these concerns. As the inaugural report in what is intended to be a series, a need for further study exists to fully understand and identify the forces impacting the dentistry labor market. Areas for further exploration and analysis include the intent of dentists to remain practicing, the number of hours worked by dentists weekly, the percentage of patients treated that are covered by Medicaid, the incentives and compensation required by dentists in order to accept more Medicaid patients, the schools that supply the most dentists to Maine, and the reasons why Maine students return to the state after completing dental school.

4 D E N T I S T R Y A N D R E L A T E D
60
Through further study, one may be able to determine which dental schools train Maine’s dentists, and discover the reasons that these individuals work here—information that would beneficial in a time when recruitment may be difficult. Additionally, one would be able to identify the capacity of current dentists to provide dental services. The labor market for dentists in this state is impacted by numerous factors. Identifying these factors and all associated potential outcomes will be paramount in ensuring an adequate supply of dentists in Maine.

4 D E N T I S T R Y A N D R E L A T E D
61
Dental Hygienists
Occupational Description Dental Hygienists clean teeth and examine oral areas, head, and neck for signs of oral disease. They may educate patients on oral hygiene, take and develop X-rays, and apply fluoride or sealants.
Characteristics The licensure of Dental Hygienists in Maine is carried out by the Maine State Board of Dental Examiners. This board and the Maine CDC collaboratively designed a survey to be enclosed with the relicensure application, filled out voluntarily by licensees, and returned to the Board. The data from these responses was then entered and maintained in a data file by the Maine CDC. This data file contained 1023 responses. The following detailed characteristics data for Dental Hygienists is designed to address the needs of health planners, educators, researchers, and policymakers, and is obtained from the aforementioned data file, which is updated every two years.
Age has a significant impact on any supply of workers, as retirement and an imbalanced distribution among age cohorts can result in large numbers of workers leaving the labor market at the same time. The average age of Dental Hygienists, as well as the distribution of these professionals among the given age cohorts, is shown in the table at right.
Age Range Dental Hygienists 20 to 31 12.4% 32 to 41 31.3% 42 to 51 34.7% 52 to 61 17.5%
62 and over 4.0%
Average Age 43.5
Other common characteristic data, such as gender and ethnicity, are unavailable for this occupation, but may be available in subsequent editions of this report.
Another determinant of supply is the number of licensed Dental Hygienists who are currently inactive. Assessing the number of these professionals, as well as the reasons for inactivity, identifies potential labor market entrants and areas within the profession in which changes may be made to improve the retentions of Dental Hygienists. Activity status and reasons for inactivity among Dental Hygienists are supplied in the table on the following page.

4 D E N T I S T R Y A N D R E L A T E D
62
• 845 Dental Hygienists indicated their activity status
• Of responding Dental Hygienists only 81 reported being inactive
• 78 Dental Hygienists provided the reason for their inactivity
• The largest percentage of inactive Dental Hygienists reported working in another field and not seeking work in Dental Hygiene
• Only 12 individuals reported seeking work in Dental Hygiene
Activity Status Active (n=764) 90.4% Inactive (n=81) 9.6%
Reasons for Inactivity
Working in another field and seeking work in Dental Hygiene 9.0%
Working in another field and not seeking work in Dental Hygiene 38.5% Unemployed--seeking work in Dental Hygiene 6.4% Retired 9.0% Not working due to household responsibilities 23.1% In training 0.0% Other 14.1%
Of active Dental Hygienists, 760 reported the state in which they work and an overwhelming number work in Maine (97.2%). New Hampshire (2.1%) was the only other state in which over 1% of active, Maine-licensed Dental Hygienists are employed. Identifying where Dental Hygienists live and work in Maine can add insight to the identification of areas that may be underserved or experiencing difficulties in recruiting these professionals. Residence and employment information, as reported through the survey of active Dental Hygienists, is provided in the table at right.
Dental Hygienists Work Live
Androscoggin 6.9% 7.60% Aroostook 3.5% 3.50% Cumberland 32.9% 30.10% Franklin 1.6% 1.60% Hancock 4.9% 3.80% Kennebec 10.2% 8.80% Knox 3.1% 2.50% Lincoln 2.6% 2.70% Oxford 2.4% 3.10% Penobscot 12.9% 13.40% Piscataquis 1.1% 1.30% Sagadahoc 2.7% 2.90% Somerset 2.0% 3.80% Waldo 2.0% 2.20% Washington 1.4% 1.20%
Cou
nty
York 9.8% 11.50% Responses 738 764

4 D E N T I S T R Y A N D R E L A T E D
63
Educational Requirements Dental Hygienists must be licensed by the State in which they practice. An associate degree is sufficient for practice in a private dental office. A bachelor's or master's degree usually is required for research, teaching, or clinical practice in public or school health programs.
Schools The following schools offer a Dental Hygienist program in Maine.
Provider City University of Maine at Augusta Augusta University of New England Biddeford
The following table represents the completers of a Dental Hygienist program in Maine during the 2003-2004 academic year.
Institution Credential Attained CompletersUMA Associate’s Degree 20 UNE Associate’s Degree 27 UNE Bachelor’s Degree 7
Statewide Employment There were 993 Dental Hygienists employed in Maine in 2002, and this occupation is expected to experience much more rapid growth (2.7% annually) than that of the all occupations average (1.0%). The following table lists relevant employment and projection data.
2002 Estimated Employment
2012 Projected Employment
Total 2002 – 2012 Employment Change
Annual Average Percent Change
993 1,267 +304 +2.7 In addition to growth, nine annual openings for Dental Hygienists are projected and attributed to replacement needs. The following table illustrates annual growth and replacement needs for Dental Hygienists and the percentage of openings attributed to growth and replacement for both Dental Hygienists and all occupations.
Total Annual
Average Openings
Annual Average Openings Due to
Growth
Annual Average Openings Due to
Replacement Dental Hygienists 39 (100%) 30 (76.9%) 9 (23.1%)
All Occupations (%) 100% 33.7% 66.3%

4 D E N T I S T R Y A N D R E L A T E D
64
Wages Dental Hygienists in Maine earn about the national average, although experienced hygienists are their counterparts nationwide.
Maine Maine National Entry Experienced Mean Mean
% of National
Hourly $22.61 $29.56 $27.24 $28.74 Annual $47,020 $61,490 $56,659 $59,790
94.8%
National Employment Dental Hygienists are expected to experience annual growth of 3.7 percent, much faster than the 1.4 percent growth rate for all occupations in the United States. The following table illustrates the net change, growth rate and expected employment for this occupation in 2012.
2002 Estimated Employment
2012 Projected Employment
Total 2002 – 2012 Employment Change
Annual Average Percent Change
148,000 212,000 +64,000 +3.7
Outlook Nationally, employment of dental hygienists is expected to grow rapidly in response to increasing demand for dental care and the greater utilization of hygienists to perform services previously performed by dentists. Job prospects are expected to remain excellent. In fact, dental hygienists are expected to be one of the fastest growing occupations through the year 2012. Population growth and greater retention of natural teeth will stimulate demand for dental hygienists. Older dentists, who have been less likely to employ dental hygienists, are leaving the occupation and will be replaced by recent graduates, who are more likely to employ one or even two hygienists. In addition, as dentists’ workloads increase, they are expected to hire more hygienists to perform preventive dental care, such as cleaning, so that they may devote their professional effort to functions requiring the highest skill level.

4 D E N T I S T R Y A N D R E L A T E D
65
Dental Assistants Dental Assistants perform a variety of patient care, office, laboratory duties. They work chair side as dentists examine and treat patients. They make patients as comfortable as possible in the dental chair, prepare them for treatment, and obtain their dental records.
Occupational Description Dental Assistants support dentists, set up patient and equipment, and keep records.
Educational Requirements Most assistants learn their skills on the job, although an increasing number are trained in dental-assisting programs offered by community and junior colleges, trade schools, technical institutes, or the Armed Forces. Currently, no such program is offered in Maine.
Statewide Employment There were 948 Dental Assistants employed in Maine in 2002. This occupation is expected to experience more rapid growth (2.7% annually) than the all occupations average (1.0%). The following table lists relevant employment and projection data.
2002 Estimated Employment
2012 Projected Employment
Total 2002 – 2012 Employment Change
Annual Average Percent Change
948 1,238 +290 +2.7 The 10-year employment change reflects the growth that this occupation is expected to experience, but replacement needs must also be considered. An additional 27 annual openings for Dental Assistants are projected and attributed to replacement needs. The following table illustrates total annual needs for Dental Assistants and the percentage of openings attributed to growth and replacement for Dental Assistants compared to all occupations.
Total Annual
Average Openings
Annual Average Openings Due to
Growth
Annual Average Openings Due to
Replacement Dental Assistants (Total) 56 29 27
Dental Assistants (%) 100% 51.8% 48.2% All Occupations (%) 100% 33.7% 66.3%

4 D E N T I S T R Y A N D R E L A T E D
66
Wages Dental Assistants in Maine earn about the national average wage, as shown in the following table.
Maine Maine National Entry Experienced Mean Mean
% of National
Hourly $11.44 $14.48 $13.47 $14.22 Annual $23,790 $30,130 $28,017 $29,570
94.7%
National Employment Dental Assistants are expected to experience annual growth of 3.6 percent, much faster than the 1.4 percent growth rate for all occupations in the United States. The following table illustrates the net change, growth rate and expected employment for this occupation in 2012.
2002 Estimated Employment
2012 Projected Employment
Total 2002 – 2012 Employment Change
Annual Average Percent Change
266,000 379,000 +113,000 +3.6
Outlook Job prospects for dental assistants should be excellent. Employment is expected to grow much faster than the average for all occupations through the year 2012. In fact, dental assistants are expected to be one of the fastest growing occupations through the year 2012. In addition to job openings due to employment growth, numerous job openings will arise out of the need to replace assistants who transfer to other occupations, retire, or leave the labor force. Many opportunities will exist for entry-level positions offering on-the-job training. Population growth and greater retention of natural teeth by middle-aged and older people will fuel demand for dental services. Older dentists, who have been less likely to employ assistants, are leaving the occupation and will be replaced by recent graduates, who are more likely to use dental assistants.

67
Other Doctoral-Level Practitioners These doctoral-level healthcare practitioners, unlike physicians and surgeons, are not surveyed. As a result, only existing data from the Department of Labor is provided. Chiropractors 69 Optometrists 73 Podiatrists 77
Chapter
5


5 O T H E R D O C T O R A L - L E V E L P R A C T I T I O N E R S
69
Chiropractors
Occupational Description
Chiropractors adjust spinal column and other articulations of the body to correct abnormalities of the human body believed to be caused by interference with the nervous system. They also examine patients to determine the nature and extent of disorders and then manipulate the spine or other involved area. Chiropractors may utilize supplementary measures, such as exercise, rest, water, light, heat, and nutritional therapy.
Educational Requirements
All States and the District of Columbia regulate the practice of chiropractic and grant licenses to chiropractors who meet educational and examination requirements established by the State. Most State boards require at least 2 years of undergraduate education, and an increasing number require a 4-year bachelor's degree. All boards require completion of a 4-year chiropractic college course at an accredited program leading to the Doctor of Chiropractic degree.
Schools A chiropractic program prepares individuals to be independent professional practitioners of chiropractic, either straight or progressive. Includes instruction in chiropractic theory, spinal mechanics, spinal manipulation therapy, and radiologic diagnosis; and may also include principles of neurological health, nutrition, hydrotherapy, diet and exercise therapy, clinic and practice management, applicable regulations, and patient counseling. There are no chiropractic programs offered in Maine.
Statewide Employment There were 279 Chiropractors employed in Maine in 2002, and this occupation is expected to experience more rapid growth (2.4% annually) than that of the all occupations average (1.0%). The following table lists relevant employment and projection data.
2002 Estimated Employment
2012 Projected Employment
Total 2002 – 2012 Employment Change
Annual Average Percent Change
279 355 76 2.4
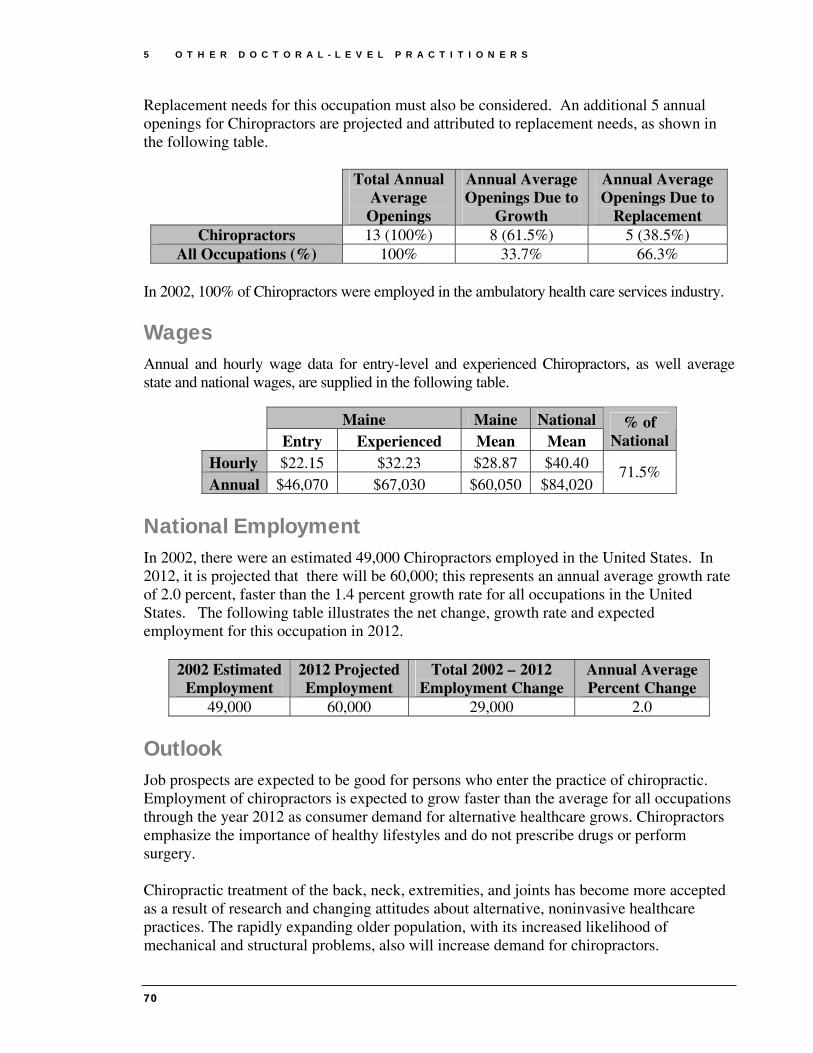
5 O T H E R D O C T O R A L - L E V E L P R A C T I T I O N E R S
70
Replacement needs for this occupation must also be considered. An additional 5 annual openings for Chiropractors are projected and attributed to replacement needs, as shown in the following table.
Total Annual
Average Openings
Annual Average Openings Due to
Growth
Annual Average Openings Due to
Replacement Chiropractors 13 (100%) 8 (61.5%) 5 (38.5%)
All Occupations (%) 100% 33.7% 66.3% In 2002, 100% of Chiropractors were employed in the ambulatory health care services industry.
Wages Annual and hourly wage data for entry-level and experienced Chiropractors, as well average state and national wages, are supplied in the following table.
Maine Maine National Entry Experienced Mean Mean
% of National
Hourly $22.15 $32.23 $28.87 $40.40 Annual $46,070 $67,030 $60,050 $84,020
71.5%
National Employment In 2002, there were an estimated 49,000 Chiropractors employed in the United States. In 2012, it is projected that there will be 60,000; this represents an annual average growth rate of 2.0 percent, faster than the 1.4 percent growth rate for all occupations in the United States. The following table illustrates the net change, growth rate and expected employment for this occupation in 2012.
2002 Estimated Employment
2012 Projected Employment
Total 2002 – 2012 Employment Change
Annual Average Percent Change
49,000 60,000 29,000 2.0
Outlook Job prospects are expected to be good for persons who enter the practice of chiropractic. Employment of chiropractors is expected to grow faster than the average for all occupations through the year 2012 as consumer demand for alternative healthcare grows. Chiropractors emphasize the importance of healthy lifestyles and do not prescribe drugs or perform surgery. Chiropractic treatment of the back, neck, extremities, and joints has become more accepted as a result of research and changing attitudes about alternative, noninvasive healthcare practices. The rapidly expanding older population, with its increased likelihood of mechanical and structural problems, also will increase demand for chiropractors.

5 O T H E R D O C T O R A L - L E V E L P R A C T I T I O N E R S
71
Demand for chiropractic treatment also is related to the ability of patients to pay, either directly or through health insurance. Although more insurance plans now cover chiropractic services, the extent of such coverage varies among plans. Increasingly, chiropractors must educate communities about the benefits of chiropractic care in order to establish a successful practice. In this occupation, replacement needs arise almost entirely from retirements. Chiropractors usually remain in the occupation until traditional retirement age; few transfer to other occupations.


5 O T H E R D O C T O R A L - L E V E L P R A C T I T I O N E R S
73
Optometrists
Occupational Description Optometrists diagnose, manage, and treat conditions and diseases of the human eye and visual system. They examine eyes and visual system, diagnose problems or impairments, prescribe corrective lenses, and provide treatment. Optometrists may also prescribe therapeutic drugs to treat specific eye conditions.
Educational Requirements
All States and the District of Columbia require that optometrists be licensed. The Doctor of Optometry degree requires completion of a 4-year program at an accredited optometry school. Optometrists wishing to teach or do research may study for a master's or Ph.D. degree in visual science, physiological optics, neurophysiology, public health, health administration, health information and communication, or health education. One-year postgraduate clinical residency programs are available for optometrists who wish to specialize in family practice optometry, pediatric optometry, geriatric optometry, vision therapy, contact lenses, hospital-based optometry, primary care optometry, or ocular disease.
Schools The schools in the following table offer Optometry programs in the Northeast; no school in Maine offers such a program.
Provider City New England College of Optometry Boston, MA Suffolk University Boston, MA
Statewide Employment There were 171 Optometrists employed in Maine in 2002, and this occupation is expected to experience much more rapid growth (2.6% annually) than that of the all occupations average (1.0%). The following table lists relevant employment and projection data.
2002 Estimated Employment
2012 Projected Employment
Total 2002 – 2012 Employment Change
Annual Average Percent Change
171 222 51 2.6

5 O T H E R D O C T O R A L - L E V E L P R A C T I T I O N E R S
74
Replacement needs for this occupation must also be considered. An additional 5 annual openings for Optometrists are projected and attributed to replacement needs, as shown in the following table.
Total Annual
Average Openings
Annual Average Openings Due to
Growth
Annual Average Openings Due to
Replacement Optometrists (Total) 10 5 5
Optometrists (%) 100% 50.0% 50.0% All Occupations (%) 100% 33.7% 66.3%
The ambulatory health care services industry employs all Optometrists (excluding private practitioners) in Maine.
Wages Annual and hourly wage data for entry-level and experienced Pharmacy Technicians, as well average state and national wages, are supplied in the following table.
Maine Maine National Entry Experienced Mean Mean
% of National
Hourly $35.96 $66.53 $56.34 $46.29 Annual $74,800 $138,390 $117,187 $96,290
121.7%
National Employment In 2002, there were an estimated 32,000 Optometrists employed in the United States. In 2012, it is projected that there will be 38,000; this represents an annual average growth rate of 1.7 percent, faster than the 1.4 percent growth rate for all occupations in the United States. The table on the following page illustrates the net change, growth rate and expected employment for this occupation in 2012.
2002 Estimated Employment
2012 Projected Employment
Total 2002 – 2012 Employment Change
Annual Average Percent Change
32,000 38,000 6,000 1.7
Outlook Employment of optometrists is expected to grow about as fast as the average for all occupations through 2012, in response to the vision care needs of a growing and aging population. As baby boomers age, they will be more likely to visit optometrists and ophthalmologists because of the onset of vision problems in middle age, including those resulting from the extensive use of computers. The demand for optometric services also will increase because of growth in the oldest age group, with its increased likelihood of
5 O T H E R D O C T O R A L - L E V E L P R A C T I T I O N E R S
75
cataracts, glaucoma, diabetes, and hypertension. Greater recognition of the importance of vision care, rising personal incomes, and growth in employee vision care plans will spur employment growth, as well. Employment of optometrists would grow more rapidly were it not for anticipated productivity gains that will allow each optometrist to see more patients. These expected gains stem from greater use of optometric assistants and other support personnel, who will reduce the amount of time optometrists need with each patient. Also, laser surgery that can correct some vision problems is available, but expensive. Optometrists will still be needed to perform preoperative and postoperative care for laser surgery; however, patients who successfully undergo this surgery may not require optometrists to prescribe glasses or contacts for several years. In addition to growth, the need to replace optometrists who leave the occupation will create employment opportunities. Relatively few opportunities from this source are expected, however, because optometrists usually continue to practice until they retire; few transfer to other occupations.

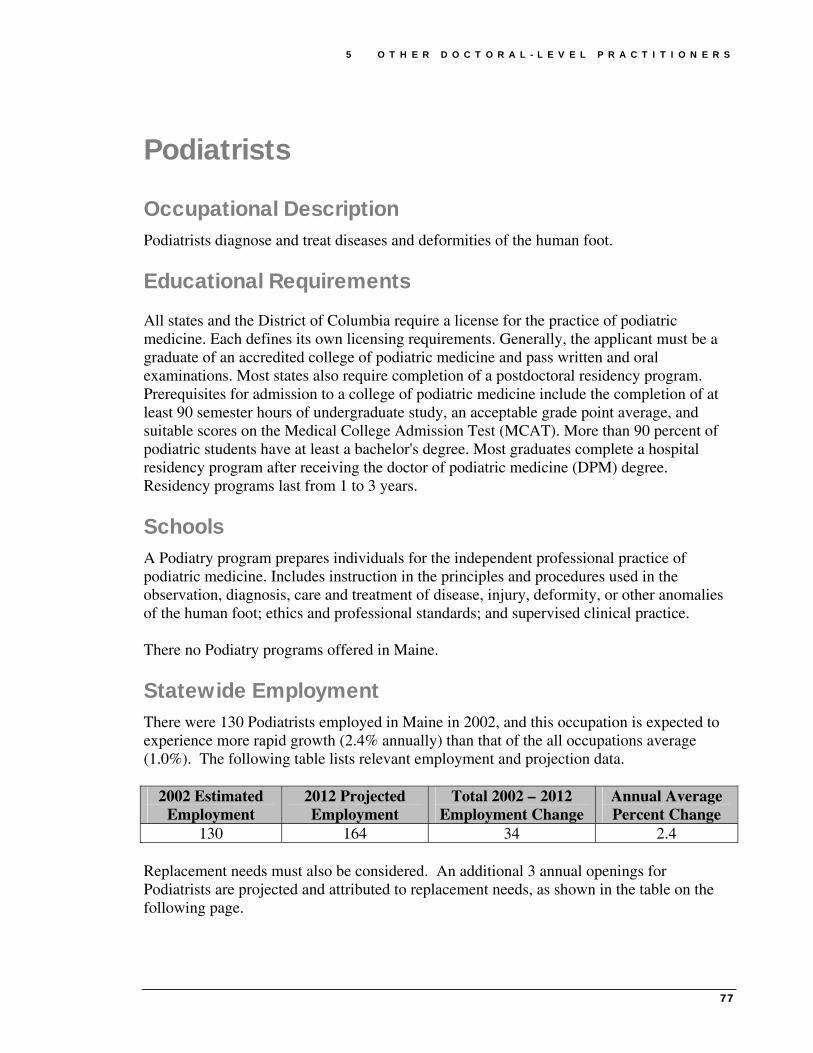
5 O T H E R D O C T O R A L - L E V E L P R A C T I T I O N E R S
77
Podiatrists
Occupational Description Podiatrists diagnose and treat diseases and deformities of the human foot.
Educational Requirements
All states and the District of Columbia require a license for the practice of podiatric medicine. Each defines its own licensing requirements. Generally, the applicant must be a graduate of an accredited college of podiatric medicine and pass written and oral examinations. Most states also require completion of a postdoctoral residency program. Prerequisites for admission to a college of podiatric medicine include the completion of at least 90 semester hours of undergraduate study, an acceptable grade point average, and suitable scores on the Medical College Admission Test (MCAT). More than 90 percent of podiatric students have at least a bachelor's degree. Most graduates complete a hospital residency program after receiving the doctor of podiatric medicine (DPM) degree. Residency programs last from 1 to 3 years.
Schools A Podiatry program prepares individuals for the independent professional practice of podiatric medicine. Includes instruction in the principles and procedures used in the observation, diagnosis, care and treatment of disease, injury, deformity, or other anomalies of the human foot; ethics and professional standards; and supervised clinical practice. There no Podiatry programs offered in Maine.
Statewide Employment There were 130 Podiatrists employed in Maine in 2002, and this occupation is expected to experience more rapid growth (2.4% annually) than that of the all occupations average (1.0%). The following table lists relevant employment and projection data.
2002 Estimated Employment
2012 Projected Employment
Total 2002 – 2012 Employment Change
Annual Average Percent Change
130 164 34 2.4 Replacement needs must also be considered. An additional 3 annual openings for Podiatrists are projected and attributed to replacement needs, as shown in the table on the following page.

5 O T H E R D O C T O R A L - L E V E L P R A C T I T I O N E R S
78
Total Annual
Average Openings
Annual Average Openings Due to
Growth
Annual Average Openings Due to
Replacement Podiatrists 6 (100%) 3 (50%) 3 (50%)
All Occupations (%) 100% 33.7% 66.3% In 2002, ambulatory health care services employed 87.5% of all Podiatrists in Maine.
Wages Annual and hourly wage data for entry-level and experienced Podiatrists, as well average state and national wages, are supplied in the following table.
Maine Maine National Entry Experienced Mean Mean
% of National
Hourly $26.50 $45.24 $38.99 $53.43 Annual $55,120 $94,090 $81,099 $111,130
73.0%
National Employment In 2002, there were an estimated 13,000 Podiatrists employed in the United States. In 2012, it is projected that there will be 15,000; this represents an annual average growth rate of 1.4 percent, identical to the 1.4 percent growth rate for all occupations in the United States. The following table illustrates the net change, growth rate and expected employment for this occupation in 2012.
2002 Estimated Employment
2012 Projected Employment
Total 2002 – 2012 Employment Change
Annual Average Percent Change
13,000 15,000 2,000 1.4
Outlook Employment of podiatrists is expected to grow about as fast as the average for all occupations through 2012. Demand for podiatric services will increase with the number of injuries experienced by a more active and increasingly older population. Additional job openings will result from podiatrists who retire from the occupation, particularly members of the baby-boom generation. However, relatively few job openings are expected because the occupation is small and most podiatrists practice until at least traditional retirement age. Medicare and most private health insurance programs cover acute medical and surgical foot services, as well as diagnostic x rays and leg braces. Details of such coverage vary among plans. However, routine foot care—including the removal of corns and calluses—ordinarily is not covered, unless the patient has a systemic condition that has resulted in severe circulatory problems or areas of desensitization in the legs or feet. Like dental

5 O T H E R D O C T O R A L - L E V E L P R A C T I T I O N E R S
79
services, podiatric care is often discretionary and, therefore, more dependent on disposable income than some other medical services. Opportunities will improve for board-certified podiatrists because employers and payers are increasingly requiring board certification. Opportunities for newly trained podiatrists will be better in group medical practices, clinics, and health networks rather than a traditional solo practice. Establishing a practice will be most difficult in the areas surrounding colleges of podiatric medicine, because podiatrists are concentrated in these locations.


81
Nursing Ensuring an adequate supply of nurses has become a significant issue as numerous vacancies have been reported for both Registered and Licensed Practical Nurses. The impact of such vacancies will continue to grow as the state’s population ages, thus increasing the demand for healthcare services, and as the average age of nurses increases, thus leading to a great deal of attrition in the form of retirements.
To obtain data on this important workforce, the Maine Minimum Data Set was created. Beginning with September 2002 renewals, the Maine Minimum Data Set survey was inserted by the Maine State Board of Nursing with all renewal notifications. Of an estimated 23,000 nurses receiving renewal notices during the two-year period, 15, 960 licensed nurses, including both Licensed Practical Nurses and Registered Nurses, completed the survey. This reflects an estimated response rate of 69 percent. The methodology, quality of data, and success of the Maine Minimum Data Set provide a model to be applied to other healthcare occupations to aid in ensuring an adequate supply of a skilled healthcare workforce. Registered Nurses 83 Licensed Practical Nurses 95
Chapter
6


6 N U R S I N G
83
Registered Nurses The supply of Registered Nurses in Maine has been a high-profile issue in recent years as employers report continued difficulty in attracting and retaining an adequate number of RNs; in fact, the 2005 Maine Job Vacancy Survey estimates that 6.3% of all RN positions are vacant. The reasons for—and implications of—such a shortage, perceived or otherwise, are significant and directly impact the level of care provided to patients. This inaugural report intends to begin examining the supply and demand issues associated with this occupation.
Occupational Description Registered Nurses assess patient health problems and needs, develop and implement nursing care plans, and maintain medical records. These healthcare providers administer nursing care to ill, injured, convalescent, or disabled patients, and may advise patients on health maintenance and disease prevention or provide case management. Registered Nurses, in general, include advance practice nurses such as: nurse practitioners, clinical nurse specialists, certified nurse midwives, and certified nurse anesthetists. Advanced practice nursing is practiced by RNs who have specialized formal, post-basic education and who function in highly autonomous and specialized roles.
Characteristic Data The Maine Minimum Data Set, a voluntary survey completed by nurses at the time of relicensure, provides significant insight into a complex workforce. Data captured in this survey effort illustrates such characteristic data as age, gender, intent to remain in practice, and reason why not actively practicing. This data, once largely impossible to obtain, serves a vital role in the decision-making of policymakers and healthcare industry leaders. It is this data that will serve as the basis for the analysis in this report. Beginning with September 2002 renewals, the Maine Minimum Data Set survey was inserted by the Maine State Board of Nursing with all renewal notifications. Of an estimated 23,000 nurses receiving renewal notices during the two-year period, 15, 960 licensed nurses, including both Licensed Practical Nurses and Registered Nurses, completed the survey. This reflects an estimated response rate of 69 percent. The methodology, quality of data, and success of the survey provide a model to be applied to other healthcare occupations to aid in ensuring an adequate supply of a skilled healthcare workforce. The resulting database was then provided to the Department of Labor for analysis. It should be noted that additional analysis of this same data has been completed by OMNE Nursing Leaders of Maine.

6 N U R S I N G
84
Of the 15,960 licensed nurses responding to this survey, 87.3% (13,714) indicated that they are a Registered Nurse; the following data and analysis will be based only on this subset of licensed nurses. A significant disparity in gender distribution among Registered Nurses is evident as 93.4% of all RNs are female; this disparity is particularly noteworthy as the successful recruitment of men into this field may help bolster enrollments, completers, and active nurses. Also, in determining and ensuring an adequate supply of healthcare professionals, age is a very important component as retirement may be a significant source of attrition for Registered Nurses. Also, the identification of these individuals’ intent to remain in practice in five years can provide insight into the future of this labor market. Age and intent to remain in practice data for RNs is provided in the table on the following page.
Registered Nurses: Age Distribution and Intent to Remain in Practice Intend to be practicing in 5 yearsAge
Group Percent of All
Registered Nurses Yes No Uncertain 22 - 31 6.8% 89.4% 1.5% 9.2% 32 - 41 18.6% 87.8% 2.0% 10.2% 42 - 51 33.2% 87.1% 2.6% 10.3% 52 - 61 29.2% 75.7% 8.3% 16.0% 62 - 71 10.2% 30.9% 33.3% 35.8% 72 - 81 1.7% 14.3% 39.3% 46.4%
82+ 0.2% 0.0% 0.0% 100.0% The average age of all responding Registered Nurses is 48.9 years old, and a large percentage of RNs are at or nearing typical retirement age in Maine, which is alarming as the age distribution of these professionals is not uniform throughout the cohorts. With the majority of RNs between 42 and 61, significant attrition may occur as these two cohorts reach typical retirement ages. Considering the relatively small sizes of the two youngest cohorts, ensuring an adequate supply of RNs may prove problematic in the future. In determining supply in the near future (within 5 years), the intent of current nurses to remain in practice helps explain labor market projections because nurses commonly work beyond typical retirement ages. Survey results indicate that 13.4% (545 total) of all RNs aged 52 and older do not expect to be practicing in five years. It is important to note that while valuable, the preceding data covers all responding RNs that are licensed in Maine—and this may not serve as the best estimate of supply in this labor market. A more complete measure of the supply of RNs in Maine may be obtained by imparting survey data to a base estimate of nurses—with the assumption that the survey responders (69% response rate) are reflective of the entire nursing population. In applying

6 N U R S I N G
85
data from survey responders to the base estimate of 23,000 nurses (both RNs and LPNs), a realistic estimate of the supply of RNs in Maine can be extrapolated. Starting with the number of surveys accompanying the relicensure process—roughly 23,000—a few factors must be considered to determine a realistic estimate of the supply of RNs in Maine: the percentage of all nurses that are RNs, the percentage of these RNs living in Maine, and the percentage of RNs working in nursing or looking for employment as a nurse. As stated earlier in this section, 87.3% of respondents indicated that they are an RN. Assuming this distribution of RNs among all nurses is reflective of that of the entire population, there are roughly 20,000 RNs licensed in Maine. However, this number does not necessarily represent an accurate estimate of the supply, as many individuals are not likely to practice in Maine. To determine supply, one must first consider where these licensed RNs live—as shown in the following table.
Registered Nurses: Place of Residence Residence Number Percentage
In Maine 11,822 87.3% Outside Maine, but in U.S. 1,575 11.6% Outside U.S. 135 1.0%
Of the 13,536 responders, 87.3% (or 11,822 of respondents) live in Maine; it is this subset of RNs that are most likely to be potential and current labor market participants. Although the costs and efforts associated with obtaining a nursing license in Maine aren’t prohibitive, it is unlikely that RNs living outside of Maine would be drawn into this labor market en mass. Additionally, the impact of those working in Maine but living elsewhere isn’t significant (with only 134 instances reported), but it may be dramatic in some geographic areas (e.g. northern Maine); for the purpose of this report and analysis, the impact of these individuals will be largely ignored, as the magnitude of those RNs living in Maine and working out-of-state (a reported 208) more than offsets this. Within these assumptions, the percentage of licensed RNs living in Maine among all licensed RNs—87.3%—can be applied to the earlier estimated figure of 20,000 licensed RNs to provide a better assessment of the supply of RNs in Maine. This resulting subset—licensed RNs that actually live in Maine—numbers roughly 17,500. The subset of RNs living in Maine, however, still does not reflect the labor supply because many professionals maintain licenses even though they are no longer actively employed as a nurse. The employment status of those RNs living in Maine is provided in the table on the following page.

6 N U R S I N G
86
Registered Nurses: Employment Status
Employment Number PercentageEmployed in Nursing 11,556 84.8% Employed in Another Field 548 4.0% Seeking Nursing Employment 184 1.4% Temporarily Not Working/Not Looking For Work 674 4.9% Retired/No Plans To Return To Work 667 4.9% Total 13,629 100.0%
Of the 13,629 RNs who reported their employment status, 9.8% (1,341 total) are either retired (and have no plans to return to work) or are temporarily not working (and not looking for a job). An additional 4.0% of respondents are employed in another field, and may be unlikely to reenter this labor market. Ultimately, only 86.2% (or 11,740 total) of responding RNs are working as an RN or looking for employment as an RN. Applying this data to the number of RNs who live in Maine—estimated earlier to be 17,500—results in a supply of approximately 15,000 RNs living in Maine and either working or actively pursing employment in nursing. This supply estimate of 15,000 RNs is interesting as it exceeds the Maine Department of Labor’s estimated employment for 2002—although a shortage of RNs at both state and national levels has been widely publicized as healthcare providers have experienced prolonged vacancies among nursing staff and general difficulty in the recruitment and retention of RNs. Interpretations of this data—and the complications associated with these interpretations—are presented in the “Supply” section. In assessing supply, it is also important to note the highest level of nursing education attained by currently licensed RNs. This information may help determine the impact of any proposed changes in educational requirements, specifically the acceptance of the Bachelor of Science in Nursing as entry level into professional nursing and the Associates degree as entry level into technical nursing. With nearly one-third of all RNs possessing an Associate’s degree as his or her highest level of education, such change would have a dramatic effect on the supply of these professionals.
Registered Nurses: Highest Level of Nursing Education Attained
Level Percentage Diploma RN 27.5% Associate Degree RN 30.3% Bachelor Degree RN 32.8% Master's Degree RN 8.7% Doctoral Degree RN 0.8%

6 N U R S I N G
87
Further identifying where RNs live and work in Maine can add insight to the identification of areas that may be underserved or experiencing difficulties in recruiting these professionals. Residence and employment information, as reported through the survey of RNs, is provided in the following table.
RNs: County of Employment and Residence County Work Live County Work Live Androscoggin 9.5% 8.2% Oxford 2.5% 3.4% Aroostook 6.1% 5.5% Penobscot 15.4% 13.0%Cumberland 29.4% 23.6% Piscataquis 1.0% 1.0% Franklin 1.7% 2.0% Sagadahoc 0.7% 2.7% Hancock 3.6% 4.8% Somerset 2.1% 2.3% Kennebec 11.9% 10.4% Waldo 1.6% 3.0% Knox 1.8% 2.5% Washington 1.8% 1.8% Lincoln 2.9% 3.2% York 8.1% 12.7%
Educational Requirements In all states and the District of Columbia, students must graduate from an approved nursing program and pass a national licensing examination in order to obtain a nursing license. Nurses may be licensed in more than one state, either by examination, by the endorsement of a license issued by another state, or through a multi-state licensing agreement. All states require periodic renewal of licenses, which may involve continuing education. There are two major educational paths to registered nursing: a bachelor’s of science degree in nursing (BSN) and an associate degree in nursing (AND). BSN programs, offered by colleges and universities, take about 4 years to complete. ADN programs, offered by community and junior colleges, take about 2-3 years to complete. Generally, licensed graduates of either type of educational program qualify for entry-level positions as staff nurses.

6 N U R S I N G
88
Schools The schools in the following table offer Nursing (RN Training) programs in Maine.
Provider City Central Maine Community College Auburn Central Maine Medical Center Lewiston Eastern Maine Community College Bangor Husson College Bangor Kennebec Valley Community College
Fairfield
Northern Maine Community College Presque Isle Southern Maine Community College South Portland St. Joseph’s College Standish University of Maine at Augusta Augusta University of Maine at Fort Kent Fort Kent University of Maine Orono University of New England Biddeford University of Southern Maine Portland
The table on the following page represents the graduates of Registered Nurse training programs in Maine for the past four academic years. This data was compiled from the Fall 2005 Survey of Maine Nursing Education Programs and is the most complete and up-to-date information available. Analysis of this data must be undertaken in the future to determine rates and causes of attrition within nursing programs.
Maine's Nursing Programs: Enrollment and Graduate Data
Degree 2001-2002
2002-2003
2003-2004
2004-2005
Enrollments Associate's Degree 668 773 789 806 Baccalaureate Degree 1,100 1,210 1,513 1,480 Total 1,768 1,983 2,302 2,286
Graduates Associate's Degree 239 251 324 337 Baccalaureate Degree 153 162 246 273 Total 392 413 570 610 Enrollment numbers in generic Baccalaureate Degree programs reflect students enrolled as freshmen, sophomores, juniors, and seniors; this is in contrast to Associate Degree numbers, which reflect 1st and 2nd year
students.

6 N U R S I N G
89
Statewide Employment There were 13,000 Registered Nurses employed in Maine in 2002, and this occupation is expected to experience more growth (2.4% annually) than that of the all occupations average (1.0%). The following table lists relevant employment and projection data.
2002 Estimated Employment
2012 Projected Employment
Total 2002-2012 Employment Change
Annual Average Percent Change
13,000 16,469 3,469 2.4 The above 10-year employment change reflects the growth that this occupation is expected to experience, but replacement needs must also be considered. An additional 272 annual openings for Registered Nurses is projected and attributed to replacement needs. The following table illustrates annual growth and replacement needs for Registered Nurses and the percentage of openings attributed to growth and replacement for both Registered Nurses and all occupations.
Total Annual Average
Openings
Annual Average Openings Due to
Growth
Annual Average Openings Due to
Replacement Registered Nurses 619 (100%) 347 (56.1%) 272 (43.9%)
All Occupations (%) 100% 33.70% 66.30% The top eight industries that employ Registered Nurses in Maine are hospitals (with 59.9% of all Registered Nurses), ambulatory health care services (17.0%), nursing and residential care facilities (11.2%), educational services (3.7%), social assistance (1.3%), administrative and support services (0.6%), professional and technical services (0.6%), and paper manufacturing (0.1%).
Maine Job Vacancies For Registered Nurses, the number of job vacancies in 2005 was markedly higher than the number of job vacancies in 2002; additionally, the job vacancy rate also increased to 6.3%. The findings are summarized in the table below.
Year Vacancies Vacancy Rate 2002 638 5.3% 2005 853 6.3%
Change +215 +1.0%
Wages Annual and hourly wage data for entry-level and experienced Registered Nurses, as well average state and national wages, are supplied in the table on the following page and indicate that Maine RNs earn less than the national average.

6 N U R S I N G
90
Maine Maine National Entry Experienced Mean Mean
% of National
Hourly $19.00 $27.95 $24.97 $26.77 Annual $39,520 $58,140 $51,938 $55,680
93.3%
National Employment In 2002, there were an estimated 2,284,000 Registered Nurses employed in the United States. In 2012, it is projected that there will be 2,908,000; this represents an annual average growth rate of 2.4 percent, faster than the 1.4 percent growth rate for all occupations in the United States. The following table illustrates growth rate and expected employment for RNs.
2002 Estimated Employment
2012 Projected Employment
Total 2002-2012 Employment Change
Annual Average Percent Change
2,284,000 2,908,000 624,000 2.4
Demand Nationally, job opportunities for RNs are expected to be very good. Employment of registered nurses is expected to grow faster than the average for all occupations through 2012, and because the occupation is very large, many new jobs will result. In fact, more new jobs are expected be created for RNs than for any other occupation. Thousands of job openings also will result from the need to replace experienced nurses who leave the occupation, especially as the median age of the registered nurse population continues to rise. Employment will also be affected by clinical and technological advances in patient care, including increased emphasis on preventive care. In addition, the aging of Maine and the U.S. population will expand demand for nurses. Employment in hospitals, the largest sector, is expected to grow at a slower rate than in most other healthcare sectors. While the intensity of nursing care is likely to increase, requiring more nurses per patient, the number of inpatients (those who remain in the hospital for more than 24 hours) is not likely to increase much. Patients are being discharged earlier and more procedures are being done on an outpatient basis, thus, job growth is expected in hospital and other outpatient facilities, such as those providing same-day surgery, rehabilitation, and chemotherapy. Employment in nursing care facilities is expected to grow faster than average due to increases in the number of elderly, many of whom require long-term care. In addition, the financial pressure on hospitals will likely increase the transfer of patients to nursing care facilities. Job growth also is expected in units that provide specialized long-term rehabilitation for stroke and head injury patients, and those suffering from Alzheimer’s. Employment in home healthcare is expected to increase rapidly in response to the growing number of older persons with disabilities, consumer preference for care in the home, and
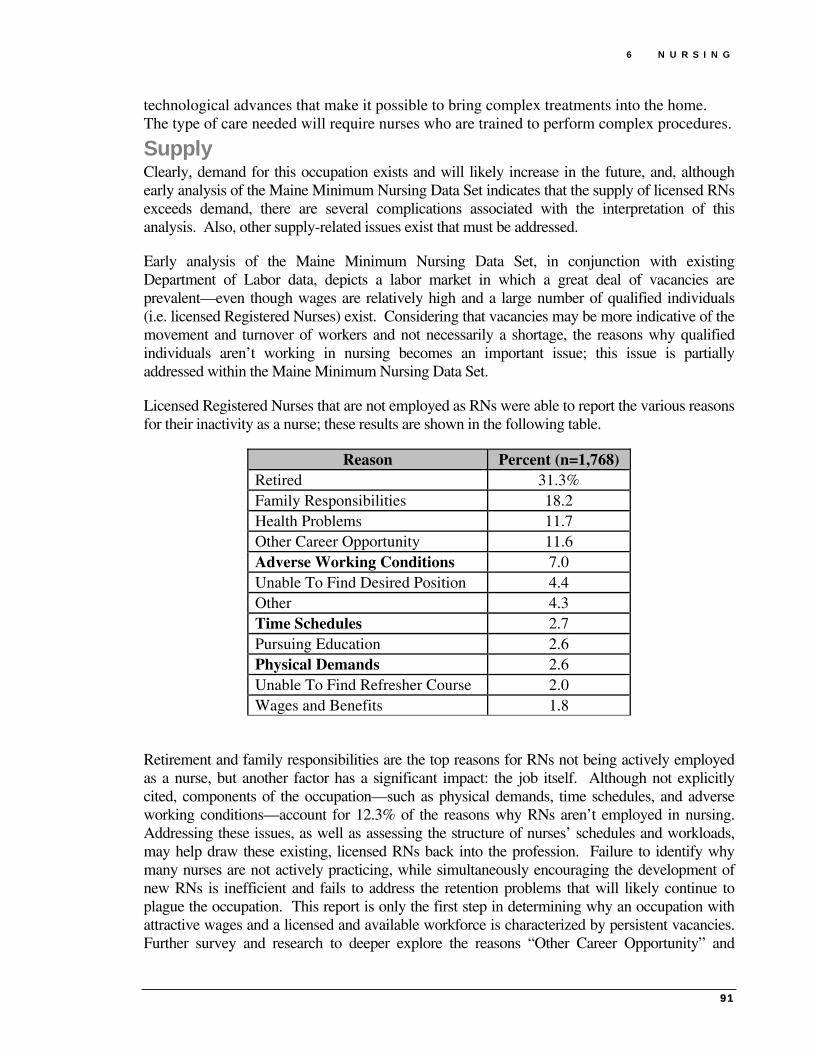
6 N U R S I N G
91
technological advances that make it possible to bring complex treatments into the home. The type of care needed will require nurses who are trained to perform complex procedures.
Supply Clearly, demand for this occupation exists and will likely increase in the future, and, although early analysis of the Maine Minimum Nursing Data Set indicates that the supply of licensed RNs exceeds demand, there are several complications associated with the interpretation of this analysis. Also, other supply-related issues exist that must be addressed.
Early analysis of the Maine Minimum Nursing Data Set, in conjunction with existing Department of Labor data, depicts a labor market in which a great deal of vacancies are prevalent—even though wages are relatively high and a large number of qualified individuals (i.e. licensed Registered Nurses) exist. Considering that vacancies may be more indicative of the movement and turnover of workers and not necessarily a shortage, the reasons why qualified individuals aren’t working in nursing becomes an important issue; this issue is partially addressed within the Maine Minimum Nursing Data Set.
Licensed Registered Nurses that are not employed as RNs were able to report the various reasons for their inactivity as a nurse; these results are shown in the following table.
Reason Percent (n=1,768) Retired 31.3% Family Responsibilities 18.2 Health Problems 11.7 Other Career Opportunity 11.6 Adverse Working Conditions 7.0 Unable To Find Desired Position 4.4 Other 4.3 Time Schedules 2.7 Pursuing Education 2.6 Physical Demands 2.6 Unable To Find Refresher Course 2.0 Wages and Benefits 1.8
Retirement and family responsibilities are the top reasons for RNs not being actively employed as a nurse, but another factor has a significant impact: the job itself. Although not explicitly cited, components of the occupation—such as physical demands, time schedules, and adverse working conditions—account for 12.3% of the reasons why RNs aren’t employed in nursing. Addressing these issues, as well as assessing the structure of nurses’ schedules and workloads, may help draw these existing, licensed RNs back into the profession. Failure to identify why many nurses are not actively practicing, while simultaneously encouraging the development of new RNs is inefficient and fails to address the retention problems that will likely continue to plague the occupation. This report is only the first step in determining why an occupation with attractive wages and a licensed and available workforce is characterized by persistent vacancies. Further survey and research to deeper explore the reasons “Other Career Opportunity” and

6 N U R S I N G
92
“Family Responsibilities” may indicate that a restructuring of nurses’ schedules and workloads may be needed to draw inactive nurses back into labor market, if only on a part-time basis, to help meet demand.
It is clear that the labor market, as it currently functions, is relatively ineffective in aligning licensed RNs and employers. Even clearer is that the model of the past will no longer be successful in developing new RNs to meet increased demand as one considers the age, gender, and educational attainment distributions of RNs and the changing demographics of the state.
Of utmost concern is the age distribution among RNs. The nursing workforce is aging as there has been a decline in the number of young people—particularly women—choosing nursing as a profession. This can largely be attributed to expanding employment opportunities for women outside of nursing, which, for a very long time, was one of the few accepted career options for women. As employment opportunities have expanded, interest in nursing has dwindled; declining national enrollments in nursing programs corroborate this. As a result, the average age of the nursing population is increasing; the large numbers of nurses that entered the profession in the 1970s are now over the age of 40—and aren’t being replaced by younger nurses.
Another issue that must be addressed in order to ensure an adequate supply of nurses is the relative homogeneity of the occupation. According to the 2005 Maine Minimum Nursing Dataset, 97.4% of all nurses are white, 93.4% are female, and the average age of all licensed nurses in Maine is 48.9 years old. This data is indicative of the profile of most nurses—white, women aged 25-54—who, importantly, have traditionally formed the core of the nurse workforce. Disturbingly, this demographic (women, 25 to 54) will remain largely unchanged (or decreasing) in terms of numbers between 2000 and 2020; thus, the traditional labor pool for this occupation will remain the same as demand continues to increase. Population projections for those in this traditional nursing labor force are provided in the table below. Clearly, the diversification of the nursing population will be paramount in providing an adequate supply to meet expected demand.
Maine Population Projections Demographic Indicators 2000 2010 2020
Females, ages 25 to 54 286,066 290,757 274,311 Source: U.S. Census Bureau, Population Division, Interim State
Population Projections, 2005
The educational level required to be a registered nurse may also have a dramatic impact on the supply of these professionals as preferences for nurses educated at the baccalaureate level may increase. This increased preference for these nurses may, in part, be linked to a study conducted by the University of Pennsylvania’s Center for Health Outcomes and Policy Research. The study indicates that baccalaureate nursing education has a direct impact on patient outcomes; in fact, one key finding indicates that, in hospitals, a 10% increase in the proportion of nurses holding a BSN (Bachelor of Science in Nursing) degree decreased the risk of patient death and failure to revive by five percent. Additionally—and alarmingly—nurses’ years of experience had no impact on mortality or failure to rescue rates. These and other key findings were published in the Journal of the American Medical Association and have been applauded by the

6 N U R S I N G
93
American Association of Colleges of Nursing. In fact, the latter organization even “advises consumers concerned about their safety to check with hospitals and other healthcare facilities to determine the proportion of baccalaureate and higher degree prepared nurses on staff before scheduling surgery or other serious procedures.”
The preference of consumers, and subsequently, healthcare service providers, for registered nurses educated at the baccalaureate level could have a dramatic effect on the supply of these professionals. If the market, spurred by consumer and special group interests, begins placing a premium on those nurses educated at the baccalaureate level, potential labor market entrants (i.e. nursing students) will likely pursue avenues to obtain any and all incentives that will likely exist; these avenues will be the baccalaureate nursing programs in Maine. Herein lies a major problem; in a period in which demand for registered nurses will be increasing, a greater number of students will want to enroll in baccalaureate programs, and, unfortunately, there are only five such programs in Maine. Thus, a major bottleneck may exist—and at a time when nurses will be in great demand. Also, it should be noted that as the preferred level of education for nurses increases (either as a requirement or a perception), the lag time associated with producing registered nurses will also increase.
Analysis
Employers in some parts of the country are reporting difficulty in attracting and retaining an adequate number of RNs, due primarily to an aging RN workforce and insufficient nursing school enrollments. Imbalances between the supply of, and demand for, qualified workers should spur efforts to attract and retain qualified RNs. For example, employers may restructure workloads, improve compensation and working conditions, and subsidize training or continuing education.
Survey data indicates that there are several reasons why many licensed nurses are inactive, and more insight is needed to determine what efforts must be undertaken to ensure an adequate supply of Registered Nurses in Maine. However, it is very clear that policies promoting the retention and recruitment of existing RNs should be carefully considered—perhaps even more so than education—as even newly trained RNs may continue to leave nursing.
Current efforts to increase the supply of RNs—such as subsidizing and expanding educational opportunities—may be beneficial, but they do not address the underlying problem of persistent vacancies or the root cause of this problem. To fully maximize the benefits of subsequent efforts to bolster the supply of RNs in Maine, the causes of these vacancies must be addressed.

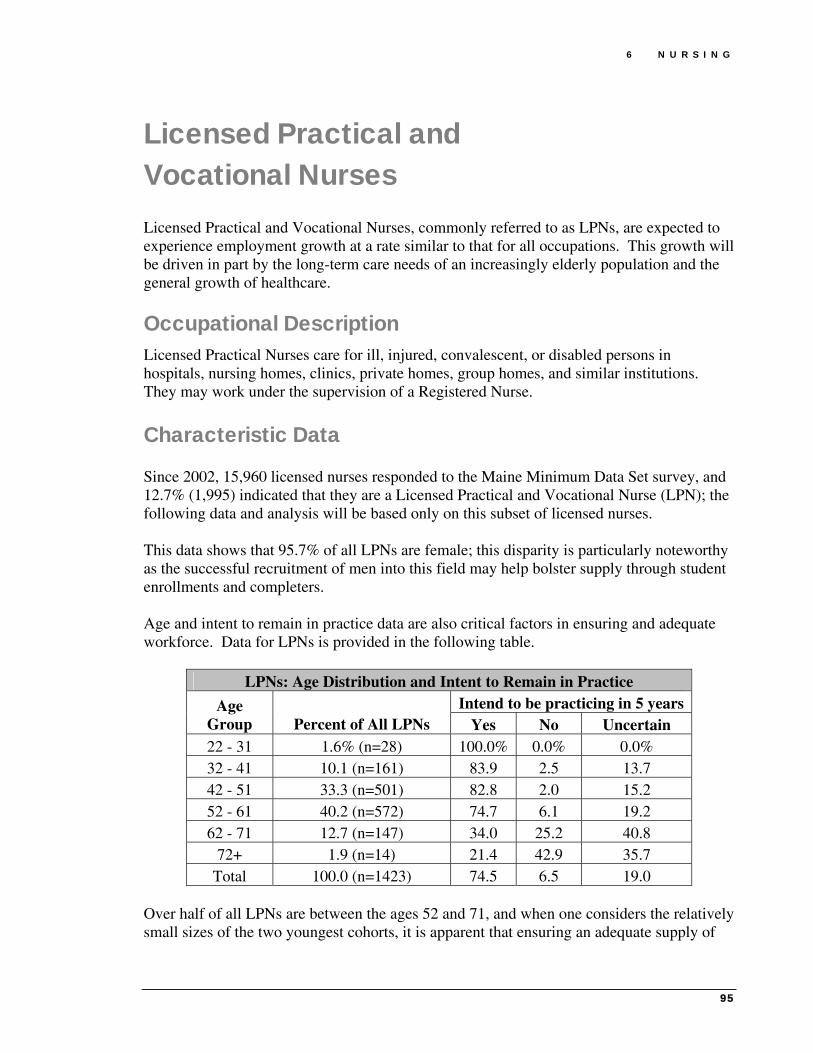
6 N U R S I N G
95
Licensed Practical and Vocational Nurses Licensed Practical and Vocational Nurses, commonly referred to as LPNs, are expected to experience employment growth at a rate similar to that for all occupations. This growth will be driven in part by the long-term care needs of an increasingly elderly population and the general growth of healthcare.
Occupational Description Licensed Practical Nurses care for ill, injured, convalescent, or disabled persons in hospitals, nursing homes, clinics, private homes, group homes, and similar institutions. They may work under the supervision of a Registered Nurse.
Characteristic Data Since 2002, 15,960 licensed nurses responded to the Maine Minimum Data Set survey, and 12.7% (1,995) indicated that they are a Licensed Practical and Vocational Nurse (LPN); the following data and analysis will be based only on this subset of licensed nurses. This data shows that 95.7% of all LPNs are female; this disparity is particularly noteworthy as the successful recruitment of men into this field may help bolster supply through student enrollments and completers. Age and intent to remain in practice data are also critical factors in ensuring and adequate workforce. Data for LPNs is provided in the following table.
LPNs: Age Distribution and Intent to Remain in Practice Intend to be practicing in 5 yearsAge
Group Percent of All LPNs Yes No Uncertain 22 - 31 1.6% (n=28) 100.0% 0.0% 0.0% 32 - 41 10.1 (n=161) 83.9 2.5 13.7 42 - 51 33.3 (n=501) 82.8 2.0 15.2 52 - 61 40.2 (n=572) 74.7 6.1 19.2 62 - 71 12.7 (n=147) 34.0 25.2 40.8
72+ 1.9 (n=14) 21.4 42.9 35.7 Total 100.0 (n=1423) 74.5 6.5 19.0
Over half of all LPNs are between the ages 52 and 71, and when one considers the relatively small sizes of the two youngest cohorts, it is apparent that ensuring an adequate supply of

6 N U R S I N G
96
LPNs may prove problematic in the future. Survey results indicate that 10.6% (78 total) of all LPNs aged 52 and older do not expect to be practicing in five years. While valuable, the characteristic data for all responding LPNs licensed in Maine may not serve as the best estimate of supply. A more indicative measure of the supply of LPNs in Maine may be to compare the number of licensed LPNs to the number working or seeking work as a nurse. As stated earlier, 12.7% of survey respondents indicated that they are an LPN; thus, of the estimated 23,000 nurses licensed in Maine, 2,900 are LPNs. This number reflects all LPNs licensed in Maine, which isn’t an accurate estimate of the supply of LPNs as some of these nurses may not even live in Maine, and may, ultimately, be unlikely to practice in the state. This data is provided in the following table.
LPNs: Place of Residence Residence Number Percentage
In Maine 1,302 92.3% Outside Maine, but in U.S. 108 7.7% Outside U.S. 0 0.0% Total 1,410 100.0%
1,410 LPNs reported where they live, and, of this number, 1,302 (or 92.3% of respondents) live in Maine. Applying this assumption to the earlier estimate of 2,900 LPNs, this results in roughly 2,700 LPNs living in Maine. However, even this measure is not a good indicator of supply as many LPNs are not actively practicing. The employment status of those LPNs living in Maine is provided in the following table.
LPNs: Employment Status Employment Number Percentage
Employed in Nursing 1,471 74.5%
Employed in Another Field 217 11.0%
Seeking Nursing Employment 45 2.3% Temporarily Not Working/Not Looking For Work
152 7.7%
Retired/No Plans To Return To Work 89 4.5%
Total 1,974 100.0% Of the 1,974 LPNs who reported employment status, 12.2% (241 total) are either retired (and have no plans to return to work) or are temporarily not working (and not looking for a job). An additional 11% of respondents are employed in another field, and may be unlikely to reenter this labor market. Ultimately, only 76.8% of responding LPNs are working as an LPN or looking for employment as an LPN, which indicates a supply of roughly 2,100 LPNs living in Maine and either working as a nurse or actively pursing employment in nursing. This supply figure is similar to the estimated employment for 2002.

6 N U R S I N G
97
Identifying where LPNs live and work in Maine can highlight areas that may be underserved. Residence and employment information for LPNs is provided in the following table.
LPNs: County of Employment and Residence County Work Live County Work Live Androscoggin 119 151 Oxford 53 94 Aroostook 144 184 Penobscot 170 212 Cumberland 260 282 Piscataquis 16 28 Franklin 33 47 Sagadahoc 17 44 Hancock 52 73 Somerset 49 73 Kennebec 134 148 Waldo 16 43 Knox 35 53 Washington 39 46 Lincoln 23 44 York 116 221
Educational Requirements All states and the District of Columbia require LPNs to pass a licensing examination after completing a state-approved practical nursing program. A high school diploma, or equivalent, usually is required for entry into an LPN program, although some programs accept candidates without a diploma or are designed as part of a high school curriculum. Most practical nursing programs last one year and include both classroom study and supervised clinical practice.
Schools The following schools offer Practical Nurse (LPN Training) programs in Maine.
Provider City 2003-2004 Completers Central Maine Community College Auburn 13 Eastern Maine Community College Bangor NA Kennebec Valley Community College Fairfield 14 Northern Maine Community College Presque Isle 1 Southern Maine Community College South Portland NA
Statewide Employment There were 2,294 LPNs employed in Maine in 2002, and this occupation is expected to experience slightly more growth (1.4% annually) than that of the all occupations average (1.0%), as shown in the following table.
2002 Estimated Employment
2012 Projected Employment
Total 2002 – 2012 Employment Change
Annual Average Percent Change
2,294 2,625 331 1.4

6 N U R S I N G
98
An additional 50 annual openings for LPNs is projected and attributed to replacement needs, as shown in the following table.
Total Annual Average
Openings
Annual Average
Openings Due to Growth
Annual Average Openings Due to
Replacement LPNs (Total) 83 33 50
LPNs (%) 100% 39.80% 60.20% All Occupations (%) 100% 33.70% 66.30%
The top three industries that employ the most Licensed Practical and Licensed Vocational Nurses are Nursing and Residential Care Facilities (39.4% of all LPNs), Ambulatory Health Care Services (28.5%), and Hospitals (21.0%).
Maine Job Vacancies In 2005, there were an estimated 65 job vacancies for Licensed Practical and Licensed Vocational Nurses, which, when compared to employment for this occupation, indicated a job vacancy rate of 3.3%. Vacancy data for 2002 is unavailable.
Wages Maine LPNs earn less than their national counterparts, on average, as shown in the following table.
Maine Maine National Entry Experienced Mean Mean
% of National
Hourly $13.06 $17.37 $15.93 $17.11 Annual $27,160 $36,120 $33,134 $35,580
93.1%
National Employment In 2002, there were an estimated 702,000 Licensed Practical and Licensed Vocational Nurses employed in the United States. In 2012, it is projected that there will be 844,000, indicating an annual average growth rate of 1.9 percent, faster than the 1.4 percent growth rate for all occupations in the United States. The following table illustrates the net change, growth rate and expected employment for this occupation from 2002-2012.
2002 Estimated Employment
2012 Projected Employment
Total 2002 – 2012 Employment Change
Annual Average Percent Change
702,000 844,000 142,000 1.9

6 N U R S I N G
99
Outlook Employment of LPNs is expected to grow about as fast as the average for all occupations through 2012. Replacement needs will be a major source of job openings, as many workers retire. The number of hospital-based jobs for LPNs is likely to decline; however, this may be offset by increased employment in other settings, such as ambulatory centers and long-term care facilities. In fact, employment of LPNs in nursing care facilities is expected to grow faster than the average as the number of aged and disabled persons in need of long-term care increases.


101
Direct Care Workers Direct Care Workers serve many roles in providing direct care, support, and personal assistance in numerous settings for the elderly and disabled. The impact of these workers in the near future as Maine continues to age will be dramatic.
The following section examines employment and wage estimates for several Direct Care occupations—Nursing Aides, Orderlies, and Attendants; Home Health Aides; Psychiatric Aides; Personal and Home Care Aides; and Psychiatric Technicians. Direct Care Workers 103
Chapter
7


7 D I R E C T C A R E W O R K E R S
103
Direct Care Workers
Occupational Descriptions Nursing Aides, Orderlies, and Attendants (often referred to as Certified Nurses Aides) provide basic patient care under direction of nursing staff. Perform duties, such as feed, bathe, dress, groom, or move patients, or change linens. Home Health Aides provide routine, personal healthcare, such as bathing, dressing, or grooming, to elderly, convalescent, or disabled persons in the home of patients or in a residential care facility. Psychiatric Aides assist mentally impaired or emotionally disturbed patients, working under direction of nursing and medical staff. Personal and Home Care Aides assist elderly or disabled adults with daily living activities at the person's home or in a daytime non-residential facility. Psychiatric Technicians care for mentally impaired or emotionally disturbed individuals, following physician instructions and hospital procedures.
Educational Requirements In many cases, neither a high school diploma nor previous work experience is necessary for a job as a nursing, psychiatric, or home health aide. A few employers, however, require some training or experience. Some states require psychiatric aides to complete a formal training program.
Although neither a high school diploma nor previous work experience is necessary for a job as a nursing aide, a few employers, however, require some training or experience. Hospitals may require experience as a nursing aide or home health aide. Nursing homes often hire inexperienced workers who must complete a minimum of 75 hours of mandatory training and pass a competency evaluation program within four months of employment. Aides who complete the program are certified and placed on the State registry of nursing aides.
The Federal Government has enacted guidelines for home health aides whose employers receive reimbursement from Medicare. Federal law requires these home health aides to pass a competency test covering 12 areas: communication skills; documentation of patient status and care provided; reading and recording vital signs; basic infection control procedures; basic body functions; maintenance of a healthy environment; emergency procedures; physical, emotional, and developmental characteristics of patients; personal hygiene and grooming; safe transfer techniques; normal range of motion and positioning; and basic nutrition. A home health aide may take training before taking the competency test. Federal

7 D I R E C T C A R E W O R K E R S
104
law suggests at least 75 hours of classroom and practical training supervised by a registered nurse.
In Maine, state rules govern nursing aides’ qualifications and scope of practice.
Schools The institutions in the following table are some providers of Direct Care Worker training programs in Maine. It is important to note that Nursing Aides, Orderlies, and Attendants programs are often called CNA programs and are offered by numerous technical schools and adult education programs.
Institution
Nursing, Aides,
Orderlies, and
Attendants
Home Health Aides
Psych. Aides
Personal and
Home Care Aides
Psychiatric Technicians
Central Maine Community College X X CMMC School of Nursing X X X Kennebec Valley Community College X X X Southern New Hampshire University X X Assistance Plus X X X Auburn Adult Education X X X Caribou Adult Education X X X Helping Hands Trade School X X X Madawaska Adult Education X X X Maine Vocational Region Ten X X X Mid-Coast School of Technology X X MSAD #11 Adult Education X X X MSAD #52 Adult Education X X X Portland Adult Education X X X Southern Maine Community College X X Sumner Adult Education X X X United Technologies Center X X University of Maine at Augusta X X University of Maine at Machias X X

7 D I R E C T C A R E W O R K E R S
105
Statewide Employment Although all Direct Care Worker occupations are expected to experience more growth than the all occupations average, Home Health Aides are, by far, expected to experience the most rapid growth. Estimated and projected employment figures for Direct Care occupations are provided in the following table.
Occupation 2002
Estimated Employment
2012 Projected
Employment
Total 2002 – 2012 Employment Change
Annual Average
Percent Change
Nursing Aides, Orderlies, and Attendants
9,061 10,482 1,421 1.5
Home Health Aides
4,991 7,018 2,027 3.5
Psychiatric Aides
468 528 60 1.2
Personal & Home Care Aides
4,853 7,502 2,649 4.5
Psychiatric Technicians
309 350 41 1.3
The following table illustrates the annual growth and replacement needs for Direct Care Workers (by occupation) and the percentage of openings attributed to growth and replacement for both Direct Care Worker and all occupations as a whole.
Total Annual Average
Openings
Annual Average Openings Due
to Growth
Annual Average Openings Due to
Replacement
Nursing Aides, Orderlies, and
Attendants 261 142 (54.4%) 119 (45.6%)
Home Health Aides 268 203(75.7%) 65 (24.3%)
Psychiatric Aides 12 6 (50.0%) 6 (50.0%)
Personal and Home Care Aides 8 4 (50.0%) 4 (50.0%)
Psychiatric Technicians 343 265 (77.3%) 78 (22.7%)
All Occupations (%) 100% 33.70% 66.30%

7 D I R E C T C A R E W O R K E R S
106
The following table shows the industries in which the largest percentages of Direct Care workers are employed and are organized by occupation.
Direct Care Occupations: Employment By Industry
Industry
Nurses, Aides,
Orderlies, and
Attendants
Home Health Aides
Psychiatric Aides
Personal & Home
Care Aides
Psychiatric Technicians
Accommodation 0.4%
Administrative and Support Services 0.4% Ambulatory Healthcare Services 4.1% 13.7% 7.7% Hospitals 19.7% 1.2% 73.8% 0.3% 74.8% Nursing and Residential Care Facilities 66.5% 49.7% 28.6% Private Households 0.8% 0.6% 9.6% Social Assistance 53.4%
Maine Job Vacancies Vacancies have persisted for two Direct Care occupations—Nursing Aides, Orderlies, and Attendants and Personal and Home Care Aides. In 2002, there were an estimated 1,083 vacancies for Nursing Aides, Orderlies, and Attendants; in 2005, there were 1,038. Over this same time period, vacancies for Personal and Home Care Aides increased from 330 to 420. Complete vacancy data is provided in the following table.
Occupation 2002 Vacancies
2002 Job Vacancy
Rate
2005 Vacancies
2005 Job Vacancy
Rate
Change in
Vacancies
Change in Rate
Nursing Aides,
Orderlies, and Attendants
1,083 12.0% 1,038 11.7% -44 -0.4%
Personal and Home Care
Aides 330 7.5% 720 8.5% 90 +0.9%

7 D I R E C T C A R E W O R K E R S
107
Wages 2004 mean hourly and annual wages for Direct Care Workers in Maine and the nation are summarized in the table below.
Direct Care Workers: State and National Wages By Specialty
Average Wage State
HourlyNational Hourly
State Annual
National Annual
Percent of National
Nurses Aides, Orderlies, and Attendants $10.12 $10.53 $21,050 $21,890 96.10% Home Health Aides $9.44 $9.23 $19,635 $19,200 102.20% Psychiatric Aides $13.32 $11.43 $27,705 $23,770 116.50%
Personal and Home Care Aides $8.91 $8.52 $18,533 $17,722 104.60%
Spec
ialt
y
Psychiatric Technicians $11.23 $14.04 $23,358 $29,203 80.00%
National Employment The following table illustrates the net change, growth rate and expected employment for Direct Care occupations from 2002 to 2012.
2002 Estimated
Employment
2012 Projected
Employment
Total 2002 – 2012
Employment Change
Annual Average Percent Change
Nursing Aides, Orderlies, and Attendants
1,375,000 1,718,000 343,000 2.3
Home Health Aides 580,000 859,000 279,000 4.0 Psychiatric Aides 59,000 68,000 9,000 1.4 Personal and Home Care Aides 596,220 842,990 246,770 3.5 Psychiatric Technicians 59,880 63,420 3540 0.6

7 D I R E C T C A R E W O R K E R S
108
Outlook Numerous job openings for direct care workers will arise from a combination of rapid employment growth and high replacement needs. High replacement needs reflect modest entry requirements, low pay, few traditional employee benefits, high physical and emotional demands, and lack of opportunities for advancement. Overall employment of direct care workers is projected to grow faster than the average for all occupations through the year 2012, although individual occupational growth rates will vary. Employment of home health aides is expected to grow the fastest, as a result of both growing demand for home healthcare services from an aging population and efforts to contain healthcare costs by moving patients out of hospitals and nursing care facilities. Consumer preference for care in the home and improvements in medical technologies for in-home treatment also will contribute to faster-than-average employment growth for home health aides. Nursing aide employment will not grow as fast as home health aide employment, largely because nursing aides are concentrated in slower growing nursing care facilities. Nevertheless, employment of nursing aides is expected to grow faster than the average for all occupations in response to an increasing emphasis on rehabilitation and the long-term care needs of an increasing elderly population. Financial pressures on hospitals to discharge patients as soon as possible should produce more admissions to nursing care facilities. Medical advances and the aging population also will increase the employment of nursing aides as these factors increase the need for long-term care provided by aides. Employment of psychiatric aides—the smallest of the three occupations—is expected to grow about as fast as the average for all occupations. The number of jobs for psychiatric aides in hospitals, where half of those in the occupation work, will grow slower than the average due to a move away from inpatient psychiatric treatment. Employment in other settings will rise due to an aging population, demand for substance abuse treatment, and overall higher utilization of mental health services. Employment of personal and home care aides is projected to grow much faster than average as the number of elderly people, an age group characterized by mounting health problems and requiring some assistance with daily activities, is projected to rise substantially. In addition to the elderly, other patients, such as the mentally disabled, will increasingly rely on home care. This trend reflects several developments, including efforts to contain costs, the realization that treatment can be more effective in familiar rather than clinical surroundings, and the development and improvement of medical technologies for in-home treatment. From 2002-2012, direct care occupations are expected to be among the fastest growing jobs in the state. Such growth is largely the result of Maine’s aging population; however, supply issues may result in a shortage that could compromise the quality of care patients receive.

7 D I R E C T C A R E W O R K E R S
109
Of particular important is that other fastest growing occupations (e.g. cashiers, food preparers, waitpersons, and retail salespeople) will also be competing for the same workers as direct care occupations.10 This is important as most home health agencies are locally owned small businesses unable to offer guaranteed hours, health insurance, or paid time off. As a result, many potential (or active) direct care workers pursue other employment opportunities. The recruitment and retainment of direct care workers will be a significant challenge as compensation remains low. Currently, “there are 25,164 inactive CNAs who have had CNA training but have not been in the workforce for the past two years.”22 An adequate supply of these professionals exists; however, the incentive to work in this occupation does not. This workforce imbalance is currently being explored through LD 1934, which “requires the Department of Health and Human Services to study options for, and cost of, increasing wages and providing health coverage for direct care workers in state-funded and MaineCare-funded long-term care programs.”


111
Therapists and Related Professionals Therapists in a variety of specialties, as well as related assistants and aides, are presented in the following section.
Occupational Therapists 113 Occupational Therapist Assistants 117 Occupational Therapist Aides 121 Physical Therapists 123 Physical Therapist Assistants 127 Physical Therapist Aides 131 Radiation Therapists 133 Recreational Therapists 135 Respiratory Care Therapists and Technicians 139 Massage Therapists 143
Chapter
8


8 T H E R A P I S T S A N D R E L A T E D
113
Occupational Therapists General demographic trends are likely to spur the demand for therapeutic services, including that of Occupational Therapy.
Occupational Description Occupational Therapists assess, plan, organize, and participate in rehabilitative programs that help restore vocational, homemaking, and daily living skills, as well as general independence, to disabled persons.
Characteristic Data Occupational Therapists are governed by the Board of Occupation Therapy Practice and must renew their licenses biennially on March 31st of odd years and December 31st of even years. A survey to collect characteristics data for the profession will accompany the relicensure process and data from this survey may be available in the next edition of this report.
Educational Requirements A bachelor's degree in occupational therapy is the minimum requirement for entry into this field. All states, Puerto Rico, and the District of Columbia regulate occupational therapy. To obtain a license, applicants must graduate from an accredited educational program, and pass a national certification examination.
Schools The schools in the following table offer Occupational Therapy programs in Maine.
Provider City University of New England Biddeford University of Southern Maine Portland
The following table represents the completers of the Occupational Therapy program in Maine during the 2003-2004 academic year.
Occupational Therapy Program Completers: 2003-2004 Institution Award Level Completers
UNE Master’s Degree 27 USM Master’s Degree 10

8 T H E R A P I S T S A N D R E L A T E D
114
Statewide Employment There were 561 Occupational Therapists employed in Maine in 2002, and this occupation is expected to experience more growth (2.4% annually) that that of the all occupations average (1.0%). The following table lists relevant employment and projection data.
2002 Estimated Employment
2012 Projected Employment
Total 2002 – 2012 Employment Change
Annual Average Percent Change
561 709 148 2.4 In addition to growth, eight annual openings for Occupational Therapists are projected and attributed to replacement needs. The following table illustrates annual growth and replacement needs for Occupational Therapists and the percentage of openings attributed to growth and replacement for both Occupational Therapists and all occupations.
Total Annual
Average Openings
Annual Average Openings Due to
Growth
Annual Average Openings Due to
Replacement Occupational Therapist
(Total) 23 15 8
Occupational Therapist (%)
100% 65.2% 34.8%
All Occupations (%)
100% 33.7% 66.3%
Maine Job Vacancies For Occupational Therapists, the number of job vacancies in 2005 was slightly lower than the number of job vacancies in 2002 and the job vacancy rate experienced a 1.0% decline. The findings are summarized in the table below.
2002 Vacancies
2002 Job Vacancy
Rate
2005 Vacancies
2005 Job Vacancy
Rate
Change in Vacancies
Change in Job Vacancy
Rate 16 3.2% 13 2.2% -3 -1.0%

8 T H E R A P I S T S A N D R E L A T E D
115
Wages Annual and hourly wage data for entry-level and experienced Occupational Therapists, as well average state and national wages, are supplied in the following table.
Maine Maine National Entry Experienced Mean Mean
% of National
Hourly $19.15 $27.83 $24.93 $27.70 Annual $39,830 $57,880 $51,854 $57,610
90.0%
National Employment In 2002, there were an estimated 82,000 Occupational Therapists employed in the United States. In 2012, it is projected that there will be 110,000; this represents an annual average growth rate of 3.0 percent, faster than the 1.4 percent growth rate for all occupations in the United States. The following table illustrates the net change, growth rate and expected employment for this occupation in 2012.
2002 Estimated Employment
2012 Projected Employment
Total 2002 – 2012 Employment Change
Annual Average Percent Change
82,000 110,000 28,000 3.0
Outlook Employment of occupational therapists is expected to increase faster than the average for all occupations through 2012. The impact of proposed federal legislation imposing limits on reimbursement for therapy services may adversely affect the job market for occupational therapists in the near term. However, over the long run, the demand for occupational therapists should continue to rise as a result of growth in the number of individuals with disabilities or limited function. The baby-boom generation’s movement into middle age and an increased number of elderly residents will spur the demand for therapeutic services. Hospitals will continue to employ a large number of occupational therapists to provide therapy services to acutely ill inpatients. Hospitals also will need occupational therapists to staff their outpatient rehabilitation programs. Occupational therapists will also be needed in school-based setting to help children with disabilities prepare for and participate in special education programs.


8 T H E R A P I S T S A N D R E L A T E D
117
Occupational Therapist Assistants Occupational Therapists delegate hands-on therapy work to Occupational Therapist Assistants, who, in turn, help clients with rehabilitative activities and exercises outlined in a treatment plan.
Occupational Description Occupational Therapist Assistants help occupational therapists in providing occupational therapy treatments and procedures. May, in accordance with state laws, assist in development of treatment plans, carry out routine functions, direct activity programs, and document the progress of treatments.
Characteristics Occupational Therapist Assistants are governed by the Board of Occupation Therapy Practice and must renew their licenses biennially on March 31 of odd years and December 31 of even years. A survey to collect characteristic data about these professionals will accompany the relicensure process.
Educational Requirements
Occupational Therapist Assistants must complete an associate's degree or certificate program from an accredited community college or technical school. Occupational therapist assistants are regulated in most states.
Schools Only one school in Maine offers an Occupational Therapist Assistant program.
Provider City Credential CompletersKennebec Valley Community College Fairfield Associate’s Degree 9

8 T H E R A P I S T S A N D R E L A T E D
118
Statewide Employment There were 93 Occupational Therapists Assistants employed in Maine in 2002, and this occupation is expected to experience more growth (2.7% annually) than that of the all occupations average (1.0%). The following table lists relevant employment and projection data.
2002 Estimated Employment
2012 Projected Employment
Total 2002 – 2012 Employment Change
Annual Average Percent Change
93 121 28 2.7 An additional one annual opening for Occupational Therapist Assistants is projected and attributed to replacement needs. The following table illustrates annual growth and replacement needs for this occupation.
Total Annual
Average Openings
Annual Average Openings Due to
Growth
Annual Average Openings Due to
Replacement Occupational Therapist
Assistants (Total) 4 3 1
Occupational Therapist Assistants (%)
100% 75.0% 25.0%
All Occupations (%)
100% 33.7% 66.3%
The top six industries that employ the most Occupational Therapist Assistants are hospitals (36.7% of all Occupational Therapist Assistants), nursing and residential care facilities (21.1%), administrative and support services, ambulatory health care services, public administration, and social assistance; percentages for these last four industries are unavailable.
Wages Annual and hourly wage data for entry-level and experienced Occupational Therapist Assistants, as well average state and national wages, are supplied in the following table.
Maine Maine National Entry Experienced Mean Mean
% of National
Hourly $14.47 $19.24 $17.65 $18.53 Annual $30,100 $40,010 $36,712 $38,550
95.3%

8 T H E R A P I S T S A N D R E L A T E D
119
National Employment In 2002, there were an estimated 18,000 Occupational Therapist Assistants employed in the United States. In 2012, it is projected that there will be 26,000; this represents an annual average growth rate of 3.7 percent, much faster than the 1.4 percent growth rate for all occupations in the United States. The following table illustrates the net change, growth rate and expected employment for this occupation in 2012.
2002 Estimated Employment
2012 Projected Employment
Total 2002 – 2012 Employment Change
Annual Average Percent Change
18,000 26,000 8,000 3.7
Outlook Employment of occupational therapist assistants is expected to grow much faster than the average for all occupations through 2012. The impact of proposed federal legislation imposing limits on reimbursement for therapy services may adversely affect the job market for occupational therapist assistants and aides in the near term. However, over the long run, demand for occupational therapist assistants and aides will continue to rise, due to growth in the number of individuals with disabilities or limited function. Job growth will result from an aging population, including the baby-boom generation, which will need more occupational therapy services. Increasing demand also will result from advances in medicine that allow more people with critical problems to survive and then need rehabilitative therapy. Third-party payers are expected to encourage occupational therapists to delegate more hands-on therapy work to occupational therapist assistants and aides.


8 T H E R A P I S T S A N D R E L A T E D
121
Occupational Therapist Aides Occupational Therapist Aides are typically responsible for a range of clerical tasks, as well the preparation of materials and equipment used during treatment. Because Aides are not licensed, the law does not allow them to perform many of the same tasks as Assistants.
Occupational Description Under close supervision of an occupational therapist or occupational therapy assistant, perform only delegated, selected, or routine tasks in specific situations. These duties include preparing patient and treatment room.
Educational Requirements Occupational Therapist Aides typically receive most of their training on the job.
Statewide Employment There were 72 Occupational Therapist Aides employed in Maine in 2002, and this occupation is expected to experience more growth (3.6% annually) than that of the all occupations average (1.0%). The following table lists relevant employment and growth data.
2002 Estimated Employment
2012 Projected Employment
Total 2002 – 2012 Employment Change
Annual Average Percent Change
72 103 31 3.6 Replacement needs must also be considered. An additional one annual opening for Occupational Therapist Aides is projected and attributed to replacement needs. The following table provides annual growth and replacement needs for this occupation.
Total Annual
Average Openings
Annual Average Openings Due to
Growth
Annual Average Openings Due to
Replacement OT Aides Total) 4 (100%) 3 (75%) 1 (25%)
All Occupations %) 100% 33.7% 66.3%
The top four industries that employ the most Occupational Therapist Aides are hospitals (15.7% of all Occupational Therapist Aides), and ambulatory health care services, nursing and residential care facilities, and social assistance; percentages for these last three industries are unavailable.

8 T H E R A P I S T S A N D R E L A T E D
122
Wages Annual and hourly wage data for entry-level and experienced Occupational Therapist Aides, as well average state and national wages, are supplied in the following table.
Maine Maine National Entry Experienced Mean Mean
% of National
Hourly $9.93 $11.86 $11.22 $12.77 Annual $20,650 $24,670 $23,338 $26,570
87.9%
National Employment Occupational Therapist Aides are expected to experience an annual average growth rate of 4.1 percent, significantly faster than the 1.4 percent growth rate for all occupations in the United States. The following table illustrates the net change, growth rate and expected employment for this occupation in 2012.
2002 Estimated Employment
2012 Projected Employment
Total 2002 – 2012 Employment Change
Annual Average Percent Change
8,000 12,000 4,000 4.1
Outlook Employment of occupational therapist aides is expected to grow much faster than the average for all occupations through 2012. The impact of proposed federal legislation imposing limits on reimbursement for therapy services may adversely affect the job market for occupational therapist aides in the near term. However, over the long run, demand for occupational therapist aides will continue to rise as a result of an aging population which will need more occupational therapy services. Third-party payers, concerned with rising healthcare costs, are expected to encourage occupational therapists to delegate more hands-on therapy work to occupational therapist assistants and aides.

8 T H E R A P I S T S A N D R E L A T E D
123
Physical Therapists Employment of Physical Therapists is expected to increase faster than the all-occupations average, as growth in the number of individuals with disabilities or limited function spurs demand for therapy services.
Occupational Description Physical Therapists select and apply techniques and treatments that help relieve pain, increase strength, and decrease or prevent crippling for patients in a hospital or other health care facility. They work to keep people well and safe from injury, emphasizing the importance of fitness and conditioning and showing people how to avoid injuries at work or play.
Characteristics Physical Therapists are governed by the Board of Examiners in Physical Therapy, and this license renews biennially on March 31 of even years. A survey has accompanied the relicensure process and data from this survey will likely be available in the next edition of this report.
Educational Requirements All states require physical therapists to pass a licensure exam before they can practice, after graduating from an accredited physical therapist educational program.
Schools The schools in the following table are providers of Physical Therapy programs in Maine.
Provider City Husson College Bangor University of New England Biddeford
The following table represents the completers of the Physical Therapy program in Maine during the 2003-2004 academic year.
Physical Therapy Program Completers: 2003-2004 Institution Award Level Completers
Husson Master’s Degree 16 UNE Master’s Degree 34
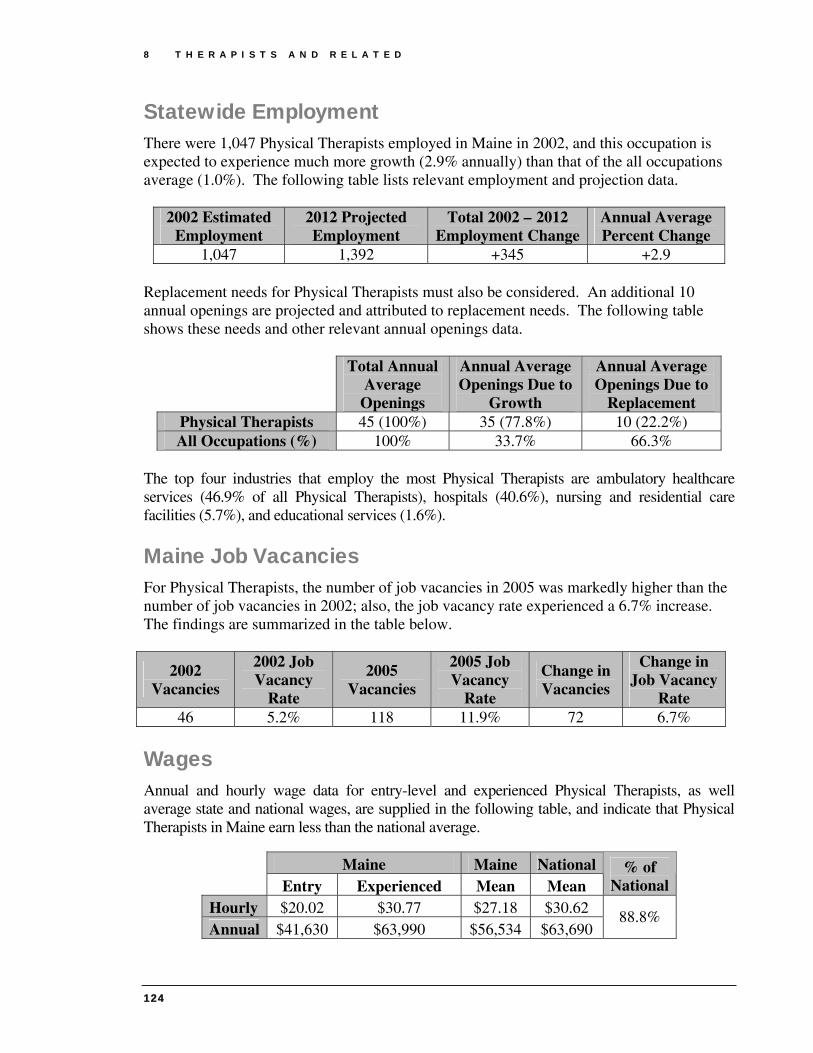
8 T H E R A P I S T S A N D R E L A T E D
124
Statewide Employment There were 1,047 Physical Therapists employed in Maine in 2002, and this occupation is expected to experience much more growth (2.9% annually) than that of the all occupations average (1.0%). The following table lists relevant employment and projection data.
2002 Estimated Employment
2012 Projected Employment
Total 2002 – 2012 Employment Change
Annual Average Percent Change
1,047 1,392 +345 +2.9 Replacement needs for Physical Therapists must also be considered. An additional 10 annual openings are projected and attributed to replacement needs. The following table shows these needs and other relevant annual openings data.
Total Annual
Average Openings
Annual Average Openings Due to
Growth
Annual Average Openings Due to
Replacement Physical Therapists 45 (100%) 35 (77.8%) 10 (22.2%) All Occupations (%) 100% 33.7% 66.3%
The top four industries that employ the most Physical Therapists are ambulatory healthcare services (46.9% of all Physical Therapists), hospitals (40.6%), nursing and residential care facilities (5.7%), and educational services (1.6%).
Maine Job Vacancies For Physical Therapists, the number of job vacancies in 2005 was markedly higher than the number of job vacancies in 2002; also, the job vacancy rate experienced a 6.7% increase. The findings are summarized in the table below.
2002 Vacancies
2002 Job Vacancy
Rate
2005 Vacancies
2005 Job Vacancy
Rate
Change in Vacancies
Change in Job Vacancy
Rate 46 5.2% 118 11.9% 72 6.7%
Wages Annual and hourly wage data for entry-level and experienced Physical Therapists, as well average state and national wages, are supplied in the following table, and indicate that Physical Therapists in Maine earn less than the national average.
Maine Maine National Entry Experienced Mean Mean
% of National
Hourly $20.02 $30.77 $27.18 $30.62 Annual $41,630 $63,990 $56,534 $63,690
88.8%

8 T H E R A P I S T S A N D R E L A T E D
125
National Employment In 2002, there were an estimated 137,000 Physical Therapists employed in the United States. In 2012, it is projected that there will be 185,000; this represents an annual average growth rate of 3.0 percent, more than double the 1.4 percent growth rate for all occupations in the United States. The following table illustrates the net change, growth rate and expected employment for this occupation in 2012.
2002 Estimated Employment
2012 Projected Employment
Total 2002 – 2012 Employment Change
Annual Average Percent Change
137,000 185,000 48,000 3.0
Outlook Employment of physical therapists is expected to grow at twice the rate for all occupations through 2012. The impact of proposed federal legislation imposing limits on reimbursement for therapy services may adversely affect the short-term job outlook for physical therapists. However, over the long run, the demand for physical therapists should continue to rise as growth in the number of individuals with disabilities or limited function spurs demand for therapy services. Future medical developments also should permit a higher percentage of trauma victims to survive, creating additional demand for rehabilitative care. In addition, growth may result from advances in medical technology that could permit the treatment of more disabling conditions. Widespread interest in health promotion also should increase demand for physical therapy services. A growing number of employers are using physical therapists to evaluate worksites, develop exercise programs, and teach safe work habits to employees in the hope of reducing injuries.


8 T H E R A P I S T S A N D R E L A T E D
127
Physical Therapist Assistants Under the direction and supervision of Physical Therapists, Physical Therapist Assistants perform treatment procedures such as exercises, massages, electrical stimulation, paraffin baths, hot and cold packs, traction, and ultrasound.
Occupational Description Physical Therapist Assistants help physical therapists in providing physical therapy treatments and procedures. They may assist in the development of treatment plans, carry out routine functions, document the progress of treatment, and modify specific treatments in accordance with patient status and within the scope of treatment plans established by a physical therapist.
Characteristic Data Physical Therapist Assistants are governed by the Board of Examiners in Physical Therapy, and this license renews biennially on March 31 of even years. A survey to collect characteristic data about this profession has accompanied the relicensure process and data from this survey will likely be available in the next edition of this report.
Educational Requirements
Physical therapist assistants typically earn an associate's degree from an accredited physical therapist assistant program. Licensure or registration is not required in all states for the physical therapist assistants. Accredited physical therapist assistant programs are designed to last two years, or four semesters, and culminate in an associate's degree.
Schools Only one school in Maine offers a Physical Therapist Assistant program.
Provider City Credential Completers Kennebec Valley Community College Fairfield Associate’s Degree 3

8 T H E R A P I S T S A N D R E L A T E D
128
Statewide Employment There were 317 Physical Therapist Assistants employed in Maine in 2002, and this occupation is expected to experience much more growth (4.2% annually) than that of the all occupations average (1.0%). The following table lists relevant employment and projection data.
2002 Estimated Employment
2012 Projected Employment
Total 2002 – 2012 Employment Change
Annual Average Percent Change
317 480 163 4.2 Replacement needs, in addition to growth, must also be considered for this occupation. An additional five annual openings for Physical Therapist Assistants are projected and attributed to replacement needs. The following table shows these needs and other relevant annual openings data.
Total Annual
Average Openings
Annual Average Openings Due to
Growth
Annual Average Openings Due to
Replacement Physical Therapist Assistant (Total)
21 16 5
Physical Therapist Assistant (%)
100% 76.2% 23.8%
All Occupations (%)
100% 33.7% 66.3%
The top three industries that employ Physical Therapist Assistants are ambulatory health care services (with 64.6% of all Physical Therapist Assistants), hospitals (21.8%), and nursing and residential care facilities (4.4%).
Wages Annual and hourly wage data for entry-level and experienced Physical Therapist Assistants, as well average state and national wages, are supplied in the following table.
Maine Maine National Entry Experienced Mean Mean
% of National
Hourly $14.63 $19.53 $17.90 $18.29 Annual $30,430 $40,620 $37,232 $38,050
97.7%

8 T H E R A P I S T S A N D R E L A T E D
129
National Employment In 2002, there were an estimated 50,000 Physical Therapist Assistants employed in the United States. In 2012, it is projected that there will be 73,000; this represents an annual average growth rate of 3.9 percent, much faster than the 1.4 percent growth rate for all occupations in the United States. The following table illustrates the net change, growth rate and expected employment for this occupation in 2012.
2002 Estimated Employment
2012 Projected Employment
Total 2002 – 2012 Employment Change
Annual Average Percent Change
50,000 73,000 +23,000 +3.9
Outlook Employment of physical therapist assistants and aides is expected to grow much faster than the average through the year 2012. The impact of proposed federal legislation imposing limits on reimbursement for therapy services may adversely affect the short-term job outlook for physical therapist assistants and aides. However, over the long run, demand for physical therapist assistants and aides will continue to rise, in accordance with growth in the number of individuals with disabilities or limited function. The growing elderly population is particularly vulnerable to chronic and debilitating conditions that require therapeutic services. These patients often need additional assistance in their treatment, making the roles of assistants and aides vital. The large baby-boom generation is entering the prime age for heart attacks and strokes, further increasing the demand for cardiac and physical rehabilitation. In addition, future medical developments should permit an increased percentage of trauma victims to survive, creating added demand for therapy services. Physical therapists are expected to increasingly utilize assistants to reduce the cost of physical therapy services. Once a patient is evaluated and a treatment plan is designed by the physical therapist, the physical therapist assistant can provide many aspects of treatment, as prescribed by the therapist.


8 T H E R A P I S T S A N D R E L A T E D
131
Physical Therapist Aides Physical Therapist Aides help make therapy sessions productive, under the direct supervision of a Physical Therapist or Physical Therapist Assistant.
Occupational Description Under close supervision of a physical therapist or physical therapy assistant, Physical Therapist Aides perform only delegated, selected, or routine tasks in specific situations. These duties include preparing the patient and the treatment area.
Educational Requirements Physical Therapist Aides generally learn skills on the job, but employers typically require a high school diploma.
Statewide Employment There were 135 Physical Therapist Aides employed in Maine in 2002, and this occupation is expected to experience much more rapid growth (3.4% annually) that that of the all occupations average (1.0%). The following table lists relevant employment and projection data.
2002 Estimated Employment
2012 Projected Employment
Total 2002 – 2012 Employment Change
Annual Average Percent Change
135 189 54 3.4 The above 10-year employment change reflects the growth that this occupation is expected to experience, but replacement needs must also be considered. An additional 2 annual openings for Physical Therapist Aides are projected and attributed to replacement needs. The following table illustrates annual growth and replacement needs for Physical Therapist Aides and the percentage of openings attributed to growth and replacement for both Physical Therapist Aides and all occupations.
Total Annual
Average Openings
Annual Average Openings Due to
Growth
Annual Average Openings Due to
Replacement Physical Therapist Aides 7 (100%) 5 (71.4%) 2 (28.6%)
All Occupations (%) 100% 33.7% 66.3%

8 T H E R A P I S T S A N D R E L A T E D
132
The top three industries that employ the most Physical Therapist Aides are hospitals (with 42.5% of all Physical Therapist Aides), ambulatory health care services (35.1%), and nursing and residential care facilities (14.9%).
Wages Annual and hourly wage data for entry-level and experienced Physical Therapist Aides, as well average state and national wages, are supplied in the following table.
Maine Maine National Entry Experienced Mean Mean
% of National
Hourly $9.08 $12.40 $11.05 $11.19 Annual $18,880 $25,050 $22,984 $23,270
98.7%
National Employment In 2002, there were an estimated 37,000 Physical Therapist Aides employed in the United States. In 2012, it is projected that there will be 54,000; this represents an annual average growth rate of 3.9 percent, slightly faster than the 1.4 percent growth rate for all occupations in the United States. The following table illustrates the net change, growth rate and expected employment for this occupation in 2012.
2002 Estimated Employment
2012 Projected Employment
Total 2002 – 2012 Employment Change
Annual Average Percent Change
37,000 54,000 17,000 3.9
Outlook Employment of physical therapist assistants and aides is expected to grow much faster than the average through the year 2012. The impact of proposed Federal legislation imposing limits on reimbursement for therapy services may adversely affect the short-term job outlook for physical therapist assistants and aides. However, over the long run, demand for physical therapist assistants and aides will continue to rise, in accordance with growth in the number of individuals with disabilities or limited function. The growing elderly population is particularly vulnerable to chronic and debilitating conditions that require therapeutic services. These patients often need additional assistance in their treatment, making the roles of assistants and aides vital. The large baby-boom generation is entering the prime age for heart attacks and strokes, further increasing the demand for cardiac and physical rehabilitation. In addition, future medical developments should permit an increased percentage of trauma victims to survive, creating added demand for therapy services. Physical therapists are expected to increasingly utilize assistants to reduce the cost of physical therapy services. Once a patient is evaluated and a treatment plan is designed by the physical therapist, the physical therapist assistant can provide many aspects of treatment, as prescribed by the therapist.

8 T H E R A P I S T S A N D R E L A T E D
133
Radiation Therapists
Occupational Description
Radiation Therapists provide radiation therapy to patients as prescribed by a radiologist according to established practices and standards. Duties may include reviewing prescription and diagnosis; acting as liaison with physician and supportive care personnel; preparing equipment, such as immobilization, treatment, and protection devices; and maintaining records, reports, and files.
Characteristic Data Radiation Therapists are governed by the Board of Examiners of Radiologic Technology and this board renews licenses biennially on August 31st of even years. A survey to collect characteristic data about the profession accompanied the relicensure process and data from this survey will likely be available in the next edition of this report.
Educational Requirements A two-year degree is the most common level of education for Radiation Therapists.
Schools The only provider of a Radiation Therapy program in the state is Southern Maine Community College; completer data for this program is unavailable at this time.
Statewide Employment There were 58 Radiation Therapists employed in Maine in 2002, and this occupation is expected to experience more growth (2.7% annually) than that of the all occupations average (1.0%). The following table lists relevant employment and projection data.
2002 Estimated Employment
2012 Projected Employment
Total 2002 – 2012 Employment Change
Annual Average Percent Change
58 76 18 2.7 Replacement needs, in addition to growth, must also be considered for this occupation. The table on the following page illustrates annual growth and replacement needs for Radiation Therapists.

8 T H E R A P I S T S A N D R E L A T E D
134
Total Annual
Average Openings
Annual Average Openings Due to
Growth
Annual Average Openings Due to
Replacement Radiation Therapist (Total) 3 2 1
Radiation Therapist (%) 100% 66.7% 33.3% All Occupations (%) 100% 33.7% 66.3%
Wages Annual and hourly wage data for entry-level and experienced Radiation Therapists, as well average state and national wages, are supplied in the following table and indicate that Radiation Therapists in Maine are earning less than that of the national average.
Maine Maine National Entry Experienced Mean Mean
% of National
Hourly $19.81 $28.12 $25.35 $30.18 Annual $41,205 $58,490 $52,728 $62,774
84.0%
National Employment Radiation Therapists are expected to experience annual growth of 2.5 percent, faster than the 1.4 percent growth rate for all occupations in the United States. The following table illustrates the net change, growth rate and expected employment for this occupation in 2012.
2002 Estimated Employment
2012 Projected Employment
Total 2002 – 2012 Employment Change
Annual Average Percent Change
14,000 18,000 4,000 2.5
Outlook Applicants who are certified and who possess a bachelor’s or an associate degree or a certificate in radiation therapy should have good job prospects. As the U.S. population grows and ages, demand will increase for radiation treatment. As radiation technology advances, radiation treatment will be prescribed for an increasing proportion of cancer patients. In addition to new jobs created over the projection period, a number of job openings will result as experienced radiation therapists retire or leave the occupation for other reasons.

8 T H E R A P I S T S A N D R E L A T E D
135
Recreational Therapists Recreational Therapists use a variety of techniques, including arts and crafts, animals, sports, games, dance and movement, drama, music, and community outings, to maintain the physical, mental, and emotional well-being of their clients.
Occupational Description Recreational Therapists plan, direct, or coordinate medically-approved recreation programs for patients in hospitals, nursing homes, or other institutions. Activities include sports, trips, dramatics, social activities, and arts and crafts. They may assess a patient’s condition and recommend appropriate recreational activity.
Educational Requirements
A bachelor's degree in therapeutic recreation, or in recreation with a concentration in therapeutic recreation, is the usual requirement for entry-level positions. Persons may qualify for paraprofessional positions with an associate degree in therapeutic recreation or a health care related field. An associate degree in recreational therapy; training in art, drama, or music therapy; or qualifying work experience may be sufficient for activity director positions in nursing homes.
Schools Only one school in Maine offers a Recreational Therapy program.
Provider City Credential Completers University of Southern Maine Portland Associate’s Degree 1 University of Southern Maine Portland Bachelor’s Degree 8
Statewide Employment There were 185 Recreational Therapists employed in Maine in 2002, and this occupation is expected to experience slightly less growth (0.9% annually) than that of the all occupations average (1.0%). The following table lists relevant employment and projection data. 2002 Estimated
Employment 2012 Projected Employment
Total 2002 – 2012 Employment Change
Annual Average Percent Change
185 202 +17 +0.9

8 T H E R A P I S T S A N D R E L A T E D
136
Replacement needs, in addition to growth, must also be considered for this occupation. The following table illustrates annual growth and replacement needs for Recreational Therapists.
Total Annual Average
Openings
Annual Average
Openings Due to Growth
Annual Average Openings Due to
Replacement
Recreational Therapists (Total) 6 2 4 Recreational Therapists (%) 100% 33.3% 66.7%
All Occupations (%) 100% 33.7% 66.3%
The top two industries that employ Recreational Therapists in Maine are nursing and residential care (with 55.2% of all Recreational Therapists) and hospitals (28.4%).
Wages Annual and hourly wage data for entry-level and experienced Recreational Therapists, as well average state and national wages, are supplied in the following table.
Maine Maine National Entry Experienced Mean Mean
% of National
Hourly $11.75 $17.17 $15.37 $16.72 Annual $24,450 $31,550 $31,970 $34,780
91.9%
National Employment In 2002, there were an estimated 27,000 Recreational Therapists employed in the United States, and this occupation is expected to experience significantly slower growth than that of the all occupations average (1.4). The following table illustrates the net change, growth rate and expected employment for this occupation in 2012.
2002 Estimated Employment
2012 Projected Employment
Total 2002 – 2012 Employment Change
Annual Average Percent Change
27,000 29,000 2,000 0.7
Outlook Overall employment of recreational therapists is expected to grow more slowly than the average for all occupations through the year 2012. In nursing care facilities—the largest industry employing recreational therapists—employment will grow slightly faster than the occupation as a whole, as the number of older adults continues to grow. Employment is expected to decline, however, in hospitals as services shift to outpatient settings and employers emphasize cost containment. Fast employment growth is expected in the residential and outpatient settings that serve disabled persons, the elderly, or those

8 T H E R A P I S T S A N D R E L A T E D
137
diagnosed with mental retardation, mental illness, or substance abuse problems—for example, community care facilities for the elderly (which includes assisted-living facilities); residential mental retardation, mental health, and substance abuse facilities; and individual and family services (which includes daycare centers for disabled persons and the elderly). Opportunities should be best for persons with a bachelor’s degree in therapeutic recreation or in recreation with an option in therapeutic recreation. Health services facilities will support a growing number of jobs in adult daycare and outpatient programs offering short-term mental health and alcohol or drug abuse services. Rehabilitation, home healthcare, and transitional programs will provide additional jobs. The rapidly growing number of older adults is expected to spur job growth for recreational therapy professionals and paraprofessionals in assisted-living facilities, adult daycare programs, and other social assistance agencies. Continued growth also is expected in community residential care facilities, as well as daycare programs for individuals with disabilities.


8 T H E R A P I S T S A N D R E L A T E D
139
Respiratory Care Therapists and Technicians Employment opportunities for Respiratory Therapists and Technicians should be favorable as the population ages. However, changing educational and licensing requirements may have a dramatic impact as this field shifts toward Respiratory Care Therapists (rather than Technicians).23
Occupational Description Respiratory Care Therapists assess, treat, and care for patients with breathing disorders, and assume primary responsibility for all respiratory care modalities, including the supervision of respiratory therapy technicians. They initiate and conduct therapeutic procedures; maintain patient records; and select, assemble, check, and operate equipment. Respiratory Care Technicians provide specific, well defined respiratory care procedures under the direction of respiratory therapists and physicians.
Characteristic Data Respiratory Care Therapists and Technicians are governed by the Board of Respiratory Care Practitioners. This board relicenses these professionals April 30th every two years (even numbered years only). This year (2006), a survey accompanied the relicensure process to obtain demographic data about the current workforce.
Educational Requirements
With evolving responsibilities, formal training has become necessary for entry to this field. Training programs vary in length and in the credential or degree awarded. Some programs award associate's or bachelor's degrees and prepare graduates for jobs as registered respiratory therapists (RRTs). Other, shorter programs award certificates and lead to jobs as entry-level certified respiratory therapists (CRTs), although this is becoming less common.

8 T H E R A P I S T S A N D R E L A T E D
140
Schools The schools in the following table are providers of Respiratory Therapy programs in Maine.23, 24 Also included are the number of program completers for the 2003-2004 academic year.
Provider City Credential Completers Kennebec Valley Community College Fairfield Associate’s Degree 11 Southern Maine Community College Portland Associate’s Degree 14
Statewide Employment Both Respiratory Care Therapists and Respiratory Therapy Technicians are expected to experience more growth (3.5% annually) than that of the all occupations average (1.0%). The following table lists relevant employment and projection data.
2002 Estimated
Employment
2012 Projected
Employment
Total 2002 – 2012 Employment
Change
Annual Percent Change
Therapists 421 591 170 3.5 Technicians 56 79 23 3.5
Replacement needs must also be considered for this occupation.. The following table illustrates annual growth and replacement needs for Respiratory Care Therapists and Technicians.
Total Annual Average
Openings
Annual Average
Openings Due to Growth
Annual Average
Openings Due to Replacement
Respiratory Therapists(Total)
31 (100%) 17 (54.8%) 14 (45.2%)
Respiratory Therapist Technician (Total)
3 (100%) 2 (66.7%) 1 (33.3%)
All Occupations (%) 100% 33.7% 66.3% The vast majority of Respiratory Therapists and Therapist Technicians are employed by hospitals (with 93.4% of all Respiratory Therapists), and a small number work in ambulatory healthcare services.
Wages Annual and hourly wage data for entry-level and experienced Respiratory Therapists and Technicians, as well average state and national wages, are supplied in the following table.

8 T H E R A P I S T S A N D R E L A T E D
141
Maine Maine National Entry Experienced Mean Mean
% of National
Hourly $18.09 $23.05 $21.40 $21.79
The
rapi
sts
Annual $37,627 $47,944 $44,512 $45,310
98.2%
Hourly $17.15 $20.33 $19.27 $18.19
Tec
hnic
ians
Annual $35,672 $42,286 $40,081 $37,840
105.9%
Respiratory Therapy Technicians is one of the few healthcare occupations in which Maine salaries are higher than the national average.
National Employment Respiratory Care Therapists and Technicians are both expected to experience an annual average growth rate of 3.0 percent, which is much faster than the 1.4 percent growth rate for all occupations in the United States. The following table illustrates the net change, growth rate and expected employment for these occupations in 2012.
2002 Estimated
Employment
2012 Projected
Employment
Total 2002 – 2012
Employment Change
Annual Average Percent Change
Therapists 86,000 116,000 30,000 3.0
Technicians 26,000 35,000 9,000 3.0
Outlook Job opportunities are expected to be very good, especially for respiratory therapists with cardiopulmonary care skills or experience working with infants. Employment of respiratory therapists is expected to increase faster than average for all occupations through the year 2014, because of substantial growth in the numbers of the middle-aged and elderly population. In addition, respiratory therapists are expanding their role in the early detection of pulmonary disorders, case management, disease prevention, and emergency care. Advances in inhalable medications and in the treatment of lung transplant patients, heart attack and accident victims, and premature infants (many of whom are dependent on a ventilator during part of their treatment) will increase the demand for the services of respiratory care practitioners.

8 T H E R A P I S T S A N D R E L A T E D
142
Although hospitals will continue to employ the vast majority of therapists, a growing number can expect to work outside of hospitals in home health care services, offices of physicians or other health practitioners, or consumer-goods rental firms.

8 T H E R A P I S T S A N D R E L A T E D
143
Massage Therapists
Occupational Description Massage Therapists massage customers for hygienic or remedial purposes.
Educational Requirements The most significant sources of training for Massage Therapists are postsecondary vocational awards. Massage Therapists in Maine must be licensed.
Schools The schools in the following table are some providers of Massage Therapy programs in Maine.
Provider City Credential CompletersPierre’s School of Cosmetology Many Locations Degree/Certificate 36
Seacoast Career Schools Sanford Degree/Certificate 13 Spa Tech Institute-Westbrook Westbrook Degree/Certificate 37
Statewide Employment There were 403 Massage Therapists employed in Maine in 2002, and this occupation is expected to experience much more rapid growth (4.0% annually) than that of the all occupations average (1.0%). The following table lists relevant employment and projection data.
2002 Estimated Employment
2012 Projected Employment
Total 2002 – 2012 Employment Change
Annual Average Percent Change
403 596 193 4.0 Replacement needs must also be considered. The following table illustrates annual growth and replacement needs for Massage Therapists
Total Annual
Average Openings
Annual Average Openings Due
to Growth
Annual Average Openings Due to
Replacement Massage Therapists 27 (100%) 19 (70.4%) 8 (29.6%) All Occupations (%) 100% 33.7% 66.3%
The top two industries that employ the most Massage Therapists in Maine are ambulatory health care services (with 74.5% of all Massage Therapists), and hospitals (2.0%).

8 T H E R A P I S T S A N D R E L A T E D
144
Wages Annual and hourly wage data for entry-level and experienced Massage Therapists, as well average state and national wages, are supplied in the following table.
Maine Maine National Entry Experienced Mean Mean
% of National
Hourly $10.15 $20.02 $16.73 $17.87 Annual $21,100 $41,640 $34,798 $37,170
93.6%
National Employment In 2002, there were an estimated 92,000 Massage Therapists employed nationally. In 2012, it is projected that there will be 117,000; this represents an annual average growth rate of 2.4 percent, faster than the 1.4 percent growth rate for all occupations in the United States, as shown in the following table.
2002 Estimated Employment
2012 Projected Employment
Total 2002 – 2012 Employment Change
Annual Average Percent Change
92,000 117,000 25,000 2.4
Outlook Employment for massage therapists is expected to increase faster than average over the period from 2004 to 2014 as more people learn about the benefits of massage therapy. In States that regulate massage therapy, therapists who complete formal training programs and pass the national certification exam are likely to have very good job opportunities. Massage is an increasingly popular technique for relaxation and reduction of stress, and increased interest in alternative medicine and holistic healing will mean increased opportunities for those skilled in massage therapy. Healthcare providers and medical insurance companies are beginning to recognize massage therapy as a legitimate treatment and preventative measure for several types of injuries and illnesses. The health care industry is using massage therapy more often as a supplement to conventional medical techniques for ailments such as muscle problems, some sicknesses and diseases, and stress-related health problems.

145
Pharmacists and Related Professionals During a period in which demand for pharmacy services and pharmacists will be increasing, ensuring an adequate supply of these healthcare professionals may prove problematic. Pharmacists 147 Pharmacy Technicians 153
Chapter
9


9 P H A R M A C I S T S A N D R E L A T E D
147
Pharmacists
Occupational Description Pharmacists advise physicians, other health practitioners, and patients on the selection, dosages, interactions, and side effects of medications, and, in general, are becoming more involved in drug therapy decision-making and patient counseling.
Characteristic Data The relicensure of all Pharmacists in Maine occurs annually on December 31st; thus, data for Pharmacists will not be available until 2007.
Educational Requirements A license to practice pharmacy is required in all States, the District of Columbia, and U.S. territories. Pharmacy programs grant the degree of Doctor of Pharmacy (Pharm.D.), which requires at least 6 years of postsecondary study and the passing of the licensure examination of a State board of pharmacy. The Pharm.D. is a 4-year program that requires at least 2 years of college study prior to admittance. This degree has replaced the Bachelor of Science (B.S.) degree, which will cease to be awarded after 2005. Colleges of pharmacy require at least 2 years of college-level prepharmacy education. Both the master's and Ph.D. degrees are awarded after completion of a Pharm.D. degree. These degrees are designed for those who want more laboratory and research experience.
Schools No school in Maine currently offers a pharmacy program; however, St. Joseph’s College has an articulation agreement with the Massachusetts College of Pharmacy and Health Sciences in Boston. In this program, students attend St. Joseph’s College for two years, and then transfer to the Massachusetts College of Pharmacy and Health Sciences for four years. Students who successfully complete the six-year program receive the degree of Doctor of Pharmacy from the Massachusetts College of Pharmacy and Health Sciences. It should be noted that discussions are underway to establish a Pharmacy School in Maine. Also, the New England Board of Higher Education’s Regional Student Program alls Maine residents access to degree programs in academic areas not available in Maine. Through this program, Maine students typically pay 150% of the admitting state’s resident tuition. The University of Connecticut and the University of Rhode Island both offer degrees in Pharmaceutical Science to Maine students and take part in this program.

9 P H A R M A C I S T S A N D R E L A T E D
148
Statewide Employment There were 918 Pharmacists employed in Maine in 2002, and this occupation is expected to experience much more rapid growth (2.5% annually) than that of the all occupations average (1.0%). The following table lists relevant employment and projection data.
2002 Estimated Employment
2012 Projected Employment
Total 2002 – 2012 Employment Change
Annual Average Percent Change
918 1,177 259 2.5 Replacement needs, in addition to growth, must also be considered. The following table illustrates annual growth and replacement needs for Pharmacists.
Total Annual Average
Openings
Annual Average Openings Due to
Growth
Annual Average Openings Due to
Replacement Pharmacists Total 44 26 18
Pharmacists % 100% 59.10% 40.90%
All Occupations % 100% 33.70% 66.30%
Maine Job Vacancies For Pharmacists, the number of job vacancies in 2005 was markedly higher than the number of job vacancies in 2002; additionally, the job vacancy rate also increased to 3.7%. The findings are summarized in the table below.
2002 Vacancies
2002 Job Vacancy
Rate
2005 Vacancies
2005 Job Vacancy
Rate
Change in Vacancies
Change in Job Vacancy Rate
9 1.00% 35 3.70% 26 2.60%
Wages Pharmacists in Maine actually earn more than the national average for Pharmacists. Annual and hourly wage data for entry-level and experienced Pharmacists, as well average state and national wages, are supplied in the following table.
Maine Maine National Entry Experienced Mean Mean
% of National
Hourly $36.18 $49.85 $45.29 $41.78 Annual $75,250 $103,690 $94,203 $86,910
108.40%

9 P H A R M A C I S T S A N D R E L A T E D
149
National Employment In 2002, there were an estimated 230,000 Pharmacists employed in the United States. In 2012, it is projected that there will be 299,000; this represents an annual average growth rate of 2.7 percent, faster than the 1.4 percent growth rate for all occupations in the United States. The following table illustrates the net change, growth rate and expected employment for this occupation in 2012.
2002 Estimated Employment
2012 Projected Employment
Total 2002 – 2012 Employment Change
Annual Average Percent Change
230,000 299,000 69,000 2.7
Demand Very good employment opportunities are expected for pharmacists over the 2002-12 period because the number of degrees granted in pharmacy is expected to be less than the number of job openings created by employment growth and the need to replace pharmacists who retire or otherwise leave the occupation. Recent enrollments in pharmacy programs are rising. Despite this increase in enrollments, pharmacist jobs should still be more numerous than those seeking employment. Employment of pharmacists is expected to grow faster than the average for all occupations through the year 2012. The growing numbers of middle-aged and elderly people—who, on average, use more prescription drugs than do younger people—will continue to spur demand for pharmacists in all employment settings. Other factors likely to increase the demand for pharmacists include scientific advances that will make more drug products available, new developments in genome research and medication distribution systems, increasingly sophisticated consumers seeking more information about drugs, and coverage of prescription drugs by a greater number of health insurance plans and by Medicare. Community pharmacies are taking steps to manage increasing prescription volume. Automation of drug dispensing and greater employment of pharmacy technicians and pharmacy aides will help these establishments to dispense more prescriptions. With its emphasis on cost control, managed care encourages the use of lower cost prescription drug distributors, such as mail-order firms and online pharmacies, for purchases of certain medications. Prescriptions ordered through the mail via the Internet are filled in a central location and shipped to the patient at a lower cost. Mail-order and online pharmacies typically use automated technology to dispense medication and employ fewer pharmacists. If the utilization of mail-order pharmacies increases rapidly, job growth among pharmacists could be affected. Employment of pharmacists will not grow as fast in hospitals as in other industries. An increase in outpatient surgeries means more patients are discharged and purchase medications through retail, supermarket, or mail-order pharmacies. An aging population means more pharmacy services are required in nursing homes, assisted living facilities, and

9 P H A R M A C I S T S A N D R E L A T E D
150
home care settings, where the most rapid job growth among pharmacists is expected. New opportunities are emerging for pharmacists in managed-care organizations, where they may analyze trends and patterns in medication use for their populations of patients, and for pharmacists trained in research, disease management, and pharmacoeconomics—determining the costs and benefits of different drug therapies. Pharmacists also will have opportunities to work in research and development as well as sales and marketing for pharmaceutical manufacturing firms. Ongoing advances in science and biotechnology will bring new drugs and expand the opportunities for pharmacists. Job opportunities for pharmacists in patient care will arise as cost-conscious insurers and health systems continue to emphasize the role of pharmacists in primary and preventive health services.
Supply Given the dramatic increase in job vacancies for Pharmacists from 2002 to 2005, it is apparent that the supply of these professionals in Maine is no longer meeting demand—and several factors may be contributing to this. First, there has been an increase in the number of desirable jobs outside of retail or hospital-based pharmacies, but still related to the field. Increasingly, pharmacists are pursuing other nontraditional pharmacy work, such as research and development and positions within government, health insurance companies, and pharmacy programs. Although these nontraditional pharmacy positions may not seem commonplace in Maine, it must be understood that the labor market for Pharmacists is national—largely due to the fact that Maine has no pharmacy program. The lack of an in-state pharmacy program affects the supply of Pharmacists in Maine, as the state must rely on out-of-state programs to produce the needed new pharmacists. The graduate capacity of pharmacy programs nationally—even with new schools and expansion—will not help in the short-term because of the time required to expand programs and for graduates to complete the required training. Unfortunately, the recruitment of Pharmacists to Maine can be difficult. “Remoteness, isolation from other professionals, lower economic returns, reduced opportunities for advancement, and other rural practice characteristics remain obstacles in attracting providers; recently, the ability to attract pharmacists has been hampered by the economic status of community pharmacies (low profit margins), rural hospitals that are in transition, and the persistence of medically underserved areas.”25 These factors challenge the recruiting of Pharmacists to Maine.
Analysis During a period in which demand for pharmacy services and pharmacists will be increasing, ensuring an adequate supply of these healthcare professionals may prove problematic. The

9 P H A R M A C I S T S A N D R E L A T E D
151
expansion and addition of pharmacy programs throughout the nation will likely have little short term effect on Maine’s supply of Pharmacists. In attracting new Pharmacists, state entry level wages are notably higher than that of the national average, which may be a significant recruitment tool, although the reasons and motivation for working in Maine may be more complex than salary alone. However, information to be obtained from the relicensure survey of Pharmacists will provide valuable insights and allow for further analysis.


9 P H A R M A C I S T S A N D R E L A T E D
153
Pharmacy Technicians
Occupational Description Pharmacy Technicians fill orders for unit doses and prepackaged pharmaceuticals and perform related duties under the supervision and direction of a pharmacist. Technicians usually perform routine tasks to help prepare prescribed medication for patients, such as counting tablets and labeling bottles.
Educational Requirements
Although most pharmacy technicians receive informal on-the-job training, employers favor those who have completed formal training and certification. Several states require pharmacy technicians to be licensed.
Schools The school in the following table is a provider of a Pharmacy Technician program in Maine; this is the only program of its kind in Maine.
Provider City Southern Maine Community College South Portland
Statewide Employment There were 1,051 Pharmacy Technicians employed in Maine in 2002, and this occupation is expected to experience much more rapid growth (2.6% annually) than that of the all occupations average (1.0%). The following table lists relevant employment and projection data.
2002 Estimated Employment
2012 Projected Employment
Total 2002 – 2012 Employment Change
Annual Average Percent Change
1,051 1,353 302 2.6 Replacement needs must also be considered for this occupation. The table on the following page illustrates annual growth and replacement needs for Pharmacy Technicians.

9 P H A R M A C I S T S A N D R E L A T E D
154
Total Annual Average
Openings
Annual Average Openings Due
to Growth
Annual Average Openings Due to
Replacement Pharmacy Technicians (Total) 44 30 14
Pharmacy Technicians (%) 100% 68.20% 31.80% All Occupations (%) 100% 33.70% 66.30%
The top two industries that employ the most Pharmacy Technicians are health and personal care stores (38% of all Pharmacy Technicians) and hospitals (24.7%).
Wages Annual and hourly wage data for entry-level and experienced Pharmacy Technicians, as well average state and national wages, are supplied in the following table.
Maine Maine National Entry Experienced Mean Mean
% of National
Hourly $8.88 $12.78 $11.48 $12.09 Annual $18,470 $26,570 $23,878 $25,150
95.00%
National Employment In 2002, there were an estimated 211,000 Pharmacy Technicians employed in the United States. In 2012, it is projected that there will be 271,000; this represents an annual average growth rate of 2.5 percent, faster than the 1.4 percent growth rate for all occupations in the United States, as shown in the following table.
2002 Estimated Employment
2012 Projected Employment
Total 2002 – 2012 Employment Change
Annual Average Percent Change
211,000 271,000 60,000 2.5
Outlook Good job opportunities are expected for full-time and part-time work, especially for technicians with formal training or previous experience. Job openings for pharmacy technicians will result from the expansion of retail pharmacies and other employment settings, and from the need to replace workers who transfer to other occupations or leave the labor force. Employment of pharmacy technicians is expected to grow faster than the average for all occupations through 2012 due to the increased pharmaceutical needs of a larger and older population, and to the greater use of medication. The increased number of middle-aged and elderly people—who, on average, use more prescription drugs than do younger people—will spur demand for technicians in all practice settings. With advances in science, more

9 P H A R M A C I S T S A N D R E L A T E D
155
medications are becoming available to treat more conditions. Cost-conscious insurers, pharmacies, and health systems will continue to emphasize the role of technicians. As a result, pharmacy technicians will assume responsibility for more routine tasks previously performed by pharmacists. Pharmacy technicians also will need to learn and master new pharmacy technology as it surfaces. For example, robotic machines are used to dispense medicine into containers; technicians must oversee the machines, stock the bins, and label the containers. Thus, while automation is increasingly incorporated into the job, it will not necessarily reduce the need for technicians. Almost all States have legislated the maximum number of technicians who can safely work under a pharmacist at one time. In some States, technicians have assumed more medication dispensing duties as pharmacists have become more involved in patient care, resulting in more technicians per pharmacist. Changes in these laws could directly affect employment.


157
Health Technologists and Technicians Medical and Clinical Laboratory Technologists 159
Medical and Clinical Laboratory Technicians 163 Cardiovascular Technologists and Technicians 167 Diagnostic Medical Sonographers 171 Nuclear Medicine Technologists 175 Radiologic Technologists and Technicians 179 Emergency Medical Technicians and Paramedics 183
Chapter
10


1 0 H E A L T H T E C H N O L O G I S T S A N D T E C H N I C I A N S
159
Medical and Clinical Laboratory Technologists
Occupational Description Technologists in small laboratories perform many types of tests, whereas those in large laboratories generally specialize. Technologists who prepare specimens and analyze the chemical and hormonal contents of body fluids are called clinical chemistry technologists. Those who examine and identify bacteria and other microorganisms are microbiology technologists. Blood bank technologists, or immunohematology technologists, collect, type, and prepare blood and its components for transfusions. Immunology technologists examine elements of the human immune system and its response to foreign bodies. Cytotechnologists prepare slides of body cells and examine these cells microscopically for abnormalities that may signal the beginning of a cancerous growth. Molecular biology technologists perform complex protein and nucleic acid testing on cell samples.
Educational Requirements The usual requirement for an entry-level position as a clinical laboratory technologist is a bachelor’s degree with a major in medical technology or in one of the life sciences; although, it is possible to qualify through a combination of education, on-the-job, and specialized training.
Schools The schools in the following table are providers of educational programs that would prepare one to be a Medical and Clinical Laboratory Technologist.
Provider City University of Maine Orono University of New England Biddeford University of Southern Maine Portland
The following table represents the completers of Clinical/Medical Laboratory Science programs in Maine during the 2003-2004 academic year.
Clinical/Medical Laboratory Science Program Completers: 2003-2004 Institution Award Level Completers
UMO Bachelor’s Degree 2

1 0 H E A L T H T E C H N O L O G I S T S A N D T E C H N I C I A N S
160
Statewide Employment There were 732 Medical Technologists employed in Maine in 2002, and this occupation is expected to experience much more rapid growth (2.6% annually) than that of the all occupations average (1.0%). The following table lists relevant employment and projection data.
2002 Estimated Employment
2012 Projected Employment
Total 2002 – 2012 Employment Change
Annual Average Percent Change
732 942 210 2.6 The above 10-year employment change reflects the growth that this occupation is expected to experience, but replacement needs must also be considered. The following table illustrates annual growth and replacement needs for Medical Technologists.
Total Annual Average
Openings
Annual Average Openings Due to
Growth
Annual Average Openings Due to
Replacement
Medical Technologists (Total) 41 21 20
Medical Technologists (%) 100% 51.20% 48.80%
All Occupations (%) 100% 33.70% 66.30% The top two industries in terms of employment of Medical Technologists are hospitals (with 58.1% of all Medical Technologists), and ambulatory health care services (37.4%).
Maine Job Vacancies Fr Medical and Clinical Laboratory Technologists, there were an estimated 27 vacancies in 2002 and 14 in 2005. The complete findings of the Job Vacancy Survey are summarized in the table below.
2002 Vacancies
2002 Job Vacancy
Rate 2005
Vacancies
2005 Job Vacancy
Rate Change in Vacancies
Change in Job Vacancy
Rate 27 3.40% 14 1.70% -13 -1.70%
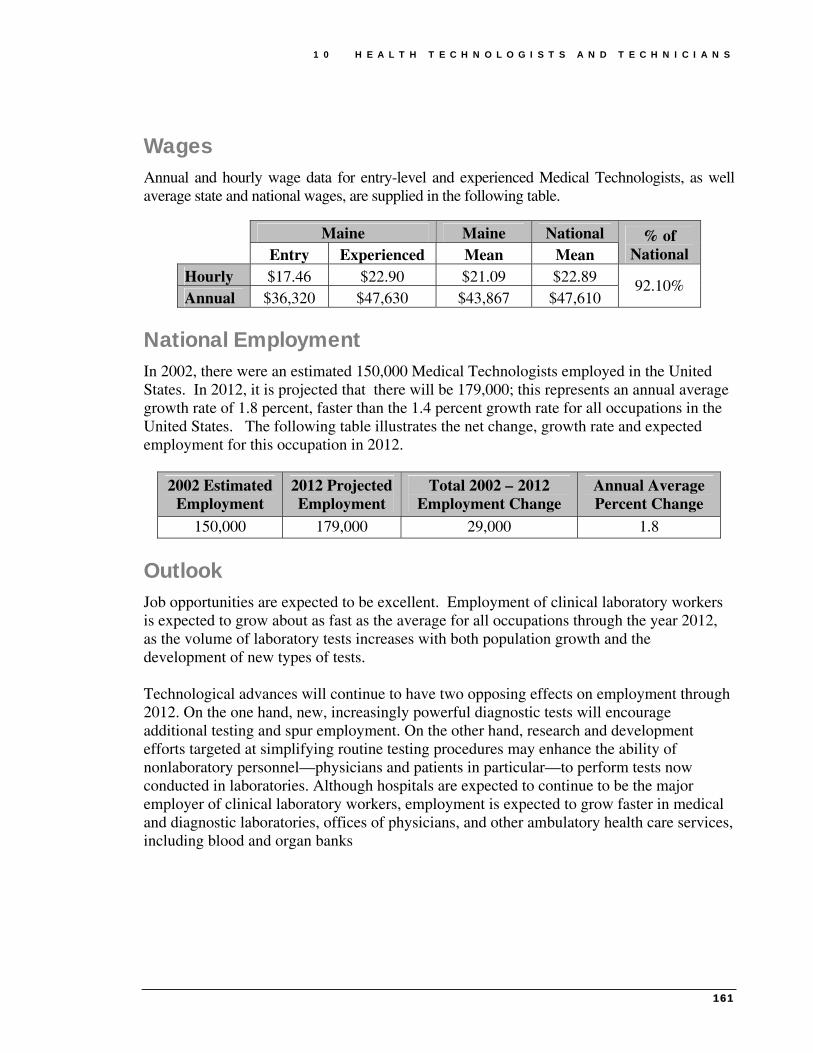
1 0 H E A L T H T E C H N O L O G I S T S A N D T E C H N I C I A N S
161
Wages Annual and hourly wage data for entry-level and experienced Medical Technologists, as well average state and national wages, are supplied in the following table.
Maine Maine National Entry Experienced Mean Mean
% of National
Hourly $17.46 $22.90 $21.09 $22.89 Annual $36,320 $47,630 $43,867 $47,610
92.10%
National Employment In 2002, there were an estimated 150,000 Medical Technologists employed in the United States. In 2012, it is projected that there will be 179,000; this represents an annual average growth rate of 1.8 percent, faster than the 1.4 percent growth rate for all occupations in the United States. The following table illustrates the net change, growth rate and expected employment for this occupation in 2012.
2002 Estimated Employment
2012 Projected Employment
Total 2002 – 2012 Employment Change
Annual Average Percent Change
150,000 179,000 29,000 1.8
Outlook Job opportunities are expected to be excellent. Employment of clinical laboratory workers is expected to grow about as fast as the average for all occupations through the year 2012, as the volume of laboratory tests increases with both population growth and the development of new types of tests. Technological advances will continue to have two opposing effects on employment through 2012. On the one hand, new, increasingly powerful diagnostic tests will encourage additional testing and spur employment. On the other hand, research and development efforts targeted at simplifying routine testing procedures may enhance the ability of nonlaboratory personnel—physicians and patients in particular—to perform tests now conducted in laboratories. Although hospitals are expected to continue to be the major employer of clinical laboratory workers, employment is expected to grow faster in medical and diagnostic laboratories, offices of physicians, and other ambulatory health care services, including blood and organ banks


1 0 H E A L T H T E C H N O L O G I S T S A N D T E C H N I C I A N S
163
Medical and Clinical Laboratory Technicians
Occupational Description Technicians perform less complex tests and laboratory procedures than technologists perform. Technicians may prepare specimens and operate automated analyzers, for example, or they may perform manual tests in accordance with detailed instructions. Like technologists, they may work in several areas of the clinical laboratory or specialize in just one. Histotechnicians cut and stain tissue specimens for microscopic examination by pathologists, and phlebotomists collect blood samples. They usually work under the supervision of medical and clinical laboratory technologists or laboratory managers.
Educational Requirements Medical and clinical laboratory technicians generally have either an associate degree from a community or junior college or a certificate from a hospital, a vocational or technical school, or one of the U.S. Armed Forces. A few technicians learn their skills on the job.
Schools The schools in the following table offer educational programs to prepare Medical and Clinical Laboratory Technicians.
Provider City Central Maine Community College Auburn Eastern Maine Community College Bangor University of Maine at Augusta Augusta University of Maine at Presque Isle Presque Isle
The following table represents the completers of Clinical/Medical Laboratory Science programs in Maine during the 2003-2004 academic year.
Clinical/Medical Laboratory Science Program Completers: 2003-2004 Institution Award Level Completers
CMCC Associate’s Degree 5 UMPI Associate’s Degree 7

1 0 H E A L T H T E C H N O L O G I S T S A N D T E C H N I C I A N S
164
Statewide Employment There were 588 Medical Technicians employed in Maine in 2002, and this occupation is expected to experience more rapid growth (2.1% annually) than that of the all occupations average (1.0%). The following table lists relevant employment and projection data.
2002 Estimated Employment
2012 Projected Employment
Total 2002 – 2012 Employment Change
Annual Average Percent Change
588 727 139 2.1 The above 10-year employment change reflects the growth that this occupation is expected to experience, but replacement needs must also be considered. An additional 16 annual openings for Medical Technicians are projected and attributed to replacement needs. The following table illustrates annual growth and replacement needs for Medical Technicians and the percentage of openings attributed to growth and replacement for both Medical Technicians and all occupations.
Total Annual Average
Openings
Annual Average Openings Due to
Growth
Annual Average Openings Due to
Replacement Medical Technicians (Total) 30 14 16
Medical Technicians (%) 100% 46.70% 53.30% All Occupations (%) 100% 33.70% 66.30%
The top two industries in terms of employment of Medical Technicians are hospitals (with 50.3% of all Medical Technicians), and ambulatory health care services (38.0%).
Maine Job Vacancies For Medical and Clinical Laboratory Technicians, there was a dramatic increase in the number of job vacancies from 2002 to 2005. The complete findings of the Job Vacancy Survey are summarized in the table below.
2002 Vacancies
2002 Job Vacancy
Rate 2005
Vacancies
2005 Job Vacancy
Rate Change in Vacancies
Change in Job Vacancy
Rate 38 6.40% 101 16.20% 63 9.80%
Wages Annual and hourly wage data for entry-level and experienced Medical Technicians, as well average state and national wages, are supplied in the following table.

1 0 H E A L T H T E C H N O L O G I S T S A N D T E C H N I C I A N S
165
Maine Maine National Entry Experienced Mean Mean
% of National
Hourly $11.09 $17.26 $15.20 $15.78 Annual $23,060 $35,900 $31,616 $32,820
96.30%
National Employment In 2002, there were an estimated 147,000 Medical Technicians employed in the United States. In 2012, it is projected that there will be 176,000; this represents an annual average growth rate of 1.8 percent, faster than the 1.4 percent growth rate for all occupations in the United States. The following table illustrates the net change, growth rate and expected employment for this occupation in 2012.
2002 Estimated Employment
2012 Projected Employment
Total 2002 – 2012 Employment Change
Annual Average Percent Change
147,000 176,000 29,000 1.8
Outlook Job opportunities are expected to be excellent. Employment of clinical laboratory workers is expected to grow about as fast as the average for all occupations through the year 2012, as the volume of laboratory tests increases with both population growth and the development of new types of tests.


1 0 H E A L T H T E C H N O L O G I S T S A N D T E C H N I C I A N S
167
Cardiovascular Technologists and Technicians
Occupational Description Cardiovascular Technologists and Technicians conduct tests on pulmonary or cardiovascular systems of patients for diagnostic purposes and may conduct or assist in electrocardiograms, cardiac catheterizations, pulmonary-functions, lung capacity, and similar tests. They also assist physicians in diagnosing and treating cardiac (heart) and peripheral vascular (blood vessel) ailments. Cardiovascular technologists may specialize in three areas of practice—invasive cardiology, echocardiography, and vascular technology. Cardiovascular Technicians who specialize in electrocardiograms (EKGs), stress testing, and Holter monitors are known as cardiographic, or EKG technicians
Educational Requirements
Although a few cardiovascular technologists are trained on the job, most receive training in 2- to 4-year programs. Cardiovascular technologists normally complete a 2-year junior or community college program. Those who are qualified in a related allied health profession only need to complete the year of specialized instruction.
Schools The school in the following table is a provider of a Cardiovascular Technologist/Technician program in Maine; this is the only program of its kind in Maine.
Provider City Southern Maine Community College South Portland
The following table lists the completers of the Cardiovascular Technology program at Southern Maine Community College by year.26
Year Program Completers 2000 Cardiovascular Technology 6 2001 Cardiovascular Technology 4 2002 Cardiovascular Technology 7 2003 Cardiovascular Technology 5 2004 Cardiovascular Technology 7

1 0 H E A L T H T E C H N O L O G I S T S A N D T E C H N I C I A N S
168
Statewide Employment There were 213 Cardiovascular Technologists and Technicians employed in Maine in 2002, and this occupation is expected to experience much more rapid growth (3.4% annually) than that of the all occupations average (1.0%). The following table lists relevant employment and projection data.
2002 Estimated Employment
2012 Projected Employment
Total 2002 – 2012 Employment Change
Annual Average Percent Change
213 299 86 3.4 The above 10-year employment change reflects the growth that this occupation is expected to experience, but replacement needs must also be considered. An additional 4 annual openings for Cardiovascular Technologists and Technicians are projected and attributed to replacement needs. The following table illustrates annual growth and replacement needs for Cardiovascular Technologists and Technicians and the percentage of openings attributed to growth and replacement for both Cardiovascular Technologists and Technicians and all occupations.
Total Annual Average
Openings
Annual Average Openings Due to
Growth
Annual Average Openings Due to
Replacement
CV Technologists and Technicians (Total)
13 9 4
CV Technologists and Technicians (%)
100% 69.20% 30.80%
All Occupations (%)
100% 33.70% 66.30%
The top two industries that employ the most Cardiovascular Technologists and Technicians are hospitals (with 82.6% of all Cardiovascular Technologists and Technicians) and ambulatory health care services (15.5%).
Wages Annual and hourly wage data for entry-level and experienced Cardiovascular Technologists and Technicians, as well average state and national wages, are supplied in the following table.
Maine Maine National Entry Experienced Mean Mean
% of National
Hourly $12.70 $24.45 $20.53 $19.60 Annual $26,420 $50,860 $42,702 $40,770
104.7%

1 0 H E A L T H T E C H N O L O G I S T S A N D T E C H N I C I A N S
169
National Employment In 2002, there were an estimated 43,000 Cardiovascular Technologists and Technicians employed in the United States. In 2012, it is projected that there will be 58,000; this represents an annual average growth rate of 3.0 percent, more than twice the 1.4 percent growth rate for all occupations in the United States. The following table illustrates the net change, growth rate and expected employment for this occupation in 2012.
2002 Estimated Employment
2012 Projected Employment
Total 2002 – 2012 Employment Change
Annual Average Percent Change
43,000 58,000 15,000 3
Outlook Employment of cardiovascular technologists and technicians is expected to grow faster than the average for all occupations through the year 2012. Growth will occur as the population ages, because older people have a higher incidence of heart problems. Employment of vascular technologists and echocardiographers will grow as advances in vascular technology and sonography reduce the need for more costly and invasive procedures. However, fewer EKG technicians will be needed, as hospitals train nursing aides and others to perform basic EKG procedures. Individuals trained in Holter monitoring and stress testing are expected to have more favorable job prospects than are those who can perform only a basic EKG. Some job openings for cardiovascular technologists and technicians will arise from replacement needs, as individuals transfer to other jobs or leave the labor force. However, job growth and replacement needs will produce relatively few job openings because the occupation is small.


1 0 H E A L T H T E C H N O L O G I S T S A N D T E C H N I C I A N S
171
Diagnostic Medical Sonographers
Occupational Description Diagnostic Medical Sonographers produce ultrasonic recordings of internal organs.
Educational Requirements
Colleges and universities offer formal training in both 2- and 4-year programs, culminating in an associate or bachelor’s degree. Two-year programs are most prevalent.
Although no State requires licensure in diagnostic medical sonography, organizations such as the American Registry of Diagnostic Medical Sonographers (ARDMS) certify the competency of Sonographers.
Schools No school in Maine currently offers a Diagnostic Medical Sonography program; however, opportunities for those interested in pursuing this program are available through the New England Board of Higher Education’s RSP Tuition Break program. This program allows Maine residents to attend schools in New England at discounted rate when the degree or certificate they wish to pursue isn’t offered in Maine. Participating schools for this major are listed below.
Provider City Gateway Community College New Haven, CT Middlesex Community College Bedford, MA Springfield Technical Community College Springfield, MA Bunker Hill Community College Charlestown, MA
Statewide Employment There were 152 Diagnostic Medical Sonographers employed in Maine in 2002, and this occupation is expected to experience more rapid growth (2.4% annually) than that of the all occupations average (1.0%), as shown in the following table.
2002 Estimated Employment
2012 Projected Employment
Total 2002 – 2012 Employment Change
Annual Average Percent Change
152 193 41 2.4

1 0 H E A L T H T E C H N O L O G I S T S A N D T E C H N I C I A N S
172
Replacement needs, in addition to growth, must also be considered. The following table illustrates annual growth and replacement needs for Diagnostic Medical Sonographers.
Total Annual Average
Openings
Annual Average Openings Due to
Growth
Annual Average Openings Due to
Replacement
Diagnostic Medical Sonographers (Total) 7 4 3
Diagnostic Medical Sonographers (%) 100% 57.10% 42.90% All Occupations
(%) 100% 33.70% 66.30% The top two industries that employ the most Diagnostic Medical Sonographers are hospitals (77.0% of all Diagnostic Medical Sonographers), and ambulatory healthcare services (21.1%).
Maine Job Vacancies For Diagnostic Medical Sonographers, there were an estimated 6 job vacancies in 2005, which, when compared to total employment for the occupation, yielded a job vacancy rate of 4.4%; these numbers indicate little change from 2002. The findings are summarized in the table below.
2002 Vacancies
2002 Job Vacancy
Rate 2005
Vacancies
2005 Job Vacancy
Rate
Change in
Vacancies
Change in Job Vacancy
Rate 5 3.70% 6 4.40% 1 0.70%
Statewide Wages Annual and hourly wage data for entry-level and experienced Diagnostic Medical Sonographers, as well average state and national wages, are supplied in the following table.
Maine Maine National Entry Experienced Mean Mean
% of National
Hourly $22.47 $29.47 $27.13 $26.36 Annual $46,730 $61,290 $56,430 $54,820 102.90%
National Employment In 2002, there were an estimated 37,000 Diagnostic Medical Sonographers employed in the United States. In 2012, it is projected that there will be 45,000; this represents an annual
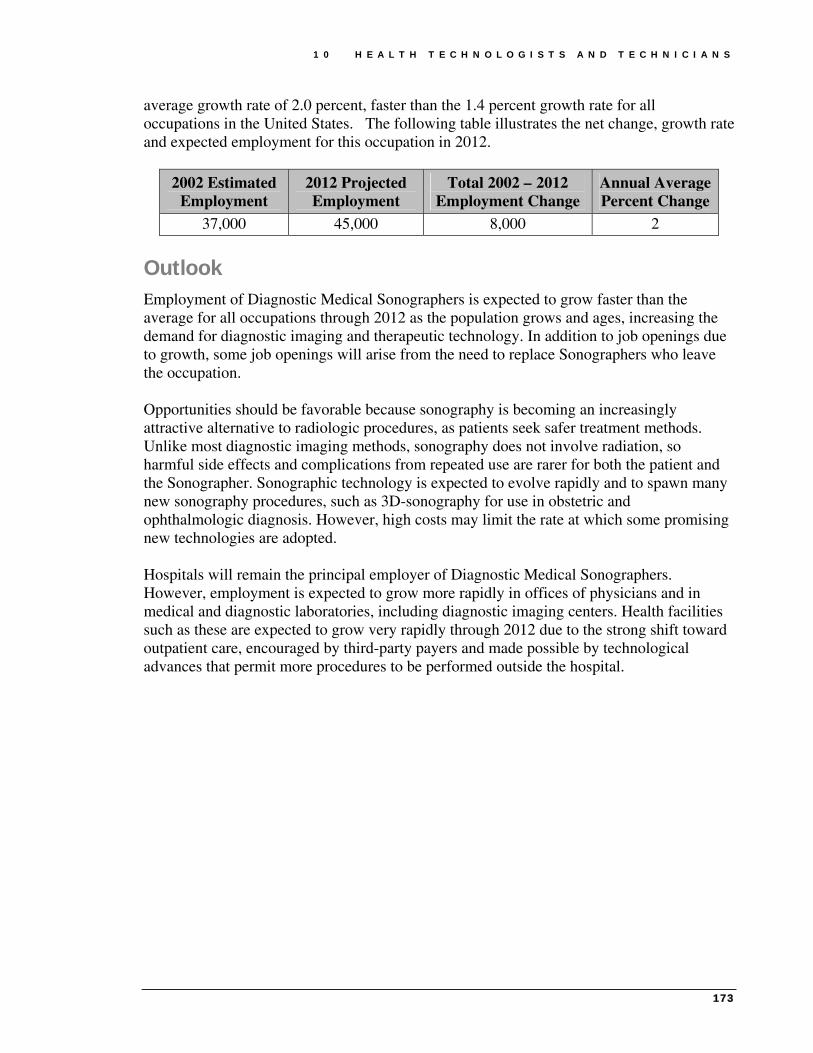
1 0 H E A L T H T E C H N O L O G I S T S A N D T E C H N I C I A N S
173
average growth rate of 2.0 percent, faster than the 1.4 percent growth rate for all occupations in the United States. The following table illustrates the net change, growth rate and expected employment for this occupation in 2012.
2002 Estimated Employment
2012 Projected Employment
Total 2002 – 2012 Employment Change
Annual Average Percent Change
37,000 45,000 8,000 2
Outlook Employment of Diagnostic Medical Sonographers is expected to grow faster than the average for all occupations through 2012 as the population grows and ages, increasing the demand for diagnostic imaging and therapeutic technology. In addition to job openings due to growth, some job openings will arise from the need to replace Sonographers who leave the occupation. Opportunities should be favorable because sonography is becoming an increasingly attractive alternative to radiologic procedures, as patients seek safer treatment methods. Unlike most diagnostic imaging methods, sonography does not involve radiation, so harmful side effects and complications from repeated use are rarer for both the patient and the Sonographer. Sonographic technology is expected to evolve rapidly and to spawn many new sonography procedures, such as 3D-sonography for use in obstetric and ophthalmologic diagnosis. However, high costs may limit the rate at which some promising new technologies are adopted. Hospitals will remain the principal employer of Diagnostic Medical Sonographers. However, employment is expected to grow more rapidly in offices of physicians and in medical and diagnostic laboratories, including diagnostic imaging centers. Health facilities such as these are expected to grow very rapidly through 2012 due to the strong shift toward outpatient care, encouraged by third-party payers and made possible by technological advances that permit more procedures to be performed outside the hospital.


1 0 H E A L T H T E C H N O L O G I S T S A N D T E C H N I C I A N S
175
Nuclear Medicine Technologists
Occupational Description Nuclear Medicine Technologists operate sophisticated equipment to help physicians and other health practitioners diagnose and treat patients. In performing these duties, Technologists adhere to strict safety standards that keep the radiation dose to both workers and patients as low as possible. Technologists also prepare, administer, and measure radioactive isotopes in therapeutic, diagnostic, and tracer studies utilizing a variety of radioisotope equipment; prepare stock solutions of radioactive materials and calculate doses to be administered by radiologists; and subject patients to radiation.
Characteristics The licensure of Nuclear Medicine Technologists is carried out by the Radiologic Technology Board of Examiners. Technologists must renew their licenses every two years (even years only). This year a survey to collect characteristic data accompanied the relicensure process and data should be available for future reports.
Educational Requirements
Nuclear medicine technology programs range in length from 1 to 4 years and lead to a certificate, associate's degree, or bachelor's degree. One-year certificate programs are for health professionals, especially radiologic technologists and diagnostic medical sonographers, who wish to specialize in nuclear medicine. Others interested in the nuclear medicine technology field have three options: a 2-year certificate program, a 2-year associate program, or a 4-year bachelor's program.
Schools There is only provider of a Nuclear Medicine Technician/Technologist training program in the state of Maine. Completer data for 2002 is provided in the following table.
Provider City Credential Completers Southern Maine Community College South Portland Associate’s Degree 31 Southern Maine Community College South Portland Bachelor’s Degree 4 Southern Maine Community College South Portland Certificate/Diploma 14

1 0 H E A L T H T E C H N O L O G I S T S A N D T E C H N I C I A N S
176
Statewide Employment There were 67 Nuclear Medicine Technologists employed in Maine in 2002, and this occupation is expected to experience more rapid growth (2.2% annually) than that of the all occupations average (1.0%). The following table lists relevant employment and projection data.
2002 Estimated Employment
2012 Projected Employment
Total 2002 – 2012 Employment Change
Annual Average Percent Change
67 83 16 2.2 In addition to growth, replacement needs must also be addressed. The following table illustrates annual growth and replacement needs for Nuclear Medicine Technologists.
Total Annual
Average Openings
Annual Average
Openings Due to Growth
Annual Average
Openings Due to Replacement
Nuclear Medicine Technologists (Total) 3 2 1
Nuclear Medicine Technologists (%) 100% 66.70% 33.30%
All Occupations (%) 100% 33.70% 66.30% The top two industries that employ Nuclear Medicine Technologists in Maine are hospitals (with 82.1% of all Nuclear Medicine Technologists) and ambulatory health care services (14.9%).
Maine Job Vacancies For Nuclear Medicine Technologists, job vacancies have remained consistent from 2002 to 2005.
2002 Vacancies
2002 Job Vacancy
Rate 2005
Vacancies
2005 Job Vacancy
Rate Change in Vacancies
Change in Job Vacancy
Rate 5 7.50% 6 8.40% 1 0.90%

1 0 H E A L T H T E C H N O L O G I S T S A N D T E C H N I C I A N S
177
Wages Annual and hourly wage data for entry-level and experienced Nuclear Medicine Technologists, as well average state and national wages, are supplied in the following table.
Maine Maine National Entry Experienced Mean Mean
% of National
Hourly $22.25 $28.68 $26.54 $29.22 Annual $46,270 $59,660 $55,203 $60,780
90.8%
National Employment Nuclear Medicine Technologists are expected to experience faster growth than that of all occupations in the United States. The following table illustrates the net change, growth rate and expected employment for this occupation in 2012.
2002 Estimated Employment
2012 Projected Employment
Total 2002 – 2012 Employment Change
Annual Average Percent Change
17,000 21,000 4,000 2.1
Outlook Employment of nuclear medicine technologists is expected to grow faster than the average for all occupations through the year 2012. Growth will arise from an increase in the number of middle-aged and older persons, who are the primary users of diagnostic procedures, including nuclear medicine tests. However, the number of openings each year will be relatively low because the occupation is small. Technologists who are also trained in other diagnostic methods, such as radiologic technology or diagnostic medical sonography, will have the best prospects. Technological innovations may increase the diagnostic uses of nuclear medicine. One example is the use of radiopharmaceuticals to detect cancer at far earlier stages than is customary today and without resorting to surgery. Wider use of nuclear medical imaging to observe metabolic and biochemical changes for neurology, cardiology, and oncology procedures also will spur demand for nuclear medicine technologists. Nonetheless, cost considerations will affect the speed with which new applications of nuclear medicine grow. Some promising nuclear medicine procedures, such as positron emission tomography, are extremely costly, and hospitals contemplating these procedures will have to consider equipment costs, reimbursement policies, and the number of potential users, particularly in a sparsely populated, rural state.


1 0 H E A L T H T E C H N O L O G I S T S A N D T E C H N I C I A N S
179
Radiologic Technologists and Technicians
Occupational Description Radiologic Technologists take X-rays and CAT scans or administer nonradioactive materials into patient's blood stream for diagnostic purposes. This occupation includes technologists who specialize in other modalities, such as computed tomography, ultrasound, and magnetic resonance. Radiologic Technicians maintain and use equipment and supplies necessary to demonstrate portions the human body on X-ray film or fluoroscopic screen for diagnostic purposes.
Characteristic Data Radiologic Technologists and Technicians are governed by the Board of Examiners of Radiologic Technology and this board renews licenses biannually on August 31st of even years. A survey has accompanied the relicensure process and data from this survey will likely be available in the next edition of this report.
Educational Requirements
Formal training programs in radiography range in length from 1 to 4 years and lead to a certificate, associate's degree, or bachelor's degree. Two-year associate's degree programs are most prevalent.
Schools The schools in the following table are providers of Radiologic Technologist and Technician programs in Maine.
Provider City Central Maine Community College Auburn Central Maine Medical Center Lewiston Eastern Maine Community College Bangor Kennebec Valley Community College Fairfield Mercy Hospital School of Radiologic Tech. Portland Mid-Maine Medical Center School of Radiology Waterville Southern Maine Community College Portland St. Joseph’s College Standish

1 0 H E A L T H T E C H N O L O G I S T S A N D T E C H N I C I A N S
180
The following table represents the completers of Radiologic Technologist and Technician programs in Maine during the 2003-2004 academic year.
Radiologic Technologist and Technician Program Completers: 2003-2004 Institution Award Level Completers
CMCC Associate’s Degree 6 EMCC Associate’s Degree 10
Mercy Hospital Award of at least 2 but less
than 4 academic years 9 St. Joseph’s Associate’s Degree 6 St. Joseph’s Bachelor’s Degree 7
Statewide Employment Radiologic Technologists and Technicians are expected to experience more growth (2.1% annually) than that of the all occupations average (1.0%). The following table lists relevant employment and projection data for Radiologic Technologists and Technicians.
2002 Estimated Employment
2012 Projected Employment
Total 2002 – 2012 Employment Change
Annual Average Percent Change
824 1,015 191 2.1 The preceding 10-year employment change reflects the growth that these occupations are expected to experience, but replacement needs must also be considered. The following table illustrates annual growth and replacement needs for Radiologic Technologists and Technicians.
Total Annual Average
Openings
Annual Average Openings Due to
Growth
Annual Average Openings Due to
Replacement
Radiologic Technologists and Technicians 34 (100%) 19 (55.9%) 15 (44.1%)
All Occupations (%) 100% 33.70% 66.30% The top four industries that employ the most Radiologic Technologists and Technicians are hospitals (with 81.4% of all Radiologic Technologists and Technicians), ambulatory health care services (with 16.9%), administrative and support services, and educational services.
Maine Job Vacancies For Radiologic Technologists and Technicians, the number of job vacancies in 2005 was higher than the number of job vacancies in 2002, although the job vacancy rate was nearly the same. Findings from the Maine Job Vacancy Survey are summarized in the table on the following page.

1 0 H E A L T H T E C H N O L O G I S T S A N D T E C H N I C I A N S
181
2002 Vacancies
2002 Job Vacancy Rate
2005 Vacancies
2005 Job Vacancy
Rate
Change in
Vacancies
Change in Job Vacancy
Rate 61 7.80% 74 7.60% 13 -0.20%
Wages Annual and hourly wage data for entry-level and experienced Radiologic Technologists and Technicians, as well average state and national wages, are supplied in the following table. Maine Maine National Entry Experienced Mean Mean
% of National
Hourly $16.74 $24.77 $22.09 $22.07 Annual $34,819 $51,522 $45,947 $45,906 100.01%
National Employment Radiologic Technologists and Technicians are expected to experience an annual average growth rate of 2.1 percent, which is faster than the 1.4 percent growth rate for all occupations in the United States. The table on the following page illustrates the net change, growth rate and expected employment for these occupations in 2012.
2002 Estimated Employment
2012 Projected Employment
Total 2002 – 2012 Employment
Change
Annual Average Percent Change
Radiologic Technologist & Technicians
174,000 214,000 40,000 2.1
Outlook Job opportunities are expected to be favorable. Some employers report difficulty hiring sufficient numbers of radiologic technologists and technicians. Imbalances between the demand for, and supply of, radiologic technologists and technicians should spur efforts to attract and retain qualified workers, such as improved compensation and working conditions. Radiologic technologists who also are experienced in more complex diagnostic imaging procedures will have better employment opportunities. Employment of radiologic technologists and technicians is expected to grow faster than the average for all occupations through 2014, as the population grows and ages, increasing the demand for diagnostic imaging. Although healthcare providers are enthusiastic about the clinical benefits of new technologies, the extent to which they are adopted depends largely on cost and reimbursement considerations. Some promising new technologies may not

1 0 H E A L T H T E C H N O L O G I S T S A N D T E C H N I C I A N S
182
come into widespread use because they are too expensive and third-party payers may not be willing to pay for their use. Hospitals will remain the principal employer of radiologic technologists and technicians. However, a greater number of new jobs will be found in offices of physicians and diagnostic imaging centers. Health facilities such as these are expected to grow rapidly through 2014, due to the strong shift toward outpatient care, encouraged by third-party payers and made possible by technological advances that permit more procedures to be performed outside the hospital. Some job openings also will arise from the need to replace technologists and technicians who leave the occupation.

1 0 H E A L T H T E C H N O L O G I S T S A N D T E C H N I C I A N S
183
Emergency Medical Technicians and Paramedics
Occupational Description Emergency Medical Technicians and Paramedics assess injuries, administer emergency medical care, extricate trapped individuals, and transport injured or sick persons to medical facilities.
Characteristics Characteristic data for Emergency Medical Technicians and Paramedics is to be obtained from a survey which accompanies the relicensure process. The relicensure of these professionals in Maine occurs every three years during the month in which the professional originally licensed. As a result, a full data set will not be available until a full three-year period has been surveyed.
Educational Requirements Formal training and certification at many different levels is needed to become an EMT. The EMT-Basic represents the first level of skills required to work in the emergency medical system. EMT- Intermediate training requirements vary from State to State. Training commonly includes 35 to 55 hours of additional instruction beyond EMT-Basic coursework and covers patient assessment, as well as the use of advanced airway devices and intravenous fluids. The most advanced level of training for this occupation is EMT- Paramedic. The Paramedic Technology program usually lasts up to 2 years and results in an associate degree in applied science.
Schools The schools in the following table are providers of Emergency Medical Technician programs in Maine.
Provider City Eastern Maine Community College Bangor Northern Maine Community College Presque Isle Southern Maine Community College South Portland
The following table presents the completers of the Emergency Medical Technician program during 2002. This table represents the individuals who have completed the most advanced levels of training for this occupation. This table does not reflect those completing basic EMT programs.

1 0 H E A L T H T E C H N O L O G I S T S A N D T E C H N I C I A N S
184
Title Credential Attained Completers
Emergency Medical Tech./Technician
Associate’s Degree 2
Emergency Medical Tech./Technician
Postsecondary Awards/ Cert./Diplomas; 1-2 yrs
1
Statewide Employment The number of Emergency Medical Technicians and Paramedics employed in Maine in 2002 was 1,512. It is projected that in 2012 there will be 1,830. This represents an annual average growth rate of 1.9 percent, faster than the 1.0 percent growth rate for all occupations in Maine.
2002 Estimated Employment
2012 Projected Employment
Total 2002 – 2012 Employment Change
Annual Average Percent Change
1,512 1,830 318 1.9 In addition to growth, replacement needs for EMTs must also be considered. The following table illustrates growth plus replacement needs for this occupation.
Total Annual Average Openings
Annual Average Openings Due to
Growth
Annual Average Openings Due to
Replacement EMTs (Total) 49 32 17
EMTs (%) 100% 65.30% 34.70% All Occupations (%) 100% 33.70% 66.30%
The two industries that employ the most Emergency Medical Technicians and Paramedics in Maine are ambulatory health care services (with 45.5% of all Emergency Medical Technicians and Paramedics) and hospitals (23.4%).
Maine Job Vacancies In 2002, there were an estimated 149 job vacancies for Emergency Medical Technicians and Paramedics, which, compared with total employment for the occupation, showed a job vacancy rate of 11.2%. In 2005, the result of the survey was markedly different, as only 75 vacancies were estimated and the job vacancy rate had fallen to 4.8%.
2002 Vacancies
2002 Job Vacancy
Rate 2005
Vacancies 2005 Job
Vacancy Rate
Change in
Vacancies
Change in Job Vacancy
Rate 149 11.20% 75 4.80% -74 -6.4

1 0 H E A L T H T E C H N O L O G I S T S A N D T E C H N I C I A N S
185
Wages Annual and hourly wage data for entry-level and experienced Emergency Medical Technicians, as well average state and national wages, are supplied in the following table.
Maine Maine National Entry Experienced Mean Mean
% of National
Hourly $8.31 $13.62 $11.85 $13.43 Annual $17,320 $28,320 $24,648 $27,940
88.2%
National Employment In 2002, there were an estimated 179,000 Emergency Medical Technicians and Paramedics employed in the United States. In 2012, it is projected that there will be 238,000; this represents an annual average growth rate of 2.9 percent, faster than the 1.4 percent growth rate for all occupations in the United States, as shown in the following table.
2002 Estimated Employment
2012 Projected Employment
Total 2002 – 2012 Employment Change
Annual Average Percent Change
179,000 238,000 59,000 2.9
Outlook Nationally, employment of emergency medical technicians and paramedics is expected to grow faster than the average for all occupations through 2012. Population growth and urbanization will increase the demand for full-time paid EMTs and paramedics rather than for volunteers. There will still be demand for part-time, volunteer EMTs and paramedics in rural areas and smaller metropolitan areas. In addition to those arising from job growth, openings will occur because of replacement needs; some workers leave the occupation because of stressful working conditions, limited potential for advancement, and the modest pay and benefits in private-sector jobs. Most opportunities for EMTs and paramedics are expected to found in private ambulance services. Competition will be greater for jobs in local government, including fire, police, and independent third-service rescue squad departments, in which salaries and benefits tend to be slightly better. Opportunities will be best for those who have advanced certifications, such as EMT-Intermediate and EMT-Paramedic, as clients and patients demand higher levels of care before arriving at the hospital.


187
Dietitians, Nutritionists, and Related The number of dietitian positions in nursing care facilities and in State government is expected to decline slightly, as these establishments continue to contract out food service operations. However, employment is expected to grow rapidly in contract providers of food services, outpatient care centers, and offices of physicians and other health practitioners.
Dietitians and Nutritionists 189 Dietetic Technicians 193
Chapter
11


1 1 D I E T I T I A N S , N U T R I T I O N I S T S , A N D R E L A T E D
189
Dieticians and Nutritionists
Occupational Description Dieticians and Nutritionists plan and conduct food service or nutritional programs to assist in the promotion of health and control of disease. They may supervise activities of a department providing quantity food services, counsel individuals, or conduct nutritional research.
Characteristics The licensure of Dieticians and Nutritionists is carried out by the Board of Licensing of Dietetic Practice. Relicensure for occupations governed by this board occur annually by December 31st. This year, a survey will accompany the relicensure process and this data should be available in the next edition of this report.
Educational Requirements Dietitians and nutritionists need at least a bachelor's degree in dietetics, foods and nutrition, food service systems management, or a related area. Students interested in research, advanced clinical positions, or public health may need an advanced degree.
Schools The only institution in Maine offering a program directly related to this occupation is the University of Maine at Orono. UMO offers a Food Science and Human Nutrition program, which is an instructional program that generally describes the study of the role of food and nutrition in individual and family health and wellness, and in the study of food production, preparation and service operations. This program also includes instruction in food product consumption, nutritional care and education, and the organization and administration of food systems.26
This department has over 100 undergraduate students studying in one of three academic concentrations: Food Science, Human Nutrition, and Food Management. Also, the department has about 35 graduate students studying for Master’s degree in Food Science and Ph. d in Food and Nutrition Sciences.26
Statewide Employment There were 252 Dieticians and Nutritionists employed in Maine in 2002, and this occupation is expected to experience more rapid growth (2.1% annually) than that of the all occupations average (1.0%). The table on the following page lists relevant employment and projection data.

1 1 D I E T I T I A N S , N U T R I T I O N I S T S , A N D R E L A T E D
190
2002 Estimated Employment
2012 Projected Employment
Total 2002 – 2012 Employment Change
Annual Average Percent Change
252 310 58 2.1 Replacement needs for this occupation must also be considered. An additional 7 annual openings for Dieticians and Nutritionists are projected and attributed to replacement needs, as shown in the following table.
Total Annual Average
Openings
Annual Average Openings Due
to Growth
Annual Average Openings Due to
Replacement
Dieticians and Nutritionists (Total)
13 6 7
Dieticians and Nutritionists (%)
100% 46.2% 53.8%
All Occupations (%)
100% 33.7% 66.3%
The top five industries that employ the most Dieticians and Nutritionists in Maine are hospitals (with 42.4% of all Dieticians and Nutritionists), membership organizations and associations (13.9%), ambulatory health care services (12.2%), social assistance (9.2%), and nursing and residential care facilities (8.8%).
Wages Annual and hourly wage data for entry-level and experienced Dieticians and Nutritionists, as well average state and national wages, are supplied in the following table.
Maine Maine National Entry Experienced Mean Mean
% of National
Hourly $13.53 $21.91 $19.12 $21.87 Annual $28,140 $40,010 $39,769 $45,490
87.4%
National Employment In 2002, there were an estimated 49,000 Dieticians and Nutritionists employed in the United States. In 2012, it is projected that there will be 58,000; this represents an annual average growth rate of 1.7 percent, faster than the 1.4 percent growth rate for all occupations in the United States. The following table illustrates the net change, growth rate and expected employment for this occupation in 2012.
2002 Estimated Employment
2012 Projected Employment
Total 2002 – 2012 Employment Change
Annual Average Percent Change
49,000 58,000 9,000 1.7

1 1 D I E T I T I A N S , N U T R I T I O N I S T S , A N D R E L A T E D
191
Outlook Nationally, employment of dietitians is expected to grow about as fast as the average for all occupations through 2012 as a result of increasing emphasis on disease prevention through improved dietary habits. A growing and aging population will boost the demand for meals and nutritional counseling in hospitals, nursing care facilities, schools, prisons, community health programs, and home healthcare agencies. Public interest in nutrition and increased emphasis on health education and prudent lifestyles will also spur demand, especially in management. In addition to employment growth, job openings will result from the need to replace experienced workers who leave the occupation. The number of dietitian positions in nursing care facilities and in State government is expected to decline slightly, as these establishments continue to contract out food service operations. However, employment is expected to grow rapidly in contract providers of food services, outpatient care centers, and offices of physicians and other health practitioners. Employment growth for dietitians and nutritionists may be constrained if some employers substitute other workers, such as health educators, food service managers, and dietetic technicians. Growth also may be curbed by limitations on insurance reimbursement for dietetic services.


1 1 D I E T I T I A N S , N U T R I T I O N I S T S , A N D R E L A T E D
193
Dietetic Technicians
Occupational Description Dietetic Technicians provide services in areas of food service management. They instruct individuals in the principles of food and nutrition, and provide dietary counseling under the direction of dietitians.
Characteristics The licensure of Dietetic Technicians is carried out by the Board of Licensing of Dietetic Practice. Relicensure for occupations governed by this board occur annually by December 31st. This year, a survey will accompany the relicensure process and this data should be available in the next edition of this report.
Educational Requirements After completing two years (associate degree), combining classroom and supervised practical experience, at a U.S. regionally accredited college or university, individuals are eligible to take the registration examination for dietetic technicians. Those who pass the exam become Dietetic Technicians, Registered, and can use the initials "DTR" after their names.
Schools The schools in the following table are providers of a Dietetic Technician program in Maine.
Provider City Southern Maine Community College South Portland Washington County Community College Calais
The number of completers of the aforementioned programs during the 2003-2004 academic year is illustrated in the table below.
Dietetic Technician & Related Program Completers: 2003-2004 Institution Award Level Completers
SMCC Associate's Degree 5 WCCC Associate's Degree 4

1 1 D I E T I T I A N S , N U T R I T I O N I S T S , A N D R E L A T E D
194
Statewide Employment There were 162 Dietetic Technicians employed in Maine in 2002, and this occupation is expected to experience more rapid growth (2.2% annually) than that of the all occupations average (1.0%). The following table lists relevant employment and projection data.
2002 Estimated Employment
2012 Projected Employment
Total 2002 – 2012 Employment Change
Annual Average Percent Change
162 201 39 2.2 Replacement needs for this occupation must also be considered. An additional 2 annual openings for Dietetic Technicians are projected and attributed to replacement needs, as shown in the following table.
Total Annual
Average Openings
Annual Average Openings Due to
Growth
Annual Average Openings Due to
Replacement Dietetic Technicians (Total) 6 4 2
Dietetic Technicians (%) 100% 66.7% 33.3% All Occupations (%) 100% 33.7% 66.3%
The top three industries that employ the most Dietetic Technicians in Maine are hospitals (with 64.8% of all Dietetic Technicians), ambulatory health care services (8.0%), and nursing and residential care facilities (8.0%).
Wages Annual and hourly wage data for entry-level and experienced Dietetic Technicians, as well average state and national wages, are supplied in the following table. This is one of the few healthcare occupations in which the Maine average is higher than the National average.
Maine Maine National Entry Experienced Mean Mean
% of National
Hourly $10.06 $13.86 $12.59 $12.21 Annual $20,930 $28,820 $26,187 $25,390
103.1%
National Employment In 2002, there were an estimated 29,000 Dietetic Technicians employed in the United States. In 2012, it is projected that there will be 35,000; this represents an annual average growth rate of 1.9 percent, faster than the 1.4 percent growth rate for all occupations in the United States. The table on the following page illustrates the net change, growth rate and expected employment for this occupation in 2012.

1 1 D I E T I T I A N S , N U T R I T I O N I S T S , A N D R E L A T E D
195
2002 Estimated
Employment 2012 Projected Employment
Total 2002 – 2012 Employment Change
Annual Average Percent Change
29,000 35,000 6,000 1.9
Outlook Increased emphasis on disease prevention through improved dietary habits will spur growth for dietary occupations. As awareness increases, additional opportunities for Dietetic Technicians, specifically, may develop as employers shift responsibilities to a greater number of Dietetic Technicians rather than Dietitians and Nutritionists in an effort to reduce costs. This shift may be in part to reduced insurance reimbursements for dietetic services.
In Maine, employment growth of Dietetic Technicians is expected to be faster than that of growth of these same professionals on a national level. Although this occupation is also expected to grow faster than the Maine all-industries average, the relative small size of this occupation ultimately translates to a limited number of openings a year.


197
Speech-Language Pathology and Audiology Because hearing loss is strongly associated with aging, rapid growth in the population age 55 and over will cause the number of persons with hearing impairment to increase markedly. In addition, members of the baby boom generation are now entering middle age, when the possibility of neurological disorders and associated hearing impairments increases. Medical advances are also improving the survival rate of premature infants and trauma and stroke victims, who then need assessment and possible treatment. Many States now require that all newborns be screened for hearing loss and receive appropriate early intervention services. Audiologists 199 Speech-Language Pathologists 203
Chapter
12


1 2 S P E E C H - L A N G U A G E P A T H O L O G Y A N D A U D I O L O G Y
199
Audiologists
Occupational Description Audiologists assess and treat persons with hearing and related disorders. They may fit hearing aids and provide auditory training. Audiologist may also perform research.
Characteristics Audiologists are licensed by the Board of Examiners on Speech Pathology and Audiology, and those occupations regulated by this board are relicensed in even years on February 28th. A survey was included in this year’s renewal process, but low response rates limit the validity of this data. Further efforts will be taken to develop an acceptable dataset, and any data provided by will be reported in the next edition of this report.
Educational Requirements Of the 48 States that require a license to practice audiology, almost all require that individuals have a master’s degree in audiology or the equivalent; however, a clinical doctoral degree is expected to become the new standard. A passing score on a national examination on audiology offered through the Praxis Series of the Educational Testing Service is needed, as well. Other requirements are 300 to 375 hours of supervised clinical experience and 9 months of postgraduate professional clinical experience. An additional examination may be required in order to dispense hearing aids.
Schools Approximately 107 colleges and universities offer graduate programs in audiology in the United States. Roughly 39 of these offer a Doctor of Audiology (Au. D.) degree. Only one Maine school, the University of Maine at Orono, currently offers a program directly related to audiology. UMO offers a Communication Sciences and Disorders program, and the school’s Master’s program has graduated an estimated 200 students in the last ten years. The New England Board of Higher Education’s RSP Tuition Break program allows Maine residents to attend participating New England colleges and universities at a discounted rate when the major they wish to pursue isn’t available in Maine. Participating schools offering Audiology programs are listed in the table on the following page.
Provider City Southern Connecticut State University (Master’s) New Haven, CT University of Rhode Island (Doctoral) Kingston, RI University of Connecticut (Doctoral) Storrs, CT

1 2 S P E E C H - L A N G U A G E P A T H O L O G I S T S A N D A U D I O L O G I S T S
200
Statewide Employment There were 42 Audiologists employed in Maine in 2002, and this occupation is expected to experience more growth (2.5% annually) than that of the all occupations average (1.0%). The following table lists relevant employment and projection data.
2002 Estimated Employment
2012 Projected Employment
Total 2002 – 2012 Employment Change
Annual Average Percent Change
42 54 12 2.5
Although audiology as an occupation is projected to grow at a faster rate than that of all occupations, it is important to consider the relative size of the occupation when one considers annual growth and replacement needs. The following table illustrates these projected needs for Audiologists.
Total Annual
Average Openings
Annual Average Openings Due to
Growth
Annual Average Openings Due to
Replacement Audiologists (Total) 2 1 1
Audiologists (%) 100% 50.0% 50.0% All Occupations (%) 100% 33.7% 66.3%
The top two industries that employed the most Audiologists were ambulatory health care services (with 30.8% of all Audiologists) and hospitals (23.1%).
Wages Annual and hourly wage data for entry-level and experienced Audiologists, as well average state and national wages, are supplied in the following table.
Maine Maine National Entry Experienced Mean Mean
% of National
Hourly $20.16 $26.80 $24.58 $27.51 Annual $41,930 $55,740 $51,126 $57,220
89.3%
National Employment In 2002, there were an estimated 11,000 audiologists employed in the United States. In 2012, it is projected that there will be 14,000; this represents an annual average growth rate of 2.4 percent, faster than the 1.4 percent growth rate for all occupations in the United States. The table on the following page illustrates the net change, growth rate and expected employment for this occupation in 2012.

1 2 S P E E C H - L A N G U A G E P A T H O L O G Y A N D A U D I O L O G Y
201
2002 Estimated
Employment 2012 Projected Employment
Total 2002 – 2012 Employment Change
Annual Average Percent Change
11,000 14,000 3,000 2.4
Outlook Employment of audiologists is expected to grow faster than the average for all occupations through the year 2012. Because hearing loss is strongly associated with aging, rapid growth in the population age 55 and over will cause the number of persons with hearing impairment to increase markedly. In addition, members of the baby boom generation are now entering middle age, when the possibility of neurological disorders and associated hearing impairments increases. Medical advances are also improving the survival rate of premature infants and trauma and stroke victims, who then need assessment and possible treatment. Many States now require that all newborns be screened for hearing loss and receive appropriate early intervention services. Employment in educational services will increase along with growth in elementary and secondary school enrollments, including enrollment of special education students. Federal law guarantees special education and related services to all eligible children with disabilities. Greater awareness of the importance of early identification and diagnosis of hearing disorders will also increase employment. The number of audiologists in private practice will rise due to the increasing demand for direct services to individuals as well as increasing use of contract services by hospitals, schools, and nursing care facilities. Only a few job openings for audiologists will arise from the need to replace those who leave the occupation, because the occupation is small.


1 2 S P E E C H - L A N G U A G E P A T H O L O G Y A N D A U D I O L O G Y
203
Speech-Language Pathologists
Occupational Description Speech-Language Pathologists, sometimes referred to as Speech Therapists, work with people who cannot make speech sounds, or cannot make them clearly; those with speech rhythm and fluency problems, such as stuttering; those with problems understanding and producing language; those who wish to improve their communication skills by modifying an accent.; those with cognitive communication impairments; those with hearing loss; and those with swallowing difficulties. These professionals assess and treat persons with speech, language, voice, and fluency disorders and may select alternative communication systems and teach their use.
Characteristics Speech-Language Pathologists are licensed by the Board of Examiners on Speech Pathology and Audiology, and those occupations regulated by this board are relicensed in even years on February 28th. A survey was included in this year’s renewal process, but low response rates limit the validity of this data. Further efforts will be taken to develop an acceptable dataset.
Educational Requirements To be eligible for licensure in Maine as a Speech-Language Pathologist, a person must possess at least a master’s degree, which is consistent with the requirements for American Speech and Hearing Association Certificate of Clinical Competency in Speech Pathology or Audiology.
Schools Only one Maine school, the University of Maine at Orono, currently offers a program directly related to speech-language pathology. UMO offers a Communication Sciences and Disorders program, and the school’s Master’s program has graduated an estimated 200 students in the last ten years.
Statewide Employment There were 715 Speech-Language Pathologists employed in Maine in 2002, and this occupation is expected to experience more growth (2.0% annually) than that of the all occupations average (1.0%), as shown in the following table.
2002 Estimated Employment
2012 Projected Employment
Total 2002 – 2012 Employment Change
Annual Average Percent Change
715 871 156 2.0
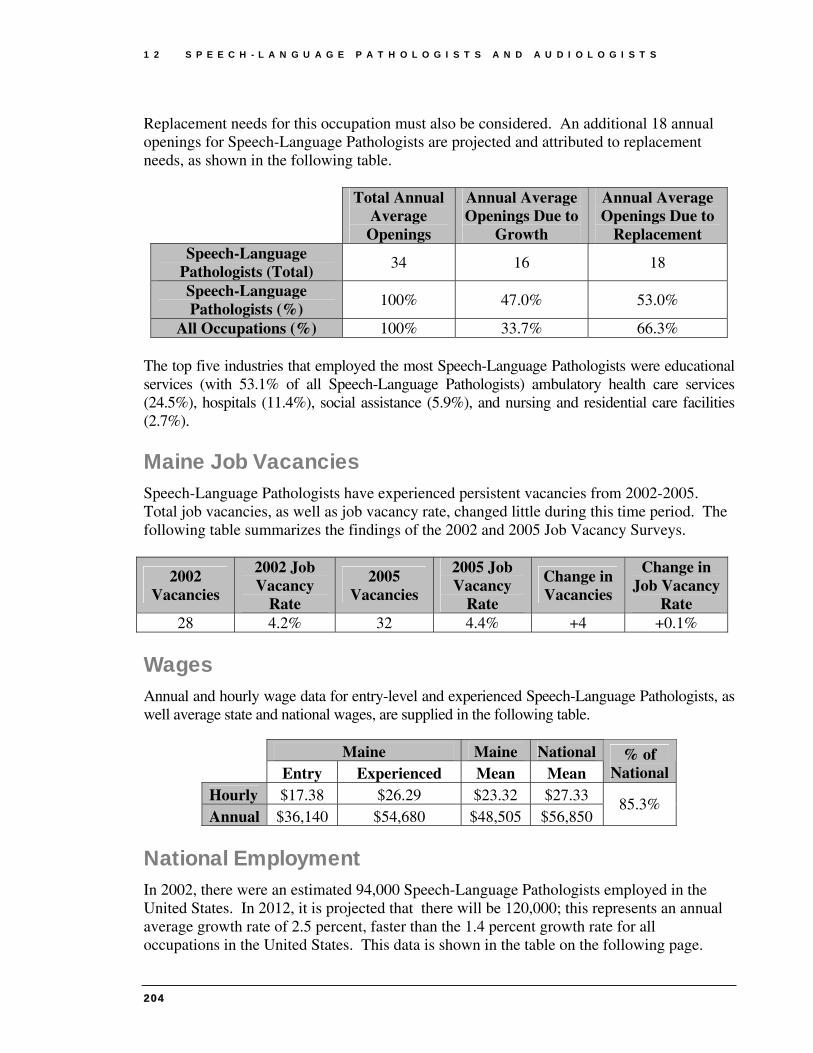
1 2 S P E E C H - L A N G U A G E P A T H O L O G I S T S A N D A U D I O L O G I S T S
204
Replacement needs for this occupation must also be considered. An additional 18 annual openings for Speech-Language Pathologists are projected and attributed to replacement needs, as shown in the following table.
Total Annual
Average Openings
Annual Average Openings Due to
Growth
Annual Average Openings Due to
Replacement Speech-Language
Pathologists (Total) 34 16 18
Speech-Language Pathologists (%)
100% 47.0% 53.0%
All Occupations (%) 100% 33.7% 66.3% The top five industries that employed the most Speech-Language Pathologists were educational services (with 53.1% of all Speech-Language Pathologists) ambulatory health care services (24.5%), hospitals (11.4%), social assistance (5.9%), and nursing and residential care facilities (2.7%).
Maine Job Vacancies Speech-Language Pathologists have experienced persistent vacancies from 2002-2005. Total job vacancies, as well as job vacancy rate, changed little during this time period. The following table summarizes the findings of the 2002 and 2005 Job Vacancy Surveys.
2002 Vacancies
2002 Job Vacancy
Rate
2005 Vacancies
2005 Job Vacancy
Rate
Change in Vacancies
Change in Job Vacancy
Rate 28 4.2% 32 4.4% +4 +0.1%
Wages Annual and hourly wage data for entry-level and experienced Speech-Language Pathologists, as well average state and national wages, are supplied in the following table.
Maine Maine National Entry Experienced Mean Mean
% of National
Hourly $17.38 $26.29 $23.32 $27.33 Annual $36,140 $54,680 $48,505 $56,850
85.3%
National Employment In 2002, there were an estimated 94,000 Speech-Language Pathologists employed in the United States. In 2012, it is projected that there will be 120,000; this represents an annual average growth rate of 2.5 percent, faster than the 1.4 percent growth rate for all occupations in the United States. This data is shown in the table on the following page.

1 2 S P E E C H - L A N G U A G E P A T H O L O G Y A N D A U D I O L O G Y
205
2002 Estimated Employment
2012 Projected Employment
Total 2002 – 2012 Employment Change
Annual Average Percent Change
94,000 120,000 26,000 2.5
Outlook Employment of speech-language pathologists is expected to grow faster than the average for all occupations through the year 2012. Members of the baby boom generation are now entering middle age, when the possibility of neurological disorders and associated speech, language, swallowing, and hearing impairments increases. Medical advances are also improving the survival rate of premature infants and trauma and stroke victims, who then need assessment and possible treatment. Many States now require that all newborns be screened for hearing loss and receive appropriate early intervention services. In health services facilities, the impact of proposed Federal legislation imposing limits on reimbursement for therapy services may adversely affect the short-term job outlook for therapy providers. However, over the long run, the demand for therapists should continue to rise as growth in the number of individuals with disabilities or limited function spurs demand for therapy services. Employment in educational services will increase along with growth in elementary and secondary school enrollments, including enrollment of special education students. Federal law guarantees special education and related services to all eligible children with disabilities. Greater awareness of the importance of early identification and diagnosis of speech, language, swallowing, and hearing disorders will also increase employment. The number of speech-language pathologists in private practice will rise due to the increasing use of contract services by hospitals, schools, and nursing care facilities. In addition to job openings stemming from employment growth, a number of openings for speech-language pathologists will arise from the need to replace those who leave the occupation.


207
Mental Health Professionals Social Workers 209
Substance Abuse and Behavioral Disorder Counselors 215
Psychologists 219
Chapter
13


1 3 M E N T A L H E A L T H P R O F E S S I O N A L S
209
Social Workers
Occupational Description Mental Health and Substance Abuse Social Workers assess and treat individuals with mental, emotional, or substance abuse problems, including abuse of alcohol, tobacco, and/or other drugs. Typical activities for these professionals may include individual and group therapy, crisis intervention, case management, client advocacy, prevention, and education. Child, Family, and School Social Workers provide social services and assistance to improve the social and psychological functioning of children and their families and to maximize the family well-being and the academic functioning of children. They may assist single parents, arrange adoptions, and find foster homes for abandoned or abused children. In schools, they address such problems as teenage pregnancy, misbehavior, and truancy. Medical and Public Health Social Workers provide persons, families, or vulnerable populations with the psychosocial support needed to cope with chronic, acute, or terminal illnesses, such as Alzheimer's, cancer, or AIDS. Typical services for these professionals include advising family care givers, providing patient education and counseling, and making necessary referrals for other social services.
Characteristics Social Workers in Maine are governed by the State Board of Social Worker Licensure and relicensed every two years on the anniversary of their first license date. As a result of this relicensure schedule, data collection efforts through a survey accompanying the relicensure process are not currently complete.

1 3 M E N T A L H E A L T H P R O F E S S I O N A L S
210
Educational Requirements
A bachelor's degree in social work (BSW) degree is the most common minimum requirement to qualify for a job as a social worker; however, majors in psychology, sociology, and related fields may be sufficient to qualify for some entry-level jobs, especially in small community agencies. Although a bachelor's degree is required for entry into the field, an advanced degree has become the standard for many positions. A master's degree in social work (MSW) is necessary for positions in health and mental health settings and typically is required for certification for clinical work. Jobs in public agencies also may require an advanced degree, such as a master's degree in social service policy or administration. Supervisory, administrative, and staff training positions usually require an advanced degree. College and university teaching positions and most research appointments normally require a doctorate in social work (DSW or PhD).
Schools The schools in the following table are providers of Baccalaureate and Masters Degree Social Work programs in Maine.
Provider City Saint Joseph’s College (BSW) Standish University of Maine (BSW) Orono University of Maine at Presque Isle (BSW) Presque Isle University of Southern Maine (BSW) Portland University of Maine (MSW) Orono University of New England (MSW) Portland University of Southern Maine (MSW) Portland
The following table represents the completers of responding Social Work programs in Maine for the 2004-2005 academic year.
Social Work Program Completers: 2003-2004 Institution Award Level Completers
UMO Bachelor’s Degree 27 UMO Master’s Degree 25 UMPI Bachelor’s Degree 15 UNE Master’s Degree 70 USM Bachelor’s Degree 30 USM Master’s Degree 29
Statewide Employment As a whole, Social Workers are expected to experience more rapid growth than that of the all occupations average in Maine. Among Social Workers, those specializing in Mental

1 3 M E N T A L H E A L T H P R O F E S S I O N A L S
211
Health and Substance Abuse are projected to experience the most growth. The following table lists relevant employment and projection data.
2002
Estimated Employment
2012 Estimated
Employment
Total 2002-2012
Employment Change
Annual Average Percent Change
Mental Health and Substance Abuse
1,375 1,918 543 3.4
Child, Family, and School 2,089 2,582 493 2.1
Spec
ialt
y
Medical and Public Health
671 911 240 3.1
Replacement needs for this occupation must also be considered. The following table illustrates these needs for Social Workers
Total Annual
Average Openings
Annual Average Openings Due to
Growth
Annual Average Openings Due to
Replacement Mental Health and
Substance Abuse (Total) 78 (100%) 54 (69.2%) 24 (30.8%)
Child, Family, and School (Total)
85 (100%) 49 (57.6%) 36 (42.4%)
Medical and Public Health (Total)
36 (100%) 24 (66.7%) 12 (33.3%)
All Occupations (%)
100% 33.7% 66.3%
The top five industries in terms of employment of Mental Health and Substance Abuse Social Workers in Maine are ambulatory health care services (with 24.1% of all Mental Health and Substance Abuse Social Workers), social assistance (20.4%), hospitals (11.5%), nursing and residential care facilities (10.3%), and membership organizations and associations (7.6%).
The top six industries in terms of employment of Child, Family, and School Social Workers in Maine are social assistance (with 39.3% of all Child, Family, and School Social Workers), educational services (11.2%), nursing and residential care facilities (6.3%), ambulatory health care services (6.1%), membership organizations and associations (3.4%), and hospitals (0.9%).
The top five industries in terms of employment of Medical and Public Health Social Workers in Maine are ambulatory health care services (with 25.7% of all Medical and Public Health Social Workers), nursing and residential care facilities (24.3%), social assistance (22.0%), hospitals (21.7%), and membership organizations and associations (1.8%).

1 3 M E N T A L H E A L T H P R O F E S S I O N A L S
212
Wages 2004 hourly wages for Social Workers in Maine are summarized in the table below.
Social Workers: Hourly Wages Maine Maine National Entry Experienced Mean Mean
% of National
Mental Health and Substance Abuse Social Workers $11.56 $20.22 $17.33 $17.61 98.4%
Child, Family, and School Social Workers $13.21 $19.44 $13.21 $18.40 71.8%
Medical and Public Health Social Workers $13.93 $23.34 $20.20 $20.32 99.4%
National Employment Nationally, Social Workers of all specialties are expected to experience more rapid growth than that of the national all-occupations average. Employment estimates, projections and annual percent changes for Social Workers (by specialty) are provided in the table below.
Specialty 2002
Estimated Employment
2012 Projected
Employment
Total 2002 – 2012
Employment Change
Annual Average Percent Change
Mental Health and Substance Abuse 94,830 127,600 32,770 3.0
Child, Family, and School
274,110 337,720 63,610 2.1
Medical and Public Health
107,060 137,770 30,710 2.6
Outlook Competition for social worker jobs is strongest in cities, where demand for services often is highest and training programs for social workers are prevalent. However, opportunities should be good in rural areas, which often find it difficult to attract and retain qualified staff. By specialty, job prospects may be best for those social workers with a background in

1 3 M E N T A L H E A L T H P R O F E S S I O N A L S
213
gerontology and substance abuse treatment. Employment of social workers is expected to grow faster than the average for all occupations through 2012. The rapidly growing elderly population and the aging baby boom generation will create greater demand for health and social services, resulting in particularly rapid job growth among gerontology social workers. Many job openings also will stem from the need to replace social workers who leave the occupation. As hospitals continue to limit the length of patient stays, the demand for social workers in hospitals will grow more slowly than in other areas. Because hospitals are releasing patients earlier than in the past, social worker employment in home healthcare services is growing. However, the expanding senior population is an even larger factor. Employment opportunities for social workers with backgrounds in gerontology should be good in the growing numbers of assisted-living and senior-living communities. The expanding senior population will also spur demand for social workers in nursing homes, long-term care facilities, and hospices. Employment of substance abuse social workers will grow rapidly over the 2002-12 projection period. Substance abusers are increasingly being placed into treatment programs instead of being sentenced to prison. As this trend grows, demand will increase for treatment programs and social workers to assist abusers on the road to recovery. Employment of social workers in private social service agencies will increase. However, agencies increasingly will restructure services and hire more lower-paid social and human service assistants instead of social workers. Employment in State and local government agencies may grow somewhat in response to increasing needs for public welfare, family services, and child protection services; however, many of these services will be contracted out to private agencies. Employment levels in public and private social services agencies may fluctuate, depending on need and government funding levels. Employment of school social workers also is expected to steadily grow. Expanded efforts to respond to rising student enrollments and continued emphasis on integrating disabled children into the general school population may lead to more jobs. Availability of State and local funding will be a major factor in determining the actual job growth in schools. Opportunities for social workers in private practice will expand but growth may be somewhat hindered by restrictions that managed care organizations put on mental health services. The growing popularity of employee assistance programs is expected to spur some demand for private practitioners, some of whom provide social work services to corporations on a contractual basis. However, the popularity of employee assistance programs will fluctuate with the business cycle.


1 3 M E N T A L H E A L T H P R O F E S S I O N A L S
215
Substance Abuse and Behavioral Disorder Counselors
Occupational Description Substance Abuse and Behavioral Disorder Counselors counsel and advise individuals with alcohol, tobacco, drug, or other problems, such as gambling and eating disorders. They may counsel individuals, families, or groups or engage in prevention programs.
Characteristics Alcohol and Drug Counselors in Maine are governed by the State Board of Alcohol and Drug Counselors. These professionals are relicensed annually in November, and this relicensure process will be accompanied by a survey to obtain characteristic data. This data should be available for the next edition of this report.
It is important to note that this occupational profile is based on Department of Labor data for Substance Abuse and Behavioral Disorder Counselors, which may be somewhat broader of an occupation than Alcohol and Drug Counselors.
Educational Requirements
Forty-seven states and the District of Columbia had some form of counselor credentialing, licensure, certification, or registration that governed their practice of counseling. Requirements typically include the completion of a master's degree in counseling, the accumulation of 2 years or 3,000 hours of supervised clinical experience beyond the master's degree level, the passage of a State-recognized exam, adherence to ethical codes and standards, and the satisfaction of annual continuing education requirements.
Some employers provide training for newly hired counselors. Counselors must participate in graduate studies, workshops, and personal studies to maintain their certificates and licenses.

1 3 M E N T A L H E A L T H P R O F E S S I O N A L S
216
Schools The schools in the following table are providers of Baccalaureate, Masters, and Doctoral Degree Counseling programs in Maine.
Provider City University of Southern Maine (Bacc.) Portland University of Maine (Masters) Orono University of Southern Maine (Masters) Portland University of Maine (Doctoral) Orono University of New England Biddeford
The following table presents the completers of the Substance Abuse/Addiction Counseling program during 2004.
Title Credential Attained Completers Substance Abuse/Addiction Counseling Post-baccalaureate 9
Statewide Employment There were 467 Substance Abuse and Behavioral Disorder Counselors employed in Maine in 2002, and this occupation is expected to experience more rapid growth (1.7% annually) than that of the all occupations average (1.0%). The following table lists relevant employment and projection data.
2002 Estimated Employment
2012 Projected Employment
Total 2002 – 2012 Employment Change
Annual Average Percent Change
467 551 84 1.7 Replacement needs for this occupation must also be considered. An additional 11 annual openings for Substance Abuse and Behavioral Disorder Counselors are projected and attributed to replacement needs, as shown in the following table.
Total Annual
Average Openings
Annual Average Openings Due to
Growth
Annual Average Openings Due to
Replacement Substance Abuse
Counselors (Total) 19 8 11
Substance Abuse Counselors (%)
100% 42.1% 57.9%
All Occupations (%)
100% 33.7% 66.3%
The top four industries in terms of employment of Substance Abuse and Behavioral Disorder Counselors in Maine are ambulatory health care services (with 55.7% of all Substance Abuse

1 3 M E N T A L H E A L T H P R O F E S S I O N A L S
217
and Behavioral Disorder Counselors), hospitals (18.3%), social assistance (9.7%), and nursing and residential care facilities (9.0%).
Wages Annual and hourly wage data for entry-level and experienced Substance Abuse and Behavioral Disorder Counselors, as well average state and national wages, are supplied in the following table.
Maine Maine National Entry Experienced Mean Mean
% of National
Hourly $12.60 $17.20 $15.67 $16.91 Annual $26,210 $35,770 $32,594 $35,170
92.7%
National Employment In 2002, there were an estimated 65,970 Substance Abuse and Behavioral Disorder Counselors employed in the United States. In 2012, it is projected that there will be 81,620; this represents an annual average growth rate of 2.2 percent, faster than the 1.4 percent growth rate for all occupations in the United States. The following table illustrates the net change, growth rate and expected employment for this occupation in 2012.
2002 Estimated Employment
2012 Projected Employment
Total 2002 – 2012 Employment Change
Annual Average Percent Change
65,970 81,620 15,650 2.2
Outlook Overall employment of counselors is expected to grow faster than the average for all occupations through 2012, and job opportunities should be very good because there are usually more job openings than graduates of counseling programs. In addition, numerous job openings will occur as many counselors retire or leave the profession. Demand is expected to be strong for substance abuse and behavioral, mental health, and marriage and family therapists and for rehabilitation counselors, for a variety of reasons. For one, California and a few other States have recently passed laws requiring substance abuse treatment instead of jail for people caught possessing a drug. This shift will require more substance abuse counselors in those States. Second, the increasing availability of funds to build statewide networks to improve services for children and adolescents with serious emotional disturbances and for their family members should increase employment opportunities for counselors. Under managed care systems, insurance companies are increasingly providing for reimbursement of counselors as a less costly alternative to psychiatrists and psychologists. Also, legislation is pending that may provide counseling services to Medicare recipients.


1 3 M E N T A L H E A L T H P R O F E S S I O N A L S
219
Psychologists
Occupational Description Industrial-Organizational Psychologists apply principles of psychology to personnel, administration, management, sales, and marketing problems. Typical activities for these professionals may include policy planning; employee screening, training and development; and organizational development and analysis. They may work with management to reorganize the work setting to improve worker productivity. Clinical, Counseling, and School Psychologists diagnose and treat mental disorders; learning disabilities; and cognitive, behavioral, and emotional problems using individual, child, family, and group therapies. They may design and implement behavior modification programs.
Characteristics All Psychologists are governed by the State Board of Examiners of Psychologists. These professionals are relicensed April 30th during even-numbered years. A survey accompanied the relicensure process of Psychologist, and, currently, only a partial dataset exists for this occupation. Further efforts to improve response rates for Psychologists will be undertaken, and characteristic data for this occupation will likely be available in the next edition of this report.
Educational Requirements
Persons with a master's degree in psychology may work as industrial-organizational psychologists. However, a Ph.D. will enhance job opportunities and advancement potential.
A doctoral degree is usually required for employment as a licensed clinical or counseling psychologist. Psychologists with a Ph.D. qualify for a wide range of teaching, research, clinical, and counseling positions in universities, healthcare services, elementary and secondary schools, private industry, and government. Psychologists with a Doctor of Psychology (Psy.D.) degree usually work in clinical positions or in private practices. Clinical psychologists usually must have completed the Ph.D. or Psy.D. requirements and served an internship. Psychologists in independent practice or those who offer any type of patient care (including clinical, counseling, and school psychologist) must meet certification or licensing requirements in all States and the District of Columbia.
Vocational and guidance counselors usually need 2 years of graduate study in counseling and 1 year of counseling experience. School psychology requires a master's degree followed by a 1-year internship. Psychologists in independent practice or those who offer any type of patient care (including clinical, counseling, and school psychologists) must meet certification or licensing requirements in all States and the District of Columbia.

1 3 M E N T A L H E A L T H P R O F E S S I O N A L S
220
Schools The schools in the following table are providers of Graduate Psychology programs in Maine.
Provider City College of the Atlantic Bar Harbor University of Maine at Orono Orono University of Maine at Farmington Farmington University of Maine at Machias Machias University of New England Biddeford University of Southern Maine Portland
The following table represents the completers of the Graduate Psychology programs in Maine for the 2003 -2004 academic year.
Psychology Program Completers: 2003-2004 Institution Award Level Completers
UMO Master’s Degree 12 UMO Doctoral Degree 6 USM Master’s Degree 5
Statewide Employment The vast majority of Psychologists in Maine are Clinical, Counseling, and Schools Psychologists. In 2002, these individuals accounted for 96.4% of all Psychologists in the state. Industrial-Organization Psychologists are a relatively small occupation, which, in fact, is expected to experience less growth that that of Clinical, Counseling, and School Psychologists. The following table lists relevant employment and projection data.
2002
Estimated Employment
2012 Estimated
Employment
Total 2002-2012 Employment
Change
Annual Average Percent Change
Clinical, Counseling, and School Psychologists
808 1,063 255 2.8
Spec
ialt
y
Industrial-Organizational Psychologists
30 36 6 1.8

1 3 M E N T A L H E A L T H P R O F E S S I O N A L S
221
The above 10-year employment change reflects the growth that these Psychologists are expected to experience, but replacement needs must also be considered. The following table illustrates annual growth and replacement needs for Psychologists.
Total Annual Average
Openings
Annual Average
Openings Due to Growth
Annual Average
Openings Due to Replacement
Clinical, Counseling, and School 44 (100%) 26 (59.1%) 18 (40.9%) Industrial-Organizational 2 (100%) 1 (50%) 1 (50%)
All Occupations (%) 100% 33.7% 66.3% The top five industries that employ the most Clinical, Counseling, and School Psychologists in Maine are ambulatory health care services (with 40.3% of all Clinical, Counseling, and School Psychologists), educational services (23.1%), social assistance (14.3%), hospitals (12.0%), and nursing and residential care facilities (5.9%). Most Industrial-Organizational Psychologists are employed in Professional and Technical Services.
Wages Average national and state wages for dentists, by specialty, are provided in the following table.
Psychologists: State and National Average Wages By Specialty
Specialty State Hourly
National Hourly
State Annual
National Annual
Percent of National
Clinical, Counseling, and School Psychologists $29.40 $30.45 $61,152 $63,340 96.6% Industrial-Organizational Psychologists NA $39.43 NA $82,010 NA
National Employment Nationally, both major groups of Psychologists are expected to experience faster growth than that of the all-industries average (1.4%). The following table lists relevant employment and projection data.
2002 Employment
2012 Employment
Net Change
Annual Percent Change
Clinical, Counseling, and School Psychologists 131,600 165,320 33,720 2.3%
Spec
ialt
y
Industrial-Organizational Psychologists 1,780 2,090 300 1.6%

1 3 M E N T A L H E A L T H P R O F E S S I O N A L S
222
Outlook Overall employment of psychologists is expected to grow faster than the average for all occupations through 2012, due to increased demand for psychological services in schools, hospitals, social service agencies, mental health centers, substance abuse treatment clinics, consulting firms, and private companies. Clinical, counseling, and school psychologists will grow faster than the average, while industrial-organizational psychologists will have average growth. Industrial-organizational psychologists will be in demand to help to boost worker productivity and retention rates in a wide range of businesses. Industrial-organizational psychologists will help companies deal with issues such as workplace diversity and antidiscrimination policies. Companies also will use psychologists’ expertise in survey design, analysis, and research to develop tools for marketing evaluation and statistical analysis. Demand should be particularly strong for persons holding doctorates from leading universities in applied specialties, such as counseling, health, and school psychology. Psychologists with extensive training in quantitative research methods and computer science may have a competitive edge. Master’s degree holders in fields other than school or industrial-organizational psychology will face competition for jobs, because of the limited number of positions that require only a master’s degree. Master’s degree holders may find jobs as psychological assistants or counselors, providing mental health services under the direct supervision of a licensed psychologist. Still others may find jobs involving research and data collection and analysis in universities, government, or private companies.

223
Other Healthcare Occupations Medical Equipment Preparers 225
Medical Records and Health Information Technicians 227
Athletic Trainers 231
Medical Assistants 235
Medical Transcriptionists 239
Opticians 243
Orthotists and Prosthetists 245
Chapter
14


1 4 O T H E R H E A L T H C A R E O C C U P A T I O N S
225
Medical Equipment Preparers
Occupational Description Medical Equipment Preparers sterilize, install, or clean laboratory or healthcare equipment. They may perform routine laboratory tasks and operate or inspect equipment. These individuals also purge equipment of wastes, and disinfect and sterilize equipment such as hospital beds and dialysis equipment. Medical Equipment Preparers are often in charge of inventory and equipment usage records.
Educational Requirements Medical Equipment Preparers typically receive short-term on-the-job training.
Statewide Employment There were 190 Medical Equipment Preparers employed in Maine in 2002, and this occupation is expected to experience more growth (1.7% annually) than that of the all occupations average (1.0%). The following table lists relevant employment and projection data.
2002 Estimated Employment
2012 Projected Employment
Total 2002 – 2012 Employment Change
Annual Average Percent Change
190 225 35 1.7 The above 10-year employment change reflects the growth that this occupation is expected to experience, but replacement needs must also be considered. An additional 4 annual openings for Medical Equipment Preparers are projected and attributed to replacement needs. The following table illustrates annual growth and replacement needs for Medical Equipment Preparers and the percentage of openings attributed to growth and replacement for both Medical Equipment Preparers and all occupations.
Total Annual
Average Openings
Annual Average Openings Due to
Growth
Annual Average Openings Due to
Replacement Medical Equipment Preparers (Total)
8 4 4
Medical Equipment Preparers (%)
100% 50.0% 50.0%
All Occupations (%)
100% 33.7% 66.3%
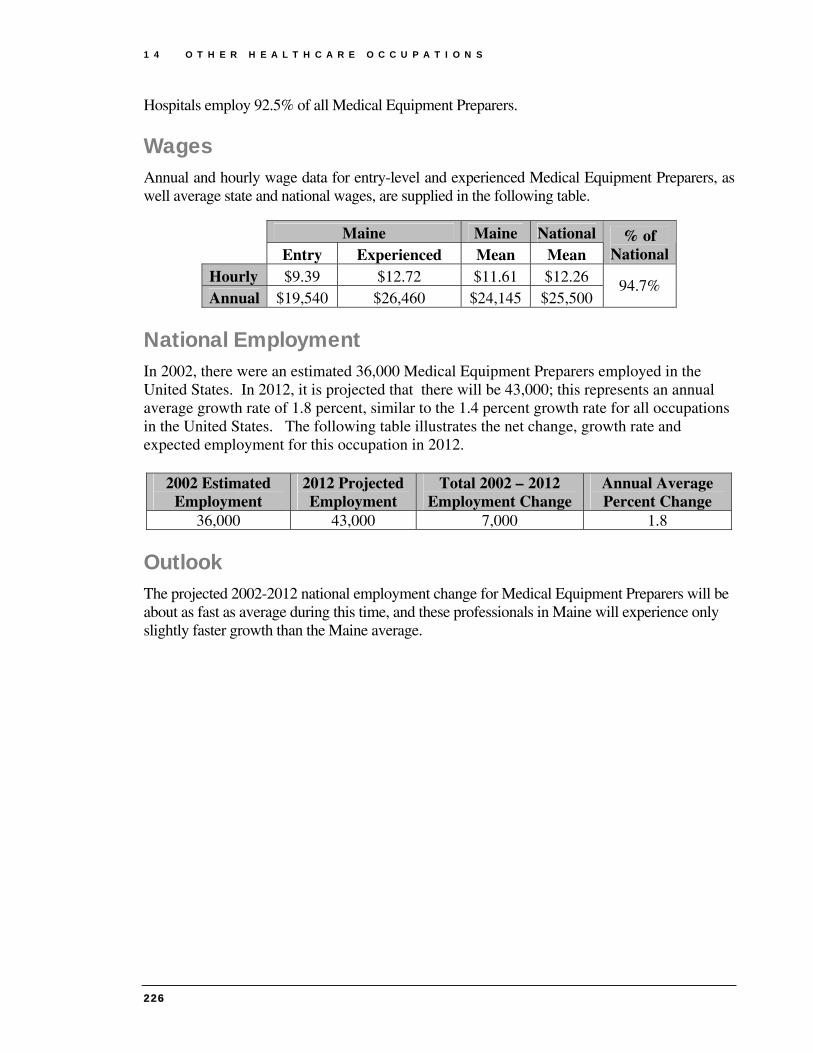
1 4 O T H E R H E A L T H C A R E O C C U P A T I O N S
226
Hospitals employ 92.5% of all Medical Equipment Preparers.
Wages Annual and hourly wage data for entry-level and experienced Medical Equipment Preparers, as well average state and national wages, are supplied in the following table.
Maine Maine National Entry Experienced Mean Mean
% of National
Hourly $9.39 $12.72 $11.61 $12.26 Annual $19,540 $26,460 $24,145 $25,500
94.7%
National Employment In 2002, there were an estimated 36,000 Medical Equipment Preparers employed in the United States. In 2012, it is projected that there will be 43,000; this represents an annual average growth rate of 1.8 percent, similar to the 1.4 percent growth rate for all occupations in the United States. The following table illustrates the net change, growth rate and expected employment for this occupation in 2012.
2002 Estimated Employment
2012 Projected Employment
Total 2002 – 2012 Employment Change
Annual Average Percent Change
36,000 43,000 7,000 1.8
Outlook The projected 2002-2012 national employment change for Medical Equipment Preparers will be about as fast as average during this time, and these professionals in Maine will experience only slightly faster growth than the Maine average.

1 4 O T H E R H E A L T H C A R E O C C U P A T I O N S
227
Medical Records and Health Information Technicians
Occupational Description Medical Records and Health Information Technicians compile, process, and maintain medical records of hospital and clinic patients in a manner consistent with medical, administrative, ethical, legal, and regulatory requirements of the health care system.
Educational Requirements
Medical records and health information technicians entering the field usually have an associate degree from a community or junior college. Advancement usually requires 2 to 4 years of job experience and completion of a hospital's in-house training program.
Schools The schools in the following table offer Health Information/Medical Records Technology programs in Maine.
Provider City Beal College Bangor Kennebec Valley Community College Fairfield
The number of completers of the aforementioned programs during the 2003-2004 academic year is illustrated in the table below.
Health Information/Medical Records Technology Program Completers: 2003-2004
Institution Award Level Completers
Beal College Award of at least 1 but less
than 2 academic years 40
KVCC Award of at least 1 but less
than 2 academic years 13 KVCC Associate’s Degree 10

1 4 O T H E R H E A L T H C A R E O C C U P A T I O N S
228
Statewide Employment There were 886 Medical Records and Health Information Technicians employed in Maine in 2002, and this occupation is expected to experience much more rapid growth (4.5% annually) than that of the all occupations average (1.0%). The following table lists relevant employment and projection data.
2002 Estimated Employment
2012 Projected Employment
Total 2002 – 2012 Employment Change
Annual Average Percent Change
886 1,370 484 4.5 Replacement needs for this occupation must also be considered. An additional 13 annual openings for Medical Records and Health Information Technicians are projected and attributed to replacement needs, as shown in the following table.
Total Annual
Average Openings
Annual Average Openings Due to
Growth
Annual Average Openings Due to
Replacement Medical Records and Health Information Technicians (Total)
61 48 13
Medical Records and Health Information
Technicians (%) 100% 78.7% 21.3%
All Occupations (%)
100% 33.7% 66.3%
The top three industries that employ the most Medical Records and Health Information Technicians are ambulatory health care services (with 44.4% of all Medical Records and Health Information Technicians), hospitals (41.1%), and nursing and residential care facilities (10.7%).
Wages Annual and hourly wage data for entry-level and experienced Medical Records and Health Information Technicians, as well average state and national wages, are supplied in the following table.
Maine Maine National Entry Experienced Mean Mean
% of National
Hourly $9.52 $14.19 $12.63 $13.54 Annual $19,800 $29,510 $26,270 $28,160
93.3%

1 4 O T H E R H E A L T H C A R E O C C U P A T I O N S
229
Maine Job Vacancies For Medical Records and Health Information Technicians, there was little change in the number of job vacancies or job vacancy rate. The findings are summarized in the table below.
2002 Vacancies
2002 Job Vacancy
Rate
2005 Vacancies
2005 Job Vacancy
Rate
Change in Vacancies
Change in Job Vacancy
Rate 10 1.1% 8 0.9% -2 -0.3%
National Employment In 2002, there were an estimated 147,000 Medical Records and Health Information Technicians employed in the United States. In 2012, it is projected that there will be 216,000; this represents an annual average growth rate of 3.9 percent, faster than the 1.4 percent growth rate for all occupations in the United States. The following table illustrates the net change, growth rate and expected employment for this occupation in 2012.
2002 Estimated Employment
2012 Projected Employment
Total 2002 – 2012 Employment Change
Annual Average Percent Change
147,000 216,000 69,000 3.9
Outlook Job prospects should be very good. Employment of medical records and health information technicians is expected to grow much faster than the average for all occupations through 2012, due to rapid growth in the number of medical tests, treatments, and procedures that will be increasingly scrutinized by third-party payers, regulators, courts, and consumers. Although employment growth in hospitals will not keep pace with growth in other healthcare industries, many new jobs will be created. The fastest employment growth and a majority of the new jobs are expected in offices of physicians, due to increasing demand for detailed records, especially in large group practices. Rapid growth also is expected in nursing care facilities, home healthcare services, and outpatient care centers. Additional job openings will result from the need to replace technicians who retire or leave the occupation permanently.


1 4 O T H E R H E A L T H C A R E O C C U P A T I O N S
231
Athletic Trainers
Occupational Description
Athletic Trainers evaluate, advise, and treat athletes to assist recovery from injury, avoid injury, or maintain peak physical fitness.
Educational Requirements As athletic training gains recognition as a profession requiring specialized education and training, certification is becoming increasingly important for employment. Apart from certification, some states require athletic trainers to be licensed. Typically, athletic trainers have a bachelor degree or higher, plus work experience.
Schools The schools in the following table are providers of a general Health and Physical Education program or a related program in Maine.
Provider City Husson College Bangor St. Joseph’s College Standish University of Maine at Orono Orono University of Maine at Presque Isle Presque Isle University of Southern Maine Portland
Completer data for these (and related) programs in 2002 is provided in the table below.
Title Credential Attained
Completers
Health and Physical Education, General Bachelor’s Degree
12
Physical Education Teaching and Coaching Bachelor’s Degree
64
Physical Education Teaching and Coaching Master’s Degree 4 Sport and Fitness Administration/Management
Bachelor’s Degree
3

1 4 O T H E R H E A L T H C A R E O C C U P A T I O N S
232
Statewide Employment Athletic Trainers are expected to experience a growth rate of 2.6 percent, faster than the 1.0 percent growth rate for all occupations in Maine. The following table illustrates the net change and annual average percent change.
2002 Estimated Employment
2012 Projected Employment
Total 2002 – 2012 Employment Change
Annual Average Percent Change
52 67 15 2.6 Replacement needs for this occupation must also be considered. The following table illustrates annual growth and replacement needs for Athletic Trainers.
Total Annual
Average Openings
Annual Average Openings Due to
Growth
Annual Average Openings Due to
Replacement Athletic Trainers (Total) 3 2 1
Athletic Trainers (%) 100% 66.7% 33.3% All Occupations (%) 100% 33.7% 66.3%
In 2002, the top two industries employing the most Athletic Trainers were the educational services industry (with 25.0% of all Athletic Trainers) and the hospitals industry (17.3%). Other industries employing Athletic Trainers were ambulatory health care services; amusement, gambling and recreation; management of companies and enterprises; and performing arts and spectator sports.
Maine Job Vacancies In 2002, there were an estimated seven job vacancies for Athletic Trainers, resulting in a job vacancy rate of 14.6%; in 2005, information for this occupation was not available.
Wages Annual wage data for entry-level and experienced Athletic Trainers, as well average state and national wages, are supplied in the following table.
Maine Maine National Entry Experienced Mean Mean
% of National
Annual $29,530 $36,780 $34,361 $35,880 95.8%
National Employment In 2002, there were an estimated 14,000 Athletic Trainers employed in the United States. In 2012, it is projected that there will be 19,000; this represents an annual average growth rate of 3.1 percent, which is much higher than the 1.4% growth rate for all occupations in the

1 4 O T H E R H E A L T H C A R E O C C U P A T I O N S
233
United States. The following table illustrates the net change, growth rate and expected employment for this occupation in 2012.
2002 Estimated Employment
2012 Projected Employment
Total 2002 – 2012 Employment Change
Annual Average Percent Change
14,000 19,000 5,000 3.1
Demand Although the growth rate for Athletic Trainers in Maine is faster than that of all occupations in Maine, overall demand for Athletic Trainers will be limited due to the relatively small size of the occupation. Generally, Athletic Trainers are employed by outpatient sports medicine or orthopedic clinics, high schools (as both teachers and Athletic Trainers), colleges and universities, professional sports teams, health clubs, and hospitals.28
Of these employment settings, many are limited in Maine. There are relatively few colleges and universities in Maine, and significantly fewer professional sports teams. Furthermore, these type of positions are highly sought after.
Nationally, “increasing interest in physical fitness and sports competition should increase the demand for athletic trainers.”29 This increased demand may particularly occur in outpatient sports medicine clinics and health clubs.
Supply In Maine, the supply of Athletic Trainers appears as though it will continue to significantly exceed the number of openings. Athletic Training and related educational programs produced 83 graduates in 2002. Although many of these completers will pursue careers in physical education and other education-related occupations, the supply of those qualified to serve as an Athletic Trainer will remain relatively high.
Analysis With an estimated three annual openings, Athletic Training is a very small occupation in Maine, but significant interest in this profession exists as roughly 80 qualified individuals are produced annually by in-state colleges and universities. With such a large supply of candidates relative to few openings, significant competition exists for these positions.
It is important to note that a great deal of these positions are in high schools, and, like all public school positions, Athletic Trainers are greatly affected by budgetary concerns. Many schools are unable obtain funding for a full-time Athletic Trainer, and, instead, hire an individual with teaching credentials to teach part-time (often physical education or health) and serve as an Athletic Trainer part-time. In a highly competitive field, experience or education in teaching is a tremendous asset.
The growth rate for this occupation will continue to outpace that of all occupations because as “society becomes more health conscious, roles for athletic trainers in health clubs and other

1 4 O T H E R H E A L T H C A R E O C C U P A T I O N S
234
similar facilities will become more prevalent.”29 This consciousness and interest in health will likely continue to spur the numerous completers of related baccalaureate programs.

1 4 O T H E R H E A L T H C A R E O C C U P A T I O N S
235
Medical Assistants
Occupational Description Medical Assistants perform administrative and certain clinical duties under the direction of physician. Administrative duties may include scheduling appointments, maintaining medical records, billing, and coding for insurance purposes. Clinical duties may include taking and recording vital signs and medical histories, preparing patients for examination, drawing blood, and administering medications as directed by physician.
Educational Requirements Most employers prefer graduates of formal programs in medical assisting. Such programs are offered in vocational-technical high schools, postsecondary vocational schools, and community and junior colleges. Postsecondary programs usually last either 1 year, resulting in a certificate or diploma, or 2 years, resulting in an associate’s degree.
Schools The institutions in the following table are providers of Medical Assisting training programs in the state of Maine.
Provider City Andover College Portland Beal College Bangor Husson College Bangor Kennebec Valley Community College Fairfield Southern Maine Community College South Portland Seacoast Career Schools Sanford
Statewide Employment There were 1,572 Medical Assistants employed in Maine in 2002, and this occupation is expected to experience much more rapid growth (5.1% annually) than that of the all occupations average (1.0%), as shown in the following table.
2002 Estimated Employment
2012 Projected Employment
Total 2002 – 2012 Employment Change
Annual Average Percent Change
1,572 2,583 1,011 5.1

1 4 O T H E R H E A L T H C A R E O C C U P A T I O N S
236
The preceding 10-year employment change reflects the growth that this occupation is expected to experience, but replacement needs must also be considered. An additional 29 annual openings for Medical Assistants are projected and attributed to replacement needs. The following table illustrates annual growth and replacement needs for Medical Assistants and the percentage of openings attributed to growth and replacement for both Medical Assistants and all occupations.
Total Annual
Average Openings
Annual Average Openings Due to
Growth
Annual Average Openings Due to
Replacement Medical Assistants (Total) 130 101 18
Medical Assistants (%) 100% 77.7% 22.3% All Occupations (%) 100% 33.7% 66.3%
The top two industries that employ the most Medical Assistants are ambulatory health care services (with 78.9% of all Medical Assistants), and hospitals (16.3%).
Maine Job Vacancies For Medical Assistants, the number of job vacancies in 2005 was lower than that of 2002, and the job vacancy rate also declined. The findings are summarized in the table below.
2002 Vacancies
2002 Job Vacancy
Rate
2005 Vacancies
2005 Job Vacancy
Rate
Change in Vacancies
Change in Job Vacancy
Rate 68 4.7% 30 2.0% -38 -2.7%
Wages Annual and hourly wage data for entry-level and experienced Medical Assistants, as well average state and national wages, are supplied in the following table.
Maine Maine National Entry Experienced Mean Mean
% of National
Hourly $9.73 $14.20 $12.71 $12.44 Annual $20,240 $29,530 $26,436 $25,875
102.2%
National Employment In 2002, there were an estimated 365,000 Medical Assistants employed in the United States. In 2012, it is projected that there will be 579,000; this represents an annual average growth rate of 4.7 percent, much faster than the 1.4 percent growth rate for all occupations in the United States. The table on the following page illustrates the net change, growth rate and expected employment for this occupation in 2012.

1 4 O T H E R H E A L T H C A R E O C C U P A T I O N S
237
2002 Estimated Employment
2012 Projected Employment
Total 2002 – 2012 Employment Change
Annual Average Percent Change
365,000 579,000 214,000 4.7
Outlook Employment of medical assistants is expected to grow much faster than the average for all occupations through the year 2012 as the health services industry expands because of technological advances in medicine, and a growing and aging population. Increasing utilization of medical assistants in the rapidly-growing healthcare industries will result in fast employment growth for the occupation. In fact, medical assistants are projected to be the fastest growing occupation over the 2002–12 period. Employment growth will be driven by the increase in the number of group practices, clinics, and other healthcare facilities that need a high proportion of support personnel, particularly the flexible medical assistant who can handle both administrative and clinical duties. Medical assistants work primarily in outpatient settings, which are expected to experience much faster-than-average growth.

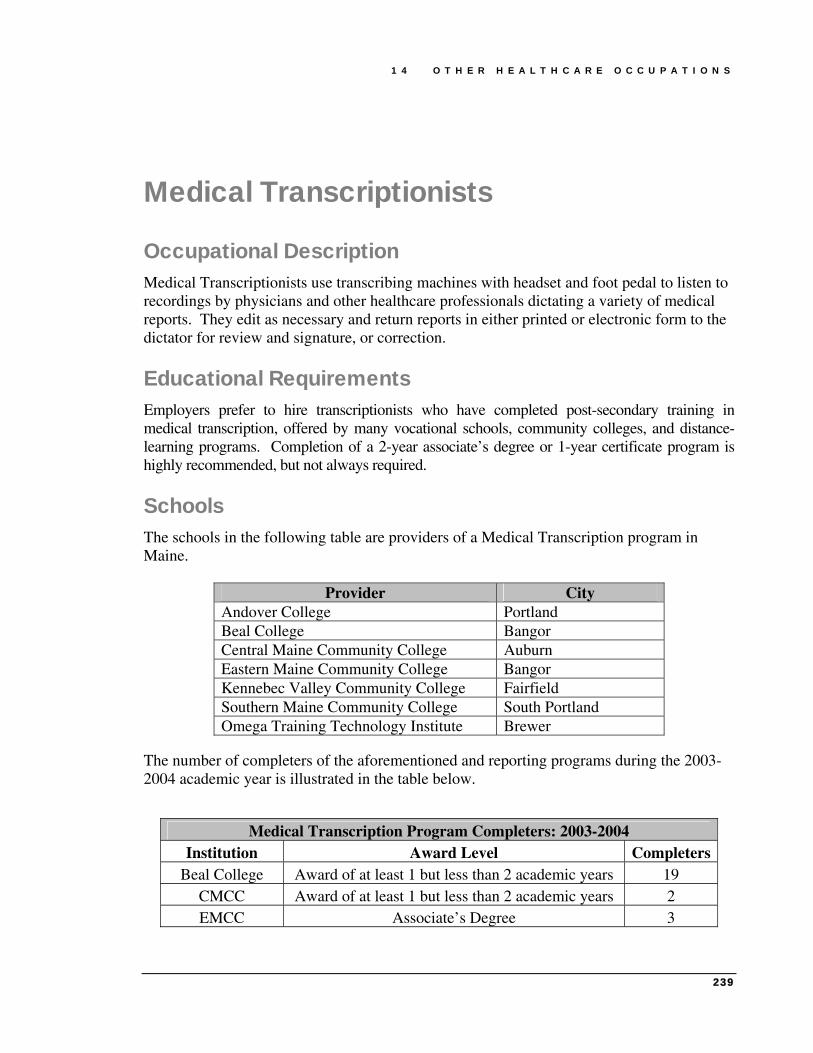
1 4 O T H E R H E A L T H C A R E O C C U P A T I O N S
239
Medical Transcriptionists
Occupational Description Medical Transcriptionists use transcribing machines with headset and foot pedal to listen to recordings by physicians and other healthcare professionals dictating a variety of medical reports. They edit as necessary and return reports in either printed or electronic form to the dictator for review and signature, or correction.
Educational Requirements Employers prefer to hire transcriptionists who have completed post-secondary training in medical transcription, offered by many vocational schools, community colleges, and distance-learning programs. Completion of a 2-year associate’s degree or 1-year certificate program is highly recommended, but not always required.
Schools The schools in the following table are providers of a Medical Transcription program in Maine.
Provider City Andover College Portland Beal College Bangor Central Maine Community College Auburn Eastern Maine Community College Bangor Kennebec Valley Community College Fairfield Southern Maine Community College South Portland Omega Training Technology Institute Brewer
The number of completers of the aforementioned and reporting programs during the 2003-2004 academic year is illustrated in the table below.
Medical Transcription Program Completers: 2003-2004 Institution Award Level Completers
Beal College Award of at least 1 but less than 2 academic years 19 CMCC Award of at least 1 but less than 2 academic years 2 EMCC Associate’s Degree 3

1 4 O T H E R H E A L T H C A R E O C C U P A T I O N S
240
Statewide Employment There were 680 Medical Transcriptionists employed in Maine in 2002, and this occupation is expected to experience more rapid growth (2.3% annually) than that of the all occupations average (1.0%). The following table lists relevant employment and projection data.
2002 Estimated Employment
2012 Projected Employment
Total 2002 – 2012 Employment Change
Annual Average Percent Change
680 853 173 2.3 Replacement needs for this occupation must also be considered. An additional 13 annual openings for Medical Transcriptionists are projected and attributed to replacement needs, as shown in the following table.
Total Annual
Average Openings
Annual Average Openings Due to
Growth
Annual Average Openings Due to
Replacement Medical Transcriptionists
(Total) 30 17 13
Medical Transcriptionists (%)
100% 56.7% 43.3%
All Occupations (%)
100% 33.7% 66.3%
The top three industries in terms of employment of Medical Transcriptionists are hospitals (with 42.5% of all Medical Transcriptionists), ambulatory health care services (37.9%), and administrative and support services (11.2%).
Wages Annual and hourly wage data for entry-level and experienced Medical Transcriptionists, as well average state and national wages, are supplied in the following table.
Maine Maine National Entry Experienced Mean Mean
% of National
Hourly $10.33 $15.82 $13.99 $14.20 Annual $21,490 $32,910 $29,099 $29,530
98.5%
National Employment In 2002, there were an estimated 101,000 Medical Transcriptionists employed in the United States. In 2012, it is projected that there will be 124,000; this represents an annual average growth rate of 2.1 percent, faster than the 1.4 percent growth rate for all occupations in the United States. The table on the following page illustrates the net change, growth rate and expected employment for this occupation in 2012.

1 4 O T H E R H E A L T H C A R E O C C U P A T I O N S
241
2002 Estimated Employment
2012 Projected Employment
Total 2002 – 2012 Employment Change
Annual Average Percent Change
101,000 124,000 23,000 2.1
Outlook Job opportunities will be good. Employment of medical transcriptionists is projected to grow faster than the average for all occupations through 2012. Demand for medical transcription services will be spurred by a growing and aging population. Older age groups receive proportionately greater numbers of medical tests, treatments, and procedures that require documentation. A high level of demand for transcription services also will be sustained by the continued need for electronic documentation that can be easily shared among providers, third-party payers, regulators, and consumers. Growing numbers of medical transcriptionists will be needed to amend patients’ records, edit for grammar, and identify discrepancies in medical records. Contracting out transcription work overseas and advancements in speech recognition technology are not expected to significantly reduce the need for well-trained medical transcriptionists domestically. Contracting out transcription work abroad—to countries such as India—has grown more popular as transmitting confidential health information over the Internet has become more secure; however, the demand for overseas transcription services is expected to supplement the demand for well-trained domestic medical transcriptionists. Speech-recognition technology allows physicians and other health professionals to dictate medical reports to a computer that immediately creates an electronic document. In spite of the advances in this technology, it has been difficult for the software to grasp and analyze the human voice and the English language. As a result, there will continue to be a need for skilled medical transcriptionists to identify and appropriately edit errors created by speech recognition systems, and create a final document. Hospitals will continue to employ a large percentage of medical transcriptionists, but job growth there will not be as fast as in other industries. Increasing demand for standardized records should result in rapid employment growth in offices of physicians or other health practitioners, especially in large group practices.


1 4 O T H E R H E A L T H C A R E O C C U P A T I O N S
243
Opticians
Occupational Description Opticians measure customers for size of eyeglasses and coordinate frames with facial and eye measurements and optical prescription. They prepare work orders for an optical laboratory containing instructions for grinding and mounting lenses in frames. Opticians will adjust frame and lens position to fit client.
Educational Requirements Employers usually hire individuals with no background as an optician or those who have worked as ophthalmic laboratory technicians. The employers then provide the required training. Most dispensing opticians receive training on the job or through apprenticeships lasting two or more years. Some employers, however, seek people with postsecondary training in the field.
Schools The New England schools in the following table are providers of educational programs that would prepare one to be an Optician.
Provider City Middlesex Community College Middletown, CT New Hampshire Community Technical College Nashua, NH
Statewide Employment There were 155 Opticians employed in Maine in 2002, and this occupation is expected to experience much more rapid growth (2.3% annually) than that of the all occupations average (1.0%). The following table lists relevant employment and projection data.
2002 Estimated Employment
2012 Projected Employment
Total 2002 – 2012 Employment Change
Annual Average Percent Change
155 194 39 2.3 Replacement needs must also be considered. An additional 3 annual openings for Opticians are projected and attributed to replacement needs, as shown in the table on the following page.
Total Annual
Average Openings
Annual Average Openings Due to
Growth
Annual Average Openings Due to
Replacement Opticians 7 (100%) 4 (57.1%) 3 (42.9%) All Occupations (%) 100% 33.7% 66.3%

1 4 O T H E R H E A L T H C A R E O C C U P A T I O N S
244
Wages Annual and hourly wage data for entry-level and experienced Opticians, as well average state and national wages, are supplied in the following table.
Maine Maine National Entry Experienced Mean Mean
% of National
Hourly $10.16 $16.13 $14.14 $14.65 Annual $21,130 $33,550 $29,411 $30,470
96.5%
The top two industries in terms of employment of Opticians are ambulatory health care services (with 74.2% of all Opticians) and health and personal care stores (17.9%).
National Employment In 2002, there were an estimated 63,000 Opticians employed in the United States. In 2012, it is projected that there will be 75,000; this represents an annual average growth rate of 1.8 percent, faster than the 1.4 percent growth rate for all occupations in the United States. The following table illustrates the net change, growth rate and expected employment for this occupation in 2012.
2002 Estimated Employment
2012 Projected Employment
Total 2002 – 2012 Employment Change
Annual Average Percent Change
63,000 75,000 12,000 1.8
Outlook Employment of opticians is expected to increase about as fast as the average for all occupations through 2012 as demand grows for corrective lenses. Middle age is a time when many individuals use corrective lenses for the first time, and elderly persons generally require more vision care than others. Fashion, too, influences demand. Frames come in a growing variety of styles and colors—encouraging people to buy more than one pair. Demand also is expected to grow in response to the availability of new technologies that improve the quality and look of corrective lenses, such as antireflective coatings and enhanced bifocal lenses. Improvements in bifocal, extended-wear, and disposable contact lenses also will spur demand. The need to replace those who leave the occupation will result in additional job openings. Nevertheless, the number of job openings will be limited because the occupation is small. Dispensing opticians are vulnerable to changes in the business cycle, because eyewear purchases often can be deferred for a time.

1 4 O T H E R H E A L T H C A R E O C C U P A T I O N S
245
Orthotists and Prosthetists
Occupational Description Orthotists and Prosthetists assist patients with disabling conditions of limbs and spine or with partial or total absence of limb by fitting and preparing orthopedic braces or prostheses.
Educational Requirements Orthotists and Prosthetists typically possess an associate’s degree.
Voluntary certification (Fellow of the AAOP) is available from the American Academy of Orthotists and Prosthetists (AAOP). For additional information, you may visit the following Web sites.
Schools No school in Maine offers a program dedicated to this occupation. The table below lists some schools across the nation that offer an Orthotist or Prosthetist program or major.
Provider City Baker College of Flint Flint, MI
Century College White Bear Lake, MN Eastern Michigan University Ypsilanti, MI
Florida International University Miami, FL Francis Tuttle Area Vocational Technical Center Oklahoma City, OK
Median School of Allied Health Care Pittsburgh, PA St. Ambrose University Davenport, IA
University of Texas Southwestern Medical Center at Dallas
Dallas, TX
Statewide Employment There were 27 Orthotists and Prosthetists employed in Maine in 2002, and this occupation is expected to experience less growth (0.7% annually) than that of the all occupations average (1.0%). The following table lists relevant employment and projection data.
2002 Estimated Employment
2012 Projected Employment
Total 2002 – 2012 Employment Change
Annual Average Percent Change
27 29 2 0.7

1 4 O T H E R H E A L T H C A R E O C C U P A T I O N S
246
The top three industries that employ the most Orthotists and Prosthetists are miscellaneous manufacturing (with 59.3% of all Orthotists and Prosthetists) and hospitals (11.1%).
Wages Annual and hourly wage data for entry-level and experienced Orthotists and Prosthetists, as well average state and national wages, are supplied in the following table.
Maine Maine National Entry Experienced Mean Mean
% of National
Hourly $18.57 $33.10 $28.26 $28.64 Annual $38,620 $68,850 $58,780 $59,560
98.7%
National Employment In 2002, there were an estimated 5,000 Orthotists and Prosthetists employed in the United States. In 2012, it is projected that there will be 6,000; this represents an annual average growth rate of 1.8 percent, slightly faster than the 1.4 percent growth rate for all occupations in the United States. The following table illustrates the net change, growth rate and expected employment for this occupation in 2012.
2002 Estimated Employment
2012 Projected Employment
Total 2002 – 2012 Employment Change
Annual Average Percent Change
5,000 6,000 1,000 1.8
Outlook In Maine, Orthotists and Prosthetists is a very small occupation that is expected to experience little growth; however, a few factors may increase demand.
As more insurance companies cover braces and prostheses, demand for Orthotists and Prosthetists should increase. Also, technological advances in materials and construction of these devices may result in increased demand as those with disabilities may want improved braces and prostheses.
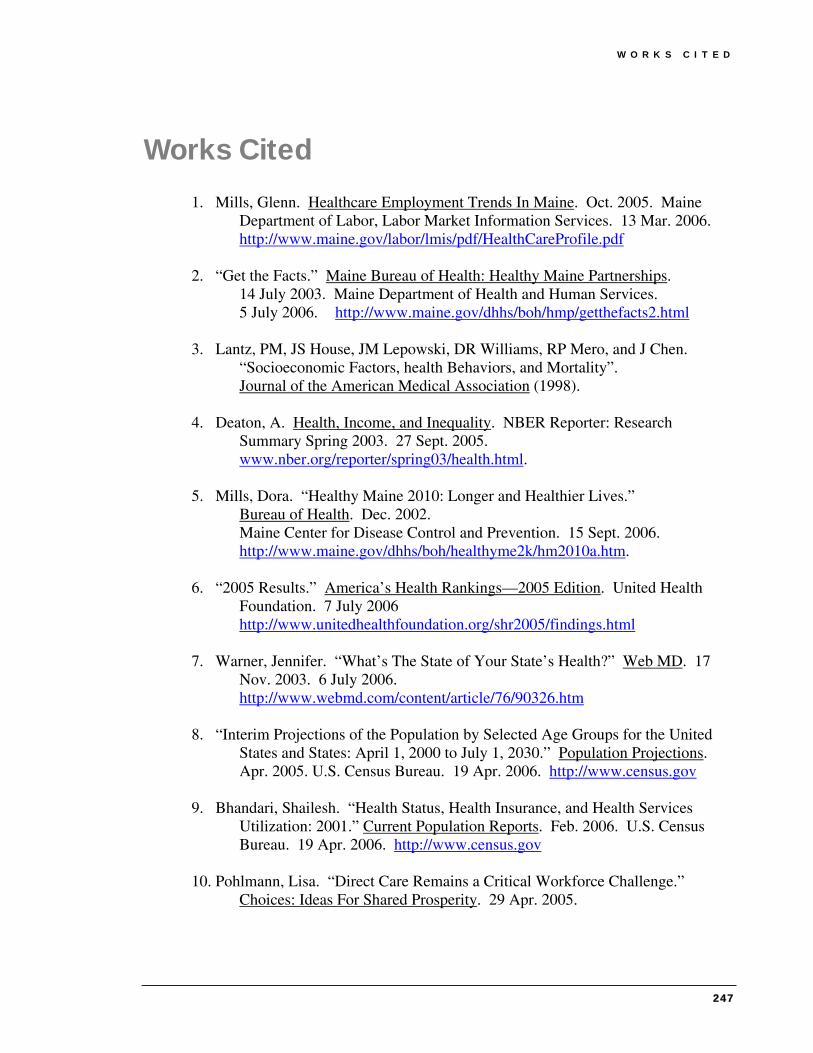
W O R K S C I T E D
247
Works Cited 1. Mills, Glenn. Healthcare Employment Trends In Maine. Oct. 2005. Maine
Department of Labor, Labor Market Information Services. 13 Mar. 2006. http://www.maine.gov/labor/lmis/pdf/HealthCareProfile.pdf
2. “Get the Facts.” Maine Bureau of Health: Healthy Maine Partnerships.
14 July 2003. Maine Department of Health and Human Services. 5 July 2006. http://www.maine.gov/dhhs/boh/hmp/getthefacts2.html
3. Lantz, PM, JS House, JM Lepowski, DR Williams, RP Mero, and J Chen. “Socioeconomic Factors, health Behaviors, and Mortality”. Journal of the American Medical Association (1998).
4. Deaton, A. Health, Income, and Inequality. NBER Reporter: Research
Summary Spring 2003. 27 Sept. 2005. www.nber.org/reporter/spring03/health.html.
5. Mills, Dora. “Healthy Maine 2010: Longer and Healthier Lives.” Bureau of Health. Dec. 2002. Maine Center for Disease Control and Prevention. 15 Sept. 2006. http://www.maine.gov/dhhs/boh/healthyme2k/hm2010a.htm.
6. “2005 Results.” America’s Health Rankings—2005 Edition. United Health
Foundation. 7 July 2006 http://www.unitedhealthfoundation.org/shr2005/findings.html
7. Warner, Jennifer. “What’s The State of Your State’s Health?” Web MD. 17
Nov. 2003. 6 July 2006. http://www.webmd.com/content/article/76/90326.htm
8. “Interim Projections of the Population by Selected Age Groups for the United
States and States: April 1, 2000 to July 1, 2030.” Population Projections. Apr. 2005. U.S. Census Bureau. 19 Apr. 2006. http://www.census.gov
9. Bhandari, Shailesh. “Health Status, Health Insurance, and Health Services
Utilization: 2001.” Current Population Reports. Feb. 2006. U.S. Census Bureau. 19 Apr. 2006. http://www.census.gov
10. Pohlmann, Lisa. “Direct Care Remains a Critical Workforce Challenge.”
Choices: Ideas For Shared Prosperity. 29 Apr. 2005.

W O R K S C I T E D
248
11. Newhouse, Joseph P. and the Insurance Experiment Group. Free For All? Lessons From The RAND Health Insurance Experiment. Cambridge: Harvard UP, 1993.
12. Collins, SR, JL Kriss, K Davis, MM Doty, and AL Holmgren. “Squeezed: Why
Rising Exposure to Health Care Costs Threatens the Health and Well-being of American Families.” The Commonwealth Fund. 15 Sept. 2006. www.cmwf.org.
13. Wennberg, JE, and MM Cooper, eds. The Dartmouth Atlas of Health Care in
the United States. Chicago: AHA Press, 1996.
14. Maine Quality Forum. 15 Sept. 2006. www.mainequalityforum.org.
15. O’Hara, Frank and Lisa Pohlmann. MaineCare Matters: Mainers Share Their Views. Maine Center for Economic Policy. 2006.
16. Porter, Eduardo. “Costs of Benefits Cited As Factor In Slump In Jobs.”
New York Times. 19 Aug. 2004.
17. U.S. Department of Labor. Occupational Outlook Handbook. JIST Works, 2004.
18. Ham, Jane. “Healthcare Question.” Email to the author. 26 June 2006.
19. Maine Recruitment Center: Doctor & Physician Jobs.” Maine Recruitment
Center. 27 June 2006. http://www.themrc.org.
20. Horstmann, Matt. Utah’s Dentist Workforce. Utah Medical Education Council. 2002. 1 Aug. 2006. http://utahmec.org/reports/DentalReport.pdf
21. “NPR Reports on Maine Dentists and Medicaid.” Smilefinder.com. 03 Jan.
2002. 1 Aug. 2006. http://www.smilefinder.com
22. CNA Registry. Survey Response. 2 Dec. 2005.
23. Larsson, Barbara. “Respiratory Therapy.” Email to the author. 20 Mar. 2006.
24. Chop, Walter. “Respiratory Therapy.” Email to the author. 16 Mar. 2006.
25. Health Resources and Services Administration. U.S. Department of Health and Human Services. The Supply of Pharmacists and Pharmacy Education and Training. December 2000. 1 July 2006 http://bhpr.hrsa.gov/healthworkforce/reports/pharmacist.htm
26. Dolan, Lisa. “CVT Graduates.” E-Mail to the author. 13 Mar. 2006.

W O R K S C I T E D
249
27. “Food Science and Human Nutrition.” The University of Maine. 28 June 2006. http://www.fsn.umaine.edu
28. “Athletic Trainer.” Florida Health Careers. 5 July 2006. http://www.flahec.org/hlthcareers/athletic.htm.
29. “Certified Athletic Trainer.” Health Careers Center. Mississippi Hospital Association. 5 July 2006. http://www.mshealthcareers.com/careers/athletictrainer.htm.


A P P E N D I X
251
Appendix
Methodology for Survey Data Collection Maine Public Law 327 mandates that ODRVS collect data beginning in January 2006 on training, work experience, and future career plans from specified health workforce professionals, analyze the data, and provide information in a detailed report for the DHHS Health Workforce Forum by December of each year. Data collection for this new initiative began in January 2006 and is ongoing. Some professions noted in the law such as allopathic physicians, osteopathic physicians, dentists, and dental hygienists have been previously surveyed on an ongoing basis by ODRVS, therefore their data were already available for analysis. Eventually, approximately 75,000 individuals will be surveyed for all licensing professions. As of June 2006, survey responses from nearly 7,000 individuals have been recorded, 2,100 of these since January 2006.
Data Collection Paper surveys are collected on an ongoing monthly basis from all allopathic physicians and osteopathic physicians. Dentists and dental hygienists in the past have received a survey to complete every four years. Physician assistants while surveyed in the past, have not been for many years. To minimize the expense of mailing surveys to this newer profession, the licensing boards for physician assistants mailed out the surveys with their re-licensing materials as is done with all physicians and dental providers. At this time, none of the above named boards (for physicians and dental providers) have online licensing capacity. Therefore, until these boards come online or ODRVS is able to develop surveys which can be posted online, these licensees will receive paper surveys in the mail, sent out with their re-licensure materials from their respective boards. For professions with online re-licensing capability, online survey instruments were developed for social workers, physical therapists, speech language pathologists/audiologists, respiratory therapists, and psychologists as their re-licensure dates neared. Initially only online data collection was planned for all professions who were already using the online board systems to re-license. A person who was renewing his or her license would complete the online form for renewal on the Professional and Financial Regulation website and then would automatically be taken to the health workforce survey for completion.

A P P E N D I X
252
For the professions due to re-license in the first half of 2006, a reminder postcard pre-printed with an online address for each health profession’s survey location was also developed and mailed to healthcare workers a month before their license became due for renewal. The intent was for this postcard to prompt the licensee to go online and complete their survey. After three months, it was determined that the response rate for the online version of the survey was poorer than expected. As an experiment, paper data collection was initiated for the Speech Language/Audiologist professions on April 19th. While initial response to the online survey was a disappointing 12%, by the end of June 2006, with the first mailing and a follow-up mailing of paper surveys on May 22nd, response for this profession had risen to nearly 50%. As a result of this experiment, beginning in August 2006, all professions will receive a paper survey in the mail with a letter explaining the project and requesting online completion of the questionnaire if at all possible to economize on the available personnel time resources at ODRVS by eliminating the need for data entry of the online form.
Table 1 – Response Rate for Six Health Workforce Professions
Board Percent Response for Six Professions EMS 12.8% Speech Pathology and Audiology 49.5%* Physical Therapy 17.5% Respiratory Care 33.6% Social Work 10.0% Psychology 25.7% *both online and paper survey methods used, no follow-up as of June 30, 2006
By the end of 2006, radiologic technicians, occupational therapists, pharmacists, dietitians/technicians and alcohol/drug counselors will also be included in the online and paper data collection effort. The Board of Nursing has been surveying their licensees on an ongoing basis, using paper and an online system. ODRVS will assume responsibility for surveying this profession in September 2006. The EMS Board does not currently have online re-licensing capability but has been provided with an online version of the survey that licensees can access to complete if they choose. However, until all licensing boards require their licensees to renew licenses online, ODRVS will use a mixed mode survey data collection method. While this mode is much more costly than simply the online version, it has been initiated because of poor response. To alleviate this problem, all licensees will now have the option of completing a voluntary survey on paper or online.

A P P E N D I X
253
Data Processing ODRVS worked with InforME to develop surveys using PHP Surveyor. Once training was complete on the software, ODRVS began producing individual surveys specific for each profession. Each data collection form is available online. Data entered by licensees when completing the survey are stored on an InforME server. Using passwords to access the system, ODRVS staff is able to download data from their personal workstations for each profession into an Excel spreadsheet which is then imported into individual Access databases. These databases were originally set up using information provided by each board for each licensee. The survey data is matched with each licensee board record with the resulting entry a combination of survey and board data.
Data Editing The major data processing activities for the health workforce surveys included computer edits of the data downloaded from the InforME system to ensure completeness and consistency of codes. Once edited, the files were imported into the Access databases, and further edited for consistency of the data.
Since computer edits were written into each survey developed, taking into account any skip patterns needed, only a small amount of manual editing became necessary. Edits on valid state abbreviations, valid dates, and range checks on all variables were completed before the data required by the Department of Labor was produced.
By June 30th, files were provided to the Department of Labor to use for data analysis for this report. Recognizing that data collection began in January 2006 for many of these professions, only partial datasets could be supplied. Only the Board of Examiners on Speech Pathology and Audiology, Board of Examiners in Physical Therapy, and Board of Respiratory Care Practitioners had completed re-licensure by the close-out date of May 19th (this date was selected to allow enough record processing time before writing the report). Most boards have not fully completed their licensure cycles. With the exception of files for the paper-based surveys, no other files can be considered complete and closed.
Table 2 - Data Provided to DOL by End of June 2006
Profession Year of Dataset Dataset Complete? Allopathic Physicians 2004 (currently being surveyed for 2006) YES Osteopathic Physicians 2004 (currently being surveyed for 2006) YES Dentists 2002 (currently being surveyed for 2006) YES Dental Hygienists 2004 (will be surveyed Fall 2006) YES Physician Assistants 2006 (not final dataset) NO EMS professions 2006 (partial dataset) NO Psychologists 2006 (partial dataset) NO Physical Therapy 2006 (partial dataset) NO Social Work 2006 (partial dataset) NO Respiratory Therapy 2006 (partial dataset) NO Speech/Language Pathology/Audiology
2006 (partial dataset) NO

A P P E N D I X
255
2006 MAINE PHYSICAL THERAPIST RESOURCE INVENTORY
The Office of Data, Research, and Vital Statistics, in conjunction with the Maine Board of Examiners in Physical Therapy, is conducting this survey as a means of collecting accurate and timely data to study the physical therapist supply in Maine. Your license number is for tracking purposes only and will not be reported in any survey results. License renewal is not contingent upon completing this inventory, but your cooperation is appreciated. Thank you.
Please note this survey is also available online at www.maine.gov/survey2006/physicaltherapy.
LICENSE LEVEL
1. Please indicate: Physical Therapist Physical Therapy Assistant
EDUCATION
2. Please indicate all educational programs completed, graduation year, and state where completed: Year State Field of Degree
High School _______________ _______________
Associate Degree (please specify) _______________ _______________ _______________
Baccalaureate (please specify) _______________ _______________ _______________
Master’s (please specify) _______________ _______________ _______________
Doctorate (Ph.D.) (please specify) _______________ _______________ _______________
3. Have you completed any advanced practice programs? Yes No
IF YES , please indicate: ____________________________________________________________________________
4. Do you have any specialty credentials? Yes No
IF YES , what is the specialty (ies)? ___________________________________________________________________
EMPLOYMENT:
5. Please indicate the state/country and year you were FIRST employed in the physical therapy field:
______________________________ _______________
6. Are you currently employed in the physical therapy field? Yes No
IF NO ,
Please indicate your current activity status: AND Please indicate reasons why you are not currently working in this field (check all that apply):
Working in another field and seeking work in physical therapy Issues of wages or benefits
Working in another field and NOT seeking work Inability to find position desire
in physical therapy Pursuit of educational opportunities
Unemployed – seeking work in physical therapy Pursuit of other career opportunities
Retired or not intending to return to work Retirement
Temporarily not working and not seeking work Other____________________________________
In training
Other________________________________________
7. Please indicate the address of your PRIMARY employer:
_________________________________________________ ____________________________________________ Name of Employer Number/Street
________________________________________________________ _____________ _______________________
City/Town State Zip Code

A P P E N D I X
256
8. Please indicate other employment location zip codes, if any: ____________________________________
9. If employed outside the United States, please list country: _____________________________________________
10. How would you describe your PRIMARY employment setting? (Check one)
Hospital Academic institution
Private practice Government institution
Community clinic Other institution
Nursing home/assisted living Other __________________________________________________
11. Does your work setting use any form of electronic medical records software? Yes No Unknown
12. Does your work setting use an electronic billing system (either in-house or through a contractor)?
Yes No Unknown
EMPLOYMENT HOURS IN PRIMARY POSITION
13. Please indicate the total average hours worked in a typical week in your primary job. Include both direct and indirect patient/client hours.
____________ Average Hours per week
14. Please indicate the number of DIRECT PATIENT/CLIENT HOURS worked each week.
____________ Hours per week
15. How many hours per week were you HIRED to work in your current position?
____________ Hours per week
16. If you would like to change the number of hours that you work in a week, how many hours per week would you PREFER to work?
____________ Hours per week
OTHER EMPLOYMENT HOURS
17. Please indicate the number of hours worked per week for other healthcare providers: _________ hours
GENERAL DEMOGRAPHICS
18. Do you plan to be working in the physical therapy field in Maine five years from now? Yes No
19. What is your license number? _______________________
20. What is your date of birth? _______________________
21. What is your residence zip code? _______________________
22. What is your gender? Male Female
23. What is your race? White Black American Indian/Alaskan Native
Asian Native Hawaiian or other Pacific Islander
Other ___________________________________________________
Signature Date
Please sign and date above. If you are interested in becoming a health professional volunteer to respond to public health emergencies, please register at www.mainepublichealth.gov. If already registered, please use this site to update your information. Thank you.

A P P E N D I X
Liv
e
8.6%
5.2
28.2
2.3
4.0
8.6
4.0
2.3
2.9
16.7
2.3
1.1
1.7
4.0
1.7
6.3
174
Surg
eons
Wor
k
8.4%
4.8
30.7
1.8
3.6
7.8
4.2
1.8
2.4
20.5
1.8
0.0
1.2
2.4
1.8
6.6
169
Liv
e
4.5%
2.5
45.2
0.0
4.5
7.0
5.1
1.9
0.0
9.6
0.0
2.5
0.6
3.2
3.2
10.2
157
Psy
chia
tris
ts
Wor
k
6.1%
3.1
41.1
0.0
3.1
11.7
3.7
1.2
0.0
14.7
0.0
0.6
0.0
0.6
0.6
9.8
163
Liv
e
4.1%
4.9
43.4
0.0
3.3
8.2
4.1
4.1
2.5
11.5
0.8
0.8
1.6
1.6
0.8
8.2
122
Ped
iatr
icia
ns
Wor
k
3.6%
5.4
41.1
0.9
3.6
8.9
3.6
2.7
2.7
11.6
1.8
0.9
0.0
0.9
0.9
11.6
112
Liv
e
10.1
%
7.6
31.6
1.3
1.3
5.1
2.5
2.5
2.5
12.7
0.0
1.3
2.5
5.1
1.3
12.7
79
Ob-
Gyn
Wor
k
11.0
%
5.5
34.2
2.7
1.4
4.1
2.7
4.1
1.4
11.0
0.0
0.0
2.7
4.1
1.4
13.7
74
Liv
e
8.2%
3.7
32.9
2.1
2.9
7.4
3.3
2.5
4.5
11.5
0.8
4.1
2.5
1.6
4.5
7.4
245
Inte
rnis
ts
Wor
k
9.4%
3.8
31.5
1.7
3.0
8.5
3.4
2.1
4.3
11.1
0.9
2.1
2.1
1.7
4.3
10.2
235
Liv
e
4.6%
4.8
22.8
3.6
5.6
10.2
2.0
3.3
5.1
12.2
2.3
1.8
4.1
2.0
1.3
14.5
394
Gen
eral
P
ract
itio
ners
Wor
k
6.1%
5.1
22.6
3.3
5.1
9.4
2.0
3.6
3.8
11.4
2.0
1.0
4.6
2.3
2.0
15.7
394
Liv
e
8.5%
1.1
33.0
2.1
1.1
4.3
2.1
5.3
4.3
22.3
1.1
1.1
1.1
1.1
2.1
9.6
94
Phy
sici
ans
and
Surg
eons
: E
mpl
oym
ent
and
Res
iden
ce b
y C
ount
y an
d Sp
ecia
lty
Ane
sthe
siol
ogy
Wor
k
8.5%
2.1
40.4
4.3
2.1
6.4
3.2
3.2
1.1
22.3
0.0
0.0
0.0
1.1
1.1
4.3
94
And
rosc
oggi
n
Aro
osto
ok
Cum
berl
and
Fra
nklin
Han
cock
Ken
nebe
c
Kno
x
Lin
coln
Oxf
ord
Pen
obsc
ot
Pis
cata
quis
Sag
adah
oc
Som
erse
t
Wal
do
Was
hing
ton
Yor
k
Res
pons
es
County
257