Embed Size (px)
Citation preview

MAINE CENTER FOR DISEASE CONTROL AND PREVENTION
(FORMERLY BUREAU OF HEALTH) DIVISION OF CHRONIC DISEASE
MAINE CHILD HEALTH SURVEY, 2003/2004
KINDERGARTEN AND THIRD GRADE REPORT
December 2005

ACKNOWLEDGEMENTS Maine Centers for Disease Control and Prevention, Division of Chronic Disease
Dora Anne Mills, MD MPH – Director Division of Chronic Disease Division of Chronic Disease Barbara Leonard, MPH Ron Bansmer, MBA Former Division Director Acting Division Director
Maine Asthma Prevention and Control Program Maine Oral Health Program Dwight Littlefield, RN, MBA Judith Feinstein, MSPH Program Director Program Director
Report prepared by: Kathy Tippy, MPH
Epidemiologist Maine CDC, Division of Chronic Disease/University of Southern Maine, Applied
Medical Sciences We gratefully acknowledge all of the public elementary schools, families, and students who participated in the Maine Child Health Survey, 2003/2004. For survey logistical coordination and support: Belinda Golden, Maine Asthma Prevention and Control Program; Kristine Perkins, RDH, CAGS-PH, Maine Oral Health Program; Mary Harrington, Maine Oral Health Program; Barbara Poirier, MS, Muskie School of Public Policy, University of Southern Maine. For survey administration and database design: Janet Sawyer, RDH, Consultant; Kristine Perkins, RDH, CAGS-PH, Maine Oral Health Program; Teresa Hubley, PhD, Muskie School of Public Policy, University of Southern Maine. For program support: Dwight Littlefield, RN, MBA; Desi-Rae Mason, Maine Asthma Prevention and Control Program; Judith Feinstein, MSPH, Maine Oral Health Program. For survey design: Katie Meyer, ScD, Chronic Disease Epidemiologist; Judith Graber, MS, Program Director, Environmental Health Unit; Dorean Maines, Partnership for a Tobacco Free Maine. For analytic support: Katie Meyer, ScD, Chronic Disease Epidemiologist; Erika Lichter, ScD, Maternal Child Health Epidemiologist. For data editing and format; Peter Van Kamecke, Intern, University of Southern Maine Graduate Studies in Math and Statistics.
i

TABLE OF CONTENTS Page
Acknowledgements ............................................................................................ i Table of Contents............................................................................................... ii List of Detailed Tables ....................................................................................... iii List of Detailed Figures ...................................................................................... iv List of Questions and Dental Screening Responses.............................................. vi Executive Summary ........................................................................................... 1 Background ....................................................................................................... 2 Methodology ..................................................................................................... 2 Design........................................................................................................... 2 Exclusion Criteria.......................................................................................... 3 Sampling ....................................................................................................... 3 Regional Designation by Maine County......................................................... 3 Survey Response Rates .................................................................................. 4 Calculated Variables ...................................................................................... 4 Data Analysis and Discussion........................................................................ 5 Appendix A: Maine Child Health Survey Consent Form, Questionnaire and Dental
Screening Form....................................................................................... 7 Appendix B: Kindergarten and Third Grade Data Processing Document............. 17 Appendix C: Questionnaire and Dental Screen Responses Unweighted Frequency
Tables ..................................................................................................... 22 Appendix D: Detailed Tables and Figures........................................................... 49
ii

LIST OF DETAILED TABLES Page
1. School, student, and overall response rates according to region........................... 4 2. Demographic data according to region............................................................... 50 3. Prevalence of current asthma, lifetime asthma, and current wheeze by grade according to region ............................................................................. 52 4. Prevalence of current asthma, lifetime asthma, and current wheezing by sex according to region................................................................................. 54 5. Prevalence of current asthma, lifetime asthma, and current wheeze by insurance
coverage and race ....................................................................................... 57 6. Prevalence of children with special health care needs by grade and sex according to
region......................................................................................................... 59 7. Prevalence of children with special health care needs by insurance coverage and race according to grade level.................................................... 62 8. Prevalence of at-risk for overweight and overweight by sex according to region... 64 9. Prevalence of at-risk for overweight and overweight by sex according to grade level
.................................................................................................................. 65 10. Prevalence of at-risk for overweight and overweight by insurance coverage and race........................................................................................ 68 11. Prevalence of at-risk for overweight and overweight by television viewing and soda consumption.................................................................... 71 12. Prevalence of environmental tobacco smoke exposure (ETS) by sex, race, and
insurance coverage according to region ....................................................... 75 13. Prevalence of environmental tobacco smoke exposure (ETS) by race, and insurance coverage according to grade ................................................... 76 14. Prevalence of food insecurity and family hunger by sex and grade according to region ...................................................................................... 78 15. Prevalence of food insecurity and family hunger by insurance coverage and race....................................................................................................... 81
iii

LIST OF DETAILED FIGURES Page
1. Prevalence of current asthma, lifetime asthma, and current wheezing by grade.................................................................................................... 51 2. Prevalence of current asthma, lifetime asthma, and current wheezing by sex ....................................................................................................... 53 3.Prevalence of current asthma, lifetime asthma, and current wheezing by race...................................................................................................... 55 4. Prevalence of current asthma, lifetime asthma, and current wheezing by insurance coverage ............................................................................... 56 5. Prevalence of children with special health care needs (CSHCN) by grade and sex ............................................................................................ 58 6. Prevalence of children with special health care needs (CSHCN) by race and grade ................................................................................................ 60 7. Prevalence of children with special health care needs (CSHCN) by insurance coverage .................................................................................. 61 8. Prevalence of at-risk for overweight and overweight by sex .............................. 63 9. Prevalence of at-risk for overweight and overweight by race............................. 66 10. Prevalence of at-risk for overweight and overweight by insurance coverage. 67 11. Prevalence of children at-risk for overweight and overweight by television viewing...................................................................................... 69 12. Prevalence of children at-risk for overweight and overweight by soda consumption
............................................................................................................... 70 13. Prevalence of environmental tobacco smoke (ETS) exposure by region and grade ................................................................................................ 72 14. Prevalence of environmental tobacco smoke (ETS) exposure by race according to
grade level............................................................................................... 73 15. Prevalence of environmental tobacco smoke (ETS) exposure by insurance coverage according to grade level ............................................... 74
Page 16. Prevalence of food insecurity and family hunger by region............................. 77
iv

17. Prevalence of food insecurity and family hunger by race ................................ 79 18. Prevalence of food insecurity and family hunger by insurance coverage.................................................................................................. 80
LIST OF QUESTIONS AND DENTAL SCREENING RESPONSES Page
Child ever had wheezing or whistling in chest ........................................................ 23
v

Past 12 months: Child had wheezing or whistling in chest ...................................... 23 Past 12 months: Number of wheezing attacks child had.......................................... 23 Past 12 months: How often child’s sleep disturbed by wheezing.............................. 24 Past 12 months: Wheezing severe enough to limit child’s speech ............................ 24 Child ever had asthma........................................................................................... 24 Past 12 months: Child’s chest wheezy after exercise ............................................... 25 Past 12 months: Child’s sleep disturbed due to dry cough ....................................... 25 Past 12 months: How often child’s activity limited due to wheezing........................ 25 Past 12 months: How often visit doctor for wheezing ............................................. 26 Past 12 months: How often visit ED due to wheezing............................................. 26 Past 12 months: How often admitted as in-patient due to wheezing ........................ 26 Ever told by doctor that child has asthma............................................................... 27 Place child is usually taken for medical assistance for asthma ................................. 27 Past 12 months: Doctor has given written plan for child’s asthma ........................... 28 Number in household who smoke cigarettes, cigars, pipes in house ........................ 28 During average month: How often child smelled/breathed tobacco smoke ............. 28 Past 12 months: How often child around dogs........................................................ 29 Past 12 months: How often child around cats......................................................... 29 Kitchen stove: Natural gas or propane ................................................................... 29 At least once a month last winter: Heat-source: Kerosene....................................... 30
Page At least once a month last winter: Heat-source: Wood stove................................... 30 At least once a month last winter: Heat-source: Wood fireplace.............................. 30 Past 12 months: Wall to wall carpet in house ......................................................... 30
vi
Past 12 months: Wall to wall carpet where child sleeps........................................... 31 Protective plastic covering on child’s bed ............................................................... 31 Child has dog allergies........................................................................................... 31 Child has cat allergies............................................................................................ 32 Child has dust allergies.......................................................................................... 32 Child has grass or pollen allergies .......................................................................... 32 Past 4 weeks: Work delay missed by parent or other adult due to child’s asthma ............................................................................................................ 33 Biological mother ever told by doctor she has asthma............................................. 33 Biological father ever told by doctor he has asthma ................................................ 33 Time since child’s last dental visit .......................................................................... 34 Main reason for child’s last dental visit .................................................................. 34 Past 12 months: Child needed but was unable to get dental care ............................. 35 Reason last time child needed but couldn’t get dental care...................................... 35 Child covered under dental insurance .................................................................... 36 Child ever had dental sealants ............................................................................... 36 Past 4 weeks: Number of school days missed due to dental problems ...................... 36 How often child uses booster car seat..................................................................... 37 If rides in booster: In front seat or in back seat........................................................ 37
Page If no booster: Rides in front seat or in back seat...................................................... 37 Child currently needs/uses medication prescribed by doctor................................... 38 Need for prescription due to medical, behavioral or other condition ....................... 38 Condition requiring prescription has lasted/expected to last ≥12 months ................ 38
vii

Child needs more medical, mental health, educational services then usual .............. 39 Need for more services due to medical, behavioral or other condition ..................... 39 Condition requiring more services has lasted/expected to last ≥12 months.............. 39 Child limited in ability to do things others same age do .......................................... 40 Limitation due to medical, behavioral or other condition ....................................... 40 Limiting condition has lasted/expected to last ≥ 12 months.................................... 40 Child needs/gets physical, occupational or speech therapy ..................................... 41 Need for special therapy due to medical, behavioral or other condition................... 41 Special need has lasted/expected to last ≥ 12 months ............................................. 41 Child needs/gets treatment for emotional, developmental behavioral problems .......................................................................................................... 42 Problem has lasted/expected to last ≥ 12 months ................................................... 42 Past 12 months: I/other adult reduced/skipped own meal: No money.................... 42 How often I/other adult reduced/skipped meal ..................................................... 43 Past 12 months: I (adult) ate less: No money.......................................................... 43 Past 12 months: At time I (adult) didn’t eat: No money.......................................... 43 Food I/we bought didn’t last: No money to buy more............................................ 44 Past 12 months: I/we couldn’t afford balanced meals............................................. 44
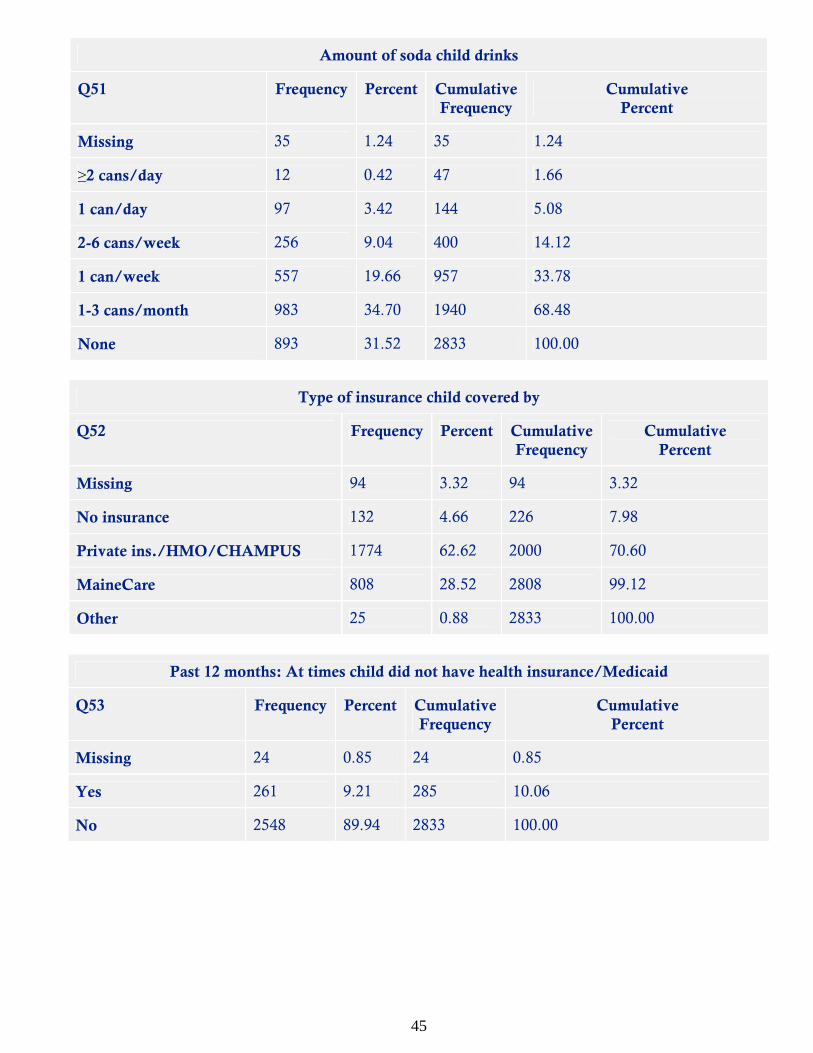
Page On average: Number of hours child watches TV per day ........................................ 44 Amount of soda child drinks.................................................................................. 45 Type of insurance child covered by ........................................................................ 45 Past 12 months: At times child did not have health insurance/Medicaid................. 45 Child eligible for free/reduced lunches at school .................................................... 46
viii

Child has signs of stress, behavior changes, moodiness ........................................... 46 Signs have lasted/expected to last ≥ 12 months ...................................................... 46 Willing to take/already taken child to be treated for stress ...................................... 46 Hispanic ............................................................................................................... 47 Dental referral....................................................................................................... 47 Caries experience .................................................................................................. 47 Rampant caries ..................................................................................................... 47 Sealants of permanent molars ................................................................................ 48 Treatment urgency ................................................................................................ 48 Untreated cavities ................................................................................................. 48 Need for sealants................................................................................................... 48
ix

EXECUTIVE SUMMARY The Maine Child Health Survey was initiated in 2001 in an effort to obtain credible, useful, and appropriate childhood health information. The survey (MCHS) provides an opportunity to gain critical information about the health of Maine’s children at various points in their development. This information can be used to monitor the health status of Maine’s children and to compare the health of Maine children with that of children in other states or regions. More importantly, this information will help us focus our efforts to improve the health of the children of Maine. Since 2001, the MCHS has been piloted, administered, and continuously improved. The MCHS is a cross-sectional survey of kindergarten, third grade and fifth grade students attending public schools in Maine. Only questions that are validated or previously used in national surveys are used within this data collection tool. The survey is conducted during the school year and participation in the MCHS is voluntary at the school level and individual level. Its use of one tool to obtain multiple measures of health is an effort to obtain the needed information while reducing, as much as possible, any inconvenience for participating schools.
This survey was developed and administered primarily by the Maine Asthma Prevention and Control Program and the Maine Oral Health Program, both part of the Maine Center for Disease Control and Prevention (MCDC) within the Maine Department of Health and Human Services. Other participating programs included the Maine Injury Prevention Program, the Partnership for a Tobacco Free Maine, the Physical Activity and Nutrition Program, and the Children with Special Health Needs Program, all units within the MCDC. The participation of and support by the Maine Department of Education was a key factor in coordinating the survey’s implementation.
This document reports data obtained from the 2003-2004 Kindergarten/Third Grade MCHS. Results are presented in the tables and figures included in Appendices C and D. The presentation of information is patterned after the Youth Risk Behavioral Survey, a national survey of middle school and high school students conducted at the state level and coordinated by CDC. The 2003-2004 MCHS was limited by a low overall response rate (the school response rate multiplied by the student response rate). As such, the results of this survey are indicative only of the children who participated in the survey and are not considered generalizable to Maine’s child population. These results do provide us with useful information on current asthma, lifetime asthma, and current wheezing; demographic characteristics, percentage of children with special healthcare needs; characteristics of children related to their Body Mass Index (BMI) percentages and related risk factors; several variables describing oral health status and access to dental care; environmental tobacco smoke exposure among children; family concerns regarding food insecurity and family hunger; and how many of these variables may differ by race.
This report does not include interpretations of data or discussion of survey results. Such discussions may be developed by the participating programs, and questions regarding particular health issues should be directed to them.
1

BACKGROUND The Maine Child Health Survey (MCHS) provides an opportunity to gain critical information about indicators relating to the health and well-being of Maine’s children. While the MCHS was initiated through The Centers for Disease Control and Prevention (CDC) cooperative agreement with the Maine Asthma Prevention and Control Program, efforts were made to collaborate with multiple partners across the state to collect representative data at the kindergarten, third and fifth grade level to measure a variety of health indicators. The MCHS provides state and local level health data that, historically, are difficult to collect. Multiple measures of health are assessed through the use of this one tool. The kindergarten/third grade MCHS is comprised of two components: 1) a questionnaire completed by the parent/primary caregiver 2) a dental screen, at which time height and weight measurements of the child were also obtained. A unique quality of the MCHS is the combination of formal questionnaire responses and actual physical measurements. The first statewide MCHS of kindergartners was conducted in 2002. The results of the 2002 MCHS can be found at www.mainepublichealth.com. This report is based on the second statewide MCHS of kindergartners and third graders conducted during the 2003/2004 school year. METHODOLOGY Design The MCHS protocol was approved by the Institutional Review Board (IRB) for the protection of human subjects at the Maine Health and Human Services. The MCHS is a cross-sectional survey of kindergarten and third grade students attending public schools in Maine. The MCHS was conducted during the school year. Participation in the MCHS was voluntary at the school level and individual level. The parent or primary caregiver of the kindergarten or third grade child enrolled in public school was sent a consent form to sign and a questionnaire to complete (see appendix A). Parents were instructed to return both the signed consent form and completed questionnaire to the Maine Asthma Prevention and Control Program in a postage paid return envelope. The consent form and questionnaire were mailed twice to non-respondent parents in two-week intervals following the prior mailing. Only children whose parent or primary caregiver had either signed the consent or completed the questionnaire received the dental screen and had their height and weight measured during school. The children were also given an opportunity to decline the dental exam and/or the height and weight measurements. A trained dental hygienist conducted the dental screen and obtained the height and weight measurements.
2

Exclusion Criteria All children enrolled in kindergarten or third grade at selected school sites were invited to participate in the MCHS. Exclusion from the MCHS was indicated by a refusal of the parent or primary caregiver to return either a signed consent form or a completed questionnaire. Exclusion could also occur with a verbal or physical refusal from the child after parental permission. Sampling The sampling plan for the MCHS was a stratified one-stage cluster. Stratification is based on six previously determined regions. The six regions are chosen based on multiple criteria; geographic location, population density, income, and age structure. The following table denotes the counties included in each region. Regional designation by Maine County
Region County Southern Cumberland, York Coastal Knox, Lincoln, Sagadahoc East Central Hancock, Penobscot, Waldo West Central Androscoggin, Kennebec Western Franklin, Oxford, Piscataquis, Somerset North Eastern Aroostook, Washington
Sample sizes per region were selected based on the ability to detect a sample mean within 3% of the true population with a 95% confidence interval using Epi-info software1. The 9.0% prevalence used in the sample size estimation is based on asthma prevalence from the previous statewide MCHS in 2002. Within each region individual schools were chosen using PC Sample software2. Schools were chosen based on a probability proportionate to their kindergarten or third grade class size. Survey Response Rates The statewide overall response rate was 17.6% and ranged from 10.0% in the Southern region to 27.1% in the West Central region. School response rates ranged from 22.0% in the Southern region to 64.3% in the Coastal region. Student response rates ranged from 40.3% in the Coastal region to 58.8% in the North Eastern region. Table 1. School, student, and overall response rates according to region
1 Centers for Disease Control and Prevention (2001). Epi info 2000 version 1.1.1. Atlanta, GA. 2 Westat (1996). PCSample: description and operation. Rockville, MD.
3
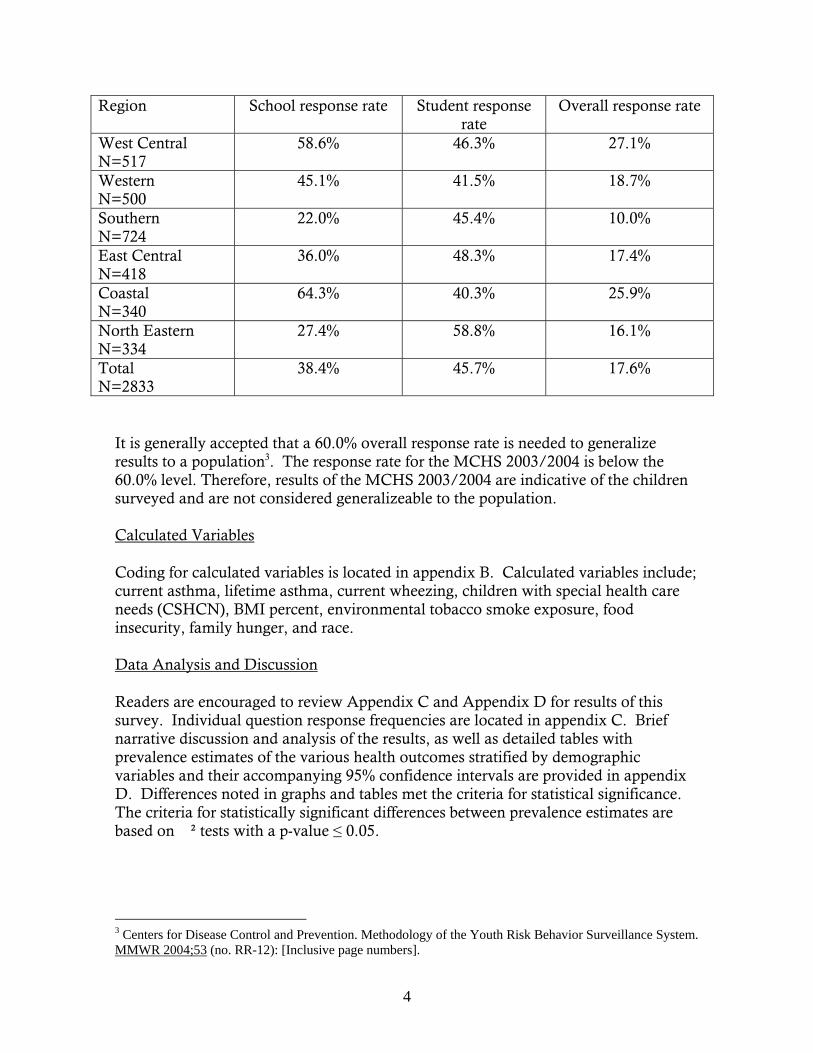
Region School response rate Student response rate
Overall response rate
West Central N=517
58.6% 46.3% 27.1%
Western N=500
45.1% 41.5% 18.7%
Southern N=724
22.0% 45.4% 10.0%
East Central N=418
36.0% 48.3% 17.4%
Coastal N=340
64.3% 40.3% 25.9%
North Eastern N=334
27.4% 58.8% 16.1%
Total N=2833
38.4% 45.7% 17.6%
It is generally accepted that a 60.0% overall response rate is needed to generalize results to a population3. The response rate for the MCHS 2003/2004 is below the 60.0% level. Therefore, results of the MCHS 2003/2004 are indicative of the children surveyed and are not considered generalizeable to the population. Calculated Variables Coding for calculated variables is located in appendix B. Calculated variables include; current asthma, lifetime asthma, current wheezing, children with special health care needs (CSHCN), BMI percent, environmental tobacco smoke exposure, food insecurity, family hunger, and race. Data Analysis and Discussion Readers are encouraged to review Appendix C and Appendix D for results of this survey. Individual question response frequencies are located in appendix C. Brief narrative discussion and analysis of the results, as well as detailed tables with prevalence estimates of the various health outcomes stratified by demographic variables and their accompanying 95% confidence intervals are provided in appendix D. Differences noted in graphs and tables met the criteria for statistical significance. The criteria for statistically significant differences between prevalence estimates are based on �² tests with a p-value ≤ 0.05.
3 Centers for Disease Control and Prevention. Methodology of the Youth Risk Behavior Surveillance System. MMWR 2004;53 (no. RR-12): [Inclusive page numbers].
4

5

6
THIS PAGE INTENTIONALLY LEFT BLANK

7
Appendix A
Maine Child Health Survey Consent Form, Questionnaire and Dental Screening Form

8
MAINE CHILD HEALTH SURVEY CONSENT FORM
We1 want to ask you some questions about your child enrolled in kindergarten or third grade. The survey is not a part of your child’s registration or screening. This survey is voluntary. The school did not develop the survey. The school is helping by letting us ask you these questions now. Both you and your child are asked to participate. You will answer the questions on the survey. Then your child will get their height and weight measured and have their teeth checked. Your permission is required for your child to take part in the survey. Signing this consent form will allow us to do the survey. Your child can refuse to be measured. Your child can also refuse to get their teeth checked. They can refuse by telling or showing us. We will ask about your child’s health. The survey asks about your child’s breathing, dental health, and other health topics. It does not cover all health problems. Answers are confidential. Names will be recorded only so we can identify which children can get measured during school. If we are concerned about your child’s health we will tell you. The information from all surveys combined will allow us to better develop programs for your community and the state. The survey will take about 10 minutes to finish. It will take 5 minutes to check your child’s teeth and measure their height and weight. A dental professional using a light, a disposable tongue blade, and gloves will check your child’s teeth. Information on sealants, the number of decayed, missing and filled teeth, and treatment needs will be recorded. We will keep the surveys in a locked file cabinet. The Maternal Child Health (MCH) Epidemiologist will keep all results. We will not be able to tell who you are from any of the results. If you have any questions about this survey please call: Dwight Littlefield, Asthma Program Manager, Maine Bureau of Health at 207-287-7302 or Judith Feinstein, Oral Health Program Manager, Maine Bureau of Health at 207-3267 or Kathy Tippy, MCH Epidemiologist, Maine Bureau of Health at 207-287-4102. If you have any questions regarding you or your childs’ rights in participating in the child health survey, please contact Paul Kuehnert, Chairperson, Institutional Review Board (IRB), Maine Bureau of Health at 207-287-5179. By signing this form, I understand that: • This is voluntary • My answers will be kept confidential • I understand this may take about 5-10 minutes. • I or my child can quit at any time. • My child’s dental exam does not take the place of an exam done by a dentist. I will be given the results of my child’s dental
exam upon completion. • The questions included in the survey about my child’s breathing are not to be considered an exam. If I have any questions about my child’s breathing, it is recommended I see my child’s physician.
I agree to let my child have his/her teeth checked, height and weight measured and I agree to answer the questions on the survey.
____ Yes ____No PARENT OR GUARDIAN: Print name____________________________ Sign _____________________________ Date ___/___/____ Child’s Name (Please print): First ______________________Middle ________________Last__________________
Child’s Date of Birth: Month ________________ Day _____ Year ________
1 Maine Bureau of Health (MBOH), Division of Community Health.

9
Instructions: Please complete the following questionnaire by either writing your answer on the blank lines or marking the box next to the correct answer(s)
MAINE CHILD HEALTH SURVEY MAINE BUREAU OF HEALTH
1. What is today’s date? _______________ (month, day, ye 2. What is your child’s name?(Please print) First: _________________________MI: _____Last:___ 3. What town/city does your child live in? ___________ 4. What is the name of your child’s school? ____________
5. Has your child ever had wheezing or whistling in the chest at any time in the past? Yes No If ‘NO’, Go to question 7.
6. In the last 12 months, has your child had wheezing or whistling in the chest? Yes No If ‘NO’, Go to question 7. 6a. In the last 12 months, how many attacks of wheezing or whistling has your child had? None 1-3 4-12 More than 12 6b. In the last 12 months, how often, on average, has your child’s sleep been disturbed due to wheezing? Never woken with wheezing Less than one night per week One or more nights per week
6c. I s o 7. Has y Y N 8. In th whee 9. In th distu coug 10. In th activ and/
X
ar)
________________________________
__________
n the last 12 months, has wheezing ever been evere enough to limit your child’s speech to only ne or two words at a time between breaths? Yes
No
My child does not have wheezing
our child ever had asthma? es
o
e last 12 months, has your child’s chest sounded zy during or after exercise? Yes
No
e last 12 months, has your child’s sleep been rbed due to a dry cough at night, APART from a h associated with a cold or a chest infection?
Yes
No
e last 12 months, how often has your child’s ities been limited due to wheezing, dry cough, or breathing difficulties? My child does not have these symptoms
Never
Less than one time per week One or more times per week
Almost daily

11. In the last 12 months, how often did you take your child to the doctor due to wheezing, dry cough and/or breathing difficulties? 0 (No visits) 3-4 visits 1-2 visits 5 + visits 12. In the last 12 months, how many times did you take your child to an emergency room or urgent care due to wheezing, dry cough, and/or breathing difficulties? 0 (No visits) 3-4 visits 1-2 visits 5 + visits 13. In the last 12 months, how many times was your child admitted overnight to a hospital due to wheezing, dry cough, and/or breathing difficulties? 0 (No visits) 3-4 visits 1-2 visits 5 + visits 14. Have you ever been told by a doctor or nurse that your child has asthma? Yes No 15. Where do you usually take your child for medical assistance for asthma? Mark only ONE answer. My child does not have asthma Emergency Room (ER) or Urgent Care Hospital Based Clinic Rural Health Center Private Doctor’s Office No usual source of care for these conditions Do not know Other __________________________ 16. In the last 12 months, has your doctor given you a written plan for taking care of your child’s asthma? Yes No My child does not have asthma
17. How many people living in the same household as your child smoke cigarettes, cigars, or pipes inside the house? 0 (None) 1 person 2 persons 3 or more persons 18. During an average month, about how often is your child near enough to smell or breathe in the smoke from other people’s cigarettes/cigars/pipes? Nearly every day 2-4 times per week Once a week Less than once a week Never 19. During the past 12 months, how often was your child around the following animals? Less than 1-3 About Almost once per times once every Never month per month per week day Dogs Cats 20. In the household where your child lives, is the kitchen stove fueled by either natural gas or propane? Yes No Don’t know 21. In the household where your child lived last winter, were the following heating sources used at least once per month on average? Mark ONE answer for each line. Yes No Kerosene heater? Wood burning stove? Woodburning fireplace? 22. During the past 12 months, was there ‘wall to wall’ carpeting (that is carpeting that covers the entire floor) in your house? Yes, in most of the house No Yes, in some of the house Don’t know
10

23. During the past 12 months, was there ‘wall to wall’ carpeting in the room your child normally slept? Yes No Don’t know 24. Do you have protective plastic coverings on the bed where your child normally sleeps? Yes No Don’t know 25. Does your child have any of the following allergies? Yes No Don’t know Dog allergies Cat allergies Dust allergies Grass or Pollen allergies Answer the next two questions only if your child has had wheezing or whistling in the chest in the last 12 months. 26. Indicate the importance of EACH in triggering your child’s wheezing in the last 12 months. Mark ONE on each line. Not Very Somewhat Important Not Important Important at all Exposed Pets (cats, dogs, etc.) Head colds Exercise Dust, mold Other allergens Cigarette smoke
27. During the past 4 weeks, how many days of work have you or another adult in your household missed because of your child’s wheezing and/or asthma? None Less than 1 day 3-4 days 5 + days
The next two questions are about the child’s biological parents. 28. Has the biological mother of the child ever been told by a doctor or nurse that she has asthma? Yes No Don’t know 29. Has the biological father of the child ever been told by a doctor or nurse that he has asthma? Yes No Don’t know The next seven questions are about your child’s dental health. 30. About how long has it been since your child last visited a dentist? Include dental hygienists as well as all types of dentists, such as orthodontists, oral surgeons, and all other dental specialists. 6 months or less More than 6 months, but not more than 1 year More than 1 year, but not more than 3 years More than 3 years ago My child has never been to a dentist Don’t know/don’t remember
11

31. What was the main reason that your child last visited a dentist? (Please check one) Was called in by the dentist for check-up, examination or cleaning Went in for check-up, examination or cleaning, but was not called Something was wrong, bothering or hurting Went for treatment for something the dentist found at an earlier check-up or examination Other My child has never been to a dentist Don’t know/don’t remember 32. During the past 12 months,was there a time when your child needed dental care but could not get it at that time? (Please check one) Yes No Go to question 34 Don’t know Go to question 34 33. The last time your child could not get the dental care he/she needed, what was the main reason he/she couldn’t get care? (Please check one) Could not afford it No insurance Dentist did not accept Medicaid/insurance Not serious enough Wait too long in clinic/office Difficulty in getting appointments Don’t like/trust/believe in dentists No dentist available Didn’t know where to go No way to get there Hours not convenient Speak a different language Health of another family member Other reason Don’t know/don’t remember
34. Do you have any kind of insurance that pays for some or all of your child’s DENTAL CARE? Include health insurance obtained through work or purchased directly as well as government programs like MaineCare (formerly known as Medicaid, Cub-care or PrimeCare). Yes No Don’t know 35. Has your child ever had dental sealants placed on his/her teeth at either your dental office or through a school program? Sealants are a clear or white material placed on the chewing surface of teeth to prevent cavities. Yes – at a dental office Yes – at a school program No Don’t know 36. During the past 4 weeks, how many days of school has your child missed because of dental problems? (Do not include routine dental/orthodontist visits) None Less than 1 day ( part of a single school day) 1-2 days 3-4 days 5+ days The next three questions are about your child’s safety. 37. How often does your child ride in a booster car seat? Always Almost always Sometimes Rarely Never 38. If your child rides in a booster car seat, is he or she usually in the front or back seat of the car, truck, or van? Front seat Back seat My child doesn’t ride in a booster care seat
12

39. If your child does not ride in a booster car seat, is he/she usually in the front or back of the car, truck, or van? Front seat Back seat My child always rides in a booster car seat
The next questions ask about all conditions that might affect your child's overall health and well-being. 40. Does your child curently need or use medicine prescribed by a doctor (other than vitamins)? Yes Go to question 40a No Go to question 41 40a. Is this because of ANY medical, behavioral or other health condition? Yes Go to question 40b No Go to question 41 40b. Is this a condition that has lasted or is expected to go on for at least twelve months? Yes No 41. Does your child need or use more medical care, mental health or educational services than is usual for most children of the same age? Yes Go to question 41a No Go to question 42 41a. Is this because of ANY medical, behavioral or other health condition? Yes Go to question 41b No Go to question 42 41b. Is this a condition that has lasted or is expected to go on for at least twelve months? Yes No
42. Is your child limited or prevented in any way in his or her ability to do the things most children of the same age can do? Yes Go to question 42a No Go to question 43 42a. Is this because of ANY medical, behavioral or other health condition? Yes Go to question 42b No Go to question 43 42b. Is this a condition that has lasted or is expected to go on for at least twelve months? Yes No 43. Does your child need or get special therapy, such as physical, occupational or speech therapy? Yes Go to question 43a No Go to question 44 43a. Is this because of ANY medical, behavioral or other health condition? Yes Go to question 43b No Go to question 44 43b. Is this a condition that has lasted or is expected to go on for at least twelve months? Yes No 44. Does your child have any kind of emotional, developmental or behavioral problem for which he or she needs or gets treatment or counseling? Yes Go to question 44a No Go to question 45 44a. Has this problem lasted or is it expected to last for at least twelve months? Yes No
13

The next questions are about the food eaten in your family and whether your family has enough food to eat. 45. In the last 12 months, did you (or other adults in your household) ever cut the size of your meals or skip meals because there wasn’t enough money for food? Yes No Go to question 46 Don’t know/not sure Go to question 46 45a. How often did this happen? Almost every month Some months but not every month In only 1 or 2 months 46. In the last 12 months, did you ever eat less than you felt you should because there wasn’t enough money to buy food? Yes No Don’t know/not sure 47. In the last 12 months, were you ever hungry but didn’t eat because you couldn’t afford enough food? Yes No Don’t know/not sure For the next two statements, please check the box that indicates whether the statement was often, sometimes, or never true for you (or the other members of your household) in the last 12 months. 48. “The food that I/we bought just didn’t last, and I/we didn’t have enough money to get more.” Often true Sometimes true Never true
49. I/we couldn’t afford to eat balanced meals.” In the last 12 months, was that: Often true Sometimes true Never true
The next two questions are about your child’s physical activity and nutrition. 50. On an average day, how many hours does your child watch TV? My child does not watch TV on an average school day Less than 1 hour per day 1 hour per day 2 hours per day 3 hours per day 4 hours per day 5 or more hours per day 51. How much soda does your child drink? 2 or more cans per day 1 can per day 2-6 cans per week 1 can per week 1-3 cans per month None 52. What type of insurance is your child covered by at this time (select the best answer)? No Insurance Private Insurance/HMO/CHAMPUS MaineCare (formerly known as Medicaid, Cub-care, or Primecare) Other ______________________ 53. In the past 12 months, was there a time that your child did not have any health insurance coverage, including Medicaid? Yes Go to question 53a No Go to question 54
53a. How many months out of the past 12 months? ________________
14
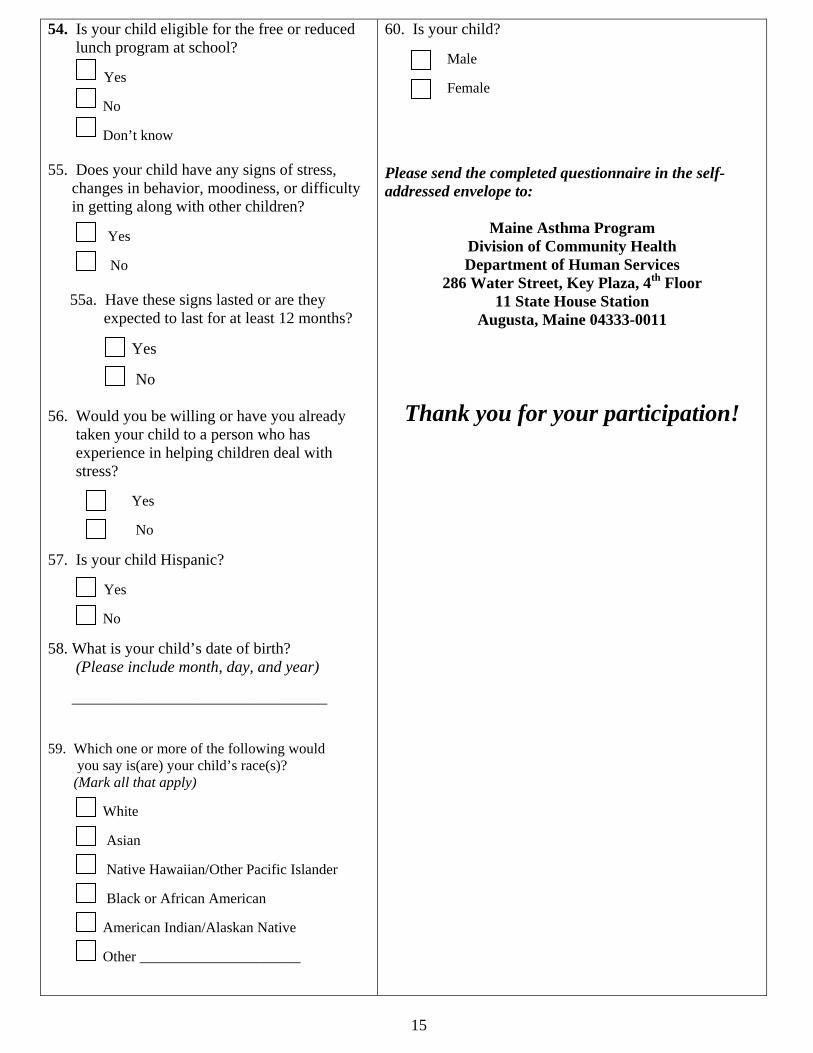
54. Is your child eligible for the free or reduced lunch program at school? Yes No Don’t know 55. Does your child have any signs of stress, changes in behavior, moodiness, or difficulty in getting along with other children? Yes No 55a. Have these signs lasted or are they expected to last for at least 12 months? Yes No 56. Would you be willing or have you already taken your child to a person who has experience in helping children deal with stress? Yes No 57. Is your child Hispanic? Yes No 58. What is your child’s date of birth? (Please include month, day, and year) ________________________________ 59. Which one or more of the following would you say is(are) your child’s race(s)? (Mark all that apply) White Asian Native Hawaiian/Other Pacific Islander Black or African American American Indian/Alaskan Native Other ______________________
60. Is your child? Male Female Please send the completed questionnaire in the self-addressed envelope to:
Maine Asthma Program Division of Community Health Department of Human Services
286 Water Street, Key Plaza, 4th Floor 11 State House Station
Augusta, Maine 04333-0011
Thank you for your participation!
15

Name of School: _______________________________ Child’s Name: First: ___________________ MI:_____ Last Name: ______________________________________________ Child’s Date of Birth: _____________________(MM/DD/YYYY) Child verbally and/or physically agrees to be measured and have their teeth checked. Yes No
Body Mass Measurements: Child’s Height ________ inches Child’s Weight _________lbs
Maine Dental Screening Form
Untreated Cavities: (UC)
0=No untreated cavities 1=Untreated cavities
Caries Experience: (CE)
0=No caries experience 1=Caries experience – primary only 2=Caries experience – permanent only 3=Caries experience – both dentitions
Rampant Caries: (RC)
0=No rampant 1=Rampant > 7 teeth
Sealants on Permanent Molars: (Seal)
0=No sealants present 1=Sealants present
Treatment Urgency: (TU)
0=No obvious problem 1=Early dental care 2=Urgent care
Need for Dental Sealants: (Needseal)
0=No need for sealants 1=Needs dental sealants
Comments:
• All boxes must contain a valid code • Use 4-digit codes for year (i.e. 1989, 1999, 2000) • If no permanent molars, “Sealants on Permanent Molars”=0 • If no permanent molars, “Need for Dental Sealants”=0 Referred: Yes No If yes, reason for referral: Dental (Dental) Respiratory
16

17
Appendix B
Maine Child Health Survey – Kindergarten and Third Grade Data Processing Document

18
Maine Child Health Survey (MCHS) - Kindergarten and Third Grade 2003/04
Data Processing Document I. Calculated Variables
The following table shows how calculated variables are derived and the SAS coding for the individual variables.
Kindergarten & Third Grade Calculated Variables Var Description SAS Code
Q14 Q6 Q8 Q9
Have you ever been told by a doctor or nurse that your child has asthma?
1. yes 2. no
In the last 12 months, has your child had wheezing or whistling in the chest?
1. yes 2. no
In the last 12 months, has your child’s chest sounded wheezy during or after exercise?
1. yes 2. no
In the last 12 months, has your child’s sleep been disturbed due to a dry cough at night, apart, from a cough associated with a cold or chest infection?
1. yes 2. no
Current asthma 1=yes 2=no CASTHMA = 2; if Q14 = 1 and (Q6 = 1 or Q8 = 1 or Q9 = 1) then CASTHMA = 1; if Q14 = .M then CASTHMA = .M; Lifetime asthma 1=yes 2=no IF Q14 = 1 THEN CLIFE = 1; IF Q14 = 2 THEN CLIFE = 2; IF Q14 = .M THEN CLIFE = .M; Current wheezing (no asthma) 1=yes 2=no Cwheeze = 2; if (Q6 = 1 or (Q6 = 2 and Q8 = 1) or (Q6 = 2 and Q9 = 1) OR (Q6 EQ .L and Q9 = 1))and casthma eq 2 then Cwheeze = 1; IF Q6 EQ .L AND Q8 = 1 AND CASTHMA EQ 2 THEN CWHEEZE = 1; IF Q6 EQ .L AND Q9 = 1 AND CASTHMA EQ 2 THEN CWHEEZE = 1; IF Q6 EQ .M AND Q8 = .M AND Q9 EQ .M THEN CWHEEZE = .M;
Weight status computed from height and weight measurements. Body Mass Index % for age and sex computations used to define weight status categories.
Weight status 1 = underweight 2 = normal weight 3 = at risk for overweight 4 = overweight IF BMIPCT EQ .M THEN WGT = .M; IF BMIPCT LT 5.0 AND BMIPCT NE .M THEN WGT = 1; IF BMIPCT GE 5.0 AND BMIPCT LT 85.0 THEN WGT = 2; IF BMIPCT GE 85.0 AND BMIPCT LT 95.0 THEN WGT = 3; IF BMIPCT GE 95.0 THEN WGT = 4;
Q17 Q18
How many people living in the same household as your child smoke cigarettes, cigars, or pipes inside the house?
1. 0 (none) 2. 1 person 3. 2 persons 4. 3 or more persons
During an average month, about how often is your child near enough to smell or breathe in the smoke from other people’s cigarettes/cigars/pipes?
1. Nearly every day 2. 2-4 times per week 3. Once a week 4. Less than once a week 5. Never
Environmental tobacco smoke exposure (ETS) 1= yes 2 = no IF Q17 EQ 1 OR Q18 GE 4 THEN ETS = 2; IF Q17 GT 2 OR Q18 LE 3 THEN ETS = 1; IF Q17 EQ .M OR Q18 EQ .M THEN ETS = .M;
Var Description SAS Code Q40
Does your child currently need or use medicine prescribed by a doctor (other than vitamins)?
Categorical responses used to calculate children w/special health needs (CSHCN) 1=yes 2=no

19
Q41 Q42 Q43 Q44 Q40a, Q41a, Q42a, Q43a, Q44a Q40b, Q41b, Q42b, Q43b
1. Yes 2. No
Does your child need or use more medical care, mental health or educational services than is usual for most children of the same age?
1. Yes 2. No
Is your child limited or prevented in any way in his or her ability to do the things most children of the same age can do?
1. Yes 2. No
Does your child need or get special therapy, such as physical, occupational or speech therapy?
1. Yes 2. No
Does your child have any kind of emotional, developmental or behavioral problem for which he or she needs or gets treatment or counseling?
1. Yes 2. No
Is this because of any medical, behavioral, or other health condition?
1. Yes 2. No
Is this a condition that has lasted or is expected to go on for at least twelve months?
1. Yes 2. No
if (Q40 = 1 and Q40a = 1 and Q40b = 1) THEN PMEDS = 1; IF (Q40 = 1 AND Q40A = .M ) THEN PMEDS = 2; IF (Q40 = 1 AND Q40B = .M) THEN PMEDS = 2; IF (Q40 = 1 AND Q40A = .L) THEN PMEDS = 2; IF (Q40 = 1 AND Q40A = 2) THEN PMEDS = 2; IF (Q40 = 1 AND Q40B = 2) THEN PMEDS = 2; IF Q40 = 2 THEN PMEDS = 2; IF Q40 = .M THEN PMEDS = .M; if (Q41 = 1 and Q41a = 1 and Q41b = 1) THEN USE = 1; IF (Q41 = 1 AND Q41A = .M ) THEN USE = 2; IF (Q41 = 1 AND Q41B = .M) THEN USE = 2; IF (Q41 = 1 AND Q41A = .L) THEN USE = 2; IF (Q41 = 1 AND Q41A = 2) THEN USE = 2; IF (Q41 = 1 AND Q41B = 2) THEN USE = 2; IF Q41 = 2 THEN USE = 2; IF Q41 = .M THEN USE = .M; if (Q42 = 1 and Q42a = 1 and Q42b = 1) THEN LIMIT = 1; IF (Q42 = 1 AND Q42A = .M ) THEN LIMIT = 2; IF (Q42 = 1 AND Q42B = .M) THEN LIMIT = 2; IF (Q42 = 1 AND Q42A = .L) THEN LIMIT = 2; IF (Q42 = 1 AND Q42A = 2) THEN LIMIT = 2; IF (Q42 = 1 AND Q42B = 2) THEN LIMIT = 2; IF Q42 = 2 THEN LIMIT = 2; IF Q42 = .M THEN LIMIT = .M; if (Q43 = 1 and Q43a = 1 and Q43b = 1) THEN THERAPY = 1; IF (Q43 = 1 AND Q43A = .M ) THEN THERAPY = 2; IF (Q43 = 1 AND Q43B = .M) THEN THERAPY = 2; IF (Q43 = 1 AND Q43A = .L) THEN THERAPY = 2; IF (Q43 = 1 AND Q43A = 2) THEN THERAPY = 2; IF (Q43 = 1 AND Q43B = 2) THEN THERAPY = 2; IF Q43 = 2 THEN THERAPY = 2; IF Q43 = .M THEN THERAPY = .M; if (Q44 = 1 and Q44a = 1) THEN TREAT = 1; IF (Q44 = 1 AND Q44A = .M ) THEN TREAT = 2; IF (Q44 = 1 AND Q44A = .L) THEN TREAT = 2; IF (Q44 = 1 AND Q44A = 2) THEN TREAT = 2; IF Q44 = 2 THEN TREAT = 2; IF Q44 = .M THEN TREAT = .M; CHILDREN WITH SPECIAL HEALTH CARE NEEDS (CSHCN) 1= YES 2= NO CSHCN = 2; IF PMEDS = 1 OR USE = 1 OR LIMIT = 1 OR THERAPY = 1 OR TREAT = 1 THEN CSHCN = 1; IF PMEDS = .M AND USE = .M AND LIMIT = .M AND THERAPY = .M AND TREAT = .M THEN CSHCN = .M;
Var Description SAS Code

20
Q45 Q45A Q46 Q47 Q48 Q49
In the last 12 months, did you (or other adults in your household) ever cut the size of your meals or skip meals because there wasn’t enough money for food?
1. Yes 2. No 3. Don’t know/not sure
How often did this happen?
1. Almost every month 2. Some months but not every month 3. In only 1 or 2 months
In the last 12 months, did you ever eat less than you felt you should because there wasn’t enough money to buy food?
1. Yes 2. No 3. Don’t know/not sure
In the last 12 months, were you ever hungry but didn’t eat because you couldn’t afford enough food?
1. Yes 2. No 3. Don’t know/not sure
The food that I/we bought just didn’t last, and I/we didn’t have enough money to get more.
1. Often true 2. Sometimes true 3. Never true
I/we couldn’t afford to eat balanced meals.
1. Often true 2. Sometimes true 3. Never true
Calculating variables for food insecurity 1=yes 2=no IF Q45 EQ 1 THEN SEC1 = 1; IF Q45 EQ 2 THEN SEC1 = 2; IF Q45 EQ 3 THEN SEC1 = 2; IF Q45 EQ .M THEN SEC1 = .M; IF Q45a LE 2 THEN SEC2 = 1; IF Q45a EQ 3 THEN SEC2 = 2; IF Q45a EQ .M THEN SEC2 = .M; IF Q45a EQ .L THEN SEC2 = .L; IF Q46 EQ 1 THEN SEC3 = 1; IF Q46 EQ 2 THEN SEC3 = 2; IF Q46 EQ 3 THEN SEC3 = 2; IF Q46 EQ .M THEN SEC3 = .M; IF Q47 EQ 1 THEN SEC4 = 1; IF Q47 EQ 2 THEN SEC4 = 2; IF Q47 EQ 3 THEN SEC4 = 2; IF Q47 EQ .M THEN SEC4 = .M; IF Q48 LE 2 THEN SEC5 = 1; IF Q48 EQ 3 THEN SEC5 = 2; IF Q48 EQ .M THEN SEC5 = .M; IF Q49 LE 2 THEN SEC6 = 1; IF Q49 EQ 3 THEN SEC6 = 2; IF Q49 EQ .M THEN SEC6 = .M; Code 2+ AFFIRMATIVE = FOOD INSECURITY 5+ AFFIRMATIVE = HUNGER; counter = 0; retain counter; if sec1 = 1 then counter = counter +1; if sec2 = 1 then counter = counter +1; if sec3 = 1 then counter = counter + 1; if sec4 = 1 then counter = counter + 1; if sec5 = 1 then counter = counter +1; if sec6 = 1 then counter = counter + 1; Food Insecurity (foodinsec) 1= yes 2=no Family Hunger (hungry)1=yes 2=no if counter ge 2 then foodinsec = 1; if counter lt 2 and counter ne . then foodinsec = 2; if counter ge 5 then hungry = 1; if counter lt 5 and counter ne . then hungry = 2; if sec1 eq .m and sec2 eq .m and sec3 = .m and sec4 = .m and sec5 = .m and sec6 = .m then foodinsec = .m; if sec1 eq .m and sec2 eq .m and sec3 = .m and sec4 = .m and sec5 = .m and sec6 = .m then hungry = .m;
Var Description SAS Code

21
Q59 Which one or more of the following would you say is(are) your child’s race(s)? (Mark all that apply) White Asian Native Hawaiian/Other Pacific Islander Black or African American American Indian/Alaskan Native Other ____________________
Recoding Race categories RCOUNT = sum(Q59_WH, Q59_ASIAN, Q59_PACISL, Q59_BLACK, Q59_INDIAN); if rcount gt 1 then race = 6; else if rcount = 1 and q59_WH = 1 THEN RACE = 1; ELSE IF RCOUNT = 1 AND q59_asian = 1 THEN race = 2; ELSE IF RCOUNT = 1 AND q59_pacisl = 1 THEN race = 3; ELSE IF RCOUNT = 1 AND q59_black = 1 THEN race = 4; ELSE IF RCOUNT = 1 AND q59_indian = 1 THEN race = 5; IF Q59_WH EQ .M AND Q59_ASIAN = .M AND Q59_PACISL = .M AND Q59_BLACK = .M AND Q59_INDIAN = .M THEN RACE = .M; Recoding race into 1 = white 2=minority 3=multiple race if race eq 1 then race_g = 1; if race gt 1 and race le 5 then race_g = 2; if race eq 6 then race_g = 3; if race eq .m then race_g = .m;
Other notes: .M indicates missing data .L indicates legitimate skip
22
Appendix C
Questionnaire and Dental Screen Responses Unweighted Frequency Tables

Questionnaire and Dental Screen Responses Un-weighted Frequency Tables
The Frequency Procedure
Child ever had wheezing or whistling in chest
Q5 Frequency Percent Cumulative Frequency
Cumulative Percent
Missing 14 0.49 14 0.49
Yes 708 24.99 722 25.49
No 2111 74.51 2833 100.00
Past 12 months: Child had wheezing or whistling in chest
Q6 Frequency Percent Cumulative Frequency
Cumulative Percent
Legitimate Skip 2111 74.51 2111 74.51
Missing 25 0.88 2136 75.40
Yes 405 14.30 2541 89.69
No 292 10.31 2833 100.00
Past 12 months: Number of wheezing attacks child had
Q6a Frequency Percent Cumulative Frequency
Cumulative Percent
Legitimate Skip 2403 84.82 2403 84.82
Missing 28 0.99 2431 85.81
No attacks 5 0.18 2436 85.99
1-3 attacks 271 9.57 2707 95.55
4-12 attacks 101 3.57 2808 99.12
> 12 attacks 25 0.88 2833 100.00
23

24
Past 12 months: How often child's sleep disturbed by wheezing
Q6b Frequency Percent Cumulative Frequency
Cumulative Percent
Legitimate Skip 2403 84.82 2403 84.82
Missing 30 1.06 2433 85.88
Never woken 195 6.88 2628 92.76
< 1 night/week 172 6.07 2800 98.84
≥ 1 night/week 33 1.16 2833 100.00
Past 12 months: Wheezing severe enough to limit child's speech
Q6c Frequency Percent Cumulative Frequency
Cumulative Percent
Legitimate Skip 2403 84.82 2403 84.82
Missing 29 1.02 2432 85.85
Yes 63 2.22 2495 88.07
No 334 11.79 2829 99.86
Does not wheeze 4 0.14 2833 100.00
Child ever had asthma
Q7 Frequency Percent Cumulative Frequency
Cumulative Percent
Missing 29 1.02 29 1.02
Yes 410 14.47 439 15.50
No 2394 84.50 2833 100.00
25
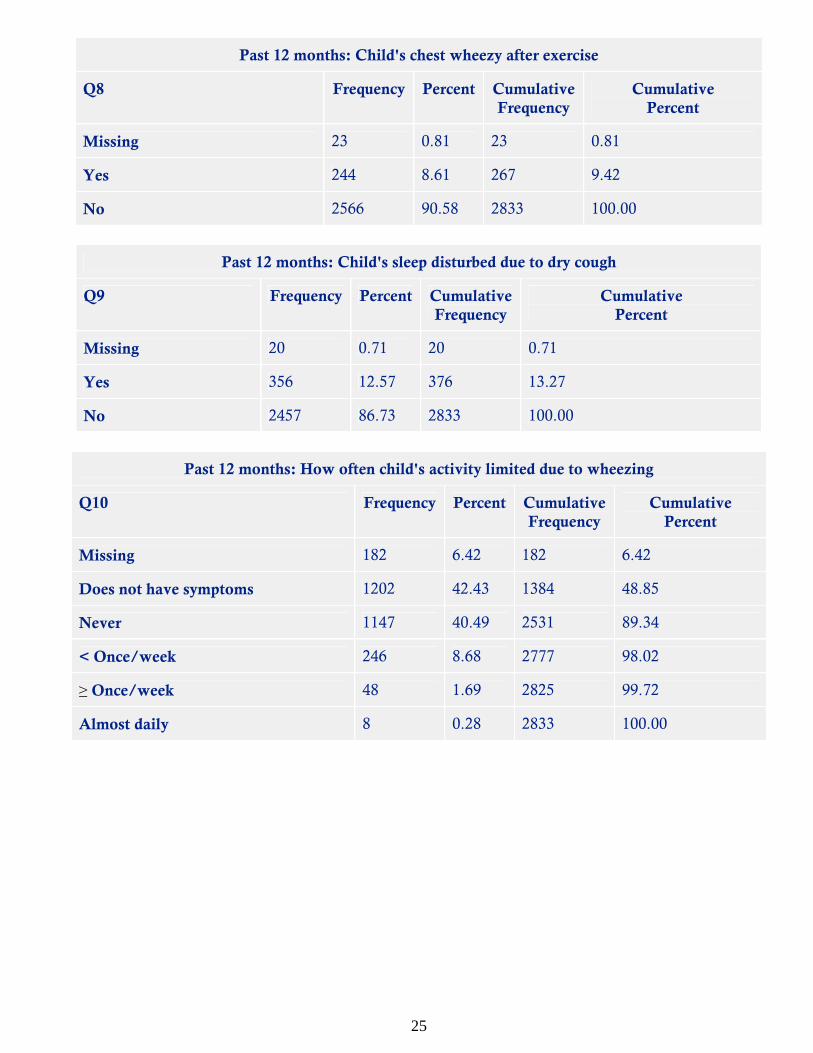
Past 12 months: Child's chest wheezy after exercise
Q8 Frequency Percent Cumulative Frequency
Cumulative Percent
Missing 23 0.81 23 0.81
Yes 244 8.61 267 9.42
No 2566 90.58 2833 100.00
Past 12 months: Child's sleep disturbed due to dry cough
Q9 Frequency Percent Cumulative Frequency
Cumulative Percent
Missing 20 0.71 20 0.71
Yes 356 12.57 376 13.27
No 2457 86.73 2833 100.00
Past 12 months: How often child's activity limited due to wheezing
Q10 Frequency Percent Cumulative Frequency
Cumulative Percent
Missing 182 6.42 182 6.42
Does not have symptoms 1202 42.43 1384 48.85
Never 1147 40.49 2531 89.34
< Once/week 246 8.68 2777 98.02
≥ Once/week 48 1.69 2825 99.72
Almost daily 8 0.28 2833 100.00

26
Past 12 months: How often visit doctor for wheezing
Q11 Frequency Percent Cumulative Frequency
Cumulative Percent
Missing 36 1.27 36 1.27
No visits 2262 79.84 2298 81.12
1-2 visits 398 14.05 2696 95.16
3-4 visits 110 3.88 2806 99.05
5+ visits 27 0.95 2833 100.00
Past 12 months: How often visit ED due to wheezing
Q12 Frequency Percent Cumulative Frequency
Cumulative Percent
Missing 29 1.02 29 1.02
No visits 2661 93.93 2690 94.95
1-2 visits 129 4.55 2819 99.51
3-4 visits 13 0.46 2832 99.96
5+ visits 1 0.04 2833 100.00
Past 12 months: How often admitted as in-patient due to wheezing
Q13 Frequency Percent Cumulative Frequency
Cumulative Percent
Missing 24 0.85 24 0.85
No visits 2787 98.38 2811 99.22
1-2 visits 22 0.78 2833 100.00

27
Ever told by doctor that child has asthma
Q14 Frequency Percent Cumulative Frequency
Cumulative Percent
Missing 39 1.38 39 1.38
Yes 442 15.60 481 16.98
No 2352 83.02 2833 100.00
Place child is usually taken for medical assistance for asthma
Q15 Frequency Percent Cumulative Frequency
Cumulative Percent
Missing 106 3.74 106 3.74
Does not have asthma 2218 78.29 2324 82.03
ER or Urgent Care 14 0.49 2338 82.53
Hospital Based Clinic 14 0.49 2352 83.02
Rural Health Center 31 1.09 2383 84.12
Private Doctor's Office 356 12.57 2739 96.68
No usual source of care 51 1.80 2790 98.48
Don't know 7 0.25 2797 98.73
Other 36 1.27 2833 100.00
28
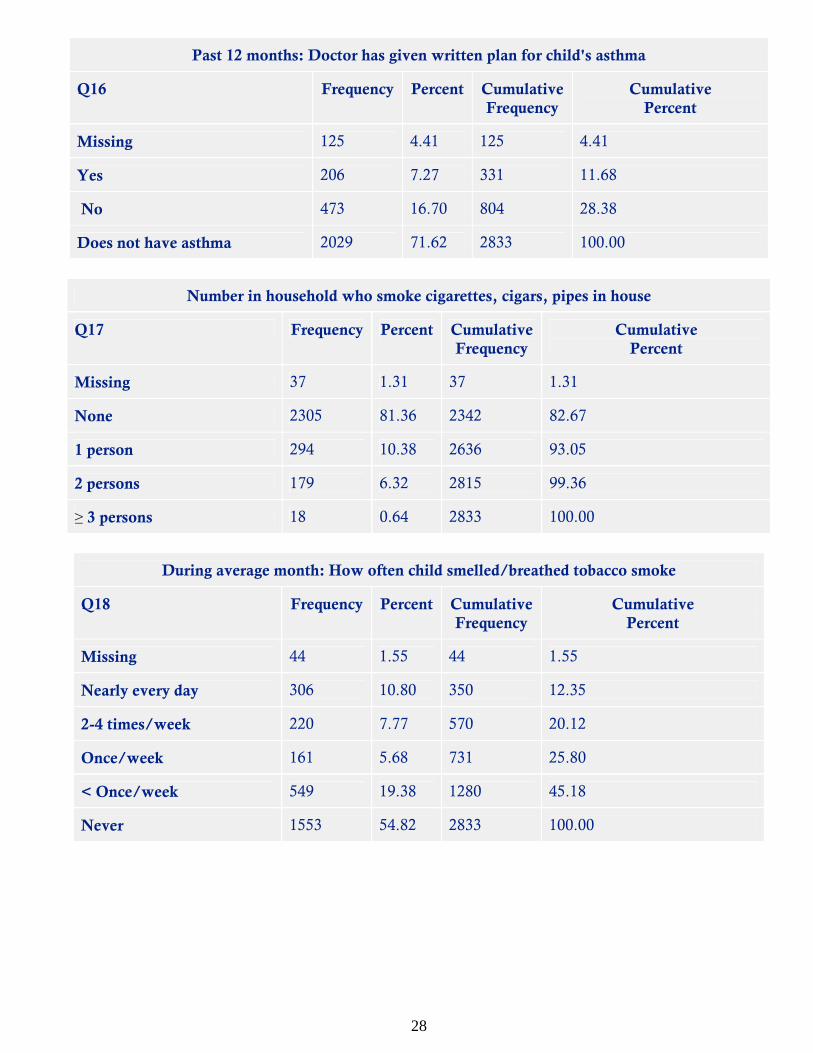
Past 12 months: Doctor has given written plan for child's asthma
Q16 Frequency Percent Cumulative Frequency
Cumulative Percent
Missing 125 4.41 125 4.41
Yes 206 7.27 331 11.68
No 473 16.70 804 28.38
Does not have asthma 2029 71.62 2833 100.00
Number in household who smoke cigarettes, cigars, pipes in house
Q17 Frequency Percent Cumulative Frequency
Cumulative Percent
Missing 37 1.31 37 1.31
None 2305 81.36 2342 82.67
1 person 294 10.38 2636 93.05
2 persons 179 6.32 2815 99.36
≥ 3 persons 18 0.64 2833 100.00
During average month: How often child smelled/breathed tobacco smoke
Q18 Frequency Percent Cumulative Frequency
Cumulative Percent
Missing 44 1.55 44 1.55
Nearly every day 306 10.80 350 12.35
2-4 times/week 220 7.77 570 20.12
Once/week 161 5.68 731 25.80
< Once/week 549 19.38 1280 45.18
Never 1553 54.82 2833 100.00

29
Past 12 months: How often child around dogs
Q19_dogs Frequency Percent Cumulative Frequency
Cumulative Percent
Missing 241 8.51 241 8.51
Never 189 6.67 430 15.18
< Once/month 376 13.27 806 28.45
1-3 times/month 300 10.59 1106 39.04
About once/week 230 8.12 1336 47.16
Almost every day 1497 52.84 2833 100.00
Past 12 months: How often child around cats
Q19_cats Frequency Percent Cumulative Frequency
Cumulative Percent
Missing 196 6.92 196 6.92
Never 315 11.12 511 18.04
< Once/month 340 12.00 851 30.04
1-3 times/month 212 7.48 1063 37.52
About once/week 138 4.87 1201 42.39
Almost every day 1632 57.61 2833 100.00
Kitchen stove: Natural gas or propane
Q20 Frequency Percent Cumulative Frequency
Cumulative Percent
Missing 40 1.41 40 1.41
Yes 673 23.76 713 25.17
No 2092 73.84 2805 99.01
Don't know 28 0.99 2833 100.00

30
At least once a month last winter: Heat-source: Kerosene
Q21_kero Frequency Percent Cumulative Frequency
Cumulative Percent
Missing 243 8.58 243 8.58
Yes 184 6.49 427 15.07
No 2406 84.93 2833 100.00
At least once a month last winter: Heat-source: Wood stove
Q21_wood Frequency Percent Cumulative Frequency
Cumulative Percent
Missing 119 4.20 119 4.20
Yes 711 25.10 830 29.30
No 2003 70.70 2833 100.00
At least once a month last winter: Heat-source: Wood fireplace
Q21_firep Frequency Percent Cumulative Frequency
Cumulative Percent
Missing 240 8.47 240 8.47
Yes 305 10.77 545 19.24
No 2288 80.76 2833 100.00
Past 12 months: Wall to wall carpet in house
Q22 Frequency Percent Cumulative Frequency
Cumulative Percent
Missing 33 1.16 33 1.16
Yes - most of house 1026 36.22 1059 37.38
Yes - some of house 1214 42.85 2273 80.23
No 558 19.70 2831 99.93
Don't know 2 0.07 2833 100.00
Past 12 months: Wall to wall carpet where child sleeps

31
Q23 Frequency Percent Cumulative Frequency
Cumulative Percent
Missing 29 1.02 29 1.02
Yes 1996 70.46 2025 71.48
No 805 28.42 2830 99.89
Don't know 3 0.11 2833 100.00
Protective plastic covering on child's bed
Q24 Frequency Percent Cumulative Frequency
Cumulative Percent
Missing 29 1.02 29 1.02
Yes 677 23.90 706 24.92
No 2123 74.94 2829 99.86
Don't know 4 0.14 2833 100.00
Child has dog allergies
Q25_dog Frequency Percent Cumulative Frequency
Cumulative Percent
Missing 96 3.39 96 3.39
Yes 64 2.26 160 5.65
No 2348 82.88 2508 88.53
Don't know 325 11.47 2833 100.00

32
Child has cat allergies
Q25_cat Frequency Percent Cumulative Frequency
Cumulative Percent
Missing 84 2.97 84 2.97
Yes 126 4.45 210 7.41
No 2295 81.01 2505 88.42
Don't know 328 11.58 2833 100.00
Child has dust allergies
Q25_dust Frequency Percent Cumulative Frequency
Cumulative Percent
Missing 65 2.29 65 2.29
Yes 246 8.68 311 10.98
No 1999 70.56 2310 81.54
Don't know 523 18.46 2833 100.00
Child has grass or pollen allergies
Q25_grass Frequency Percent Cumulative Frequency
Cumulative Percent
Missing 65 2.29 65 2.29
Yes 329 11.61 394 13.91
No 1874 66.15 2268 80.06
Don't know 565 19.94 2833 100.00

33
Past 4 weeks: Work days missed by parent or other adult due to child's asthma
Q27 Frequency Percent Cumulative Frequency
Cumulative Percent
Missing 1945 68.66 1945 68.66
None 771 27.21 2716 95.87
< 1 day 70 2.47 2786 98.34
3-4 days 41 1.45 2827 99.79
5+ days 6 0.21 2833 100.00
Biological mother ever told by doctor she has asthma
Q28 Frequency Percent Cumulative Frequency
Cumulative Percent
Missing 37 1.31 37 1.31
Yes 492 17.37 529 18.67
No 2197 77.55 2726 96.22
Don't know 107 3.78 2833 100.00
Biological father ever told by doctor he has asthma
Q29 Frequency Percent Cumulative Frequency
Cumulative Percent
Missing 40 1.41 40 1.41
Yes 260 9.18 300 10.59
No 2292 80.90 2592 91.49
Don't know 241 8.51 2833 100.00

34
Time since child's last dental visit
Q30 Frequency Percent Cumulative Frequency
Cumulative Percent
Missing 29 1.02 29 1.02
≤ 6 months 1993 70.35 2022 71.37
6 months < x ≤ 1 year 340 12.00 2362 83.37
1 year < x ≤ 3 years 206 7.27 2568 90.65
> 3 years 36 1.27 2604 91.92
Child never been to dentist 212 7.48 2816 99.40
Don't know/remember 17 0.60 2833 100.00
Main reason for child's last dental visit
Q31 Frequency Percent Cumulative Frequency
Cumulative Percent
Missing 57 2.01 57 2.01
Called in by dentist 447 15.78 504 17.79
Went, but was not called 1790 63.18 2294 80.97
Symptom visit 71 2.51 2365 83.48
Treatment visit 189 6.67 2554 90.15
Other 51 1.80 2605 91.95
Child never been to dentist 212 7.48 2817 99.44
Don't know/remember 16 0.56 2833 100.00
35
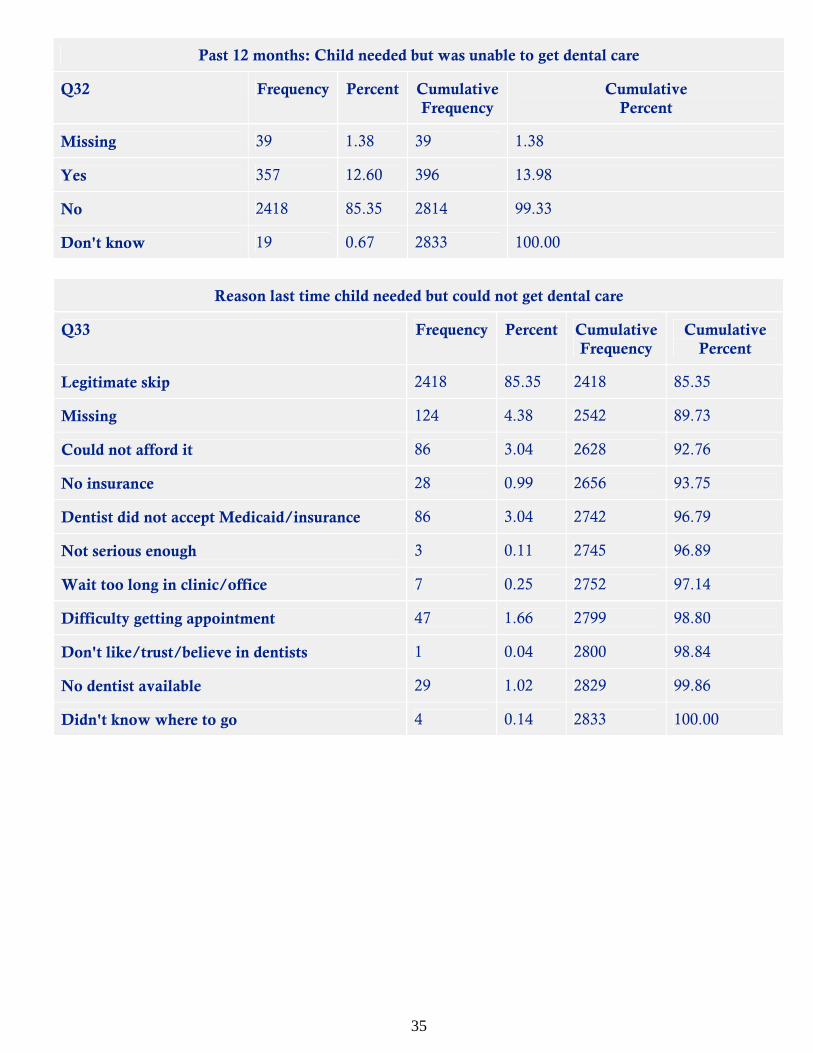
Past 12 months: Child needed but was unable to get dental care
Q32 Frequency Percent Cumulative Frequency
Cumulative Percent
Missing 39 1.38 39 1.38
Yes 357 12.60 396 13.98
No 2418 85.35 2814 99.33
Don't know 19 0.67 2833 100.00
Reason last time child needed but could not get dental care
Q33 Frequency Percent Cumulative Frequency
Cumulative Percent
Legitimate skip 2418 85.35 2418 85.35
Missing 124 4.38 2542 89.73
Could not afford it 86 3.04 2628 92.76
No insurance 28 0.99 2656 93.75
Dentist did not accept Medicaid/insurance 86 3.04 2742 96.79
Not serious enough 3 0.11 2745 96.89
Wait too long in clinic/office 7 0.25 2752 97.14
Difficulty getting appointment 47 1.66 2799 98.80
Don't like/trust/believe in dentists 1 0.04 2800 98.84
No dentist available 29 1.02 2829 99.86
Didn't know where to go 4 0.14 2833 100.00

36
Child covered under dental insurance
Q34 Frequency Percent Cumulative Frequency
Cumulative Percent
Missing 35 1.24 35 1.24
Yes 2173 76.70 2208 77.94
No 618 21.81 2826 99.75
Don't know 7 0.25 2833 100.00
Child ever had dental sealants
Q35 Frequency Percent Cumulative Frequency
Cumulative Percent
Missing 79 2.79 79 2.79
Yes - dental office 885 31.24 964 34.03
Yes - school program 125 4.41 1089 38.44
No 1649 58.21 2738 96.65
Don't know 95 3.35 2833 100.00
Past 4 weeks: Number of school days missed due to dental problems
Q36 Frequency Percent Cumulative Frequency
Cumulative Percent
Missing 19 0.67 19 0.67
None 2743 96.82 2762 97.49
< 1 day 35 1.24 2797 98.73
1-2 days 31 1.09 2828 99.82
3-4 days 4 0.14 2832 99.96
5+ days 1 0.04 2833 100.00
37
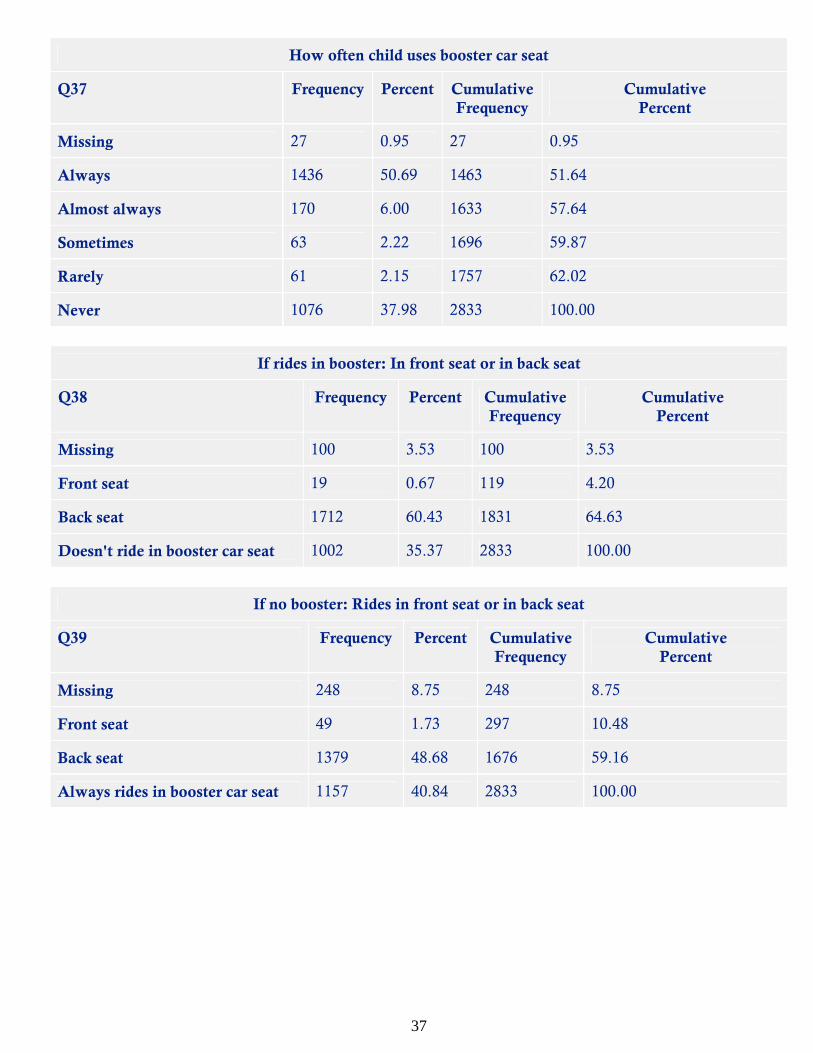
How often child uses booster car seat
Q37 Frequency Percent Cumulative Frequency
Cumulative Percent
Missing 27 0.95 27 0.95
Always 1436 50.69 1463 51.64
Almost always 170 6.00 1633 57.64
Sometimes 63 2.22 1696 59.87
Rarely 61 2.15 1757 62.02
Never 1076 37.98 2833 100.00
If rides in booster: In front seat or in back seat
Q38 Frequency Percent Cumulative Frequency
Cumulative Percent
Missing 100 3.53 100 3.53
Front seat 19 0.67 119 4.20
Back seat 1712 60.43 1831 64.63
Doesn't ride in booster car seat 1002 35.37 2833 100.00
If no booster: Rides in front seat or in back seat
Q39 Frequency Percent Cumulative Frequency
Cumulative Percent
Missing 248 8.75 248 8.75
Front seat 49 1.73 297 10.48
Back seat 1379 48.68 1676 59.16
Always rides in booster car seat 1157 40.84 2833 100.00

38
Child currently needs/uses medication prescribed by doctor
Q40 Frequency Percent Cumulative Frequency
Cumulative Percent
Missing 20 0.71 20 0.71
Yes 529 18.67 549 19.38
No 2284 80.62 2833 100.00
Need for prescription due to medical, behavioral, or other condition
Q40a Frequency Percent Cumulative Frequency
Cumulative Percent
Legitimate Skip 2284 80.62 2284 80.62
Missing 29 1.02 2313 81.64
Yes 460 16.24 2773 97.88
No 60 2.12 2833 100.00
Condition requiring prescription has lasted/expected to last ≥ 12 months
Q40b Frequency Percent Cumulative Frequency
Cumulative Percent
Legitimate Skip 2344 82.74 2344 82.74
Missing 31 1.09 2375 83.83
Yes 414 14.61 2789 98.45
No 44 1.55 2833 100.00

39
Child needs more medical, mental health, educational services than usual
Q41 Frequency Percent Cumulative Frequency
Cumulative Percent
Missing 46 1.62 46 1.62
Yes 363 12.81 409 14.44
No 2424 85.56 2833 100.00
Need for more services due to medical, behavioral or other condition
Q41a Frequency Percent Cumulative Frequency
Cumulative Percent
Legitimate Skip 2424 85.56 2424 85.56
Missing 50 1.76 2474 87.33
Yes 303 10.70 2777 98.02
No 56 1.98 2833 100.00
Condition requiring more services has lasted/expected to last ≥ 12 months
Q41b Frequency Percent Cumulative Frequency
Cumulative Percent
Legitimate Skip 2480 87.54 2480 87.54
Missing 53 1.87 2533 89.41
Yes 285 10.06 2818 99.47
No 15 0.53 2833 100.00

40
Child limited in ability to do things others same age do
Q42 Frequency Percent Cumulative Frequency
Cumulative Percent
Missing 45 1.59 45 1.59
Yes 140 4.94 185 6.53
No 2648 93.47 2833 100.00
Limitation due to medical, behavioral or other condition
Q42a Frequency Percent Cumulative Frequency
Cumulative Percent
Legitimate Skip 2648 93.47 2648 93.47
Missing 46 1.62 2694 95.09
Yes 123 4.34 2817 99.44
No 16 0.56 2833 100.00
Limiting condition has lasted/expected to last ≥12 months
Q42b Frequency Percent Cumulative Frequency
Cumulative Percent
Legitimate Skip 2664 94.03 2664 94.03
Missing 49 1.73 2713 95.76
Yes 116 4.09 2829 99.86
No 4 0.14 2833 100.00

41
Child needs/gets physical, occupational or speech therapy
Q43 Frequency Percent Cumulative Frequency
Cumulative Percent
Missing 24 0.85 24 0.85
Yes 361 12.74 385 13.59
No 2448 86.41 2833 100.00
Need for special therapy due to medical, behavioral or other condition
Q43a Frequency Percent Cumulative Frequency
Cumulative Percent
Legitimate Skip 2448 86.41 2448 86.41
Missing 30 1.06 2478 87.47
Yes 156 5.51 2634 92.98
No 199 7.02 2833 100.00
Special need has lasted/expected to last ≥12 months
Q43b Frequency Percent Cumulative Frequency
Cumulative Percent
Legitimate Skip 2647 93.43 2647 93.43
Missing 27 0.95 2674 94.39
Yes 149 5.26 2823 99.65
No 10 0.35 2833 100.00

42
Child needs/gets treatment for emotional, developmental or behavioral problems
Q44 Frequency Percent Cumulative Frequency
Cumulative Percent
Missing 29 1.02 29 1.02
Yes 292 10.31 321 11.33
No 2512 88.67 2833 100.00
Problem has lasted/expected to last ≥ 12 months
Q44a Frequency Percent Cumulative Frequency
Cumulative Percent
Legitimate Skip 2512 88.67 2512 88.67
Missing 40 1.41 2552 90.08
Yes 257 9.07 2809 99.15
No 24 0.85 2833 100.00
Past 12 months: I/other adult reduced/skipped own meal: No money
Q45 Frequency Percent Cumulative Frequency
Cumulative Percent
Missing 20 0.71 20 0.71
Yes 154 5.44 174 6.14
No 2650 93.54 2824 99.68
Don't know/not sure 9 0.32 2833 100.00

43
How often I/other adult reduced/skipped meal
Q45a Frequency Percent Cumulative Frequency
Cumulative Percent
Legitimate Skip 2659 93.86 2659 93.86
Missing 29 1.02 2688 94.88
Almost every month 52 1.84 2740 96.72
Some months but not every 63 2.22 2803 98.94
In only 1 or 2 months 30 1.06 2833 100.00
Past 12 months: I (adult) ate less: No money
Q46 Frequency Percent Cumulative Frequency
Cumulative Percent
Missing 24 0.85 24 0.85
Yes 194 6.85 218 7.70
No 2600 91.78 2818 99.47
Don't know/not sure 15 0.53 2833 100.00
Past 12 months: At times I (adult) did not eat: No money
Q47 Frequency Percent Cumulative Frequency
Cumulative Percent
Missing 31 1.09 31 1.09
Yes 116 4.09 147 5.19
No 2673 94.35 2820 99.54
Don't know/not sure 13 0.46 2833 100.00

44
Food I/we bought did not last: No money to buy more
Q48 Frequency Percent Cumulative Frequency
Cumulative Percent
Missing 28 0.99 28 0.99
Often true 53 1.87 81 2.86
Sometimes true 309 10.91 390 13.77
Never true 2443 86.23 2833 100.00
Past 12 months: I/we could not afford balanced meals
Q49 Frequency Percent Cumulative Frequency
Cumulative Percent
Missing 25 0.88 25 0.88
Often true 53 1.87 78 2.75
Sometimes true 276 9.74 354 12.50
Never true 2479 87.50 2833 100.00
On average: Number of hours TV child watches per day
Q50 Frequency Percent Cumulative Frequency
Cumulative Percent
Missing 61 2.15 61 2.15
Does not watch on school day 138 4.87 199 7.02
< 1 hours/day 385 13.59 584 20.61
1 hours/day 773 27.29 1357 47.90
2 hours/day 995 35.12 2352 83.02
3 hours/day 360 12.71 2712 95.73
4 hours/day 91 3.21 2803 98.94
≥ 5 hours/day
30 1.06 2833 100.00
45
Amount of soda child drinks
Q51 Frequency Percent Cumulative Frequency
Cumulative Percent
Missing 35 1.24 35 1.24
≥2 cans/day 12 0.42 47 1.66
1 can/day 97 3.42 144 5.08
2-6 cans/week 256 9.04 400 14.12
1 can/week 557 19.66 957 33.78
1-3 cans/month 983 34.70 1940 68.48
None 893 31.52 2833 100.00
Type of insurance child covered by
Q52 Frequency Percent Cumulative Frequency
Cumulative Percent
Missing 94 3.32 94 3.32
No insurance 132 4.66 226 7.98
Private ins./HMO/CHAMPUS 1774 62.62 2000 70.60
MaineCare 808 28.52 2808 99.12
Other 25 0.88 2833 100.00
Past 12 months: At times child did not have health insurance/Medicaid
Q53 Frequency Percent Cumulative Frequency
Cumulative Percent
Missing 24 0.85 24 0.85
Yes 261 9.21 285 10.06
No 2548 89.94 2833 100.00

46
Child eligible for free/reduced lunches at school
Q54 Frequency Percent Cumulative Frequency
Cumulative Percent
Missing 14 0.49 14 0.49
Yes 911 32.16 925 32.65
No 1684 59.44 2609 92.09
Don't know 224 7.91 2833 100.00
Child has signs of stress, behavior changes or moodiness
Q55 Frequency Percent Cumulative Frequency
Cumulative Percent
Missing 22 0.78 22 0.78
Yes 415 14.65 437 15.43
No 2396 84.57 2833 100.00
Signs have lasted/expected to last ≥12 months
Q55a Frequency Percent Cumulative Frequency
Cumulative Percent
Missing 1178 41.58 1178 41.58
Yes 263 9.28 1441 50.86
No 1392 49.14 2833 100.00
Willing to take/already taken child to be treated for stress
Q56 Frequency Percent Cumulative Frequency
Cumulative Percent
Missing 307 10.84 307 10.84
Yes 1010 35.65 1317 46.49
No 1516 53.51 2833 100.00

47
Hispanic
Q57 Frequency Percent Cumulative Frequency
Cumulative Percent
Missing 36 1.27 36 1.27
Yes 41 1.45 77 2.72
No 2756 97.28 2833 100.00
Dental referral
Dental Frequency Percent Cumulative Frequency
Cumulative Percent
Missing 318 11.22 318 11.22
Not referred for dental 2130 75.19 2448 86.41
Referred for dental 385 13.59 2833 100.00
Caries experience
Caries experience Frequency Percent Cumulative Frequency
Cumulative Percent
Missing 318 11.22 318 11.22
No caries experience 1683 59.41 2001 70.63
Caries experience- primary only 717 25.31 2718 95.94
Caries experience - permanent only 35 1.24 2753 97.18
Caries experience - both dentitions 80 2.82 2833 100.00
Rampant caries
Rampant caries Frequency Percent Cumulative Frequency
Cumulative Percent
Missing 318 11.22 318 11.22
No rampant caries 2501 88.28 2819 99.51
Rampant >= 7 teeth 14 0.49 2833 100.00
Sealants on permanent molars

48
Sealants on permanent molars Frequency Percent Cumulative Frequency
Cumulative Percent
Missing 318 11.22 318 11.22
No sealants present 1821 64.28 2139 75.50
Sealants present 694 24.50 2833 100.00
Treatment urgency
Treatment urgency Frequency Percent Cumulative Frequency
Cumulative Percent
Missing 318 11.22 318 11.22
No obvious problem 2124 74.97 2442 86.20
Early dental care 387 13.66 2829 99.86
Urgent care 4 0.14 2833 100.00
Untreated cavities
Untreated cavities Frequency Percent Cumulative Frequency
Cumulative Percent
Missing 318 11.22 318 11.22
No untreated cavities 2110 74.48 2428 85.70
Untreated cavities 405 14.30 2833 100.00
Need for sealants
Need for sealants Frequency Percent Cumulative Frequency
Cumulative Percent
Missing 318 11.22 318 11.22
No need for sealants 1531 54.04 1849 65.27
Needs dental sealants 984 34.73 2833 100.00

49
Appendix D
Detailed Tables and Figures

Table 2. Demographic data according to region Variable % (N) % (N) % (N) % (N) % (N) % (N) % (N)
MCHS Total West Central Western Southern East Central Coastal North Eastern
56.4 (1599) 59.6 (308) 65.4 (327) 60.4 (437) 50.0 (209) 45.9 (156) 48.5 (162) Grade K
43.6 (1234) 40.4 (209) 34.6 (173) 39.6 (287) 50.0 (209) 54.1 (184) 51.5 (172) Grade 3
Sex 48.9 (1385) 51.1 (264) 49.0 (245) 49.5 (358) 49.0 (205) 42.7 (145) 50.3 (168) Boys
Girls 51.1 (1448) 48.9 (253) 51.0 (255) 50.6 (366) 51.0 (213) 57.4 (195) 49.7 (166) Race
94.9 (315) 93.5 (314) 94.0 (389) 94.8 (677) 92.3 (456) 91.8 (467) 93.5 (2618) White 1.5 (5) 1.8 (6) 1.9 (8) 2.2 (16 2.6 (13) 3.3 (17) 2.3 (65) Minority (Asian, Native
Hawaiian/Pacific Islander, Black/African American,
American Indian/Alaskan
Native) Multiple Race
3.6 (12) 4.8 (16) 4.8 (17) 2.9 (21) 5.1 (25) 4.9 (25) 4.1 (116)
Missing 34 8 6 10 4 4 2
Hispanic 1.5 (41) 2.4 (12) 1.4 (7) 1.7 (12) 1.0 (4) 0.9 (3) 0.9 (3)
Missing 36 6 10 6 6 6 2
Insurance Private/HMO MaineCare None Other
64.8 (1774) 29.5 (808) 4.8 (132) 0.9 (25)
62.1 (309) 32.5 (162)
4.8 (24) 0.6 (3)
52.2 (247) 39.3 (186)
7.6 (36) 0.9 (4)
78.3 (551) 17.6 (124)
3.7 (26) 0.4 (3)
67.3 (276) 27.1 (111)
4.4 (18) 1.2 (5)
66.1 (218) 29.1 (96) 4.6 (15) 0.3 (1)
53.4 (173) 39.8 (129)
4.0 (13) 2.8 (9)
Missing 94 19 27 20 8 10 10
Free/reduced lunch Yes No Don’t know
32.3 (911) 59.7 (1684)
8.0 (224)
38.4 (197) 55.0 (282)
6.6 (34)
44.2 (219) 49.2 (244)
6.7 (33)
15.5 (112) 71.3 (514) 13.2 (95)
30.7 (128) 66.2 (276)
3.1 (13)
31.3 (106) 59.0 (200)
9.7 (33)
44.7 (149) 50.5 (168)
4.8 (16)
Missing 14 4 4 3 1 1 1
N= number of children.
50

Figure 1. Prevalence of current asthma, lifetime asthma, and current wheezing by grade
15.8
18.318
11.212.3
13.914
10.4
8.910.0
12
7.6
0
2
4
6
8
10
16
20
Combined grades (N=2794) Kindergarten (N=1580) Third grade (N=1214)
Perc
ent
Current Asthma Lifetime Asthma Current Wheezing
• Of the children surveyed, 11 percent have current asthma, almost 16 percent indicated that they
had asthma at some time in their life, and 9 percent experienced wheezing without a diagnosis of asthma in the past 12 months.
• Third graders (18.3%) were more likely to have had asthma at some time in their life than kindergartners (13.9%).
• Kindergartners (10.0%) were more likely to have experienced wheezing in the past 12 months without a diagnosis of asthma than third graders (7.6%).
• Current and lifetime asthma did not vary regionally (see table 3). • Current wheezing varied regionally from 6.6 percent (Southern) to 12 percent (North
Eastern)(see table 3).
51
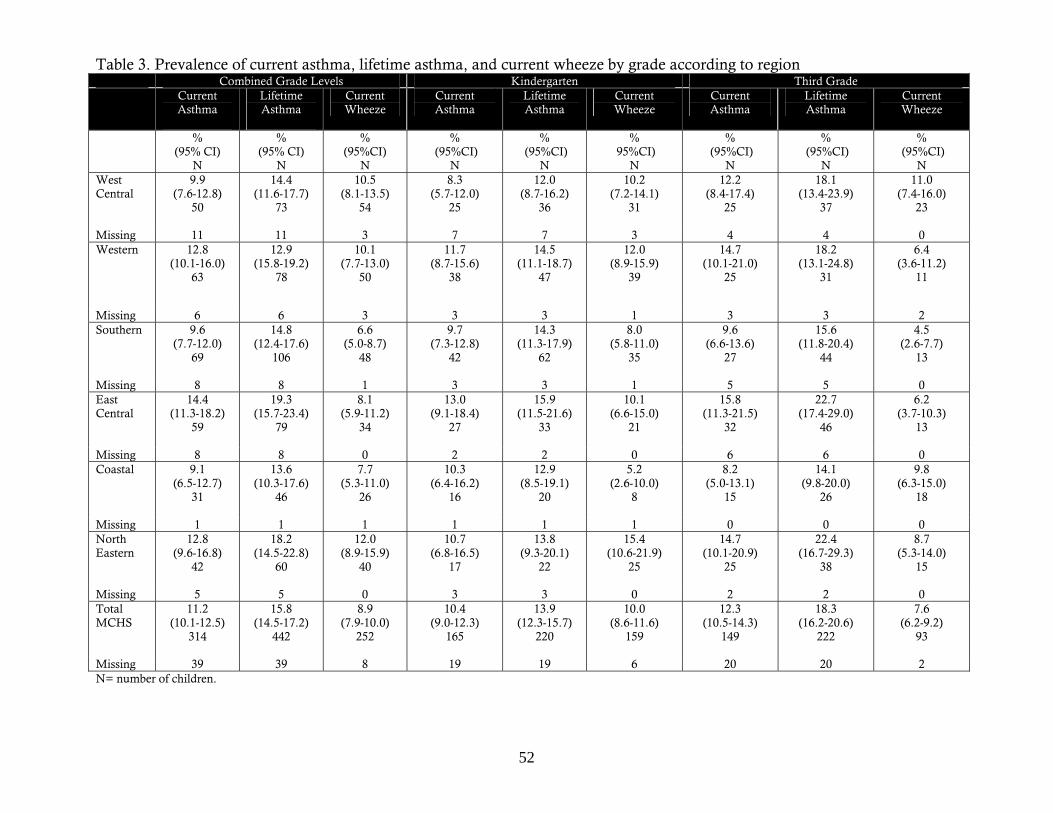
52
Table 3. Prevalence of current asthma, lifetime asthma, and current wheeze by grade according to region
Combined Grade Levels Kindergarten Third Grade Current
Asthma
Lifetime Asthma
Current Wheeze
Current Asthma
Lifetime Asthma
Current Wheeze
Current Asthma
Lifetime Asthma
Current Wheeze
%(95% CI)
N
% (95% CI)
N
% (95%CI)
N
% (95%CI)
N
% (95%CI)
N
% 95%CI)
N
% (95%CI)
N
% (95%CI)
N
% (95%CI)
N West Central
9.9 (7.6-12.8)
50
14.4 (11.6-17.7)
73
10.5 (8.1-13.5)
54
8.3 (5.7-12.0)
25
12.0 (8.7-16.2)
36
10.2 (7.2-14.1)
31
12.2 (8.4-17.4)
25
18.1 (13.4-23.9)
37
11.0 (7.4-16.0)
23
Missing 11 11 3 7 7 3 4 4 0Western
12.8 (10.1-16.0)
63
12.9 (15.8-19.2)
78
10.1 (7.7-13.0)
50
11.7 (8.7-15.6)
38
14.5 (11.1-18.7)
47
12.0 (8.9-15.9)
39
14.7 (10.1-21.0)
25
18.2 (13.1-24.8)
31
6.4 (3.6-11.2)
11
Missing 6 6 3 3 3 1 3 3 2Southern
9.6 (7.7-12.0)
69
14.8 (12.4-17.6)
106
6.6 (5.0-8.7)
48
9.7 (7.3-12.8)
42
14.3 (11.3-17.9)
62
8.0 (5.8-11.0)
35
9.6 (6.6-13.6)
27
15.6 (11.8-20.4)
44
4.5 (2.6-7.7)
13
Missing 8 8 1 3 3 1 5 5 0East Central
14.4 (11.3-18.2)
59
19.3 (15.7-23.4)
79
8.1 (5.9-11.2)
34
13.0 (9.1-18.4)
27
15.9 (11.5-21.6)
33
10.1 (6.6-15.0)
21
15.8 (11.3-21.5)
32
22.7 (17.4-29.0)
46
6.2 (3.7-10.3)
13
Missing 8 8 0 2 2 0 6 6 0Coastal 9.1
(6.5-12.7) 31
13.6 (10.3-17.6)
46
7.7 (5.3-11.0)
26
10.3 (6.4-16.2)
16
12.9 (8.5-19.1)
20
5.2 (2.6-10.0)
8
8.2 (5.0-13.1)
15
14.1 (9.8-20.0)
26
9.8 (6.3-15.0)
18
Missing 1 1 1 1 1 1 0 0 0North Eastern
12.8 (9.6-16.8)
42
18.2 (14.5-22.8)
60
12.0 (8.9-15.9)
40
10.7 (6.8-16.5)
17
13.8 (9.3-20.1)
22
15.4 (10.6-21.9)
25
14.7 (10.1-20.9)
25
22.4 (16.7-29.3)
38
8.7 (5.3-14.0)
15
Missing 5 5 0 3 3 0 2 2 0Total MCHS
11.2 (10.1-12.5)
314
15.8 (14.5-17.2)
442
8.9 (7.9-10.0)
252
10.4 (9.0-12.3)
165
13.9 (12.3-15.7)
220
10.0 (8.6-11.6)
159
12.3 (10.5-14.3)
149
18.3 (16.2-20.6)
222
7.6 (6.2-9.2)
93
Missing 39 39 8 19 19 6 20 20 2N= number of children.

53
Figure 2. Prevalence of current asthma, lifetime asthma, and current wheezing by sex
13.6
18.9
12.9
8.59.3
9.0
0
5
10
15
20
25
Boys (N=1368) Girls (N=1426)
Perc
ent
Current asthma Lifetime asthma Current wheezing
• Current asthma, lifetime asthma, and current wheezing did not differ regionally by sex (see table 4).
• There are no differences among boys (8.5%) and girls (9.3%) experiencing wheezing in the past 12 months without a diagnosis of asthma.
• Of the children surveyed, boys (13.6%, 18.9%) are more likely to have current and lifetime asthma than girls (9.0%, 12.9%).
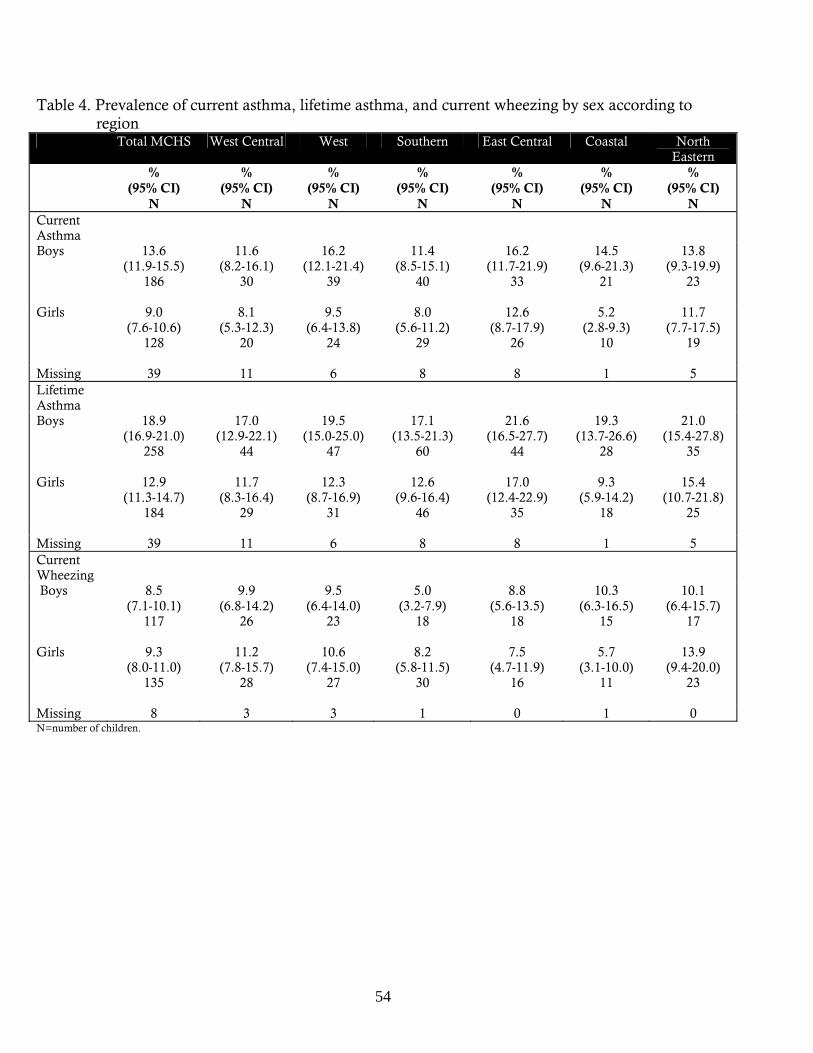
Table 4. Prevalence of current asthma, lifetime asthma, and current wheezing by sex according to region
Total MCHS West Central West Southern East Central Coastal North Eastern
% (95% CI)
N
% (95% CI)
N
% (95% CI)
N
% (95% CI)
N
% (95% CI)
N
% (95% CI)
N
% (95% CI)
N Current Asthma
Boys 13.6 (11.9-15.5)
186
11.6 (8.2-16.1)
30
16.2 (12.1-21.4)
39
11.4 (8.5-15.1)
40
16.2 (11.7-21.9)
33
14.5 (9.6-21.3)
21
13.8 (9.3-19.9)
23
Girls 9.0 (7.6-10.6)
128
8.1 (5.3-12.3)
20
9.5 (6.4-13.8)
24
8.0 (5.6-11.2)
29
12.6 (8.7-17.9)
26
5.2 (2.8-9.3)
10
11.7 (7.7-17.5)
19
Missing 39 11 6 8 8 1 5 Lifetime Asthma
Boys 18.9 (16.9-21.0)
258
17.0 (12.9-22.1)
44
19.5 (15.0-25.0)
47
17.1 (13.5-21.3)
60
21.6 (16.5-27.7)
44
19.3 (13.7-26.6)
28
21.0 (15.4-27.8)
35
Girls 12.9 (11.3-14.7)
184
11.7 (8.3-16.4)
29
12.3 (8.7-16.9)
31
12.6 (9.6-16.4)
46
17.0 (12.4-22.9)
35
9.3 (5.9-14.2)
18
15.4 (10.7-21.8)
25
Missing 39 11 6 8 8 1 5 Current Wheezing
Boys 8.5 (7.1-10.1)
117
9.9 (6.8-14.2)
26
9.5 (6.4-14.0)
23
5.0 (3.2-7.9)
18
8.8 (5.6-13.5)
18
10.3 (6.3-16.5)
15
10.1 (6.4-15.7)
17
Girls 9.3 (8.0-11.0)
135
11.2 (7.8-15.7)
28
10.6 (7.4-15.0)
27
8.2 (5.8-11.5)
30
7.5 (4.7-11.9)
16
5.7 (3.1-10.0)
11
13.9 (9.4-20.0)
23
Missing 8 3 3 1 0 1 0 N=number of children.
54

Figure 3. Prevalence of current asthma, lifetime asthma, and current wheezing by race
10.912.3
17.515.5
18.5
23.7
8.9 9.5
12.3
0
5
10
15
20
25
30
White (N=2589) Minority (N=65) Multiple race (N=114)
Perc
ent
Current asthma Lifetime asthma Current wheeze
• Of the children surveyed, the percentage who had asthma at some time in their life or currently had asthma did not differ according to race.
• Even though there are no real differences in the prevalence of asthma or current wheeze among racial categories, children reporting more than one race had the highest estimated prevalence of current asthma and lifetime asthma (17.5%, 23.7%) than children reporting white (10.9%, 15.5%) or minority race (12.3%, 18.5%).
• Almost 9 percent of white, 12 percent of minority, and 9.5 percent of children with multiple races reported wheezing symptoms with no diagnosis of asthma.
• Of the children surveyed, current wheezing did not vary by race.
55

Figure 4. Prevalence of current asthma, lifetime asthma, and current wheezing by insurance coverage
9.5
15.1
5.4
14.7
7.77.7
11.6
9.0
18.8
0
2
4
6
8
10
12
14
16
18
20
Private/HMO (N=1754) MaineCare (N=802) No insurance (N=130)
Perc
ent
Current asthma Lifetime asthma Current wheeze
• Children covered by MaineCare (15.1%, 18.8%) are more likely at some time in their life or to
currently have asthma than children with private/HMO insurance (9.5%, 14.7%) or even those with no insurance (5.4%, 7.7%)(see table 5).
56

Table 5. Prevalence of current asthma, lifetime asthma, and current wheeze by insurance coverage and race
Current Asthma Lifetime Asthma Current Wheeze %
(95% CI) N
% (95% CI)
N
% (95% CI)
N
Insurance Coverage
Private/HMO 9.5 (8.2-10.9)
166
14.7 (13.1-16.4)
258
7.7 (6.6-9.1)
137 MaineCare 15.1
(12.8-17.7) 121
18.8 (16.3-21.7)
151
11.6 (9.6-14.0)
94 No insurance 5.4
(2.6-10.9) 7
7.7 (4.2-13.7)
10
9.0 (8.0-10.1)
244 Missing 114 114 85
Race White 10.9
(9.8-12.2) 283
15.5 (14.1-16.9)
400
8.9 (7.8-10.0)
232 Minority 12.3
(6.3-22.7) 8
18.5 (10.8- 29.8)
12
12.3 (6.3-22.8)
8 Multiple race 17.5
(11.6-25.7) 20
23.7 (16.7-32.4)
27
9.5 (5.3-16.3)
11 Missing 57 57 57 Figure 5. Prevalence of children with special health care needs (CSHCN) by grade and sex
57
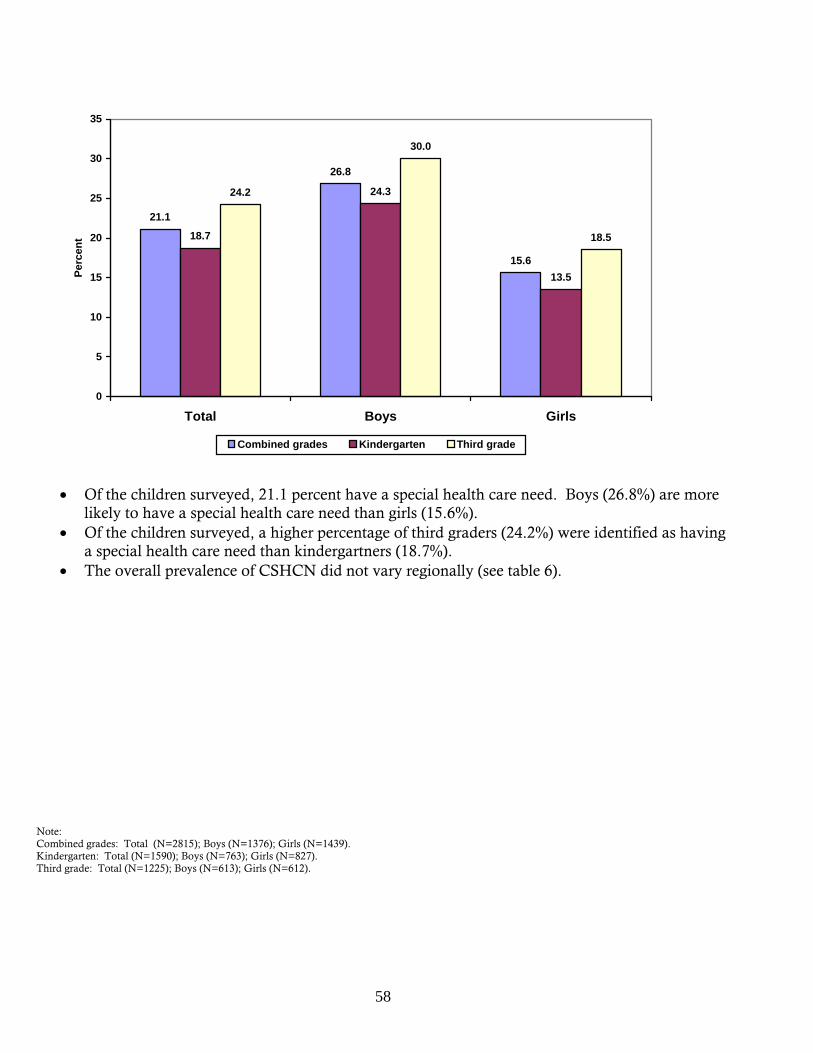
21.1
26.8
15.6
18.7
24.3
13.5
24.2
30.0
18.5
0
5
10
15
20
25
30
35
Total Boys Girls
Perc
ent
Combined grades Kindergarten Third grade
• Of the children surveyed, 21.1 percent have a special health care need. Boys (26.8%) are more
likely to have a special health care need than girls (15.6%). • Of the children surveyed, a higher percentage of third graders (24.2%) were identified as having
a special health care need than kindergartners (18.7%). • The overall prevalence of CSHCN did not vary regionally (see table 6).
Note: Combined grades: Total (N=2815); Boys (N=1376); Girls (N=1439). Kindergarten: Total (N=1590); Boys (N=763); Girls (N=827). Third grade: Total (N=1225); Boys (N=613); Girls (N=612).
58

Table 6. Prevalence of children with special health care needs by grade and sex according to region Total MCHS West Central West Southern East Central Coastal North
Eastern %
(95% CI) N
% (95% CI)
N
% (95% CI)
N
% (95% CI)
N
% (95% CI)
N
% (95% CI)
N
% (95% CI)
N Combined grades
21.1 (19.6-22.6)
594
22.2 (18.8-25.9)
114
21.0 (17.7-24.8)
104
17.9 (15.3-20.9)
129
23.3 (19.5-27.7)
97
19.5 (15.7-24.1)
66
25.2 (20.8-30.2)
84 Boys 26.8
(24.5-29.2) 369
27.8 (22.7-33.4)
73
26.5 (21.3-32.4)
64
24.8 (20.6-29.5)
88
27.3 (21.6-33.9)
56
25.7 (19.2-33.5)
37
30.5 (24.0-38.0)
51 Girls 15.6
(13.9-17.6) 225
16.3 (12.3-21.4)
41
15.8 (11.8-20.8)
40
11.3 (8.4-14.9)
41
19.4 (14.6-25.4)
41
15.0 (10.6-20.6)
29
19.9 (14.4-26.7)
33 Missing 18 3 5 5 2 2 1
Grade K 18.7 (16.9-20.7)
297
20.3 (16.2-25.2)
62
19.3 (15.4-24.0)
63
15.5 (12.4-19.2)
67
23.9 (18.6-30.2)
50
14.8 (10.1-21.3)
23
19.8 (14.3-26.7)
32 Boys 24.3
(21.3-27.4) 185
27.7 (21.4-35.2)
43
22.4 (16.7-29.4)
37
22.7 (17.4-29.1)
44
29.4 (21.3-39.0)
30
23.9 (15.2-35.4)
16
18.8 (11.5-29.0)
15 Girls 13.5
(11.4-16.1) 112
12.7 (8.2-19.1)
19
16.2 (11.2-22.7)
26
9.6 (6.5-14.1)
23
18.7 (12.5-27.3)
20
8.0 (3.8-15.8)
7
20.7 (13.2-31.0)
17 Missing 9 3 1 4 0 1 0
Grade 3 24.2 (21.9-26.7)
297
24.9 (19.5-31.2)
52
24.3 (18.5-31.2)
41
21.7 (17.3-26.8)
62
22.7 (17.5-29.0)
47
23.5 (17.9-30.2)
43
30.4 (23.9-37.8)
52 Boys 30.0
(26.5-33.8) 184
27.8 (20.2-36.9)
30
35.1 (25.3-46.3)
27
27.3 (21.0-34.7)
44
25.2 (17.7-34.6)
26
27.3 (18.5-38.3)
21
41.4 (31.4-52.1)
36 Girls 18.5
(15.6-21.7) 113
21.8 (14.8-30.9)
22
15.2 (9.2-24.1)
14
14.4 (9.3-21.7)
18
20.2 (13.5-29.0)
21
20.8 (14.1-29.4)
22
19.1 (12.0-29.0)
16 Missing 9 0 4 1 2 1 1
N = number of children.
59

Figure 6. Prevalence of children with special health care needs (CSHCN) by race and grade
20.5
26.6
33.0
17.7
30.6
34.3
2421.4
31.1
0
5
10
15
20
25
30
35
40
White Minority Multiple race
Perc
ent
Combined grades Kindergarten Third grade
• Of the children surveyed, CSHCN differed according to race. • Children with multiple race (33.0%) are more likely to have a special health care need than children
reported as white race (20.5%). Note: Combined grades: White (N=2610); Minority (N=64); Multiple race (N=115). Kindergarten: White (N=1470); Minority (N=36); Multiple race (N=70). Third grade: White (N=1140); Minority (N=28); Multiple race (N=45).
60

Figure 7. Prevalence of children with special health care needs (CSHCN) by insurance coverage
16.9
30.7
9.9
15.1
26.7
19.0
36.8
0
5
10
15
20
25
30
35
40
Private/HMO MaineCare No insurance
Perc
ent
Combined grades Kindergarten Third grade
• Of the children surveyed, CSHCN differed according to insurance coverage. • Children covered by MaineCare (30.7%) are more likely to have a special health care need than
children with Private/HMO insurance (16.9%). • A higher percentage of third graders covered by MaineCare (36.8%) have a special health care need
than children in kindergarten covered by MaineCare (26.7%). Note: Data not presented due to confidentiality for kindergarten & third grade with no insurance coverage.
Combined grades: Private/HMO (N=1769); MaineCare (N=805); No insurance (N=131). Kindergarten: Private/HMO (N984); MaineCare (N=484). Third grade: Private/HMO (N=785); MaineCare (N=321).
61

Table 7. Prevalence of children with special health care needs by insurance coverage and race according to grade level
Combined Grade Levels Kindergarten Third Grade %
(95% CI) N
% (95% CI)
N
% (95% CI)
N Insurance Coverage
Private/HMO 16.9 (15.2-18.7)
298
15.1 (13.1-17.5)
149
19.0 (16.4-21.9)
149 MaineCare 30.7
(27.6-34.0) 247
26.7 (22.9-30.8)
129
36.8 (31.6-42.2)
118 No insurance 9.9
(5.9-16.3) 13
* *
Missing 103 51 52
Race White 20.5
(19.0-22.0) 534
17.7 (15.8-19.7)
260
24.0 (21.6-26.6)
274 Minority 26.6
(17.3-38.5) 17
30.6 (17.9-47.0)
11
21.4 (10.0-40.1)
6 Multiple race 33.0
(25.1-42.1) 38
34.3 (24.2-46.0)
24
31.1 (19.3-46.0)
14 Missing 44 23 21
*Indicates 5 or fewer responses, therefore, data not presented due to confidentiality. N= number of children.
62

63
Figure 8. Prevalence of at-risk for overweight and overweight by sex
17.619.0
16.518.3
5
10
15
20
25
30
Girls (N=1255)
Perc
ent
0Boys (N=1202)
At-risk of overweight (BMI 85.0%-94.9%)Overweight (BMI >=95%)
Of the children surveyed, 17.9% are at-risk for Of the children surveyed, 36.6% of boys and their age and sex (see table 8). There are no differences among children at riskAt-risk for overweight or overweight did not There are no differences among children at-riskgrade level.
• overweight and 17.7% are overweight. (See Table 8) • 34.8% of girls have a body mass index (BMI) ≥ 85% for
• for overweight or overweight according to sex. • vary regionally by sex (see table 8). • for overweight or overweight by sex according to

Table 8. Prevalence of at-risk for overweig
At-risk of overwe
Boys 17.6
Girls 18.3
Overweight 17.7
Boys 19.0
Girls 16.5
Missing N= number o
64
ht and overweight by sex according to region Total MCHS West Central West Southern East Central Coastal North
Eastern %
(95% CI) N
% (95% CI)
N
% (95% CI)
N
% (95% CI)
N
% (95% CI)
N
% (95% CI)
N
% (95% CI)
N
ight 17.9
(16.4-19.5) 440
20.0 (16.6-24.0)
89
17.7 (14.3-21.6)
75
17.7 (14.9-20.8)
114
15.1 (11.9-19.1)
56
19.5 (15.4-24.5)
57
17.5 (13.5-22.4)
49
(15.5-19.8) 211
21.8 (17.0-27.6)
51
18.7 (13.9-24.7)
38
15.4 (11.8-19.8)
49
15.7 (11.1-21.8)
28
17.6 (11.9-25.3)
22
16.0 (10.8-22.9)
23
(16.2-20.5) 229
18.0 (13.4-23.8)
38
16.7 (12.3-22.2)
37
19.9 (15.9-24.6)
65
14.6 (10.3-20.3)
28
21.0 (15.4-27.9)
35
19.1 (13.4-26.5)
26
(16.3-19.3) 435
17.3 (14.1-21.1)
77
19.1 (15.7-23.0)
81
15.5 (12.9-18.5)
100
18.1 (14.5-22.4)
67
15.1 (11.4-19.6)
44
23.6 (18.9-28.9)
66
(16.9-21.3) 228
16.2 (12.1-21.5)
38
21.7 (16.6-27.8)
44
16.7 (13.0-21.2)
53
19.1 (14.0-25.6)
34
14.4 (9.3-21.6)
18
28.5 (21.6-36.5)
41
(14.6-18.6) 207
18.5 (13.8-24.3)
39
16.7 (12.3-22.2)
37
14.4 (11.0-18.6)
47
17.2 (12.6-23.1)
33
15.6 (10.9-21.8)
26
18.4 (12.7-25.9)
25 58 10 12 14 4 12 6
f children.

Table 9. Prevalence of at-risk for overweight and overweight by sex according to grade level
Kindergarten Third Grade %
(95% CI) N
% (95% CI)
N At-risk of overweight 17.8
(15.9-19.9) 242
18.0 (15.9-20.4)
198 Boys 17.9
(15.2-21.1) 118
17.1 (14.2-20.5)
93 Girls 17.7
(15.1-20.7) 124
18.9 (15.9-22.4)
105 Overweight 15.4
(13.6-17.4) 209
20.6 (18.3-23.0)
226 Boys 16.0
(13.4-19.0) 105
22.6 (19.3-26.3)
123 Girls 14.9
(12.4-17.7) 104
18.6 (15.5-22.0)
103 N=number of children.
65

Figure 9 Prevalence of at-risk for overweight and overweight by race
17.9
20.0
14.9
17.7
14.0
21.3
0
5
10
15
20
25
White (N=2286) Minority (N=50) Multiple race (N=94)
Perc
ent
At-risk of overweight (BMI 85.0-94.9%)Overweight (BMI >=95%)
• Of all the children surveyed, at-risk for overweight and overweight did not differ by race.
66

Figure 10 Prevalence of at-risk for overweight and overweight by insurance coverage
17.818.6
15.415.5
22.823.9
0
5
10
15
20
25
30
Private/HMO (N=1565) MaineCare (N=676) No insurance (N=117)
Perc
ent
At-risk of overweight (BMI 85.0%-94.9%)Overweight (BMI >=95.0%)
• Of the children surveyed, at-risk for overweight did not differ by insurance coverage. • Of the children surveyed, overweight differed by insurance coverage. • Children covered by MaineCare (22.8%) or having no insurance coverage (23.9%) are more likely to
be overweight than children with Private/HMO insurance coverage (15.5%).
67

Table 10. Prevalence of at-risk for overweight and overweight by insurance coverage and race At-risk of Overweight Overweight
% (95% CI)
N
% (95% CI)
N Insurance Coverage
Private/HMO 17.8 (16.0-19.7)
278
15.5 (13.8-17.3)
242 MaineCare 18.6
(15.9-21.7) 126
22.8 (19.8-26.1)
154 No insurance 15.4
(9.9-23.1) 18
23.9 (17.1-32.5)
28 Race White 17.9
(16.3-19.5) 408
17.7 (16.2-19.3)
405 Minority 20.0
(11.1-33.3) 10
14.0 (6.8-26.6)
7 Multiple race 14.9
(9.0-23.6) 14
21.3 (14.2-30.7)
20 N=number of children.
68

Figure 11. Prevalence of children at-risk for overweight and overweight by television (TV) viewing
23.0
17.8 17.3
7.4
16.0
29.7
0
5
10
15
20
25
30
35
No TV Viewing (N=122) <=2 hrs/day (N=1885) >= 3 hrs/day (N=404)
Perc
ent
At-risk of overweight (BMI 85.0%-94.9%)Overweight (BMI >=95.0%)
• Overweight increased relative to TV viewing. • Children viewing 3 hours or more of TV on average per day (29.7%) were more likely to be
overweight than children who did not usually watch TV (7.4%). • Of the children surveyed, at-risk of overweight did not differ according to TV viewing time.
69

Figure 12. Prevalence of children at-risk for overweight and overweight by soda consumption
17.1 19.015.6
21.518.8
11.516.8
21.426.8
32.9
80
0
10
20
30
40
50
60
70
80
90
None (N=759) 1-3 cans/mo(N=864)
1 can/wk(N=487)
2-6 cans/wk(N=228)
1 can/day (N=85) >=2 cans/day(N=10)
Perc
ent
At-risk of overweight (BMI 85.0%-94.9%) Overweight (BMI >=95.0%)
• Of the children surveyed, at-risk of overweight did not vary according to soda consumption. • Overweight increased relative to the amount of soda consumption. • Children who consume soda daily are more likely to be overweight than children who consume soda
on a monthly basis. • Children consuming 2 or more cans of soda per day (80.0%) were more likely to be overweight than
children who consumed 2-6 cans/week (26.8%) or less.
Note: No data to present for at-risk of overweight by >=2 cans/day. Table 11. Prevalence of at-risk for overweight and overweight by television viewing and soda consumption
At-Risk of Overweight Overweight
70

% (95% CI)
N
% (95% CI)
N TV Viewing
No TV Viewing 23.0 (16.3-31.2)
28
7.4 (3.9-13.6)
9 <= 2 hours/day 17.8
(16.1-19.6) 335
16.0 (14.4-17.7)
301 >= 3 hours/day 17.3
(13.9-21.4) 70
29.7 (25.5-34.4)
120 Missing 104 104
Soda consumption None 17.1
(14.6-20.0) 130
11.5 (9.4-13.9)
87 1-3 cans/month 19.0
(16.5-21.7) 164
16.8 (14.4-19.4)
145 1 can/week 15.6
(12.7-19.1) 76
21.4 (17.9-25.2)
104 2-6 cans/week 21.5
(16.6-27.3) 49
26.8 (21.4-32.9)
61 1 can/day 18.8
(11.8-28.6) 16
32.9 (23.8-43.6)
28 >= 2 cans/day 0 80.0
(46.0-95.0) 8
Missing 82 82 *N= number of events.
71

Figure 13. Prevalence of environmental tobacco smoke (ETS) exposure by region and grade
29.3
17.5
23.3
21.9
31.1
25.7
30.0
33.1
16.6
23.8
23.7
29.6
25.5
28.3
38.1
18.8
22.8
20.3
32.5
25.9
34.8
0 5 10 15 20 25 30 35 40
West Central
Western
Southern
East Central
Coastal
North Eastern
Total
Total Kindergarten Third Grade
• Of all the children surveyed, ETS exposure varied regionally from 17.5% (Southern) to 34.8% (Western).
• ETS exposure varied regionally among kindergartners from 16.6% (Southern) to 33.1% (Western). • ETS exposure varied regionally among third graders from 18.9% (Southern) to 38.1% (Western).
Note: Total: West Central (N=502); Western (N=488); Southern (N=715); East Central (N=412); Coastal (N=334); North Eastern (N=328). Kindergarten: West Central (N=297); Western (N=320); Southern (N=433); East Central (N=206); Coastal (N=152); North Eastern (N=159). Third grade: West Central (N=205); Western (N=168); Southern (N=282); East Central (N=206); Coastal (N=182); North Eastern (N=169).
72

Figure 14. Prevalence of environmental tobacco smoke (ETS) exposure by race according to grade level
25.7
30.7
25.6
29
25.9
33.3
17.5
0
5
10
15
20
25
30
35
40
White Minority Multiple race
Perc
ent
Combined grades Kindergarten Third grade
• Of the children surveyed, environmental tobacco smoke exposure did not vary according race or grade level.
Note: Data not presented due to confidentiality for kindergartners & third graders who are a racial minority. Combined grades: White (N=2577); Minority (N=63); Multiple race (N=114). Kindergarten: White (N=1449); Minority (N=35); Multiple race (N=69). Third grade: White (N=1122); Minority (N=28); Multiple race (N=45).
73

Figure 15. Prevalence of environmental tobacco smoke (ETS) exposure by insurance coverage according to grade level
15.1
38.5
14.8
47.4
32.8
15.4
46.944.4
47.2
0
10
20
30
40
50
60
70
Private/HMO MaineCare No Insurance
Perc
ent
Combined grades Kindergarten Third grade
• Of the children surveyed, ETS exposure varied by insurance coverage from 15.1% (Private/HMO) to
47.2% (MaineCare). • Of the children surveyed those who are covered by MaineCare and those with no insurance coverage
were more likely to be exposed to tobacco smoke than children with Private/HMO insurance coverage (see table 12).
• ETS exposure varied by insurance coverage according to grade level (see table 13). Note: Combined grades: Private/HMO (N=1751); MaineCare (N=791); No insurance (N=130). Kindergarten: Private/HMO (N=974); MaineCare (N=471); No insurance (N=67). Third grade: Private/HMO (N=777); MaineCare (N=320); No insurance (N=63).
74

Table 12. Prevalence of environmental tobacco smoke exposure (ETS) by sex, race, and insurance coverage according to region
Total MCHS West Central West Southern East Central Coastal North Eastern %
(95% CI) N
% (95% CI)
N
% (95% CI)
N
% (95% CI)
N
% (95% CI)
N
% (95% CI)
N
% (95% CI)
N Combined Grade Levels
25.7 (24.1-27.3)
713
29.3 (25.6-33.3)
147
34.8 (30.7-39.2)
170
17.5 (14.9-20.4)
125
23.3 (19.6-27.5)
96
21.9 (17.9-26.5)
73
31.1 (26.4-36.2)
102 Boys 25.1
(22.9-27.5) 340
30.1 (24.8-35.9)
77
32.6 (26.9-38.9)
77
15.9 (12.5-20.1)
56
22.3 (17.1-28.6)
45
21.5 (15.6-29.0)
31
32.7 (26.0-40.3)
54 Girls 26.2
(24.0-28.5) 373
28.5 (23.2-34.3)
70
36.9 (31.2-43.0)
93
19.0 (15.3-23.3)
69
24.3 (19.0-30.5)
51
22.1 (16.8-28.5)
42
29.5 (23.2-36.6)
48 Missing 54 15 2 9 6 6 6 Grade K 25.5
(23.4-27.6) 399
30.0 (25.2-35.2)
89
33.1 (28.2-38.5)
106
16.6 (13.5-20.3)
72
23.8 (18.6-29.9)
49
23.7 (17.6-31.1)
36
29.6 (23.1-37.0)
47 Grade 3 25.9
(23.6-28.4) 314
28.3 (22.6-34.9)
58
38.1 (31.0-45.7)
64
18.8 (14.7-23.8)
53
22.8 (17.7-28.9)
47
20.3 (15.2-26.6)
37
32.5 (26.0-39.9)
55 N= number of children.
75
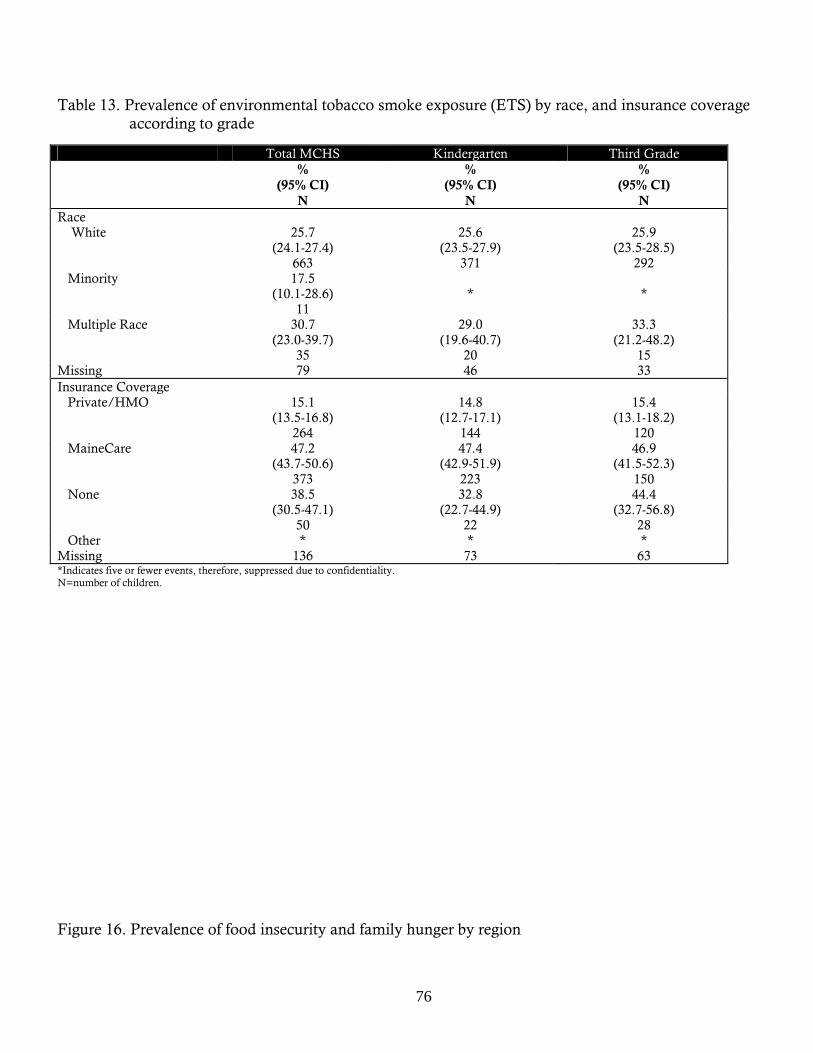
Table 13. Prevalence of environmental tobacco smoke exposure (ETS) by race, and insurance coverage according to grade
Total MCHS Kindergarten Third Grade %
(95% CI) N
% (95% CI)
N
% (95% CI)
N Race White 25.7
(24.1-27.4) 663
25.6 (23.5-27.9)
371
25.9 (23.5-28.5)
292 Minority 17.5
(10.1-28.6) 11
*
*
Multiple Race 30.7 (23.0-39.7)
35
29.0 (19.6-40.7)
20
33.3 (21.2-48.2)
15 Missing 79 46 33 Insurance Coverage Private/HMO 15.1
(13.5-16.8) 264
14.8 (12.7-17.1)
144
15.4 (13.1-18.2)
120 MaineCare 47.2
(43.7-50.6) 373
47.4 (42.9-51.9)
223
46.9 (41.5-52.3)
150 None 38.5
(30.5-47.1) 50
32.8 (22.7-44.9)
22
44.4 (32.7-56.8)
28 Other * * * Missing 136 73 63 *Indicates five or fewer events, therefore, suppressed due to confidentiality. N=number of children.
Figure 16. Prevalence of food insecurity and family hunger by region
76

77
10.6
16.2
12.7
7.4
10.8
8.6
7.5
2.6
4.6
3.9
1.8
12 14 16 18
Southern (N=721
East Central (N=418)
Coastal (N=338)
North Eastern (N=332)
3.9
5.9
4.6
0 2 4 6 8 10
State (N=2816)
West Central (N=511)
Western (N=496)
PercentFood insecure Family hunger
• families who are food insecure and 3.9 percent
• ern) to 16.2 percent (West Central). • th Eastern) to 5.9 percent (West Central). • rade level (Table 14).
Of the children surveyed, 10.6 percent come fromfrom families who are hungry.
Food insecurity varied regionally from 7.4 percent (South Family hunger also varied regionally from 1.8 percent (Nor Food insecurity and family hunger did not vary according to sex or g

78
mily hunger by sex and grade according to region Food Insecure Family Hunger
de 3
%
N
-10.0) 12 *
-6.8) 11
-8.7) 10
-7.1) 6 *
-5.1) 47
Table 14 Prevalence of food insecurity and fa
%
West Central Missing Western
Missing Southern
Missing East Central Missing Coastal
Missing North Eastern Missing Total MCHS
Missing *Indicates <= 5 events, therefore, N= numb
Combined Grade Levels
Boys
Girls
Grade K
Grade 3
Combined Grade Levels
Boys
Girls
Grade K
Gra
(95% CI) N
% (95% CI)
N
% (95%CI)
N
% (95%CI)
N
% (95%CI)
N
% (95%CI)
N
% (95%CI)
N
% (95%CI)
N
% (95%CI)
N (95%CI)
16.2 (13.4-19.6)
83
16.9 (12.9-21.8)
44
15.6 (11.6-20.6)
39
17.1 (13.4-21.6)
52
15.0 (10.7-20.6)
31
5.9 (4.1-8.3)
30
5.8 (3.5-9.2)
15
6.0 (3.7-9.7)
15
5.9 (3.8-9.2)
18
5.8 (3.3
6 6 12.7
(10.0-16.0) 63
11.6 (8.2-16.3)
28
13.7 (10.0-18.6)
35
12.9 (9.7-17.0)
42
12.3 (8.1-18.3)
21
4.6 (3.1-6.9)
23
4.2 (2.3-7.5)
10
5.1 (3.0-8.6)
13
*
4 4 7.4
(5.7-9.5) 53
7.6 (5.3-10.8)
27
7.1 (4.9-10.2)
26
6.9 (4.9-9.7)
30
8.0 (5.4-11.8)
23
2.6 (1.7-4.1)
19
3.4 (1.9-5.8)
12
1.9 (0.9-4.0)
7
1.8 (0.9-3.6)
8
3.8 (2.1
3 3 10.8
(8.2-14.1) 45
11.2 (7.6-16.2)
23
10.3 (6.9-15.2)
22
11.5 (7.8-16.6)
24
10.1 (6.7-14.8)
21
4.6 (2.9-7.0)
19
3.9 (2.0-7.6)
8
5.2 (2.9-9.1)
11
4.3 (2.3-8.1)
9
4.8 (2.6
0 0 8.6
(6.1-12.0) 29
7.6 (4.3-13.1)
11
9.3 (6.0-14.2)
18
9.1 (5.5-14.8)
14
8.2 (5.0-13.0)
15
3.9 (2.3-6.5)
13
*
*
4.6 (2.2-9.2)
7
3.3 (1.5
2 2 7.5
(5.1-10.9) 25
6.6 (3.7-11.4)
11
8.5 (5.1-13.9)
14
5.6 (2.9-10.4)
9
9.4 (5.9-14.8)
16
1.8 (0.8-3.9)
6
*
*
*
2 2 10.6
(9.5-11.8) 298
10.5 (9.0-12.2)
144
10.7 (9.2-12.4)
154
10.8 (9.4-12.4)
171
10.3 (8.8-12.2)
127
3.9 (3.3-4.7)
110
3.9 (3.0-5.1)
54
3.9 (3.0-5.0)
56
4.0 (3.1-5.0)
63
3.8 (2.9
17 11 6 17 suppressed due to confidentiality.
er of events.

Figure 17. Prevalence of food insecurity and family hunger by race
• Of the children surveyed, food insecurity and family hunger differed according to race. • Children with multiple race (18.3%, 9.6%) are more likely to come from families who are food
insecure and hungry than children reported as white race (10.3%, 3.7%).
79

Figure 18. Prevalence of food insecurity and family hunger by insurance coverage
• Of the children surveyed, food insecurity and family hunger differed according to insurance coverage. • Children covered by MaineCare (22.6%, 9.7%) are more likely to have come from families who are
food insecure and hungry than children covered by Private/HMO insurance (4.9%, 1.0%). • Children who are not covered by any insurance (11.4%, 5.3%) are also more likely to come from
families who are food insecure and hungry than those covered by Private/HMO insurance (see table 15).
80

Table 15. Prevalence of food insecurity and family hunger by insurance coverage and race Food Insecurity Family Hunger
% (95% CI)
N
% (95% CI)
N Insurance Coverage
Private/HMO 4.9 (4.0-6.0)
87
1.0 (0.6-1.6)
18 MaineCare 22.6
(19.8-25.6) 182
9.7 (7.8-11.9)
78 No insurance 11.4
(7.0-18.0) 15
5.3 (2.6-10.7)
7 Missing 96 96
Race White 10.3
(9.2-11.5) 268
3.7 (3.0-4.5)
96 Minority
*
*
Multiple race 18.3 (12.2-26.4)
21
9.6 (5.4-16.4)
11 Missing 43 43
*Indicates 5 or fewer responses, therefore, data not presented due to confidentiality. N= Number of events.
81