Embed Size (px)
Citation preview

1
Main title What is the impact of interventions to increase agricultural production on children’s nutritional status?
Sub title A review of interventions aiming at increasing income and improving the diet of the rural poor
Review group
Section PROCOTOL
Authors
Edoardo Masset Lawrence Haddad Alexander Cornelius Jairo Isaza-Castro
EPPI-Centre reference number
Month/year of publication
This report should be cited as…
Contact details
Institute of Development Studies at the University of Sussex
Brighton BN1 9RE
DD: +44 (0) 1273915807
[email protected] Institutional base Institute of Development Studies
Review Group
Advisory group
Conflicts of interest (if any)
Acknowledgements

2
Table of contents
1 BACKGROUND ................................................................................................................................ 3
1.1 AIMS AND RATIONALE FOR REVIEW ........................................................................................................... 3 1.2 DEFINITIONAL AND CONCEPTUAL ISSUES..................................................................................................... 4
1.2.1 The interventions .................................................................................................................... 4 1.2.2 Theory of change of the interventions .................................................................................... 5 1.2.3 The outcome indicators .......................................................................................................... 6 1.2.4 Heterogeneity of impact ......................................................................................................... 8 1.2.5 Heterogeneity of contexts and generalisability ...................................................................... 8
1.3 POLICY AND PRACTICE BACKGROUND ....................................................................................................... 10 1.4 RESEARCH BACKGROUND ...................................................................................................................... 10 1.5 OBJECTIVES ........................................................................................................................................ 11
2 METHODS USED IN THE REVIEW ................................................................................................... 12
2.1 USER INVOLVEMENT ............................................................................................................................ 12 2.1.1 Approach and rationale ........................................................................................................ 12
2.2 IDENTIFYING AND DESCRIBING STUDIES .................................................................................................... 12 2.2.1 Defining relevant studies: inclusion and exclusion criteria ................................................... 12 2.2.2 Identification of potential studies: Search strategy .............................................................. 14 2.2.3 Screening studies: applying inclusion and exclusion criteria ................................................ 14 2.2.4 Characterising included studies ............................................................................................ 16 2.2.5 Identifying and describing studies: quality assurance process ............................................. 16
2.3 METHODS FOR SYNTHESIS ..................................................................................................................... 16 2.3.1 Assessing quality of studies .................................................................................................. 16 2.3.2 Overall approach to and process of synthesis ...................................................................... 17 2.3.3 Selection of outcome data for synthesis ............................................................................... 19
2.4 DERIVING CONCLUSIONS AND IMPLICATIONS ............................................................................................. 20
REFERENCES ........................................................................................................................................... 22
3 APPENDICES .................................................................................................................................. 24
3.1 AUTHORSHIP OF THIS REPORT ................................................................................................................ 24 3.2 INCLUSION AND EXCLUSION CRITERIA ....................................................................................................... 24 3.3 SEARCH STRATEGY FOR ELECTRONIC DATABASES ........................................................................................ 25 3.4 CHECK LIST FOR FIRST AND SECOND STAGE SCREENING ................................................................................ 26 3.5 CHECK LIST FOR STUDY QUALITY ASSESSMENT ............................................................................................ 27

3
1 Background
1.1 Aims and rationale for review Governments and development agencies have designed interventions linking agriculture to nutrition since the 1960s, but the focus and the type of interventions has considerably changed over the years (World Bank 2007). Changes have followed theoretical developments in the understanding of the causes of hunger and of its remedies. The present review aims at assessing the impact of recent interventions in the area of agricultural production to tackle malnutrition in developing countries. Early agricultural interventions identified the problem of malnutrition with the lack of food and promoted increases in food production and agricultural productivity. It was soon realised that increasing food production alone, ignoring distributional issues, was not sufficient to eradicate malnutrition, unless the poorest were given access to food (Reutlinger and Pellekaan 1986). Starting in the late 1970s and particularly after the seminal work by Sen (1981) malnutrition was linked to food security and projects focused on increasing incomes and livelihoods of the poorest sections of the population. In the meantime, households’ budget studies in developing countries documented the low calorie elasticity of income. In other words, it became clear that changes in incomes did not immediately translate in changes in the consumption of food and calories. The limitations of increasing income alone in order to improve nutrition were identified (Haddad et al. 2003). A new wave of interventions begun in the 1990s that aimed at increasing income and the intake of food and nutritious food at the same time. Malnutrition was to be reduced not only by increasing incomes of the poor, but also by shifting their diets towards the consumption of more nutritious food in terms of their caloric, protein or micronutrients contents. Projects of this type include production diversification projects (like dairy development, and the promotion of vegetable gardens, fisheries and livestock), and bio-fortification projects (projects increasing the nutritional content of staple foods). These projects reflect a renewed interest in agriculture and malnutrition by traditional donors, like USAID and DFID, and by new players like the Gates Foundation. They promise a ‘win-win’ strategy, whereby both the income and the nutritional status of the poor are improved in a cost effective way. Knowledge on the impact of these programmes is scant and fragmentary and there is a need to systematise the existing evidence in order to assess what type of interventions work, why and under what circumstances.

4
1.2 Definitional and conceptual issues
1.2.1 The interventions
The purpose of the present review is the systematisation of evidence on the effectiveness of agricultural interventions that promote the adoption of new technologies in order to both increasing incomes and improving the diets of poor households in rural areas of developing countries. Technology is defined in the broad sense of any possible combination of household resources in the use of inputs for the production of agricultural goods. Thus the adoption of improved seeds, the setting up of fisheries, and the introduction of vegetable gardens are all examples of agricultural technologies. Income is the monetary value of the flow of household production net of its cost, while diet is the composition of the food basket consumed by the household. An improvement in diet can be the result of a diversification of the diet (the addition to the diet of food items that are rich in caloric and protein contents like milk or meat) or of the enrichment of food items currently consumed (like the addition of micronutrients to staple foods). Projects promoting the adoption of new technologies for higher incomes and better diets fall in two main categories:
Production diversification projects: in particular those promoting dairy production, fisheries, vegetable gardens and livestock
Bio-fortification projects: by conventional crop breeding or genetic engineering that increase the content of Iron, Zinc and vitamins in crops such as rice, wheat and sweet potato
Only interventions in poor rural areas will be considered in the review. The definition of rural used in the review is the one adopted by the country where the intervention takes place. The definition is made explicit in demographic censuses and is normally based on population size, main economic activities and facilities. Poverty refers to the living conditions of the residents in the area in which the intervention takes place, and not on the average living conditions of the population in a country (therefore poor areas of middle income countries or even rich countries may be included). Poverty is absolute poverty, i.e. all people whose income falls short of the amount required in order to achieve a minimum basket of food and non-food items which is consistent with a healthy and decent life.

5
1.2.2 Theory of change of the interventions
Figure 1 sketches the theory of change of the programmes considered in this review. The first step in the causal chain is farmers’ participation in the programme. Not all the targeted population is able to join the programme. In particular, vulnerable groups can be missed out by the intervention, a point that will discussed in more detail later on. Participation in the programme implies the adoption of a new technology which may consist of new production activities (like livestock and fisheries) or new varieties of existing production activities (like the production of fortified food). As shown in the figure, the effect of the adoption of the new technology is twofold. First, the new technology increases household income. Second, the new technology changes the food basket consumed by households or the nutritional contents of existing baskets. Both effects lead to improvements in nutritional status and will now be discussed in turn. In what follows it is assumed that the programme is successful in generating additional income and diet diversification, though this is not necessarily so as programmes can be badly designed or implemented. Figure 1. Theory of change of agricultural production interventions
The effect of an income increase on nutritional status is well known and normally analysed through the estimation of elasticities: the proportionate changes in calories consumption for a unit change in income. This effect is often found to be small in size (Deaton 1997). In an average poor population less than 50% of additional income is normally spent on food (a phenomenon known as Engel’s law). Moreover, additional food expenditure does not translate in proportional increases in caloric intake, because households tend to spend their additional income in tastier and less nutritious food (in particular moving from the consumption of staples to fats and oils – a phenomenon also known as Bennett’s law). Further, higher caloric intake does not translate into improved nutritional status, as food intake is only one of the main determinants of nutritional status together with caring practices and the health environment (Smith L. C. and Haddad 2000). Finally, additional caloric intake can be spent in additional activity for work and play thus not resulting in changes in nutritional status (Svedberg 2000).

6
The effect of changes in the composition of the diet, and of changes in the nutritional content of food has been less investigated. The addition of nutritious food items to an existing diet and the fortification of staple foods should have an immediate and direct effect on nutritional status. Though, like in the income effect case, this effect is moderated by the impact of other determinants of malnutrition and by the body energy balance of energy intake and outtake mentioned above. Notice that the theory of change sketched here abstracts from behavioural changes induced by the programme. These changes may reduce or increase programme impact in two ways. First, the increase in the nutritional contents of food consumed may induce households to reduce overall food expenditure under the income effect. Second, food can be differently allocated to household members. For example, children may obtain a large portion of the family improved diet (for example through the consumption of milk) thus resulting in larger than expected improvement in nutritional status. Also notice that the theory of change outlined in Figure 1 abstracts from general equilibrium effects of the interventions. Price effects in particular could be powerful if the new agricultural technologies contribute to lower prices in local markets, thus affecting producers and consumers of these commodities in different ways. These effects are mostly captured by observing real incomes rather than nominal incomes, as it is standard in household surveys. Household income, often approximated by consumption expenditure, is deflated by the prices faced by consumers in the local markets and therefore incorporates price effects of the intervention. It is true that evaluation studies rarely consider general equilibrium effects. Price reductions may equally affect project and control areas, thus affecting the quality of the control group and ultimately underestimate programme impact. The consideration of general equilibrium effects in the evaluation studies will be assessed and be part of overall assessment of the included studies.
1.2.3 The outcome indicators
Following the theory of change developed in the previous section, we describe here the final and intermediate outcome indicators that are considered in the review. Some of these indicators reflect the impact of both income and diet diversification effects, while others do not. Some indicators are detectable at the individual levels, while others can only be detected at the household level. Table 2 lists and categorises these indicators. The preferred outcome indicator for the review is the nutritional status of children. This indicator has the advantage of capturing both income and diet diversification effects of agricultural interventions. In addition, nutritional status is measured at the individual level, thus allowing the assessment of programme impact on particular individuals like, for example, girls. Standard indicators of nutritional

7
status are the anthropometric measurement of height-for-age, weight-for-age and weight-for-height, among under-five children. Nutritional status among the adult population is conventionally measured by the body-mass-index (BMI). Some studies do not report programme impact on nutritional status. In addition, our review is also interested in uncovering the impact on intermediate indicators. Therefore the review will also summarise programme impacts on diet diversification. Diet diversification can be measured in three different ways. First, there are standard measurements of diet diversity based on questionnaires on whether the family consumes or not a pre-defined list of food items. Second, full nutritional intake by component (calories, protein and micronutrients) can be obtained from an accurate analysis of food expenditure data. Third, micronutrient intake can be measured by biomarkers like, for example, blood samples. Table 2 Outcome indicators considered by the review
Indicator Description Effect detected Level of detection 1. Nutritional
status Anthropometric indicators (height-for-age, weight-for-age and weight-for-height and BMI)
Both income and diversification effects
Individual
2. Diet diversity Food basket composition
Micronutrients intake
Nutritional intake from expenditure data
Diversification effect
Household
3. Food expenditure
Total and food household expenditure
Income effect Household
4. Participation Programme coverage by characteristics of beneficiaries
Pre-condition for any potential effect
Household
Some studies may not report data on the diversity of diet and may simply assess impact by calculating observed changes in income or food expenditure. These are imprecise indicators of programme impact that can nevertheless provide approximations in some cases. Most studies will report data on programme coverage and characteristics of the population joining the programme. Even studies not reporting outcome indicators

8
of impact may provide this type information. Programme coverage and characteristics of participants will be one of the indicators of the review, because they shed light on the potential impact of the programmes for the population as a whole and for specific groups within.
1.2.4 Heterogeneity of impact
Malnutrition has often been proposed as an explanation of long term poverty, poverty traps and intergenerational transmission of poverty (Dasgupta 2001). Malnutrition-based explanations of poverty persistence rest on the hypothesis, or the observation, that malnutrition affects specific population groups, like infants, prospective mothers or the extremely poor. The assessment of simple average impact effects of an agricultural intervention misses out long term consequences on poverty and the well-being of specific vulnerable groups. A distributional analysis of programme impact is therefore, whenever possible, required. For the purpose of the present review we will try to disaggregate impacts along the following groups:
The poorest quintile or other vulnerable fraction of the targeted population Infants in the 6 to 24 months ‘window of opportunity’ stage of development Mothers and adolescent girls
1.2.5 Heterogeneity of contexts and generalisability
Food availability is only one of the main determinants of malnutrition, the others being the characteristics of the health environment and the quality of care. These determinants are shown in the diagram of Figure 2 which builds on the UNICEF (1990) framework for understanding malnutrition. There is considerable variation in the social and geographic distribution of these determinants across countries and also within countries. Equally poor countries may have very different literacy rates and health policies for example. It follows that agricultural productivity interventions of the type considered in this review are more likely to be effective in areas where the main determinants of malnutrition are food availability and food security (African countries). In countries where malnutrition is mostly the result of poor caring practices related to illiteracy and limited women’s control over assets (South Asia) these interventions are likely to be less effective. This in turn has serious implications for the generalisability of conclusions reached by individual studies and for the scalability of programmes to areas outside the initial intervention area. In systematic reviews, the variability of contextual factors may result in variability of observed programme impact. Agricultural intervention programmes may be very effective in fighting malnutrition in some areas but not in

9
others. This variability can be detected within meta-regression models. The characteristics of this type of models and the opportunity of using this type of models are discussed in section 2.3.2. There are two ways in which this heterogeneity of impact can be captured in meta-regression models. The first consists of including in the model the main determinants or correlates of the status of health care and caring practices in the areas of intervention. Following the framework of Figure 2, these include access to health services; quality of water and sanitation; women’s literacy rates; indices of women’s control over resources; and poverty. These data can be obtained from secondary sources, like for example the DHS datasets. These data however may not be always available and their collection might require an effort beyond the scope of the present review. The second way to account for contextual factors consists of including geographic dummy variables in the meta-regression model. The main geographic areas to
Household food security
Quality of care
Healthy environment,
health services
Nutritional
status
Dietary intake
Health status
Outcome
Immediate determinants
Caregiver resources
knowledge & access to education
health status
control of resources
Resources for health
availability of public health services.
sanitation, access to clean water.
Food security resources
quantity food produced
quality food produced, diet diversity
cash income
food transfers
Underlying determinants
Poverty
constrains the level of these determinants for individual households.
Political & ideological framework
Economic structure
Potential resources
Human, agro-ecological, technological
Basic determinants
The impact
which the resources potentially available to the household have on nutritional status is mediated & constrained by overarching economic, political, and institutional
structures.
Adapted from UNICEF 1990; Jonsson 1993;
and Smith & Haddad 2000.
Institutions
Figure 2 Conceptual framework of the determinants of child undernutrition

10
include are Latin America, South Asia and Sub-Saharan Africa. If a meta-regression model cannot be run because of the lack of data from relevant studies, the heterogeneity of impact suggests that nutritional outcomes of agricultural intervention should be disaggregated by broad geographic areas. Other contextual factors affecting the variability of programme impact which should be included in the meta-regression analysis include:
Agro-ecological factors of the area of intervention Time period of implementation Implementing agencies (ex: whether NGO or government) Modality of service delivery (ex: whether community based or not)
1.3 Policy and practice background
The conclusions reached by the present reviews will be relevant to both the donor and development communities. There has been a recent resurgence of the interest for nutrition and agricultural issues in the development community (see for example the new DFID nutrition strategy or the Copenhagen Consensus) and new players, like the Gates Foundation, have appeared. Some programmes considered in the reviews (for example Harvest Plus and Golden Rice) are new in terms of modality of operations and objectives, and a systematic assessment is needed.
1.4 Research background
There are a number of reviews that cover a subject area similar to the one covered by the present review. These reviews include Haddad (2000) and other articles in a special issue of the Food and Nutrition Bulletin, Berti et al. (2003), Ruel (2001) and World Bank (2007). This review presents a series of advantages compared to the reviews mentioned above. First, the focus of this review is much narrower on a specific subset of agricultural projects. Previous reviews of the nutritional impact of agricultural interventions have struggled to achieve general conclusions in the attempt of covering too many agricultural interventions. Second, this review will cover the last ten years of new agricultural programmes thus updating the conclusions reached by previous reviews. Third, none of the reviews mentioned above has ever been conducted using the systematic methodology adopted by the present one.

11
1.5 Objectives
This systematic review pursues the following objectives:
Summarising the existing evidence on agricultural interventions aiming at increasing incomes and diversifying diets of their target population
Summarising existing evidence along the programme theory of the interventions, by looking at indicators of participation, food expenditure, diversity of diet and nutritional status
Disaggregating summary evidence of programme effects across groups that are vulnerable to chronic poverty: extremely poor households, infants and mothers
Identifying gaps in our knowledge and understanding of the operation of agricultural programmes that may inform future impact evaluations
Building an evidence baseline to be updated once more evidence and knowledge has been accumulated

12
2 Methods used in the review
2.1 User involvement
2.1.1 Approach and rationale
This review is primarily directed to an audience of policy makers of the donor community and to academics in the areas of agriculture, health and development studies. The review has two main policy objectives:
Informing policy makers on the design of interventions and on the cost-effective allocation of resources
Informing the scientific communities on existing gaps in terms of both theoretical knowledge and evidence in the study areas
Two policy advisors from DFID will be involved in the definition of the objectives of the review and will peer-review its main outputs. Other policy makers will be reached via personal contact and policy briefs. The World Bank, IFAD, USAID, EC, Irish Aid, the new Global Partnership on Food Security, CGIAR, the Gates Foundation, CAADP, AGRA and the CGIAR group will be motivated user of this review. Academic audiences will be reached via a publication in a peer-reviewed journal. Results will be also presented at the Global Biofortification Conference in Washington DC in November 2010.
2.2 Identifying and describing studies
2.2.1 Defining relevant studies: inclusion and exclusion criteria
These are the criteria for inclusion/exclusion of studies (a more detailed description can be found in section 3.2 of the Appendix):
Interventions that promote both higher incomes and better diets are included
Interventions in high-income countries are excluded Studies produced before 1990 are excluded Studies not showing numerical programme effects under any of the four
outcomes considered in the review (participation, food expenditure, diet diversity and anthropometric indicators) are excluded

13
Studies not adopting either experimental or quasi-experimental methodologies will be excluded
Table A.1 in the appendix provides a list of the included and excluded projects. As stated in Section 1.2.1 only programmes that affect at the same time the income and the diet of the rural poor are included in the review. This choice narrows the selection of project down to two general types of interventions: production diversification projects and biofortification projects. Projects that do not achieve income and diet goals simultaneously (like for example watershed development, microfinance and nutrition education) are excluded from the review. In some cases, projects combine interventions from both the included and excluded list. For example, a home gardening programme can be associated with nutrition education. Programs consisting of multiple interventions (particularly IRD – integrated rural development projects) are excluded from the review when include interventions that are excluded from the review. Though this type of programmes can be very effective in reducing malnutrition, the complexity of the interventions is such that it would be very difficult to disentangle the causal effect of a specific agricultural intervention on nutritional outcomes. Programmes implemented in high-income countries are excluded because in these countries malnutrition is no longer related to agricultural productivity or the poverty of the diet. The World Bank definition of high income economies is used. There are 66 countries in this classification (see list in section 3.2 of the Appendix for a full list). Upper-middle income countries, like Brazil, and lower-middle income countries, like India, will be included because a large fraction of the population in these countries lives in condition of extreme poverty. Work produced before 1990 will be excluded for both practical and theoretical reasons. The programmes reviewed are relatively new and few studies are likely to be found prior to 1990. The last 20 years have seen the emergence of factors (pressure on natural resources, climate change and rapid income growth in poor countries) that have modified the way agricultural programmes are implemented and expected to produce impact. Studies that do not show any numerical impact of programme effects along the four outcome indicators selected (participation, food expenditure, diet diversity and anthropometric indicators) will not be considered in the review. Only studies adopting either experimental or quasi-experimental approaches to identification of programme impact will be considered. These include: randomised field trials, regression-discontinuity designs, propensity score matching analyses, difference in difference regression studies, regression analyses employing instrumental variables approaches and selection models. Studies without proper control groups or studies based on before-after comparisons will be excluded.

14
Notice however that in the course of the review the team might decide to include qualitative studies. There are two main reasons for doing so. First, the number of available impact evaluation studies amenable to a full meta-analysis may not be sufficiently large. Second, the heterogeneity of interventions, outcomes and contextual factors may require a narrative summary of the intervention considered. In particular, the theory of change of bio-fortification model is rather underdeveloped, as well as the analysis of impact on vulnerable groups (some of which, like for example ethnic groups, are too small to be captured by quantitative studies).
2.2.2 Identification of potential studies: Search strategy
Potential studies will be searched using databases of published and unpublished material. Given the limited time available for literature search the number of databases searched will be limited to one from each of the following subject areas: agriculture, economics, medicine and general science. More details on the databases and the keywords initially used on the research can be found in section 3.3 of the Appendix. Four languages will be used in the search: English, French, Italian and Spanish. These are the languages fluently spoken by the team members. Studies published in any other language are excluded. Since some of the interventions are very recent, personal contacts will be used in order to search for works in progress. Email communication will be used to search for potential work by research institutes or implementing agencies, like IFPRI and the Gates Foundation.
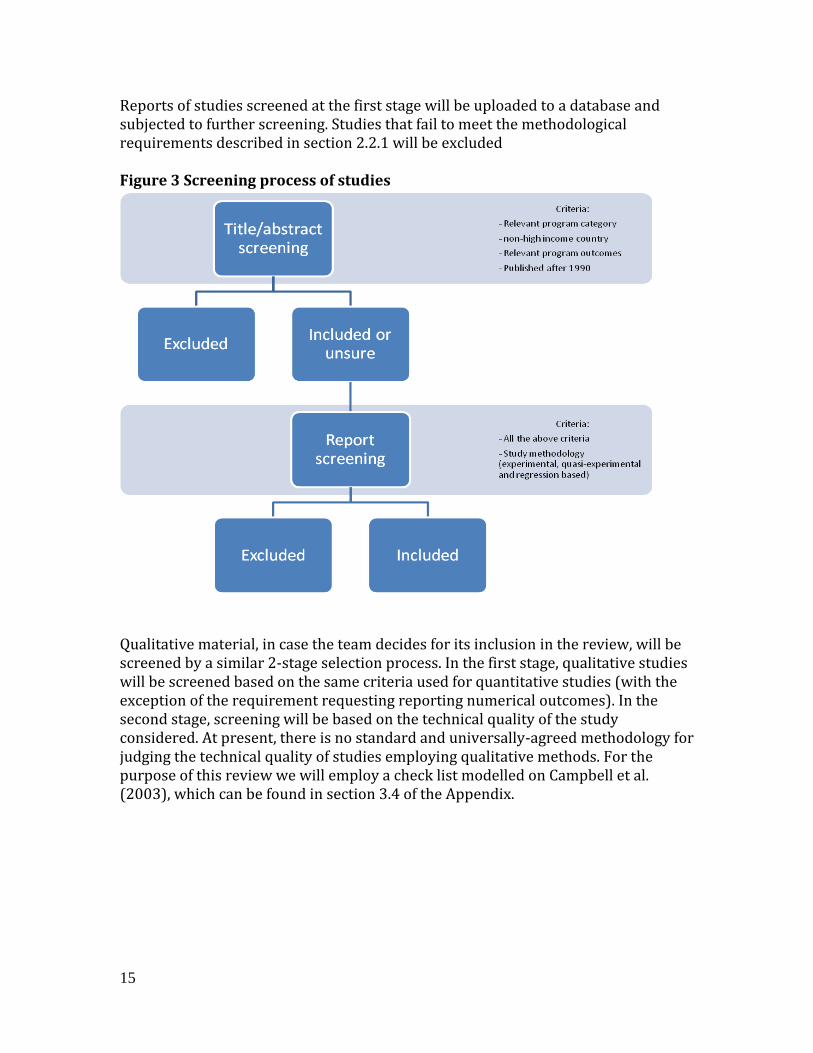
2.2.3 Screening studies: applying inclusion and exclusion criteria
In order to screen studies to be included in the review a 2-stage process will be followed (see Figure 3). First, titles and abstracts of retrieved studies will be screened based on a set of exclusion criteria. Second, full reports downloaded will be screened based on the soundness of study methodology. The criteria for the first stage selection process are the following:
Studies on programmes that are not subject of the review will be excluded Studies published after 1990 will be excluded Studies on programmes implemented in high-income countries will be
excluded Studies not including numerical outcomes of the indicators of Table 2 will be
excluded
15
Reports of studies screened at the first stage will be uploaded to a database and subjected to further screening. Studies that fail to meet the methodological requirements described in section 2.2.1 will be excluded Figure 3 Screening process of studies
Qualitative material, in case the team decides for its inclusion in the review, will be screened by a similar 2-stage selection process. In the first stage, qualitative studies will be screened based on the same criteria used for quantitative studies (with the exception of the requirement requesting reporting numerical outcomes). In the second stage, screening will be based on the technical quality of the study considered. At present, there is no standard and universally-agreed methodology for judging the technical quality of studies employing qualitative methods. For the purpose of this review we will employ a check list modelled on Campbell et al. (2003), which can be found in section 3.4 of the Appendix.

16
2.2.4 Characterising included studies
Studies screened for final inclusion in the review will be organised in a table containing the information on the variables listed in Table 3 below. Table 3 Characteristics of included studies Authors of the studies Year of publication Journal or source from which was obtained Title of the study Country and geographic area of intervention Type of agricultural intervention Outcomes indicators available in numerical form Study methodology (RCT, IV etc.) Sample size of the study
2.2.5 Identifying and describing studies: quality assurance process
Studies will be screened at stage 1 and 2 with the help of two check lists that are reported in the appendix. The first screening will be performed by the first reviewer. The second screening, based on the methodological quality of the studies, will be performed by the second reviewer and by the lead reviewer. Because of time constraint the second reviewer and the lead reviewer will not be able to perform the screening of the same studies independently. The score of the included studies based on the second check list mentioned above will be uploaded to a database and reported in the final review. A narrative summary of the qualitative studies included based on the criteria of table A.5 in the Appendix will also be presented.
2.3 Methods for synthesis
2.3.1 Assessing quality of studies
When studies included in the review are of poor quality the review can produce misleading result in one direction or another. In order to avoid this type of bias, studies will undergo a thorough process of quality assessment. The quality assessment will use a check list reporting judgments on internal and external validity of the studies included (see the example in Table A.8 of the Appendix). Judgments will be summarised in an overall narrative assessment of the state-of-the-art in the assessment of the programmes subject of this review. Main gaps and

17
common risks will be identified, and recommendation will be provided in order to guide future impact evaluations of interventions.
2.3.2 Overall approach to and process of synthesis
The data extracted from the selected studies will be analysed using meta-analytic methods (Higgins and Green 2009), and aggregate effect size will be calculated using random-effects models (Borenstein et al. 2009). There are a number of challenges associated with the adoption of a meta-analytical methodology that will now be discussed in turn. These challenges include: heterogeneity of outcome indicators used by the different studies; heterogeneity of interventions; paucity of the studies available; heterogeneity of outcomes across studies for similar interventions; and publication bias. Impact on nutritional status of children may be measured by a number of indicators, of which the most common are height-for-age, weight-for-age and weight-for-height. These indicators can be reported in two different ways: as Z-scores compared to a reference healthy population (and the reference population may differ across studies) and as malnutrition rates based on standard cut-off points applied to Z-scores. In addition, these indicators have different meanings. In particular, height-for-age (stunting) is a long term indicator of malnutrition, while weight-for-age (underweight) is a short term indicator. Our preferred outcome indicator is malnutrition or average Z-scores based on height-for-age because it reflects the impact of past malnutrition events and because is a better predictor of future well-being. However, the choice of the indicator will be ultimately dictated by the choices made by the authors of the included studies. The interventions analysed are very heterogeneous. Aggregation of heterogeneous interventions is implicit to meta-analysis procedures and cannot be completely avoided: mixing apples and oranges is not an issue if we want to say something about fruit (Rosenthal 1993). If the number of selected studies is sufficiently large, we will analyse the results separately by type of intervention. For example, we can separate biofortification, home-gardening and animal development programmes. It is also likely that some programmes consist of packages of multiple interventions. These programmes might be aggregated in a separate category of interventions. Some of the interventions considered are relatively new and poorly evaluated. This is likely to be the case of biofortification programmes of which few are well known (like HarvestPlus and Golden Rice for example) and fewer still incorporate impact evaluation in their design. Home-gardening and other diversification programmes are more common and several evaluations are available. However, when the number of studies will not allow performing meta-analytical aggregation of results, we will produce numerical narratives of the existing evidence. In addition, our review does not limit its analysis to final outcome indicators (nutritional status of

18
children under-5). It is one of the goals of the review trying to assess programme impact along the theory of change by looking at intermediate outcome such as: technology adoption, food expenditure and diet diversity. The review will analyse the variability of effect size across studies using meta-regression (Stanley 2001). Some of the variability of the effect size found across studies depends on specific characteristics which are not related to the specifics of the interventions. For example, the same programme may be implemented in different ways or can have varying degrees of success depending on the agro-climatic conditions of the area where it is implemented. Just as we can use regression analysis to assess the relationship between an outcome and the characteristics of the population, we can use regression analysis to assess the relationship between programme outcomes and study and programme-level characteristics. In particular, we identified the following contextual factors as potential determinants of effect variability across studies (see section 1.2.5): agro-ecological factors of the area of intervention; time period of implementation; implementing agencies, and modality of service delivery. Other factors that could be employed are the characteristics of the health environment, prevailing caring practices and living standard of the population (or their broad geographic correlates – geographic dummy variables). Studies showing statistically significant and positive results are much more likely to be published (Borenstein et al. 2009). There is therefore an implicit risk that meta-analysis overestimate average programme impact, as studies showing negative or no results tend to be shelved and forgotten. We will try to avoid publication bias by extensive search of the grey literature as described in section 2.2.2. In addition, publication bias will be explored using funnel plots (Stanley and Doucouliagos 2010), and the overall time devoted to searching grey literature will be informed by the publication bias detected via funnel plot analysis. The review team is aware that some of the projects surveyed (like for example biofortification programmes) have been poorly evaluated, and that answers to some of the questions posed by the review on the effectiveness cannot be fully provided by quantitative studies. Therefore, it will be decided after a first screening of available impact evaluation studies whether the review should also include qualitative work. In particular, we believe that qualitative studies might be proficiently employed to shed light on the following issues:
Barriers and enablers to the success of biofortification programmes. We propose to perform a validation of the existing theory of change on biofortification interventions. First, studies will be reviewed in order to build a comprehensive logical conceptual framework of the intervention that will include all potential causal links. Second, studies will be reviewed in order to assess the strength (qualitatively or quantitatively) of each link; the

19
represenativeness of the relation identified; and the size of the knowledge gap.
Heterogeneity of impact on specific vulnerable groups. Some vulnerable groups, like pockets of indigenous populations or adolescent girls, are too small to be sampled and quantitatively analysed in a meaningful way. Qualitative approaches may provide invaluable suggestions on the impact of interventions on these groups.
In addition, or as an alternative to meta-analysis and meta-regression in case this proved to be non feasible, a narrative synthesis of the results will be produced. The available quantitative studies will be reported in a table and their results will be discussed. The quality of the evidence produced so far will be discussed and the existing knowledge gaps will be highlighted. To summarise, the key outputs of the final review will be the following:
Meta-analysis suite of nutritional impact of agricultural interventions (meta-analysis, meta-regression, funnel plots)
Summary of quantitative outcomes and narrative synthesis Assessment of the quality of available evidence and size of knowledge gap Validation of the theory of change of biofortification projects Narrative summary of impact of interventions on vulnerable groups based on
qualitative studies
2.3.3 Selection of outcome data for synthesis
The reviews will employ four outcome indicators. The specific metrics that we intend to adopt are displayed in Table 4. Nutrition indicators can be either malnutrition rates (stunting, wasting and underweight) observed in the under-5 populations or Z-scores of height-for-age and weight-for-age. The quality of the diet can be measured in three different ways: using detailed expenditure data; dietary diversity indices; and biomarkers. When data on consumption of each food item is available, the household intake in terms of calories, proteins and micronutrient can be estimated using appropriate conversion tables. When data on consumption of food items is not available, surveys often collect information on foods or food groups consumed over a recall period of 1, 3 or 7 days. This methodology is being tested and developed but the most common measure found in the literature is the simple count of foods or food groups by each household. This method clearly poses serious problems of comparability across surveys (Ruel 2003). Occasionally studies rely on blood samples in order to assess the Iron or retinol intake of populations in the project and control areas.

20
Table 4 Outcomes and suggested metrics for the quantitative analysis Outcome Indicator
Nutritional status
Ratios of malnutrition rates in project and control areas Absolute differences in Z-scores between project and
control areas Quality of diet % score of diversity food counts
Ratios of average caloric intakes in project and control area
Absolute difference in micronutrients intake (iron, retinol) in project and control areas
Food expenditure
Ratio of food expenditure in project and control areas
Participation Participation rates Technology adoption rates
Studies often do not perform conversion of food expenditure into calories or micronutrients and simply present food expenditure aggregates at the household level as indicators of programme success. Participation rates can be retrieved from any study which is reporting rates of participation in programme activities. However, technology adoption rates need to be compared to those prevailing in the control areas and will be expressed as ratios or differences.
2.4 Deriving conclusions and implications
The conclusions of the review will be presented in the following ways:
Forest plots and other visual summaries will be used in the meta-analysis of the studies
Tables will present aggregate outcome indicators obtained from the studies at the intermediate levels of technology adoption, food expenditure and diet diversity
A ‘summary of findings’ table will collect the conclusions reached regarding each outcome of the review
The final report will also discuss implications of the study for policy makers and future research. In particular, policy makers and academics will be advised regarding:
The generalisability of the results observed: to what extent the aggregate programme outcomes found are representative of the expected outcomes in areas where programmes have not yet been implemented
Evidence gaps: an assessment of the size and the quality of the evidence available

21
Theoretical gaps: an assessment of knowledge gaps in our understanding of programmes’ effectiveness along the causal chain of the theory of change

22
References
Berti, P., J. Krasevec, and S. FitzGerald. 2003. A review of the effectiveness of agricultural interventions in improving nutrition outcomes. Public Health Nutrition 7 (5):599-609.
Borenstein, M., L.V. Hedges, J.P.T. Higgins, and H.R. Rothstein. 2009. Introduction to Meta-Analysis. Chippenham: Wiley.
Campbell, R., P. Pound, C. Pope, N. Britten, R. Pill, M. Morgand, and J. Donovan. 2003. Evaluating meta-ethnography: a synthesis of qualitative research on lat experiences of diabetes and diabetes care. Social Science and Medicine 56:671-684.
Dasgupta, P. 2001. Human Well-Being and the Natural Environment. New York: Oxford University Press.
Deaton, A. 1997. The Analysis of Household Surveys. Washington DC: The World Bank.
Haddad, L. 2000. A conceptual framework for assessing agriculture-nutrition linkages. Food and Nutrition Bulletin 21 (4):367-373.
Haddad, L., H. Alderman, L. Appleton, L. Song, and Y. Yohannes. 2003. Reducing Malnutrition: How far can income growth take us? World Bank Economic Review 17 (1).
Higgins, J.P.T., and S. Green. 2009. Cochrane Handbook for systematic reviews of intervention. Version 5.0.2: The Cochrane Collaboration.
Reutlinger, S., and H. Pellekaan. 1986. Poverty and Hunger: Issues and Options for Food Security in Developing Countries. Washington DC: The World Bank.
Rosenthal, R. 1993. Meta-analytic procedures for social research. Newbury Park, CA: Sage Publications.
Ruel, M. T. 2001. Can Food-Based Strategies Help Reduce Vitamin A and Iron Deficiencies? A Review of Recent Evidence. Washington DC: IFPRI.
Ruel, M.T. 2003. Operationalizing Dietary Diversity: A Review of Measurement Issues
and Research Priorities. Journal of Nutrition. Sen, A. 1981. Poverty and Famines. Oxford: Clarendon Press. Smith L. C., and L. Haddad. 2000. Overcoming Child Malnutrition in Developing
Countries: Past Achievements and Future Choices. Vol. Food, Agriculture and the Environment Discussion Paper 30. Washington DC: IFPRI.
Stanley, T. D. 2001. Wheat from chaff: Meta-analysis as quantitative literature review. Journal of Economic Perspectives 15 (3):131-150.
Stanley, T. D., and H. Doucouliagos. 2010. Picture this: a simple garaph that reveals much ado about research. Journal of Economic Surveys 24 (1):171-191.
Svedberg, P. 2000. Poverty and Undernutrition. New York: Oxford University Press. UNICEF. 1990. Strategy for im proved nu trition of chil dren and women in developing
coun tries. New York: UNICEF.

23
World Bank. 2007. From Agriculture to Nutrition: Pathways, Synergies and Outcomes. Washington DC: The World Bank Agriculture and Rural Development Department.

24
3 Appendices
3.1 Authorship of this report
Review Team: Edoardo Masset – Lead reviewer Lawrence Haddad – Technical advisor Alexander Cornelius - Reviewer Jairo Isaza-Castro – Reviewer Reviewers: Imran Choudhury – DFID Policy lead Blinded - First internal reviewer Blinded – Second internal reviewer Todd Benson – External reviewer
3.2 Inclusion and exclusion criteria
These are the criteria for inclusion/exclusion of studies:
1. Type of intervention 2. Year of publication of the study 3. High income economies 4. Study design
1. Agricultural projects included and excluded by the review are:
Table A.1 List of agricultural programmes included and excluded in the review
Included Excluded Biofortification (conventional breeding and genetic modification)
Irrigation and watershed development
Improved seeds Credit and microfinance Home gardening Land reforms Fishponds/fisheries Marketing Chicken raising Cash cropping Animal husbandry Nutrition education Dairy development Food processing Natural Resources Management Food storage Farming education and training on the above subjects
Business training Integrated rural development projects
2. Studies published or produced before 1990 are excluded

25
3. Interventions in high-income economy areas will be excluded. Following the
World Bank classification there are 66 high-income economies: Andorra, France, Netherlands, AntillesAntigua and Barbuda, French Polynesia, New
Caledonia, Aruba, Germany, New Zealand, Australia, Greece, Northern Mariana Islands,
Austria, Greenland, Norway, Bahamas, The Guam, Oman, Bahrain, Hong Kong,
Portugal, Barbados, Hungary, Puerto Rico, Belgium, Iceland, Qatar, Bermuda, Ireland,
San Marino, Brunei, Darussalam, Isle of Man, Saudi Arabia, Canada, Israel, Singapore,
Cayman Islands, Italy, Slovak Republic, Channel Islands, Japan, Slovenia, Croatia,
Korea, Rep.Spain, Cyprus, Kuwait, Sweden, Czech Republic, Liechtenstein, Switzerland,
Denmark, Luxembourg, Trinidad and Tobago, Estonia, Macao, United Arab Emirates,
Equatorial Guinea, Malta, United Kingdom, Faeroe Islands, Monaco, United States,
Finland, Netherlands, Virgin Islands (U.S.)
4. Study designs included in the review are the following
Table A.2 Study methodologies included in the quantitative review Randomised field trials Regression discontinuity designs Propensity score matching studies Difference in difference studies Project-control comparisons Instrumental variables regression studies Multiple methodologies combining two or more of the methodologies above
3.3 Search strategy for electronic databases
The search will consider a limited number of electronic databases that are reported in Table A.3. However, it is quite possible that a large number of studies produced by African and Asian researcher are not indexed by the research engines selected. Alternative search systems, including hand search and snowballing will be tested. Search will be supplemented by backward referencing and forward citation tracking. Table A.3 Databases used in the searching process
Published work Unpublished work Econlit World Bank website Web of Science IFPRI website Agris ElDIS PubMed Google Scholar The Campbell Collaboration SOCINDEX IBSS
Ideas Jolis Proquest Helen Keller International

26
Search will be initially performed using OR and AND combinations of the set of words in the two columns of Table A.4. Different key searches will be tested through an iterative process in order to define a final list of keywords. Table A.4 List of words initially used in searching the databases Biofortification
AND
Participation/coverage Gardening/gardens Food expenditure/income Fishponds/fisheries Diet Chicken raising Micronutrients Animal husbandry Nutrition Dairy development Anthropometric Height Weight
3.4 Check lists for first and second stage screening
Table A.5 Check list for first stage screening of titles and abstracts Entry Judgement (yes/no) Programme type Biofortification Home gardens Fishponds/fisheries Chicken raising Animal husbandry Dairy development High income country? Study published/produced after 1990? Outcome indicators Nutritional status Diet diversity Food expenditure Project participation Table A.6 Check list for second stage screening of reports Entry Judgement (yes/no) Study methodology (tick more than one if required) Randomised field trial Regression discontinuity design Propensity score matching Difference-in-difference Project-control comparison
Instrumental variables Numerical outcome indicators
Nutritional status Diet diversity Food expenditure Project participation

27
Table A.7 Check list for second stage screening of qualitative studies Entry Judgement (yes/no) Is there a clear statement of the aims of the research? Is the study based on an explicit conceptual framework? Does the study build a theory of change of the program? Are the conclusions of the study based on collected data (including focus groups, semi-structured interviews etc.) ?
Is it clear how and where data were collected? Is the sample representative of the process to be explained? Were result and observations obtained triangulated with other sources?
Is it possible to summarise the findings? Are the findings explicit and easy to understand? Are the conclusions obtained supported by the evidence offered? Are the findings of the study transferable to a larger population?
3.5 Check list for study quality assessment
Table A.8 Check list example for the quality assurance of the selected studies Entry Judgment
(yes/no) Description
Does the study employ a control group? Yes Multiple: difference in difference and propensity score matching
Does the study credibly address selection bias?
yes PSM is based on a large number of determinants of participation in the programme
Is the sampling methodology clearly described and sound?
no The study uses secondary data whose sampling methodology is not described.
Are power calculations before and after data collection shown?
no No power calculations are shown before and after the study
Is the number of clusters and the sample size adequate?
yes Sensitivity tests show that PSM methodology is appropriate
Is attrition low (panel data)? yes Only 1% of households are lost between surveys
Is contamination likely? no The programme does not present issues of contamination
Are the data collected of good quality? n/a It is impossible to judge from the information given
Are the survey instruments used of good quality?
no Question in the primary survey and the matched survey are very different
Is the study assessing intermediate programme impact?
no Only nutritional outcomes are considered
Is the study estimating a participation model?
yes Through the estimation of the propensity score
Does the study consider spillover and general equilibrium effects?
no These are ignored
Are confounding factors proper considered in the model
yes Via regression analysis