Embed Size (px)
Citation preview
2014/2015
main streets across the world
A Cushman & Wakefield Research Publication

3
main streets across the world
GloBal oVerView 4MOST EXPENSIVE RETAIL LOCATIONS 5
GloBal retail rents 26
introductionCushman & Wakefield is at the centre of retail, providing value added real estate services to our clients globally. We monitor the evolution of the industry as well as global retail trends and practices to ensure our clients can best position their businesses to capitalise on future trends.This edition of Main Streets Across the World provides a detailed analysis of retail property rental performance across the globe in the twelve months to September 2014.
The information and data provided in this report are based on a comprehensive survey of Cushman & Wakefield’s international offices and the editors are extremely grateful to them for their time, effort and assistance.
Our international representation is designed to facilitate the rapid flow of information across borders and is supported by a comprehensive database of market information and regular liaison meetings. This allows for the exchange of local market knowledge and expertise, and for the co-ordination of strategy for international investment and locational decision-making.
Information on the markets has been provided by Cushman & Wakefield and its local partners listed in the table below:
austria Inter-pool Immobilien GmbHABahrain Cluttons LLPBulGaria Forton Internationalchannel islands Buckley & Company Ltd.denmark RED – Property Advisersestonia Ober-Haus Real Estate AdvisersFinland Tuloskiinteistot Oy Greece Proprius SAireland Lisney LLPisrael Inter Israel Real Estate ConsultantsJordan Michael Dunn & Co S.A.Lkazakhstan Veritas BrownlatVia Ober-Haus Real Estate AdvisersleBanon Michael Dunn & Co S.A.Llithuania Ober-Haus Real Estate Advisersmalaysia IVPS Property Consultant Sdn Bhd new zealand Bayleys Realty Group Ltd.norway Eiendomshuset Malling & Co.oman Cluttons LLPQatar Cluttons LLPREPuBLIC OF macedonia
Forton International
romania Activ Property Services SRLsloVenia S-Invest d.o.o.south aFrica ProAfrica Property Servicesswitzerland SPG Intercity Commerical Property
Consultantsthailand Nexus Property Consultants Ltd.united araB emirates Cluttons LLP
All other information has been provided by Cushman & Wakefield.
GLOBAL RENTAL PERFORMANCE 6
emea oVerView 20
americas oVerView 12
ASIA PACIFIC OVERVIEW 16
emea luXury oVerView 22
americas luXury oVerView 14
ASIA PACIFIC LuXuRY OVERVIEW 18
TECHNICAL SPECIFICATION S 32
Cover photo courtesy of María Teresa Adasme
New York, Fifth Aveune
Huzzair Aiman, CC BY-ND 2.0 Singapore, ION Orchard
GloBal oVerView
4
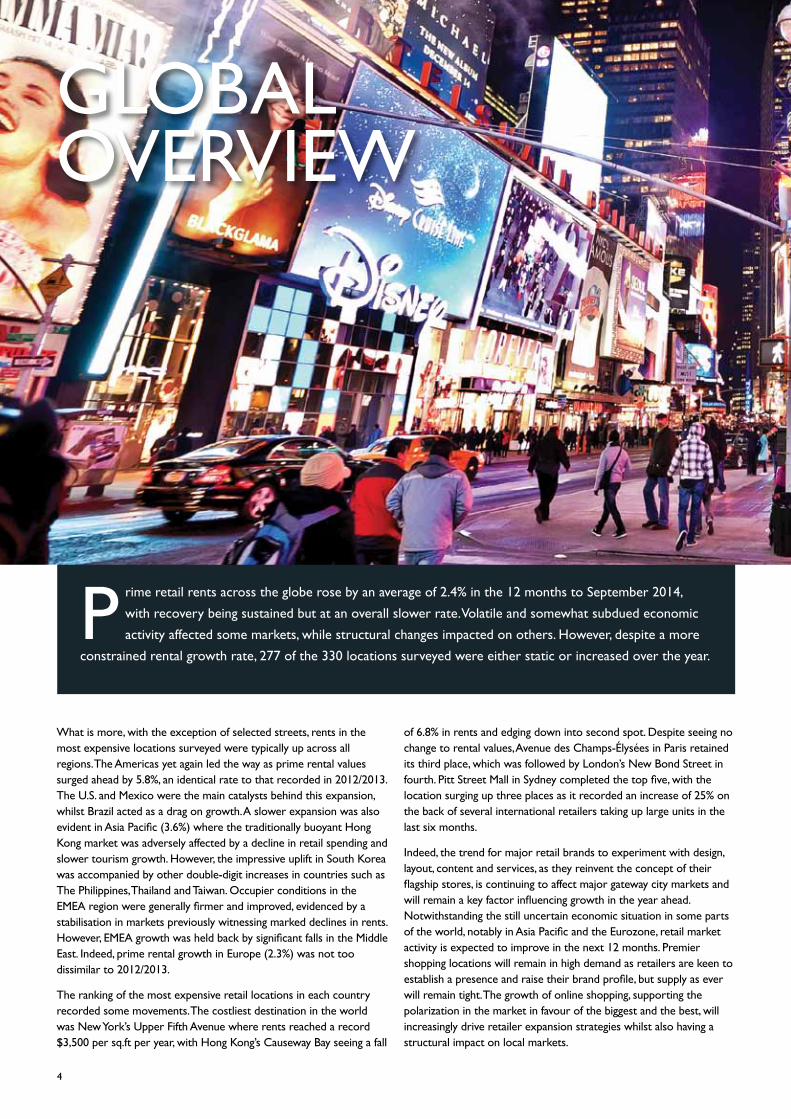
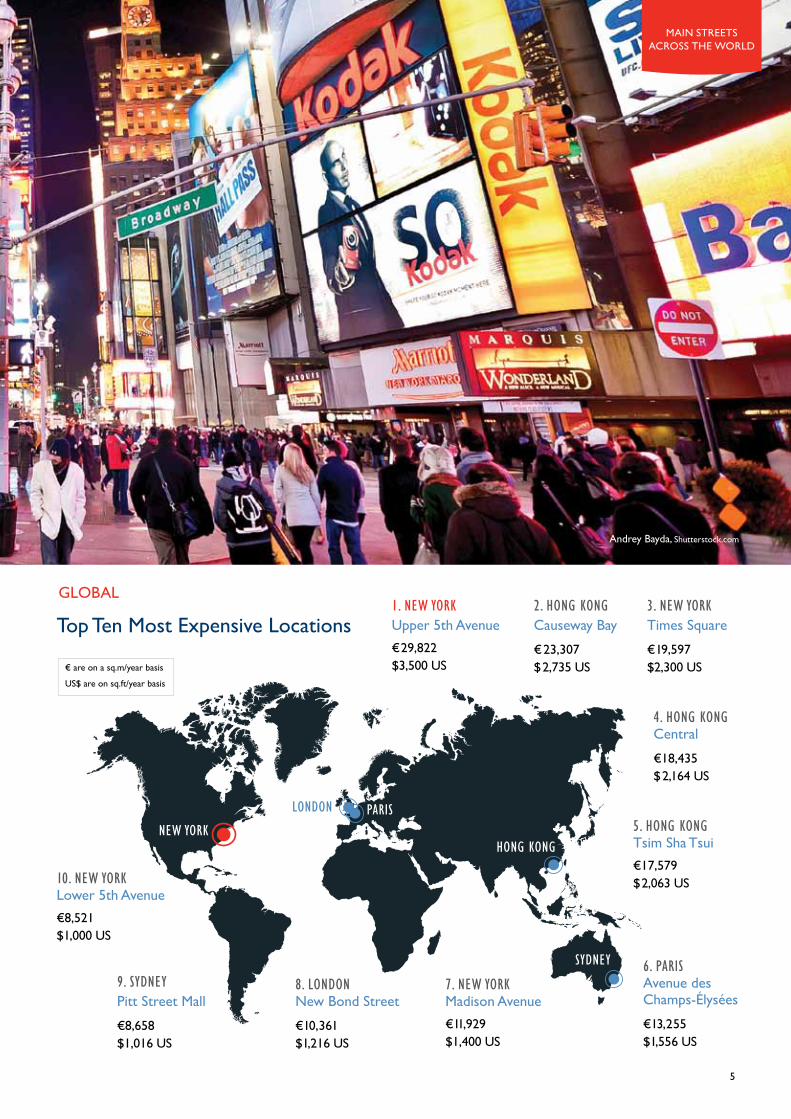
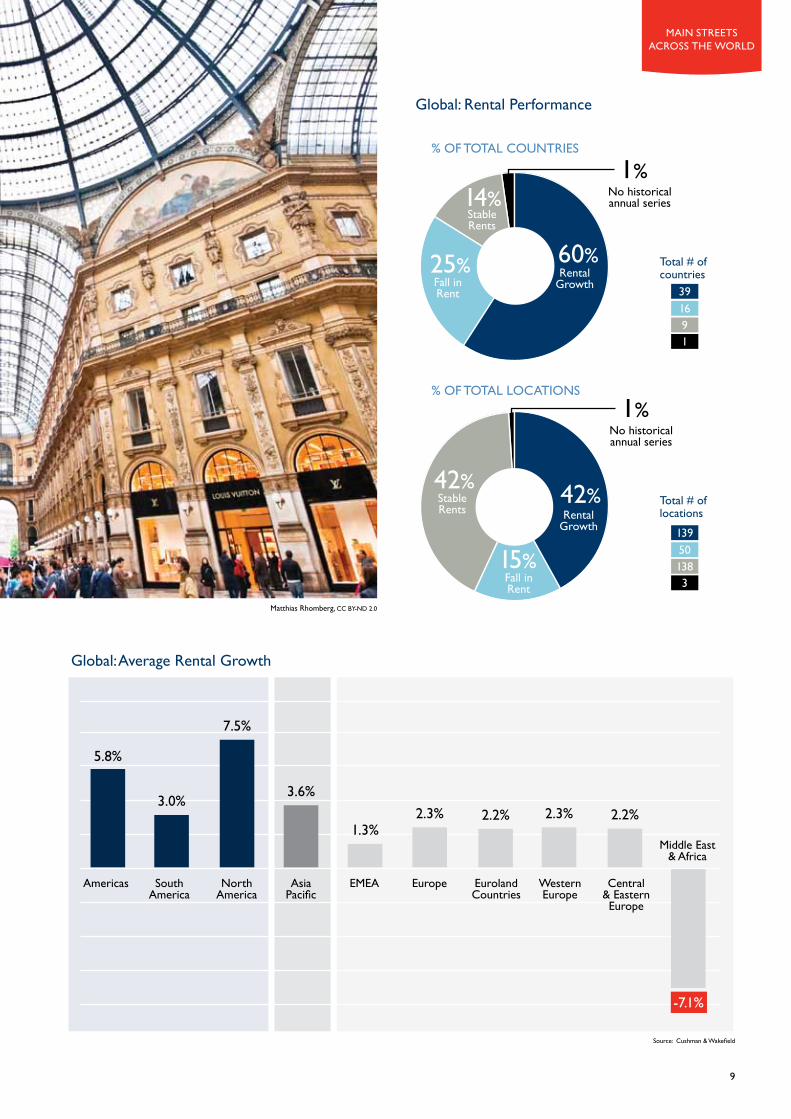
Prime retail rents across the globe rose by an average of 2.4% in the 12 months to September 2014, with recovery being sustained but at an overall slower rate. Volatile and somewhat subdued economic activity affected some markets, while structural changes impacted on others. However, despite a more
constrained rental growth rate, 277 of the 330 locations surveyed were either static or increased over the year.
What is more, with the exception of selected streets, rents in the most expensive locations surveyed were typically up across all regions. The Americas yet again led the way as prime rental values surged ahead by 5.8%, an identical rate to that recorded in 2012/2013. The u.S. and Mexico were the main catalysts behind this expansion, whilst Brazil acted as a drag on growth. A slower expansion was also evident in Asia Pacific (3.6%) where the traditionally buoyant Hong Kong market was adversely affected by a decline in retail spending and slower tourism growth. However, the impressive uplift in South Korea was accompanied by other double-digit increases in countries such as The Philippines, Thailand and Taiwan. Occupier conditions in the EMEA region were generally firmer and improved, evidenced by a stabilisation in markets previously witnessing marked declines in rents. However, EMEA growth was held back by significant falls in the Middle East. Indeed, prime rental growth in Europe (2.3%) was not too dissimilar to 2012/2013.
The ranking of the most expensive retail locations in each country recorded some movements. The costliest destination in the world was New York’s upper Fifth Avenue where rents reached a record $3,500 per sq.ft per year, with Hong Kong’s Causeway Bay seeing a fall
of 6.8% in rents and edging down into second spot. Despite seeing no change to rental values, Avenue des Champs-Élysées in Paris retained its third place, which was followed by London’s New Bond Street in fourth. Pitt Street Mall in Sydney completed the top five, with the location surging up three places as it recorded an increase of 25% on the back of several international retailers taking up large units in the last six months.
Indeed, the trend for major retail brands to experiment with design, layout, content and services, as they reinvent the concept of their flagship stores, is continuing to affect major gateway city markets and will remain a key factor influencing growth in the year ahead. Notwithstanding the still uncertain economic situation in some parts of the world, notably in Asia Pacific and the Eurozone, retail market activity is expected to improve in the next 12 months. Premier shopping locations will remain in high demand as retailers are keen to establish a presence and raise their brand profile, but supply as ever will remain tight. The growth of online shopping, supporting the polarization in the market in favour of the biggest and the best, will increasingly drive retailer expansion strategies whilst also having a structural impact on local markets.
main streets across the world
5
new yorkhong kong
parislondon
sydney
1. new york upper 5th Avenue€29,822 $3,500 us
2. hong kong Causeway Bay€23,307 $2,735 us
3. new york Times Square€19,597 $2,300 us
9. sydney Pitt Street Mall€8,658 $1,016 us
8. london New Bond Street€10,361 $1,216 us
7. new york Madison Avenue€11,929 $1,400 us
10. new york Lower 5th Avenue€8,521 $1,000 us
4. hong kong Central€18,435 $2,164 us
5. hong kong Tsim Sha Tsui€17,579 $2,063 us
top ten Most Expensive Locations
GloBal
6. paris Avenue des Champs-Élysées€13,255 $1,556 us
€ are on a sq.m/year basis
uS$ are on sq.ft/year basis
Andrey Bayda, Shutterstock.com
6
2014/2015 I A Cushman & Wakefield Research Publication
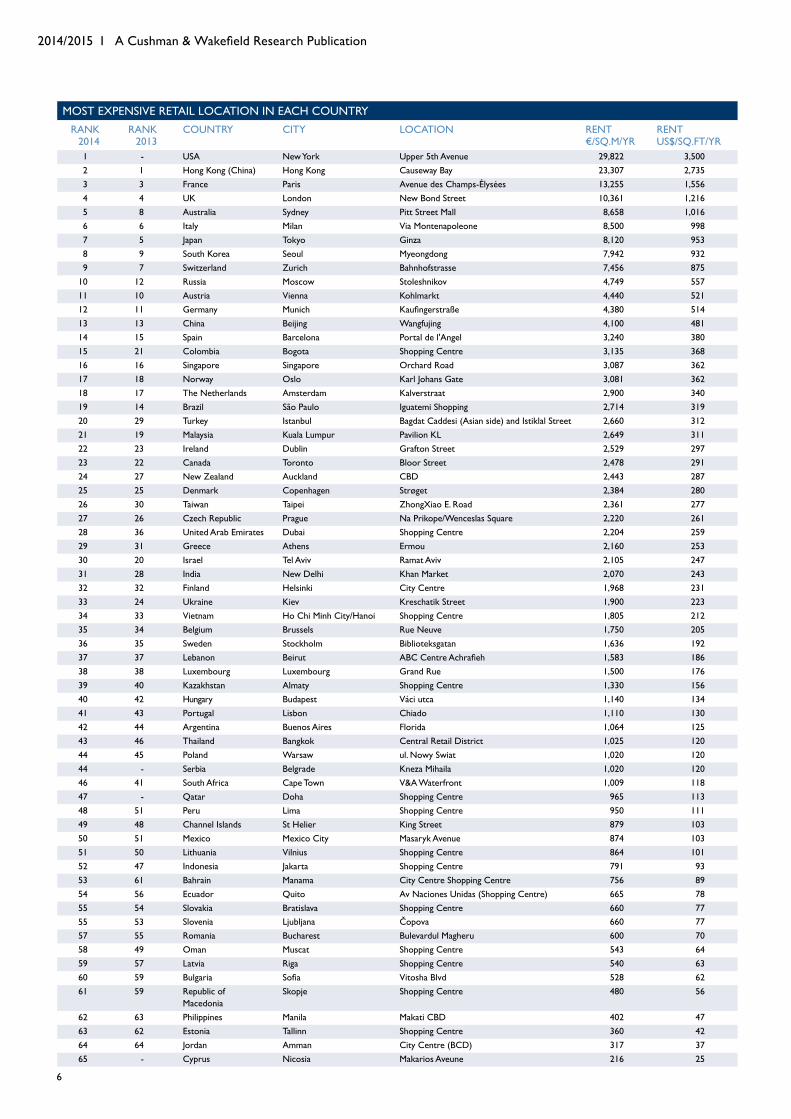
MOST EXPENSIVE RETAIL LOCATION IN EACH COuNTRYrank
2014rank
2013country city location rent
€/Sq.M/YRrent uS$/Sq.FT/YR
1 - usa New York upper 5th Avenue 29,822 3,5002 1 Hong Kong (China) Hong Kong Causeway Bay 23,307 2,7353 3 France Paris Avenue des Champs-Élysées 13,255 1,5564 4 uk London New Bond Street 10,361 1,2165 8 Australia Sydney Pitt Street Mall 8,658 1,0166 6 Italy Milan Via Montenapoleone 8,500 9987 5 Japan Tokyo Ginza 8,120 9538 9 South Korea Seoul Myeongdong 7,942 9329 7 Switzerland Zurich Bahnhofstrasse 7,456 875
10 12 Russia Moscow Stoleshnikov 4,749 55711 10 Austria Vienna Kohlmarkt 4,440 52112 11 Germany Munich Kaufingerstraße 4,380 51413 13 China Beijing Wangfujing 4,100 48114 15 Spain Barcelona Portal de l'Angel 3,240 38015 21 Colombia Bogota Shopping Centre 3,135 36816 16 Singapore Singapore Orchard Road 3,087 36217 18 Norway Oslo Karl Johans Gate 3,081 36218 17 The Netherlands Amsterdam Kalverstraat 2,900 34019 14 Brazil São Paulo Iguatemi Shopping 2,714 31920 29 Turkey Istanbul Bagdat Caddesi (Asian side) and Istiklal Street 2,660 31221 19 Malaysia Kuala Lumpur Pavilion KL 2,649 31122 23 Ireland Dublin Grafton Street 2,529 29723 22 Canada Toronto Bloor Street 2,478 29124 27 New Zealand Auckland cBd 2,443 28725 25 Denmark Copenhagen Strøget 2,384 28026 30 Taiwan Taipei ZhongXiao E. Road 2,361 27727 26 Czech Republic Prague Na Prikope/Wenceslas Square 2,220 26128 36 united Arab Emirates Dubai Shopping Centre 2,204 25929 31 Greece Athens Ermou 2,160 25330 20 Israel Tel Aviv Ramat Aviv 2,105 24731 28 India New Delhi Khan Market 2,070 24332 32 Finland Helsinki City Centre 1,968 23133 24 ukraine Kiev Kreschatik Street 1,900 22334 33 Vietnam Ho Chi Minh City/Hanoi Shopping Centre 1,805 21235 34 Belgium Brussels Rue Neuve 1,750 20536 35 Sweden Stockholm Biblioteksgatan 1,636 19237 37 Lebanon Beirut ABC Centre Achrafieh 1,583 18638 38 Luxembourg Luxembourg Grand Rue 1,500 17639 40 Kazakhstan Almaty Shopping Centre 1,330 15640 42 Hungary Budapest Váci utca 1,140 13441 43 Portugal Lisbon Chiado 1,110 13042 44 Argentina Buenos Aires Florida 1,064 12543 46 Thailand Bangkok Central Retail District 1,025 12044 45 Poland Warsaw ul. Nowy Swiat 1,020 12044 - Serbia Belgrade Kneza Mihaila 1,020 12046 41 South Africa Cape Town V&A Waterfront 1,009 11847 - qatar Doha Shopping Centre 965 11348 51 Peru Lima Shopping Centre 950 11149 48 Channel Islands St Helier King Street 879 10350 51 Mexico Mexico City Masaryk Avenue 874 10351 50 Lithuania Vilnius Shopping Centre 864 10152 47 Indonesia Jakarta Shopping Centre 791 9353 61 Bahrain manama City Centre Shopping Centre 756 8954 56 Ecuador quito Av Naciones unidas (Shopping Centre) 665 7855 54 Slovakia Bratislava Shopping Centre 660 7755 53 Slovenia Ljubljana Čopova 660 7757 55 Romania Bucharest Bulevardul Magheru 600 7058 49 oman Muscat Shopping Centre 543 6459 57 Latvia Riga Shopping Centre 540 6360 59 Bulgaria Sofia Vitosha Blvd 528 6261 59 Republic of
MacedoniaSkopje Shopping Centre 480 56
62 63 Philippines Manila Makati CBD 402 4763 62 Estonia Tallinn Shopping Centre 360 4264 64 Jordan amman City Centre (BCD) 317 3765 - Cyprus Nicosia Makarios Aveune 216 25
main streets across the world
7
Source: Cushman & Wakefield
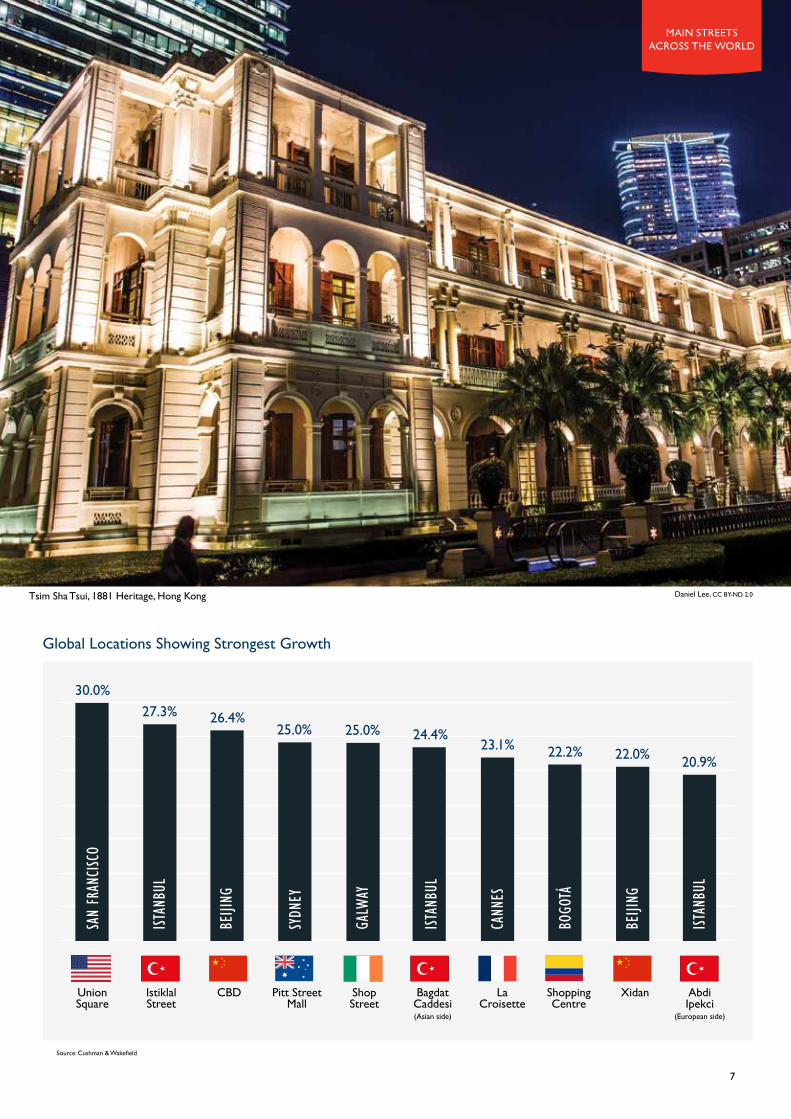
Global Locations Showing Strongest Growth
union Square
Istiklal Street
Pitt Street Mall
Shop Street
Bagdat Caddesi (Asian side)
la Croisette
Shopping Centre
Xidan Abdi Ipekci
(European side)
cBd
30.0%27.3% 26.4%
25.0% 25.0% 24.4%23.1% 22.2% 22.0% 20.9%
BeiJi
ng
istan
Bul
Bogo
tÁ
Cann
es
istan
Bul
galw
ay
sydn
ey
BeiJi
ng
istan
Bul
san
fran
CisC
o
Tsim Sha Tsui, 1881 Heritage, Hong Kong Daniel Lee, CC BY-ND 2.0
2014/2015 I A Cushman & Wakefield Research Publication
* 2014 = annual rental growth to September. All other years = annual growth to June
8
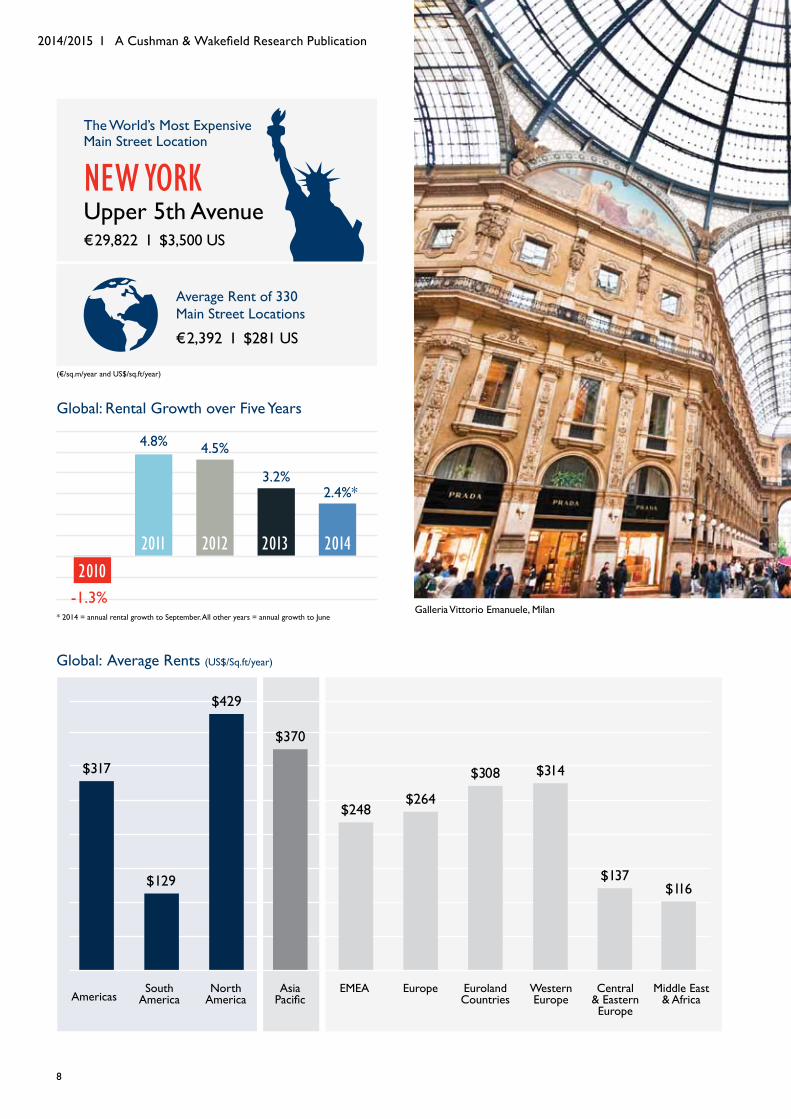
AmericasSouth
AmericaNorth
AmericaAsia
Pacificemea Europe Euroland
CountriesWestern Europe
Central & Eastern Europe
Middle East & Africa
Global: Average rents (uS$/Sq.ft/year)
$317
$129
$429
$370
$248
$137$116
$264
$308 $314
The World’s Most Expensive Main Street Location
new yorkupper 5th Avenue€29,822 i $3,500 uS
2.4%*3.2%
4.5%4.8%
2010
2014201320122011
-1.3%
Global: Rental Growth over Five Years
€2,392 i $281 uS
Average Rent of 330 Main Street Locations
Galleria Vittorio Emanuele, Milan
(€/sq.m/year and uS$/sq.ft/year)
main streets across the world
9
-7.1%
Americas South America
North America
Asia Pacific
emea Europe Euroland Countries
Western Europe
Central & Eastern Europe
Middle East & Africa
Global: Average rental Growth
Source: Cushman & Wakefield
5.8%
7.5%
3.0% 3.6%
1.3%2.3% 2.2% 2.3% 2.2%
Global: Rental Performance
% of totAL countriES
% of totAL LocAtionS
1%
1%
No historical annual series
No historical annual series
60%25%
14%
Rental GrowthFall in
Rent
Stable Rents
42%
15%
42%Rental
Growth
Fall in Rent
Stable Rents
Total # of countries
39
16
9
1
Total # of locations
139 50 138 3
Matthias Rhomberg, CC BY-ND 2.0
2014/2015 I A Cushman & Wakefield Research Publication
10
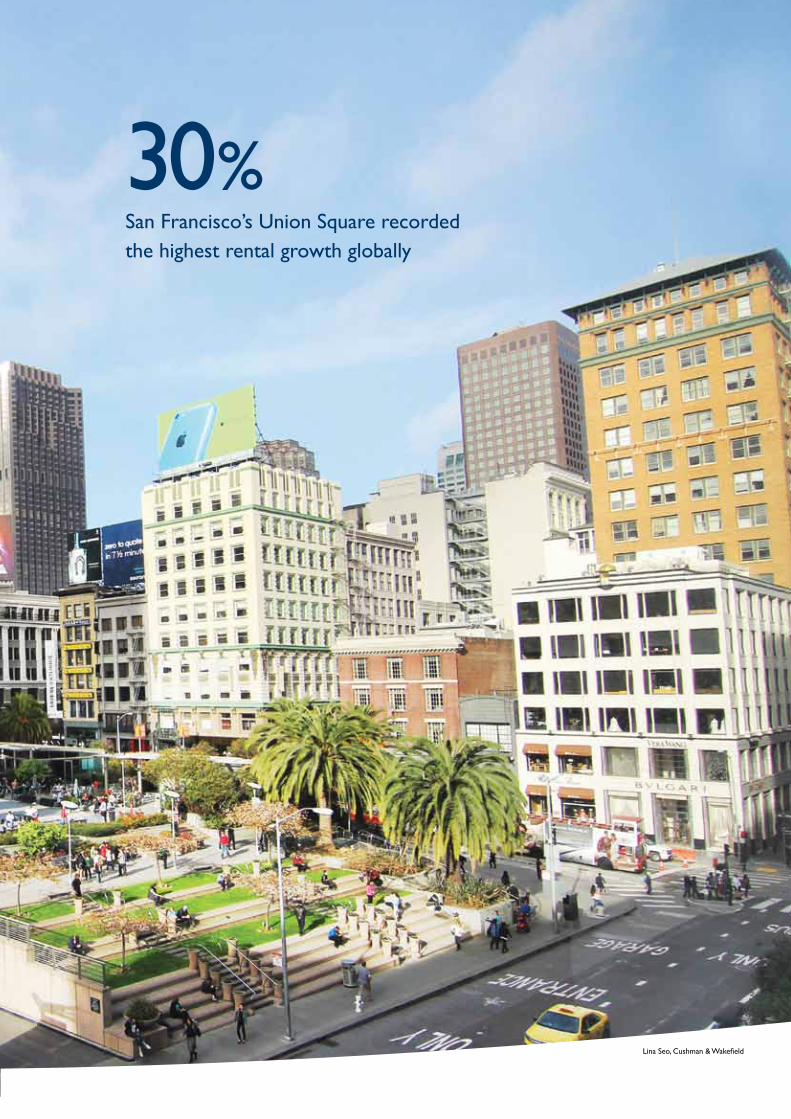
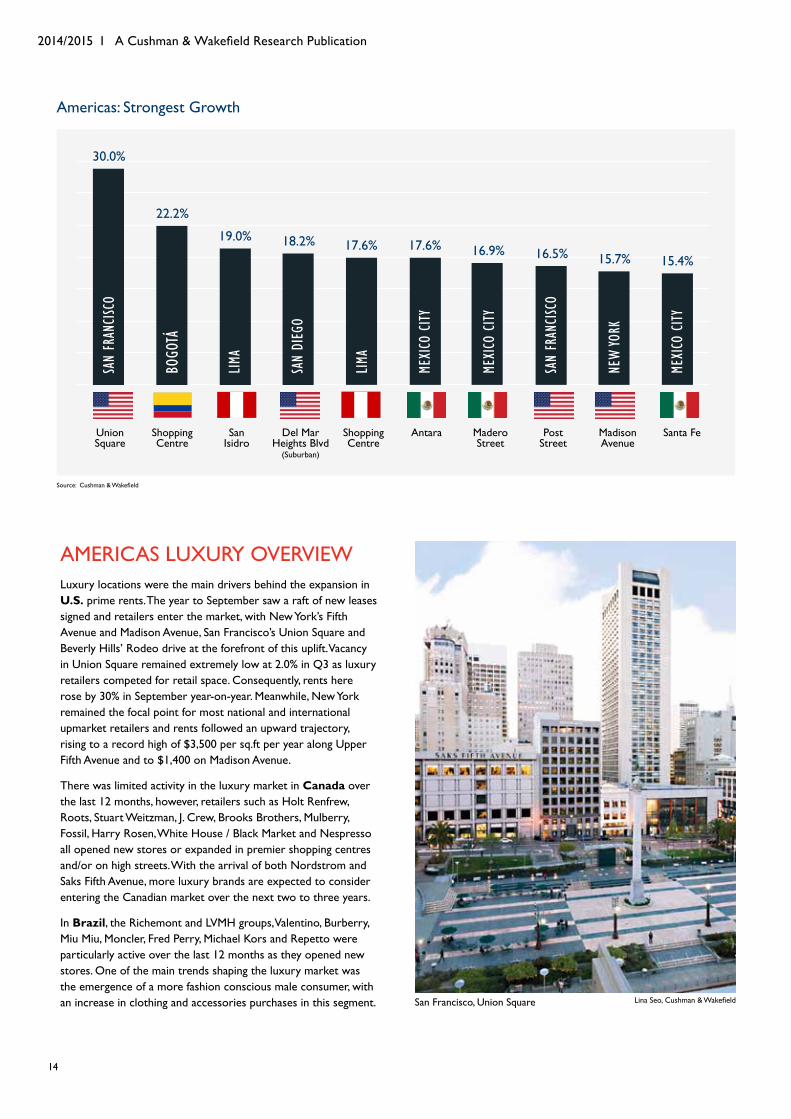
San francisco’s union Square recorded the highest rental growth globally
30%
Lina Seo, Cushman & Wakefield

r etailer activity in the year to September 2014 was healthy, with rental growth reaching 5.8%, the same figure recorded in 2012/2013. Most of the countries witnessed an uplift over the past 12 months, with
some reaching double digits.
americas oVerView
2014/2015 I A Cushman & Wakefield Research Publication
New York, Fifth Avenue
13
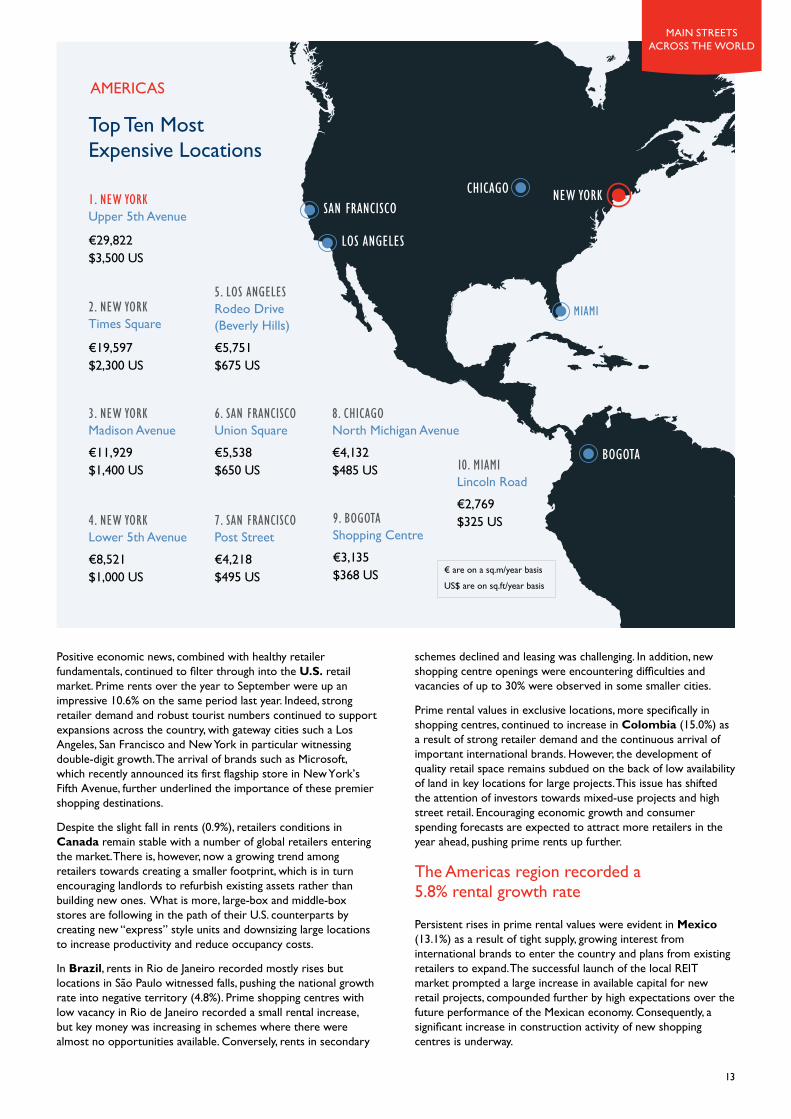
Positive economic news, combined with healthy retailer fundamentals, continued to filter through into the U.S. retail market. Prime rents over the year to September were up an impressive 10.6% on the same period last year. Indeed, strong retailer demand and robust tourist numbers continued to support expansions across the country, with gateway cities such a Los Angeles, San Francisco and New York in particular witnessing double-digit growth. The arrival of brands such as Microsoft, which recently announced its first flagship store in New York’s Fifth Avenue, further underlined the importance of these premier shopping destinations.
Despite the slight fall in rents (0.9%), retailers conditions in Canada remain stable with a number of global retailers entering the market. There is, however, now a growing trend among retailers towards creating a smaller footprint, which is in turn encouraging landlords to refurbish existing assets rather than building new ones. What is more, large-box and middle-box stores are following in the path of their u.S. counterparts by creating new “express” style units and downsizing large locations to increase productivity and reduce occupancy costs.
in Brazil, rents in Rio de Janeiro recorded mostly rises but locations in São Paulo witnessed falls, pushing the national growth rate into negative territory (4.8%). Prime shopping centres with low vacancy in Rio de Janeiro recorded a small rental increase, but key money was increasing in schemes where there were almost no opportunities available. Conversely, rents in secondary
schemes declined and leasing was challenging. In addition, new shopping centre openings were encountering difficulties and vacancies of up to 30% were observed in some smaller cities.
Prime rental values in exclusive locations, more specifically in shopping centres, continued to increase in Colombia (15.0%) as a result of strong retailer demand and the continuous arrival of important international brands. However, the development of quality retail space remains subdued on the back of low availability of land in key locations for large projects. This issue has shifted the attention of investors towards mixed-use projects and high street retail. Encouraging economic growth and consumer spending forecasts are expected to attract more retailers in the year ahead, pushing prime rents up further.
Persistent rises in prime rental values were evident in Mexico (13.1%) as a result of tight supply, growing interest from international brands to enter the country and plans from existing retailers to expand. The successful launch of the local REIT market prompted a large increase in available capital for new retail projects, compounded further by high expectations over the future performance of the Mexican economy. Consequently, a significant increase in construction activity of new shopping centres is underway.
the Americas region recorded a 5.8% rental growth rate
new yorksan franCisCo
Bogota
ChiCago
los angeles
miami
1. new yorkupper 5th Avenue
€29,822 $3,500 us
2. new yorkTimes Square
€19,597 $2,300 us
3. new yorkMadison Avenue€11,929 $1,400 us
4. new yorkLower 5th Avenue€8,521 $1,000 us
5. los angelesRodeo Drive (Beverly Hills)€5,751 $675 us
7. san franCisCoPost Street€4,218 $495 us
8. ChiCagoNorth Michigan Avenue€4,132 $485 us
9. BogotaShopping Centre€3,135 $368 us
10. miamiLincoln Road€2,769 $325 us
6. san franCisCounion Square€5,538 $650 us
top ten Most Expensive Locations
americas
€ are on a sq.m/year basis
uS$ are on sq.ft/year basis
main streets across the world
14
2014/2015 I A Cushman & Wakefield Research Publication
union Square
Shopping Centre
san Isidro
Shopping Centre
Antara Madero Street
Post Street
Madison Avenue
Santa FeDel Mar Heights Blvd
(Suburban)
15.4%
meXi
Co C
ity
15.7%
new
york
16.5%
san
fran
CisC
o
16.9%
meXi
Co C
ity
17.6%
meXi
Co C
ity
17.6%
lima
18.2%
san
dieg
o
19.0%li
ma22.2%
Bogo
tÁ30.0%
san
fran
CisC
oAmericas: Strongest Growth
Source: Cushman & Wakefield
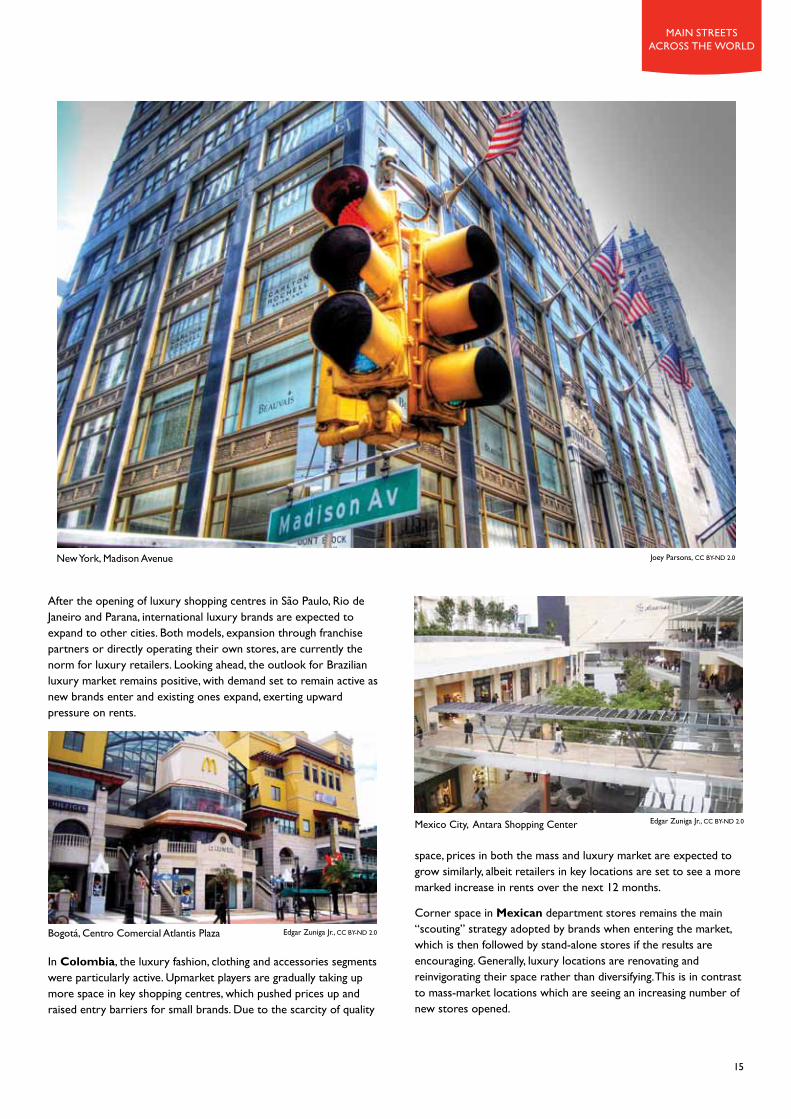
americas luXury oVerViewLuxury locations were the main drivers behind the expansion in U.S. prime rents. The year to September saw a raft of new leases signed and retailers enter the market, with New York’s Fifth Avenue and Madison Avenue, San Francisco’s union Square and Beverly Hills’ Rodeo drive at the forefront of this uplift. Vacancy in union Square remained extremely low at 2.0% in q3 as luxury retailers competed for retail space. Consequently, rents here rose by 30% in September year-on-year. Meanwhile, New York remained the focal point for most national and international upmarket retailers and rents followed an upward trajectory, rising to a record high of $3,500 per sq.ft per year along upper Fifth Avenue and to $1,400 on Madison Avenue.
There was limited activity in the luxury market in Canada over the last 12 months, however, retailers such as Holt Renfrew, Roots, Stuart Weitzman, J. Crew, Brooks Brothers, Mulberry, Fossil, Harry Rosen, White House / Black Market and Nespresso all opened new stores or expanded in premier shopping centres and/or on high streets. With the arrival of both Nordstrom and Saks Fifth Avenue, more luxury brands are expected to consider entering the Canadian market over the next two to three years.
in Brazil, the Richemont and LVMH groups, Valentino, Burberry, Miu Miu, Moncler, Fred Perry, Michael Kors and Repetto were particularly active over the last 12 months as they opened new stores. One of the main trends shaping the luxury market was the emergence of a more fashion conscious male consumer, with an increase in clothing and accessories purchases in this segment. San Francisco, union Square Lina Seo, Cushman & Wakefield
15
main streets across the world
After the opening of luxury shopping centres in São Paulo, Rio de Janeiro and Parana, international luxury brands are expected to expand to other cities. Both models, expansion through franchise partners or directly operating their own stores, are currently the norm for luxury retailers. Looking ahead, the outlook for Brazilian luxury market remains positive, with demand set to remain active as new brands enter and existing ones expand, exerting upward pressure on rents.
in Colombia, the luxury fashion, clothing and accessories segments were particularly active. upmarket players are gradually taking up more space in key shopping centres, which pushed prices up and raised entry barriers for small brands. Due to the scarcity of quality
New York, Madison Avenue Joey Parsons, CC BY-ND 2.0
Mexico City, Antara Shopping Center
Bogotá, Centro Comercial Atlantis Plaza Edgar Zuniga Jr., CC BY-ND 2.0
Edgar Zuniga Jr., CC BY-ND 2.0
space, prices in both the mass and luxury market are expected to grow similarly, albeit retailers in key locations are set to see a more marked increase in rents over the next 12 months.
Corner space in Mexican department stores remains the main “scouting” strategy adopted by brands when entering the market, which is then followed by stand-alone stores if the results are encouraging. Generally, luxury locations are renovating and reinvigorating their space rather than diversifying. This is in contrast to mass-market locations which are seeing an increasing number of new stores opened.
ASIA PACIFIC oVerView
2014/2015 I A Cushman & Wakefield Research Publication
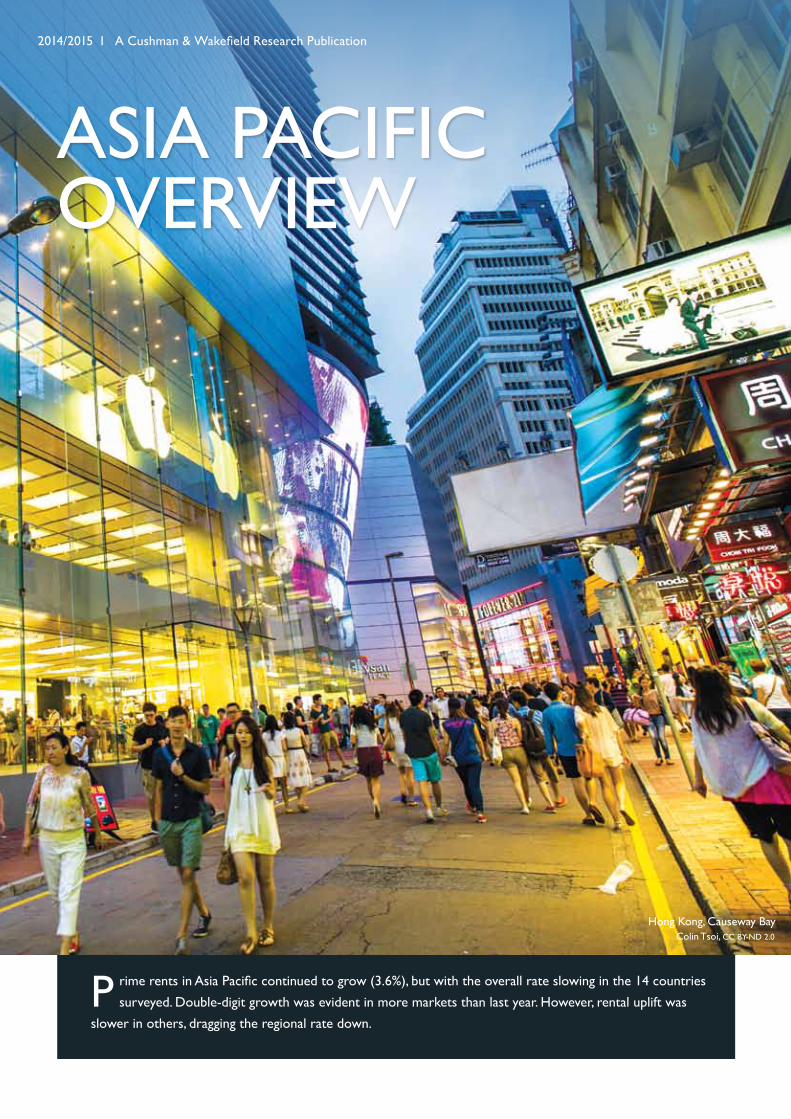
P rime rents in Asia Pacific continued to grow (3.6%), but with the overall rate slowing in the 14 countries surveyed. Double-digit growth was evident in more markets than last year. However, rental uplift was
slower in others, dragging the regional rate down.
Colin Tsoi, CC BY-ND 2.0Hong Kong, Causeway Bay
17
Hong Kong continued to face headwinds associated with slower tourism growth and spending in the first three quarters of 2014. Combined with a strong 2013, this translated into a deeper slowdown in retail sales and a fall of 4.8% in prime rents in the year to September. The moderating sales performance and more cautious consumer sentiment hindered retailers’ expansion in 2014. Luxury brands were cautious, while watch and jewellery retailers notably cut back on new stores, with this sector seeing negative growth. Several leading local retailers recorded lower holiday sales, consequently adopting a more conservative approach.
As shopping centres upgraded and fast fashion brands expanded aggressively, prime rents in Beijing recorded robust growth. The Food and Beverage segment continued to provide the impetus to leasing activity. The market is, however, facing some challenges in the form of a slowdown in economic growth and increased competition from online shopping. Shanghai recorded a slight dip in prime rents, with ample new supply delivered and retail sales growth slowing. Nevertheless, values in premium schemes in good locations were stable, with strong demand from the F&B segment.
Against a backdrop of tighter supply and better interest, the Japanese market witnessed an upward trend in rents (3.9%). Supported by buoyant consumer spending, occupier demand for space in high streets was strong and resulted in a number of brisk openings. However, the supply shortage in premier destinations coupled with low development activity has meant that some of this demand has filtered down to adjacent streets. The upward trend in
rents is expected to continue in the year ahead.
Although the growth of fast fashion brands was starting to slow, multinational labels continued to arrive in South Korea (11.5%). Shopping centres in good locations are aggressively investing in renovations and expansion projects in order to regain their competitive edge. In addition to global fast fashion retailers and domestic players, the market has also seen the arrival of new international retailers, creating further competition.
Rental values in India grew modestly (1.7%) over the 12 months to September, with moderate demand from clothing and F&B brands fuelling occupier activity. The polarisation between prime and secondary locations was evident in terms of trading, footfall and consequently occupier demand. Whilst fast fashion players such as H&M are planning their entry into the market, the recently announced restrictions on Foreign Direct Investment in multi-brand retailing will continue to hamper some global retailers’ aspirations.
Rental growth (9.1%) returned to selected Australian locations, but with uplifts confined to high performing regional shopping centres and Pitt Street Mall. Indeed, the premier Australian destination saw rents increase due to a large influx of international retailers signing new leases in the last six months and taking up large space. This was generally through the amalgamation of several smaller stores, which in turned significantly reduced the supply of traditional 200 sq.m units.
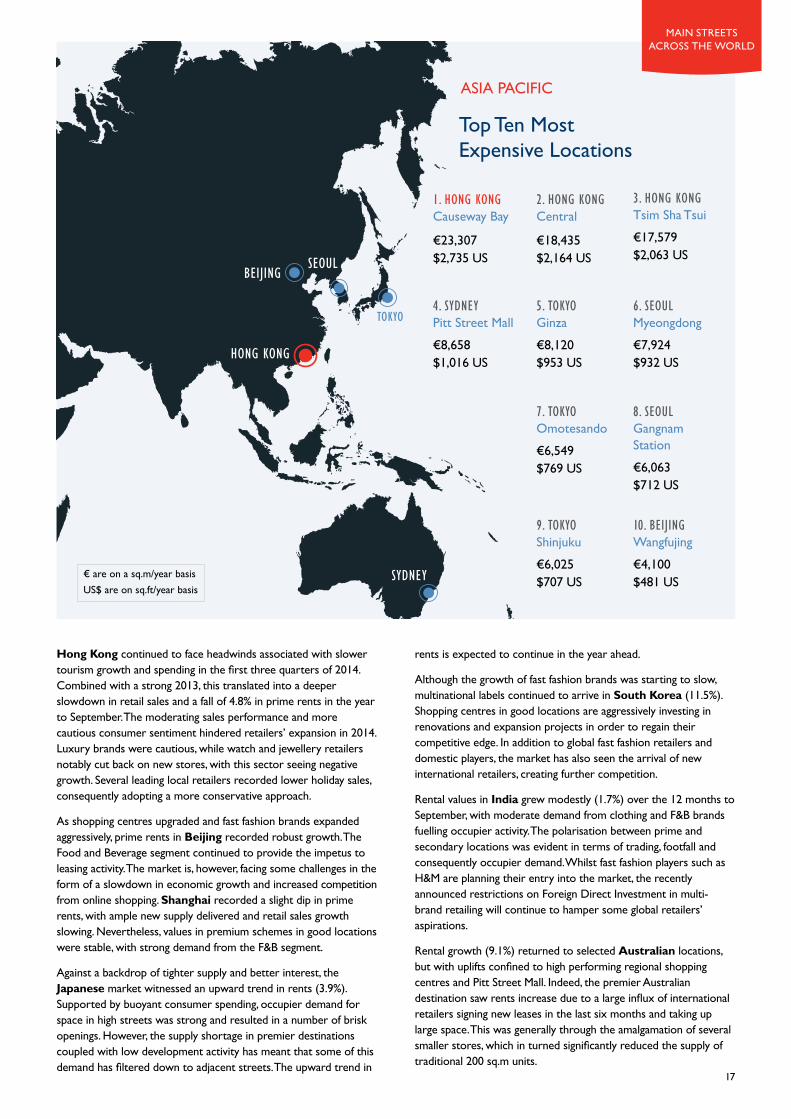
hong kong
sydney
seoulBeiJing
tokyo
1. hong kong Causeway Bay
€23,307 $2,735 us
2. hong kong Central
€18,435 $2,164 us
3. hong kong Tsim Sha Tsui€17,579 $2,063 us
4. sydney Pitt Street Mall€8,658 $1,016 us
5. tokyo Ginza€8,120 $953 us
7. tokyo Omotesando€6,549 $769 us
8. seoul Gangnam Station€6,063 $712 us
9. tokyo Shinjuku€6,025 $707 us
10. BeiJing Wangfujing€4,100 $481 us
6. seoul Myeongdong€7,924 $932 us
top ten Most Expensive Locations
ASIA PACIFIC
main streets across the world
€ are on a sq.m/year basis uS$ are on sq.ft/year basis
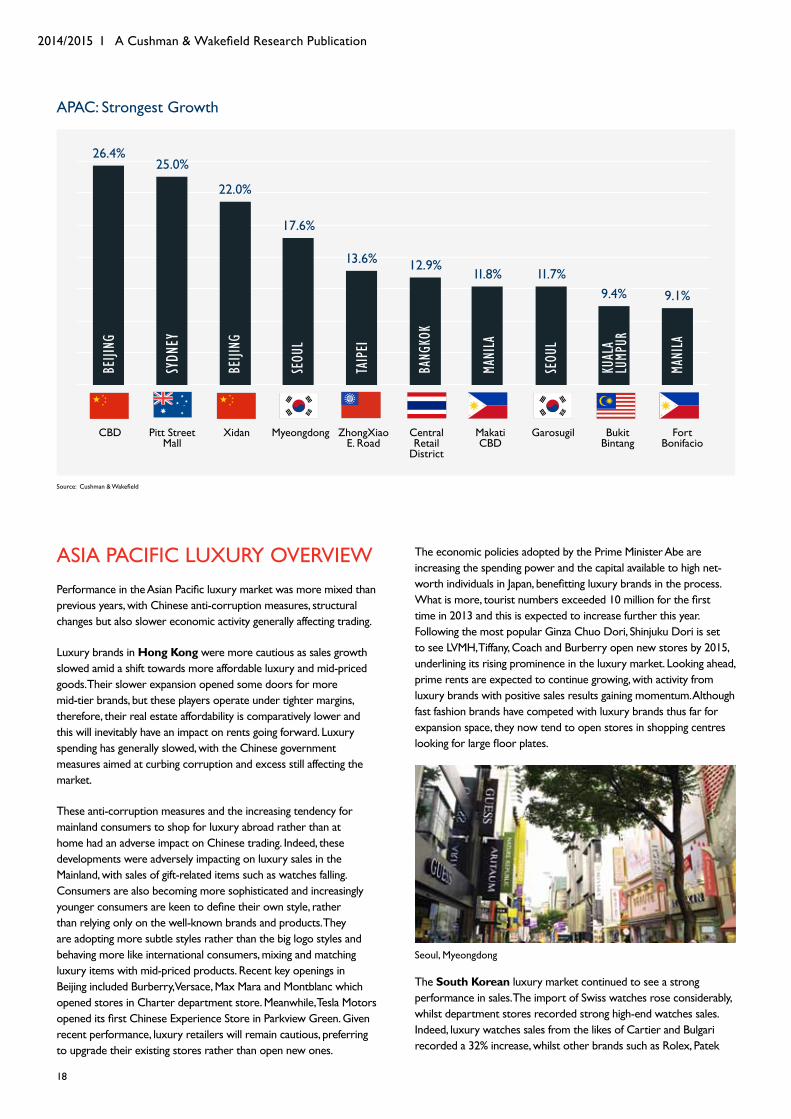
ASIA PACIFIC LuXuRY OVERVIEWPerformance in the Asian Pacific luxury market was more mixed than previous years, with Chinese anti-corruption measures, structural changes but also slower economic activity generally affecting trading.
Luxury brands in Hong Kong were more cautious as sales growth slowed amid a shift towards more affordable luxury and mid-priced goods. Their slower expansion opened some doors for more mid-tier brands, but these players operate under tighter margins, therefore, their real estate affordability is comparatively lower and this will inevitably have an impact on rents going forward. Luxury spending has generally slowed, with the Chinese government measures aimed at curbing corruption and excess still affecting the market.
These anti-corruption measures and the increasing tendency for mainland consumers to shop for luxury abroad rather than at home had an adverse impact on Chinese trading. Indeed, these developments were adversely impacting on luxury sales in the Mainland, with sales of gift-related items such as watches falling. Consumers are also becoming more sophisticated and increasingly younger consumers are keen to define their own style, rather than relying only on the well-known brands and products. They are adopting more subtle styles rather than the big logo styles and behaving more like international consumers, mixing and matching luxury items with mid-priced products. Recent key openings in Beijing included Burberry, Versace, Max Mara and Montblanc which opened stores in Charter department store. Meanwhile, Tesla Motors opened its first Chinese Experience Store in Parkview Green. Given recent performance, luxury retailers will remain cautious, preferring to upgrade their existing stores rather than open new ones.
The economic policies adopted by the Prime Minister Abe are increasing the spending power and the capital available to high net-worth individuals in Japan, benefitting luxury brands in the process. What is more, tourist numbers exceeded 10 million for the first time in 2013 and this is expected to increase further this year. Following the most popular Ginza Chuo Dori, Shinjuku Dori is set to see LVMH, Tiffany, Coach and Burberry open new stores by 2015, underlining its rising prominence in the luxury market. Looking ahead, prime rents are expected to continue growing, with activity from luxury brands with positive sales results gaining momentum. Although fast fashion brands have competed with luxury brands thus far for expansion space, they now tend to open stores in shopping centres looking for large floor plates.
the South Korean luxury market continued to see a strong performance in sales. The import of Swiss watches rose considerably, whilst department stores recorded strong high-end watches sales. Indeed, luxury watches sales from the likes of Cartier and Bulgari recorded a 32% increase, whilst other brands such as Rolex, Patek
Seoul, Myeongdong
cBd Pitt Street Mall
Xidan ZhongXiao E. Road
Central Retail
District
Makati cBd
Garosugil Bukit Bintang
Fort Bonifacio
Myeongdong
9.1%
mani
la
9.4%
kual
a
lump
ur
11.7%
seou
l
11.8%
mani
la
12.9%
Bang
kok
13.6%
taip
ei
17.6%
seou
l
22.0%
BeiJi
ng
25.0%sy
dney
26.4%
BeiJi
ngAPAc: Strongest Growth
Source: Cushman & Wakefield
18
2014/2015 I A Cushman & Wakefield Research Publication
Philippe were becoming increasingly popular. Trading of upmarket products in the top three department stores was also encouraging, recording double-digit sales growth.
Accessories, including watches and jewellery, cars and furniture were the most active luxury segments over the last year in India. Indeed, the increase of luxury residential properties in the top eight Indian cities led to a surge in demand for luxury furniture. Many upmarket brands have been planning to enter the market but are waiting for clarity on regulations. Meanwhile, they remain constrained by the lack of quality space in both high streets and shopping centres. New Delhi, Mumbai, Bengaluru and Chennai remain the top markets for luxury brands, but with Kolkata’s offering also improving with the addition of a shopping centre last year, which currently contains dedicated luxury space and is seeing good footfall. Occupier demand outstrips supply in New Delhi and Mumbai, exerting upward pressure on prime rents in short term in established locations.
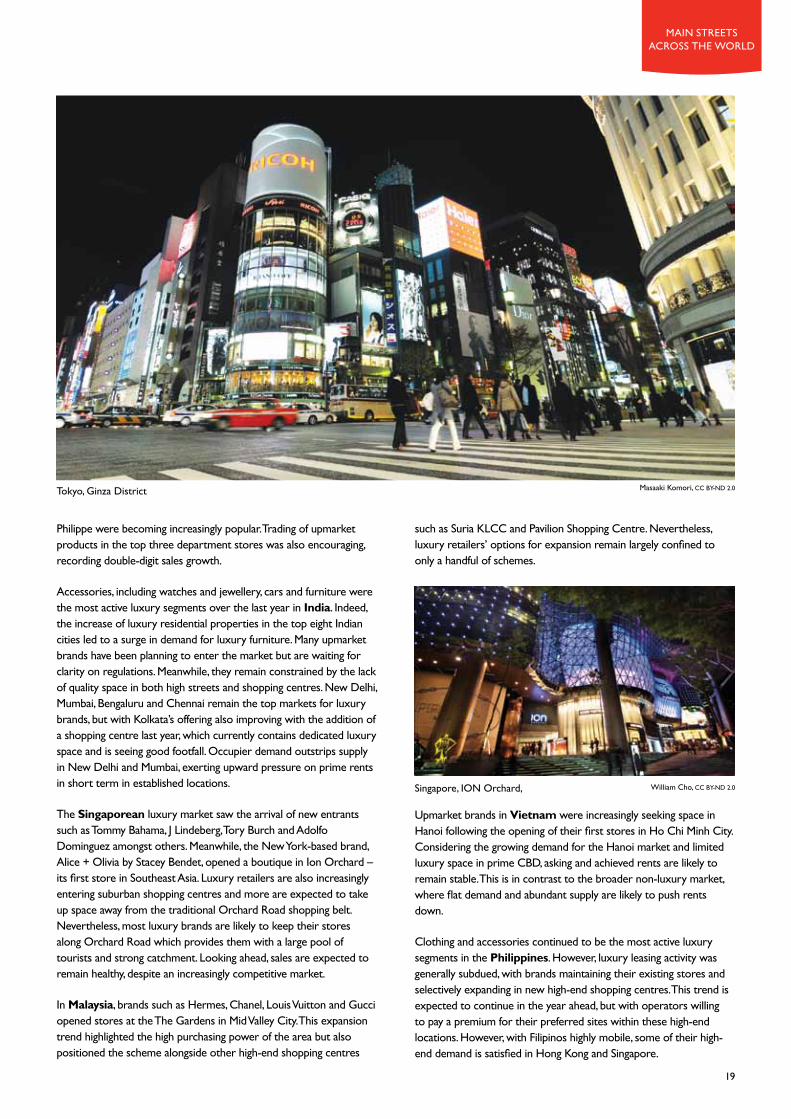
the Singaporean luxury market saw the arrival of new entrants such as Tommy Bahama, J Lindeberg, Tory Burch and Adolfo Dominguez amongst others. Meanwhile, the New York-based brand, Alice + Olivia by Stacey Bendet, opened a boutique in Ion Orchard – its first store in Southeast Asia. Luxury retailers are also increasingly entering suburban shopping centres and more are expected to take up space away from the traditional Orchard Road shopping belt. Nevertheless, most luxury brands are likely to keep their stores along Orchard Road which provides them with a large pool of tourists and strong catchment. Looking ahead, sales are expected to remain healthy, despite an increasingly competitive market.
in Malaysia, brands such as Hermes, Chanel, Louis Vuitton and Gucci opened stores at the The Gardens in Mid Valley City. This expansion trend highlighted the high purchasing power of the area but also positioned the scheme alongside other high-end shopping centres
such as Suria KLCC and Pavilion Shopping Centre. Nevertheless, luxury retailers’ options for expansion remain largely confined to only a handful of schemes.
upmarket brands in Vietnam were increasingly seeking space in Hanoi following the opening of their first stores in Ho Chi Minh City. Considering the growing demand for the Hanoi market and limited luxury space in prime CBD, asking and achieved rents are likely to remain stable. This is in contrast to the broader non-luxury market, where flat demand and abundant supply are likely to push rents down.
Clothing and accessories continued to be the most active luxury segments in the Philippines. However, luxury leasing activity was generally subdued, with brands maintaining their existing stores and selectively expanding in new high-end shopping centres. This trend is expected to continue in the year ahead, but with operators willing to pay a premium for their preferred sites within these high-end locations. However, with Filipinos highly mobile, some of their high-end demand is satisfied in Hong Kong and Singapore.
Singapore, ION Orchard, William Cho, CC BY-ND 2.0
19
main streets across the world
Tokyo, Ginza District Masaaki Komori, CC BY-ND 2.0
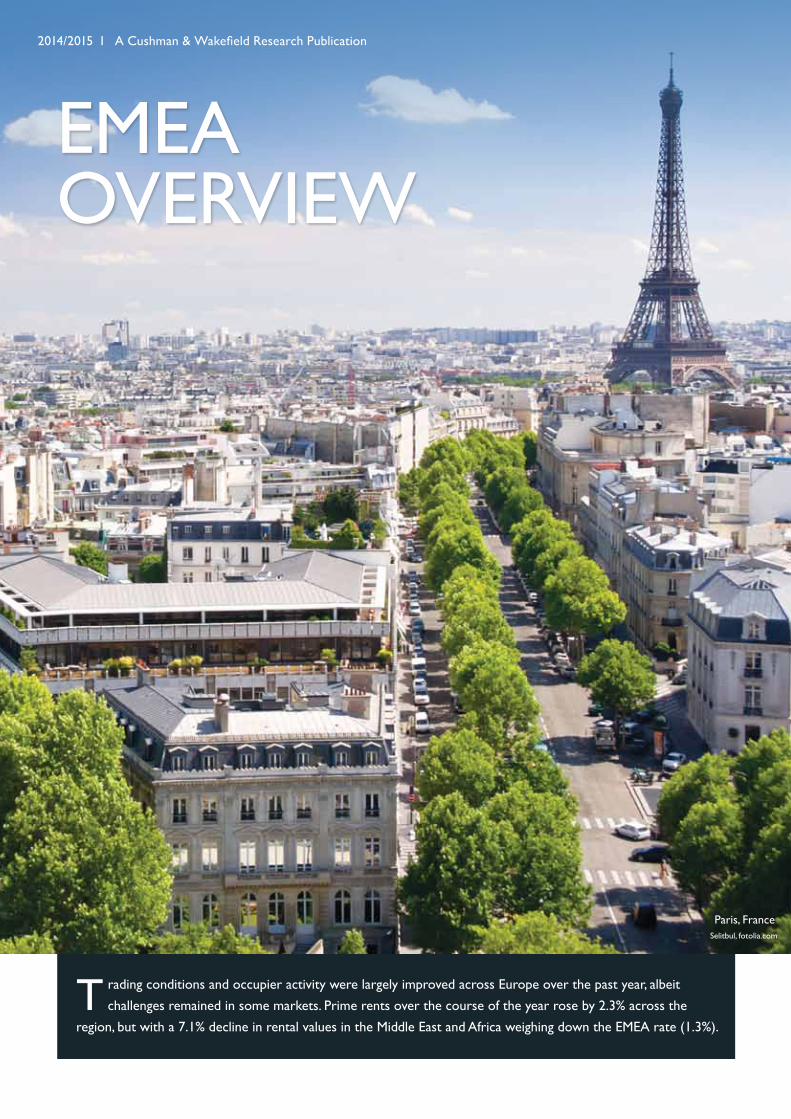
t rading conditions and occupier activity were largely improved across Europe over the past year, albeit challenges remained in some markets. Prime rents over the course of the year rose by 2.3% across the
region, but with a 7.1% decline in rental values in the Middle East and Africa weighing down the EMEA rate (1.3%).
emea oVerView
2014/2015 I A Cushman & Wakefield Research Publication
Selitbul, fotolia.com
Paris, France
There were, however, a number of success stories, with occupier activity in the periphery picking up. Countries such as Portugal (3.7%), Ireland (5.5%), Spain (2.3%) and Greece (9.6%) which in previous surveys witnessed sharp falls, recorded good to strong growth in the 12 months to September.
Mature core markets such as the UK (3.0%), France (6.2%) and Germany (3.9%) continued to see good leasing activity, particularly in the prime segment. Indeed, exceptional luxury retailer demand in cities such as Paris and London, coupled with the very finite supply on offer, continued to exert upward pressure on rents in the best locations, but with large premiums also paid by new tenants to secure their preferred space. In Germany, high occupier demand has created an increased need for the refurbishment of existing high streets and schemes, raising their profile in the process, best exemplified by the triangle of Große Bleichen, Hohe Bleichen and Poststraße in Hamburg.
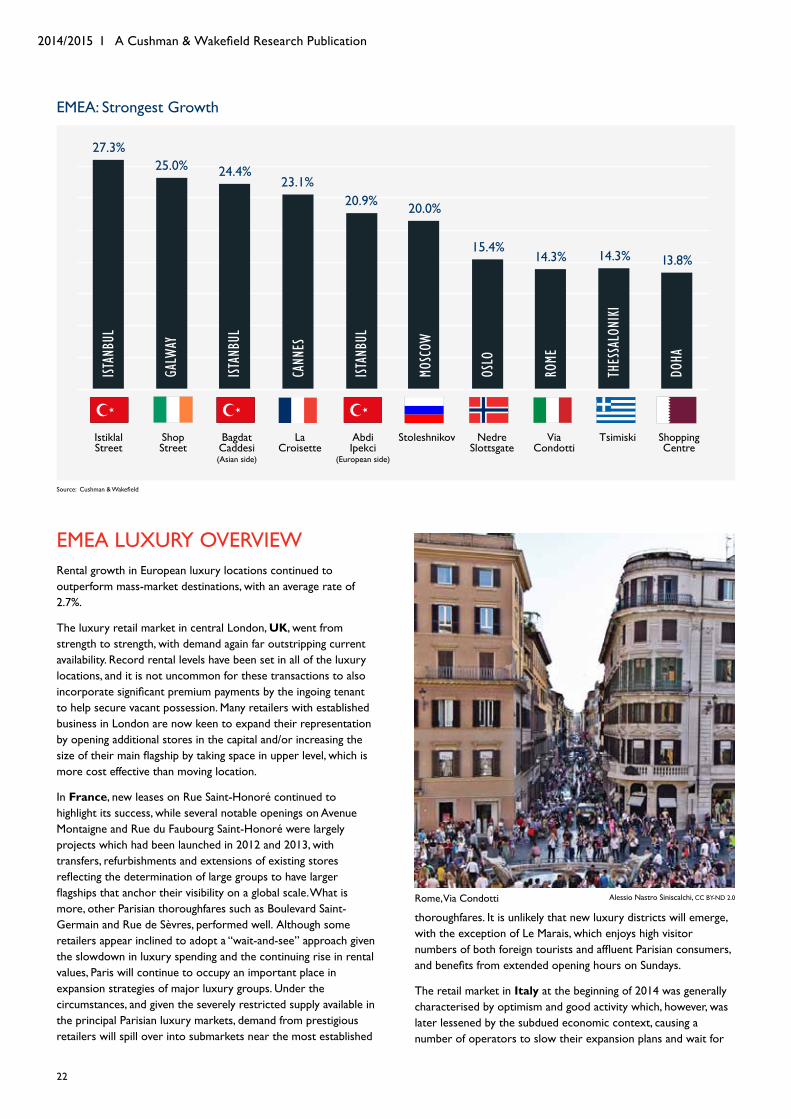
The strongest growth in the region was, however, registered in Turkey (15.6%), where healthy consumer spending, an expanding middle class, better quality retail space and the arrival of more international retailers continued to support the market. Rents in the top three locations of Abdi Ipekci (European side), Bagdat Caddesi (Asian side) and Istiklal Street rose by 20.9%, 24.4% and 27.3% respectively, which were also three of the strongest rises recorded across the region and globally.
21
At the same time, the diversity of performance in the region was again notable. Slight to modest falls in prime rental values were recorded in Austria (1.2%), Belgium (2.4%), The Netherlands (2.3%), Italy (0.4%), Poland (0.2%), Slovakia (2.1%) and Slovenia (4.1%), where in some cases retail spending remained restrained. The sharpest contraction (20.0%) was, however, seen in Ukraine where geopolitical instability greatly affected retailers’ strategies. Indeed, a number left the market whilst other operators cancelled plans to enter the country or expand.
Looking ahead, although challenges remain and occupier activity will be slow to recover outside prime locations, trading conditions are expected to improve in the year ahead across the region. A favourable low inflation environment, a still loose monetary policy, better unemployment figures and real wage growth slowly emerging are expected to provide a boost to the Eurozone and the rest of the continent.
turkey registered the strongest growth in the region at 15.6%, including three locations which recorded some of the strongest rises globally.
paris
milan
zuriCh
rome
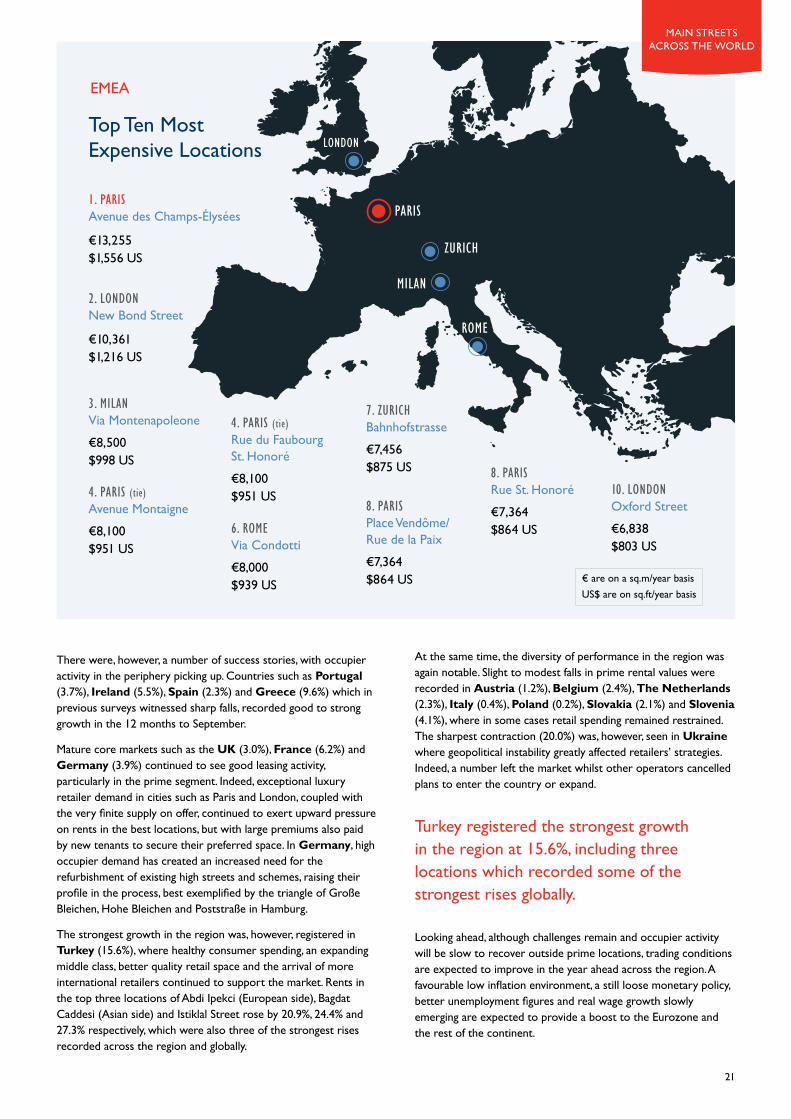
londontop ten Most Expensive Locations
emea
€ are on a sq.m/year basis uS$ are on sq.ft/year basis
1. paris Avenue des Champs-Élysées
€13,255 $1,556 us
2. london New Bond Street
€10,361 $1,216 us
3. milan Via Montenapoleone€8,500 $998 us
4. paris (tie) Avenue Montaigne€8,100 $951 us
4. paris (tie) Rue du Faubourg St. Honoré€8,100 $951 us
7. zuriCh Bahnhofstrasse€7,456 $875 us
8. paris Place Vendôme/Rue de la Paix€7,364 $864 us
8. paris Rue St. Honoré€7,364 $864 us
10. london Oxford Street€6,838 $803 us
6. rome Via Condotti€8,000 $939 us
main streets across the world
2014/2015 I A Cushman & Wakefield Research Publication
Istiklal Street
Shop Street
la Croisette
Abdi Ipekci
(European side)
Stoleshnikov Nedre Slottsgate
Via Condotti
Tsimiski Shopping Centre
Bagdat Caddesi (Asian side)
14.3%
thes
salo
niki
13.8%
doha
14.3%
rome
15.4%
oslo
20.0%
mosC
ow
20.9%
istan
Bul
23.1%
Cann
es
24.4%
istan
Bul
25.0%ga
lway
27.3%
istan
Bul
Source: Cushman & Wakefield
22
emea luXury oVerViewRental growth in European luxury locations continued to outperform mass-market destinations, with an average rate of 2.7%.
The luxury retail market in central London, UK, went from strength to strength, with demand again far outstripping current availability. Record rental levels have been set in all of the luxury locations, and it is not uncommon for these transactions to also incorporate significant premium payments by the ingoing tenant to help secure vacant possession. Many retailers with established business in London are now keen to expand their representation by opening additional stores in the capital and/or increasing the size of their main flagship by taking space in upper level, which is more cost effective than moving location.
in France, new leases on Rue Saint-Honoré continued to highlight its success, while several notable openings on Avenue Montaigne and Rue du Faubourg Saint-Honoré were largely projects which had been launched in 2012 and 2013, with transfers, refurbishments and extensions of existing stores reflecting the determination of large groups to have larger flagships that anchor their visibility on a global scale. What is more, other Parisian thoroughfares such as Boulevard Saint-Germain and Rue de Sèvres, performed well. Although some retailers appear inclined to adopt a “wait-and-see” approach given the slowdown in luxury spending and the continuing rise in rental values, Paris will continue to occupy an important place in expansion strategies of major luxury groups. under the circumstances, and given the severely restricted supply available in the principal Parisian luxury markets, demand from prestigious retailers will spill over into submarkets near the most established
thoroughfares. It is unlikely that new luxury districts will emerge, with the exception of Le Marais, which enjoys high visitor numbers of both foreign tourists and affluent Parisian consumers, and benefits from extended opening hours on Sundays.
The retail market in Italy at the beginning of 2014 was generally characterised by optimism and good activity which, however, was later lessened by the subdued economic context, causing a number of operators to slow their expansion plans and wait for
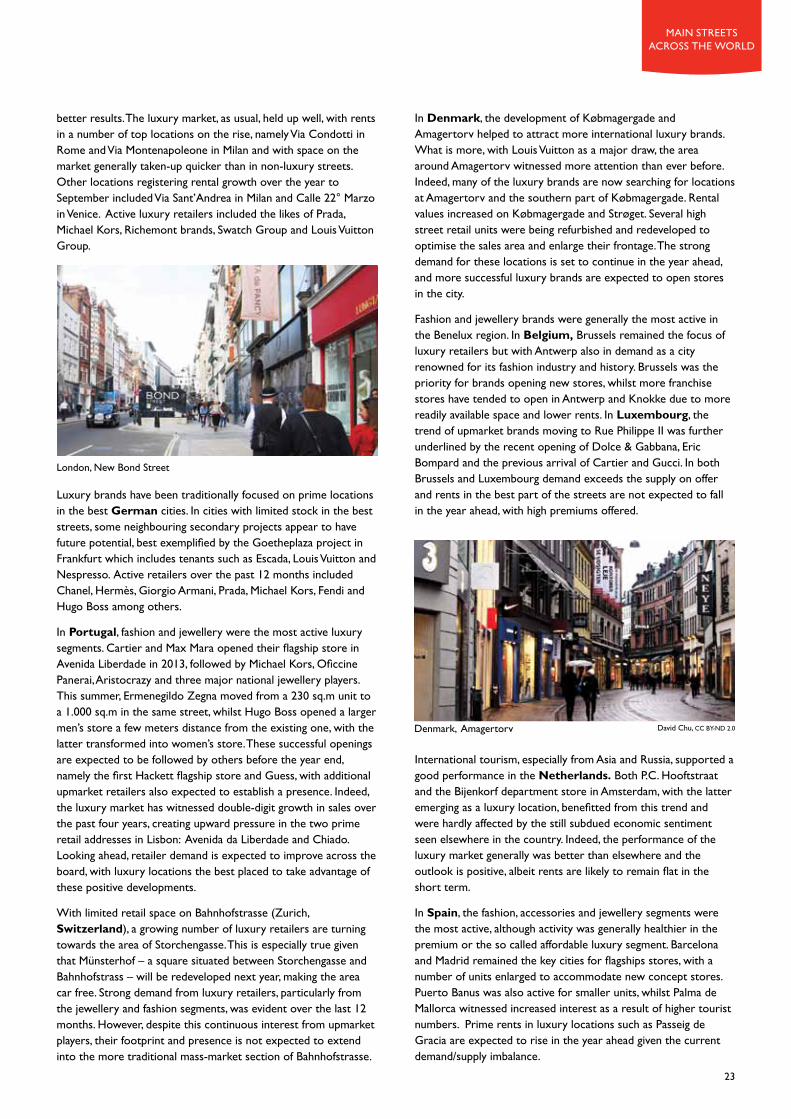
Rome, Via Condotti Alessio Nastro Siniscalchi, CC BY-ND 2.0
EMEA: Strongest Growth
main streets across the world
23
better results. The luxury market, as usual, held up well, with rents in a number of top locations on the rise, namely Via Condotti in Rome and Via Montenapoleone in Milan and with space on the market generally taken-up quicker than in non-luxury streets. Other locations registering rental growth over the year to September included Via Sant’Andrea in Milan and Calle 22° Marzo in Venice. Active luxury retailers included the likes of Prada, Michael Kors, Richemont brands, Swatch Group and Louis Vuitton Group.
Luxury brands have been traditionally focused on prime locations in the best German cities. In cities with limited stock in the best streets, some neighbouring secondary projects appear to have future potential, best exemplified by the Goetheplaza project in Frankfurt which includes tenants such as Escada, Louis Vuitton and Nespresso. Active retailers over the past 12 months included Chanel, Hermès, Giorgio Armani, Prada, Michael Kors, Fendi and Hugo Boss among others.
in Portugal, fashion and jewellery were the most active luxury segments. Cartier and Max Mara opened their flagship store in Avenida Liberdade in 2013, followed by Michael Kors, Oficcine Panerai, Aristocrazy and three major national jewellery players. This summer, Ermenegildo Zegna moved from a 230 sq.m unit to a 1.000 sq.m in the same street, whilst Hugo Boss opened a larger men’s store a few meters distance from the existing one, with the latter transformed into women’s store. These successful openings are expected to be followed by others before the year end, namely the first Hackett flagship store and Guess, with additional upmarket retailers also expected to establish a presence. Indeed, the luxury market has witnessed double-digit growth in sales over the past four years, creating upward pressure in the two prime retail addresses in Lisbon: Avenida da Liberdade and Chiado. Looking ahead, retailer demand is expected to improve across the board, with luxury locations the best placed to take advantage of these positive developments.
With limited retail space on Bahnhofstrasse (Zurich, Switzerland), a growing number of luxury retailers are turning towards the area of Storchengasse. This is especially true given that Münsterhof – a square situated between Storchengasse and Bahnhofstrass – will be redeveloped next year, making the area car free. Strong demand from luxury retailers, particularly from the jewellery and fashion segments, was evident over the last 12 months. However, despite this continuous interest from upmarket players, their footprint and presence is not expected to extend into the more traditional mass-market section of Bahnhofstrasse.
in Denmark, the development of Købmagergade and Amagertorv helped to attract more international luxury brands. What is more, with Louis Vuitton as a major draw, the area around Amagertorv witnessed more attention than ever before. Indeed, many of the luxury brands are now searching for locations at Amagertorv and the southern part of Købmagergade. Rental values increased on Købmagergade and Strøget. Several high street retail units were being refurbished and redeveloped to optimise the sales area and enlarge their frontage. The strong demand for these locations is set to continue in the year ahead, and more successful luxury brands are expected to open stores in the city.
Fashion and jewellery brands were generally the most active in the Benelux region. In Belgium, Brussels remained the focus of luxury retailers but with Antwerp also in demand as a city renowned for its fashion industry and history. Brussels was the priority for brands opening new stores, whilst more franchise stores have tended to open in Antwerp and Knokke due to more readily available space and lower rents. In Luxembourg, the trend of upmarket brands moving to Rue Philippe II was further underlined by the recent opening of Dolce & Gabbana, Eric Bompard and the previous arrival of Cartier and Gucci. In both Brussels and Luxembourg demand exceeds the supply on offer and rents in the best part of the streets are not expected to fall in the year ahead, with high premiums offered.
International tourism, especially from Asia and Russia, supported a good performance in the Netherlands. Both P.C. Hooftstraat and the Bijenkorf department store in Amsterdam, with the latter emerging as a luxury location, benefitted from this trend and were hardly affected by the still subdued economic sentiment seen elsewhere in the country. Indeed, the performance of the luxury market generally was better than elsewhere and the outlook is positive, albeit rents are likely to remain flat in the short term.
in Spain, the fashion, accessories and jewellery segments were the most active, although activity was generally healthier in the premium or the so called affordable luxury segment. Barcelona and Madrid remained the key cities for flagships stores, with a number of units enlarged to accommodate new concept stores. Puerto Banus was also active for smaller units, whilst Palma de Mallorca witnessed increased interest as a result of higher tourist numbers. Prime rents in luxury locations such as Passeig de Gracia are expected to rise in the year ahead given the current demand/supply imbalance.
Denmark, Amagertorv
London, New Bond Street
David Chu, CC BY-ND 2.0
2014/2015 I A Cushman & Wakefield Research Publication
24
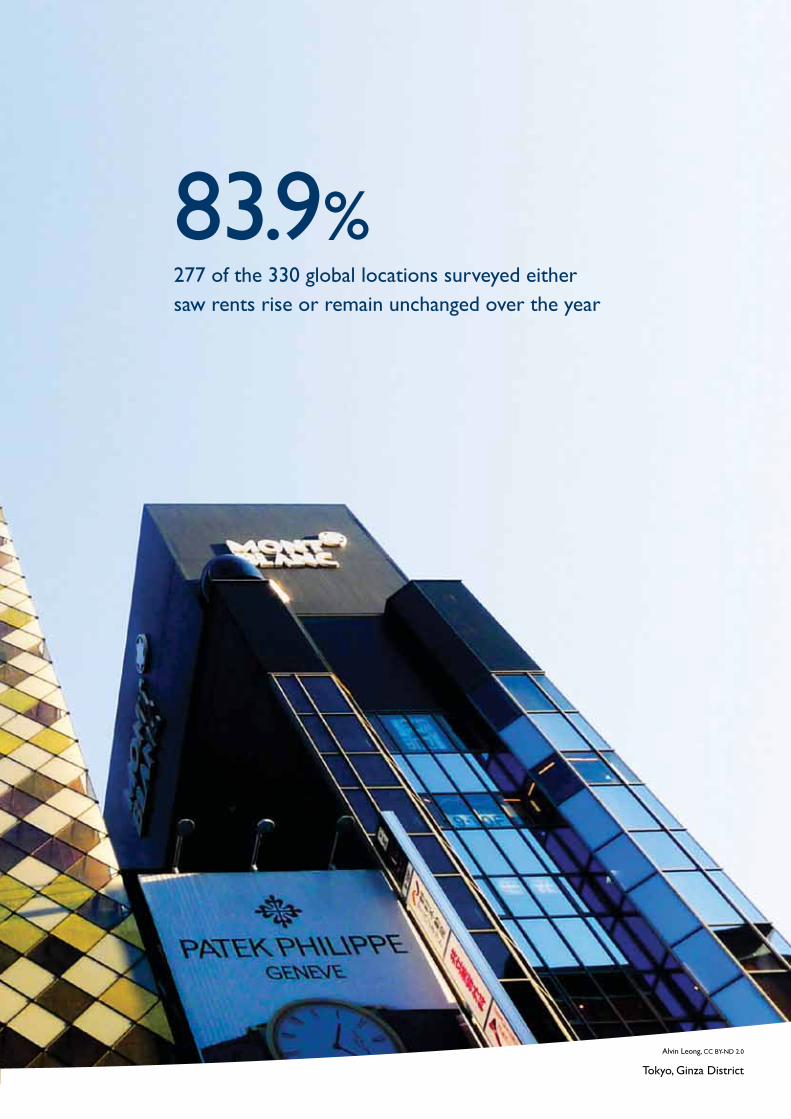
277 of the 330 global locations surveyed either saw rents rise or remain unchanged over the year
83.9%
Alvin Leong, CC BY-ND 2.0
Tokyo, Ginza District
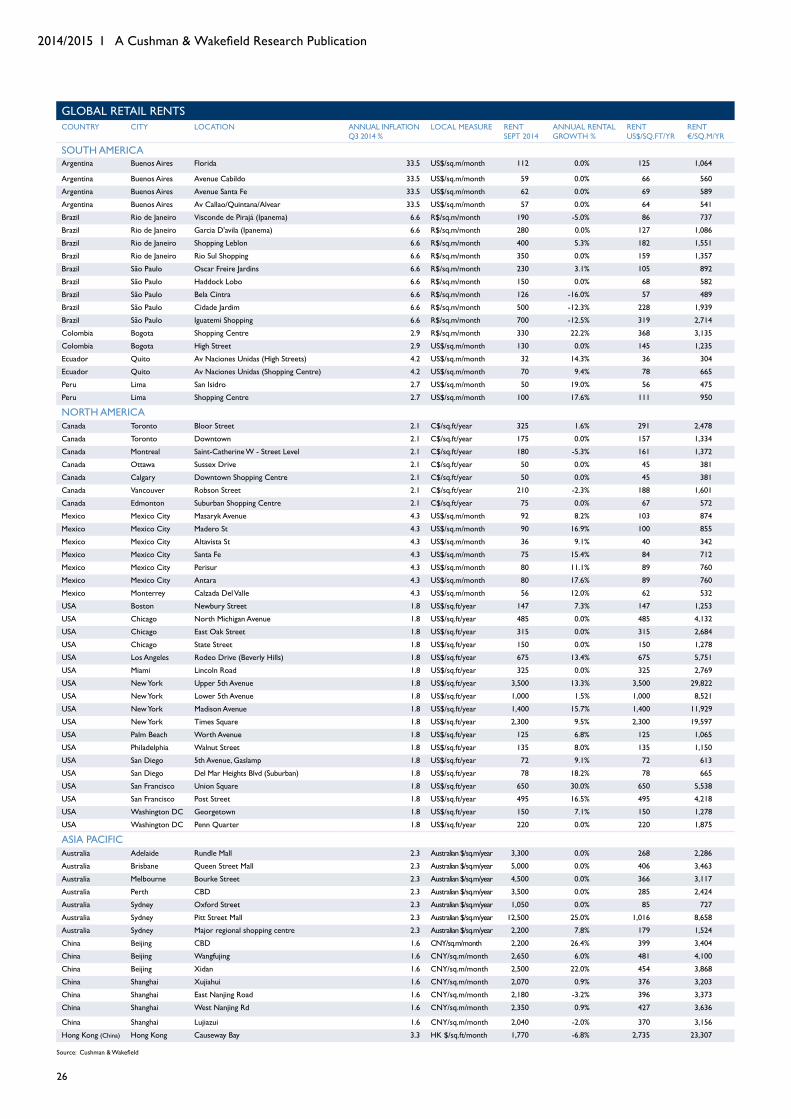
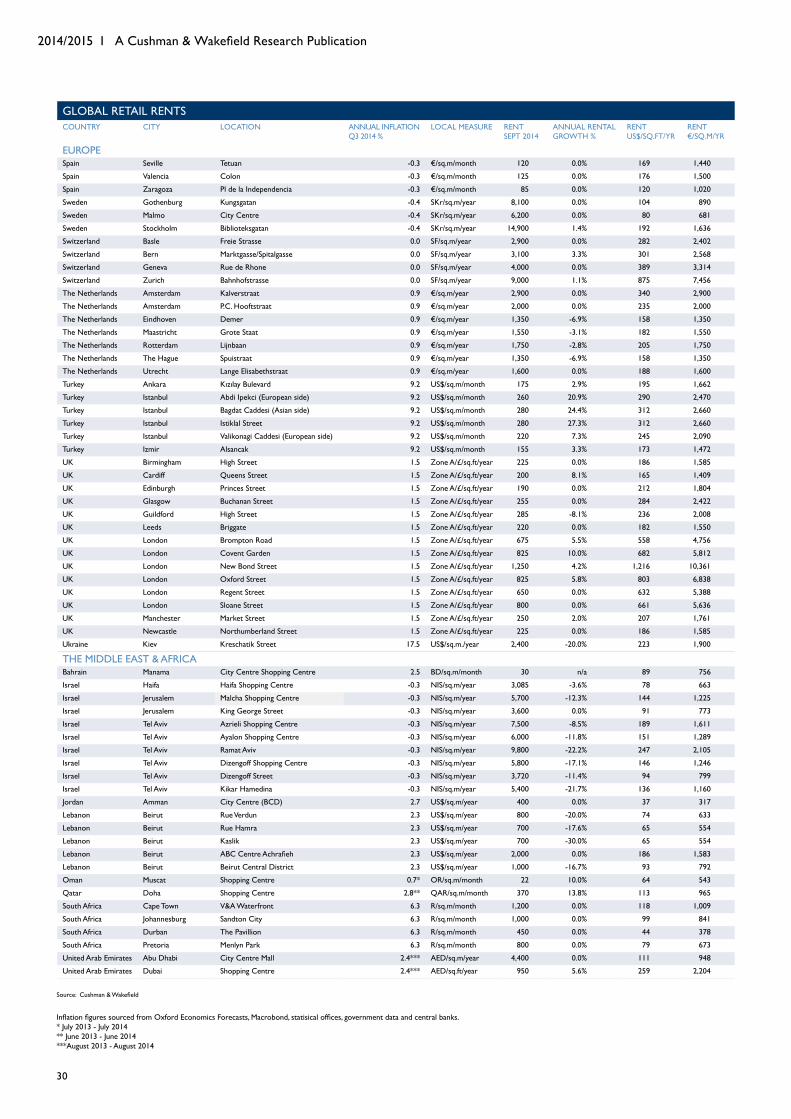
GloBal retail rentscountry city location annual inFlation
q3 2014 %local measure rent
SEPT 2014annual rental GROWTH %
rent uS$/Sq.FT/YR
rent €/Sq.M/YR
south americaArgentina Buenos Aires Florida 33.5 uS$/sq.m/month 112 0.0% 125 1,064
Argentina Buenos Aires Avenue Cabildo 33.5 uS$/sq.m/month 59 0.0% 66 560Argentina Buenos Aires Avenue Santa Fe 33.5 uS$/sq.m/month 62 0.0% 69 589Argentina Buenos Aires Av Callao/quintana/Alvear 33.5 uS$/sq.m/month 57 0.0% 64 541Brazil Rio de Janeiro Visconde de Pirajá (Ipanema) 6.6 R$/sq.m/month 190 -5.0% 86 737Brazil Rio de Janeiro Garcia D'avila (Ipanema) 6.6 R$/sq.m/month 280 0.0% 127 1,086Brazil Rio de Janeiro Shopping Leblon 6.6 R$/sq.m/month 400 5.3% 182 1,551Brazil Rio de Janeiro Rio Sul Shopping 6.6 R$/sq.m/month 350 0.0% 159 1,357Brazil São Paulo Oscar Freire Jardins 6.6 R$/sq.m/month 230 3.1% 105 892Brazil São Paulo Haddock Lobo 6.6 R$/sq.m/month 150 0.0% 68 582Brazil São Paulo Bela Cintra 6.6 R$/sq.m/month 126 -16.0% 57 489Brazil São Paulo Cidade Jardim 6.6 R$/sq.m/month 500 -12.3% 228 1,939Brazil São Paulo Iguatemi Shopping 6.6 R$/sq.m/month 700 -12.5% 319 2,714Colombia Bogota Shopping Centre 2.9 R$/sq.m/month 330 22.2% 368 3,135Colombia Bogota High Street 2.9 uS$/sq.m/month 130 0.0% 145 1,235Ecuador quito Av Naciones unidas (High Streets) 4.2 uS$/sq.m/month 32 14.3% 36 304Ecuador quito Av Naciones unidas (Shopping Centre) 4.2 uS$/sq.m/month 70 9.4% 78 665Peru Lima San Isidro 2.7 uS$/sq.m/month 50 19.0% 56 475Peru Lima Shopping Centre 2.7 uS$/sq.m/month 100 17.6% 111 950
north americaCanada Toronto Bloor Street 2.1 C$/sq.ft/year 325 1.6% 291 2,478Canada Toronto Downtown 2.1 C$/sq.ft/year 175 0.0% 157 1,334Canada Montreal Saint-Catherine W - Street Level 2.1 C$/sq.ft/year 180 -5.3% 161 1,372Canada Ottawa Sussex Drive 2.1 C$/sq.ft/year 50 0.0% 45 381Canada Calgary Downtown Shopping Centre 2.1 C$/sq.ft/year 50 0.0% 45 381Canada Vancouver Robson Street 2.1 C$/sq.ft/year 210 -2.3% 188 1,601Canada Edmonton Suburban Shopping Centre 2.1 C$/sq.ft/year 75 0.0% 67 572Mexico Mexico City Masaryk Avenue 4.3 uS$/sq.m/month 92 8.2% 103 874Mexico Mexico City Madero St 4.3 uS$/sq.m/month 90 16.9% 100 855Mexico Mexico City Altavista St 4.3 uS$/sq.m/month 36 9.1% 40 342Mexico Mexico City Santa Fe 4.3 uS$/sq.m/month 75 15.4% 84 712Mexico Mexico City Perisur 4.3 uS$/sq.m/month 80 11.1% 89 760Mexico Mexico City Antara 4.3 uS$/sq.m/month 80 17.6% 89 760Mexico Monterrey Calzada Del Valle 4.3 uS$/sq.m/month 56 12.0% 62 532usa Boston Newbury Street 1.8 uS$/sq.ft/year 147 7.3% 147 1,253usa Chicago North Michigan Avenue 1.8 uS$/sq.ft/year 485 0.0% 485 4,132usa Chicago East Oak Street 1.8 uS$/sq.ft/year 315 0.0% 315 2,684usa Chicago State Street 1.8 uS$/sq.ft/year 150 0.0% 150 1,278usa Los Angeles Rodeo Drive (Beverly Hills) 1.8 uS$/sq.ft/year 675 13.4% 675 5,751usa Miami Lincoln Road 1.8 uS$/sq.ft/year 325 0.0% 325 2,769usa New York upper 5th Avenue 1.8 uS$/sq.ft/year 3,500 13.3% 3,500 29,822usa New York Lower 5th Avenue 1.8 uS$/sq.ft/year 1,000 1.5% 1,000 8,521usa New York Madison Avenue 1.8 uS$/sq.ft/year 1,400 15.7% 1,400 11,929usa New York Times Square 1.8 uS$/sq.ft/year 2,300 9.5% 2,300 19,597usa Palm Beach Worth Avenue 1.8 uS$/sq.ft/year 125 6.8% 125 1,065usa Philadelphia Walnut Street 1.8 uS$/sq.ft/year 135 8.0% 135 1,150usa San Diego 5th Avenue, Gaslamp 1.8 uS$/sq.ft/year 72 9.1% 72 613usa San Diego Del Mar Heights Blvd (Suburban) 1.8 uS$/sq.ft/year 78 18.2% 78 665usa San Francisco union Square 1.8 uS$/sq.ft/year 650 30.0% 650 5,538usa San Francisco Post Street 1.8 uS$/sq.ft/year 495 16.5% 495 4,218usa Washington DC Georgetown 1.8 uS$/sq.ft/year 150 7.1% 150 1,278usa Washington DC Penn quarter 1.8 uS$/sq.ft/year 220 0.0% 220 1,875
ASIA PACIFICAustralia Adelaide Rundle Mall 2.3 Australian $/sq.m/year 3,300 0.0% 268 2,286Australia Brisbane queen Street Mall 2.3 Australian $/sq.m/year 5,000 0.0% 406 3,463Australia Melbourne Bourke Street 2.3 Australian $/sq.m/year 4,500 0.0% 366 3,117Australia Perth cBd 2.3 Australian $/sq.m/year 3,500 0.0% 285 2,424Australia Sydney Oxford Street 2.3 Australian $/sq.m/year 1,050 0.0% 85 727Australia Sydney Pitt Street Mall 2.3 Australian $/sq.m/year 12,500 25.0% 1,016 8,658Australia Sydney Major regional shopping centre 2.3 Australian $/sq.m/year 2,200 7.8% 179 1,524China Beijing cBd 1.6 CNY/sq.m/month 2,200 26.4% 399 3,404China Beijing Wangfujing 1.6 CNY/sq.m/month 2,650 6.0% 481 4,100China Beijing Xidan 1.6 CNY/sq.m/month 2,500 22.0% 454 3,868China Shanghai Xujiahui 1.6 CNY/sq.m/month 2,070 0.9% 376 3,203China Shanghai East Nanjing Road 1.6 CNY/sq.m/month 2,180 -3.2% 396 3,373China Shanghai West Nanjing Rd 1.6 CNY/sq.m/month 2,350 0.9% 427 3,636
China Shanghai Lujiazui 1.6 CNY/sq.m/month 2,040 -2.0% 370 3,156Hong Kong (China) Hong Kong Causeway Bay 3.3 HK $/sq.ft/month 1,770 -6.8% 2,735 23,307
2014/2015 I A Cushman & Wakefield Research Publication
Source: Cushman & Wakefield
26
27
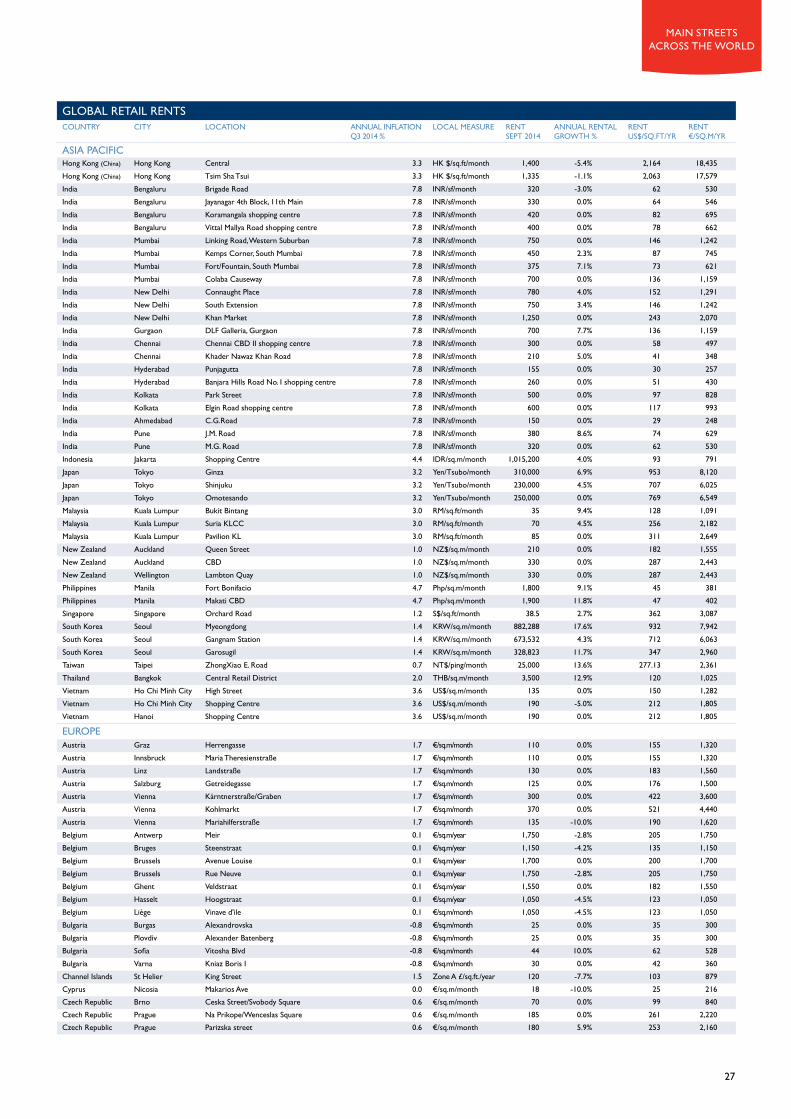
GloBal retail rentscountry city location annual inFlation
q3 2014 %local measure rent
SEPT 2014annual rental GROWTH %
rent uS$/Sq.FT/YR
rent €/Sq.M/YR
ASIA PACIFICHong Kong (China) Hong Kong Central 3.3 HK $/sq.ft/month 1,400 -5.4% 2,164 18,435Hong Kong (China) Hong Kong Tsim Sha Tsui 3.3 HK $/sq.ft/month 1,335 -1.1% 2,063 17,579India Bengaluru Brigade Road 7.8 INR/sf/month 320 -3.0% 62 530India Bengaluru Jayanagar 4th Block, 11th Main 7.8 INR/sf/month 330 0.0% 64 546India Bengaluru Koramangala shopping centre 7.8 INR/sf/month 420 0.0% 82 695India Bengaluru Vittal Mallya Road shopping centre 7.8 INR/sf/month 400 0.0% 78 662India Mumbai Linking Road, Western Suburban 7.8 INR/sf/month 750 0.0% 146 1,242India Mumbai Kemps Corner, South Mumbai 7.8 INR/sf/month 450 2.3% 87 745India Mumbai Fort/Fountain, South Mumbai 7.8 INR/sf/month 375 7.1% 73 621India Mumbai Colaba Causeway 7.8 INR/sf/month 700 0.0% 136 1,159India New Delhi Connaught Place 7.8 INR/sf/month 780 4.0% 152 1,291India New Delhi South Extension 7.8 INR/sf/month 750 3.4% 146 1,242India New Delhi Khan Market 7.8 INR/sf/month 1,250 0.0% 243 2,070India Gurgaon DLF Galleria, Gurgaon 7.8 INR/sf/month 700 7.7% 136 1,159India Chennai Chennai CBD II shopping centre 7.8 INR/sf/month 300 0.0% 58 497India Chennai Khader Nawaz Khan Road 7.8 INR/sf/month 210 5.0% 41 348India Hyderabad Punjagutta 7.8 INR/sf/month 155 0.0% 30 257India Hyderabad Banjara Hills Road No. 1 shopping centre 7.8 INR/sf/month 260 0.0% 51 430India Kolkata Park Street 7.8 INR/sf/month 500 0.0% 97 828India Kolkata Elgin Road shopping centre 7.8 INR/sf/month 600 0.0% 117 993India Ahmedabad C.G.Road 7.8 INR/sf/month 150 0.0% 29 248India Pune J.M. Road 7.8 INR/sf/month 380 8.6% 74 629India Pune M.G. Road 7.8 INR/sf/month 320 0.0% 62 530Indonesia Jakarta Shopping Centre 4.4 IDR/sq.m/month 1,015,200 4.0% 93 791Japan Tokyo Ginza 3.2 Yen/Tsubo/month 310,000 6.9% 953 8,120Japan Tokyo Shinjuku 3.2 Yen/Tsubo/month 230,000 4.5% 707 6,025Japan Tokyo Omotesando 3.2 Yen/Tsubo/month 250,000 0.0% 769 6,549Malaysia Kuala Lumpur Bukit Bintang 3.0 RM/sq.ft/month 35 9.4% 128 1,091Malaysia Kuala Lumpur Suria KLCC 3.0 RM/sq.ft/month 70 4.5% 256 2,182Malaysia Kuala Lumpur Pavilion KL 3.0 RM/sq.ft/month 85 0.0% 311 2,649New Zealand Auckland queen Street 1.0 NZ$/sq.m/month 210 0.0% 182 1,555New Zealand Auckland cBd 1.0 NZ$/sq.m/month 330 0.0% 287 2,443New Zealand Wellington Lambton quay 1.0 NZ$/sq.m/month 330 0.0% 287 2,443Philippines Manila Fort Bonifacio 4.7 Php/sq.m/month 1,800 9.1% 45 381Philippines Manila Makati CBD 4.7 Php/sq.m/month 1,900 11.8% 47 402Singapore Singapore Orchard Road 1.2 S$/sq.ft/month 38.5 2.7% 362 3,087South Korea Seoul Myeongdong 1.4 KRW/sq.m/month 882,288 17.6% 932 7,942South Korea Seoul Gangnam Station 1.4 KRW/sq.m/month 673,532 4.3% 712 6,063South Korea Seoul Garosugil 1.4 KRW/sq.m/month 328,823 11.7% 347 2,960Taiwan Taipei ZhongXiao E. Road 0.7 NT$/ping/month 25,000 13.6% 277.13 2,361Thailand Bangkok Central Retail District 2.0 THB/sq.m/month 3,500 12.9% 120 1,025Vietnam Ho Chi Minh City High Street 3.6 uS$/sq.m/month 135 0.0% 150 1,282Vietnam Ho Chi Minh City Shopping Centre 3.6 uS$/sq.m/month 190 -5.0% 212 1,805Vietnam Hanoi Shopping Centre 3.6 uS$/sq.m/month 190 0.0% 212 1,805
EuROPEAustria Graz Herrengasse 1.7 €/sq.m/month 110 0.0% 155 1,320Austria Innsbruck Maria Theresienstraße 1.7 €/sq.m/month 110 0.0% 155 1,320Austria Linz Landstraße 1.7 €/sq.m/month 130 0.0% 183 1,560Austria Salzburg Getreidegasse 1.7 €/sq.m/month 125 0.0% 176 1,500Austria Vienna Kärntnerstraße/Graben 1.7 €/sq.m/month 300 0.0% 422 3,600Austria Vienna Kohlmarkt 1.7 €/sq.m/month 370 0.0% 521 4,440Austria Vienna Mariahilferstraße 1.7 €/sq.m/month 135 -10.0% 190 1,620Belgium Antwerp Meir 0.1 €/sq.m/year 1,750 -2.8% 205 1,750Belgium Bruges Steenstraat 0.1 €/sq.m/year 1,150 -4.2% 135 1,150Belgium Brussels Avenue Louise 0.1 €/sq.m/year 1,700 0.0% 200 1,700Belgium Brussels Rue Neuve 0.1 €/sq.m/year 1,750 -2.8% 205 1,750Belgium Ghent Veldstraat 0.1 €/sq.m/year 1,550 0.0% 182 1,550Belgium Hasselt Hoogstraat 0.1 €/sq.m/year 1,050 -4.5% 123 1,050Belgium Liège Vinave d'ile 0.1 €/sq.m/month 1,050 -4.5% 123 1,050Bulgaria Burgas Alexandrovska -0.8 €/sq.m/month 25 0.0% 35 300Bulgaria Plovdiv Alexander Batenberg -0.8 €/sq.m/month 25 0.0% 35 300Bulgaria Sofia Vitosha Blvd -0.8 €/sq.m/month 44 10.0% 62 528Bulgaria Varna Kniaz Boris I -0.8 €/sq.m/month 30 0.0% 42 360Channel Islands St Helier King Street 1.5 Zone A £/sq.ft./year 120 -7.7% 103 879Cyprus Nicosia Makarios Ave 0.0 €/sq.m/month 18 -10.0% 25 216Czech Republic Brno Ceska Street/Svobody Square 0.6 €/sq.m/month 70 0.0% 99 840Czech Republic Prague Na Prikope/Wenceslas Square 0.6 €/sq.m/month 185 0.0% 261 2,220Czech Republic Prague Parizska street 0.6 €/sq.m/month 180 5.9% 253 2,160
main streets across the world
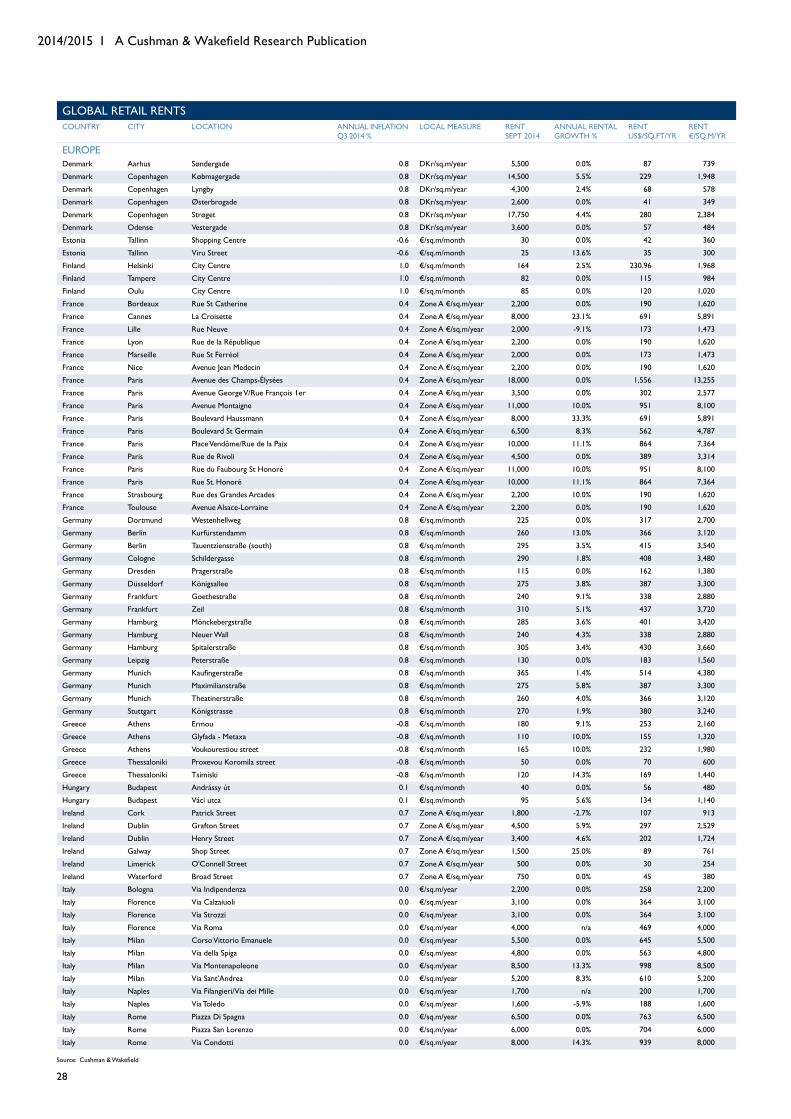
GloBal retail rentscountry city location annual inFlation
q3 2014 %local measure rent
SEPT 2014annual rental GROWTH %
rent uS$/Sq.FT/YR
rent €/Sq.M/YR
EuROPEDenmark Aarhus Søndergade 0.8 DKr/sq.m/year 5,500 0.0% 87 739Denmark Copenhagen Købmagergade 0.8 DKr/sq.m/year 14,500 5.5% 229 1,948Denmark Copenhagen Lyngby 0.8 DKr/sq.m/year 4,300 2.4% 68 578Denmark Copenhagen Østerbrogade 0.8 DKr/sq.m/year 2,600 0.0% 41 349Denmark Copenhagen Strøget 0.8 DKr/sq.m/year 17,750 4.4% 280 2,384Denmark Odense Vestergade 0.8 DKr/sq.m/year 3,600 0.0% 57 484Estonia Tallinn Shopping Centre -0.6 €/sq.m/month 30 0.0% 42 360Estonia Tallinn Viru Street -0.6 €/sq.m/month 25 13.6% 35 300Finland Helsinki City Centre 1.0 €/sq.m/month 164 2.5% 230.96 1,968Finland Tampere City Centre 1.0 €/sq.m/month 82 0.0% 115 984Finland Oulu City Centre 1.0 €/sq.m/month 85 0.0% 120 1,020France Bordeaux Rue St Catherine 0.4 Zone A €/sq.m/year 2,200 0.0% 190 1,620France cannes La Croisette 0.4 Zone A €/sq.m/year 8,000 23.1% 691 5,891France Lille Rue Neuve 0.4 Zone A €/sq.m/year 2,000 -9.1% 173 1,473France Lyon Rue de la République 0.4 Zone A €/sq.m/year 2,200 0.0% 190 1,620France Marseille Rue St Ferréol 0.4 Zone A €/sq.m/year 2,000 0.0% 173 1,473France Nice Avenue Jean Medecin 0.4 Zone A €/sq.m/year 2,200 0.0% 190 1,620France Paris Avenue des Champs-Élysées 0.4 Zone A €/sq.m/year 18,000 0.0% 1,556 13,255France Paris Avenue George V/Rue François 1er 0.4 Zone A €/sq.m/year 3,500 0.0% 302 2,577France Paris Avenue Montaigne 0.4 Zone A €/sq.m/year 11,000 10.0% 951 8,100France Paris Boulevard Haussmann 0.4 Zone A €/sq.m/year 8,000 33.3% 691 5,891France Paris Boulevard St Germain 0.4 Zone A €/sq.m/year 6,500 8.3% 562 4,787France Paris Place Vendôme/Rue de la Paix 0.4 Zone A €/sq.m/year 10,000 11.1% 864 7,364France Paris Rue de Rivoli 0.4 Zone A €/sq.m/year 4,500 0.0% 389 3,314France Paris Rue du Faubourg St Honoré 0.4 Zone A €/sq.m/year 11,000 10.0% 951 8,100France Paris Rue St. Honoré 0.4 Zone A €/sq.m/year 10,000 11.1% 864 7,364France Strasbourg Rue des Grandes Arcades 0.4 Zone A €/sq.m/year 2,200 10.0% 190 1,620France Toulouse Avenue Alsace-Lorraine 0.4 Zone A €/sq.m/year 2,200 0.0% 190 1,620Germany Dortmund Westenhellweg 0.8 €/sq.m/month 225 0.0% 317 2,700Germany Berlin Kurfürstendamm 0.8 €/sq.m/month 260 13.0% 366 3,120Germany Berlin Tauentzienstraße (south) 0.8 €/sq.m/month 295 3.5% 415 3,540Germany Cologne Schildergasse 0.8 €/sq.m/month 290 1.8% 408 3,480Germany Dresden Pragerstraße 0.8 €/sq.m/month 115 0.0% 162 1,380Germany Düsseldorf Königsallee 0.8 €/sq.m/month 275 3.8% 387 3,300Germany Frankfurt Goethestraße 0.8 €/sq.m/month 240 9.1% 338 2,880Germany Frankfurt Zeil 0.8 €/sq.m/month 310 5.1% 437 3,720Germany Hamburg Mönckebergstraße 0.8 €/sq.m/month 285 3.6% 401 3,420Germany Hamburg Neuer Wall 0.8 €/sq.m/month 240 4.3% 338 2,880Germany Hamburg Spitalerstraße 0.8 €/sq.m/month 305 3.4% 430 3,660Germany Leipzig Peterstraße 0.8 €/sq.m/month 130 0.0% 183 1,560Germany Munich Kaufingerstraße 0.8 €/sq.m/month 365 1.4% 514 4,380Germany Munich Maximilianstraße 0.8 €/sq.m/month 275 5.8% 387 3,300Germany Munich Theatinerstraße 0.8 €/sq.m/month 260 4.0% 366 3,120Germany Stuttgart Königstrasse 0.8 €/sq.m/month 270 1.9% 380 3,240Greece Athens Ermou -0.8 €/sq.m/month 180 9.1% 253 2,160Greece Athens Glyfada - Metaxa -0.8 €/sq.m/month 110 10.0% 155 1,320Greece Athens Voukourestiou street -0.8 €/sq.m/month 165 10.0% 232 1,980Greece Thessaloniki Proxevou Koromila street -0.8 €/sq.m/month 50 0.0% 70 600Greece Thessaloniki Tsimiski -0.8 €/sq.m/month 120 14.3% 169 1,440Hungary Budapest Andrássy út 0.1 €/sq.m/month 40 0.0% 56 480Hungary Budapest Váci utca 0.1 €/sq.m/month 95 5.6% 134 1,140Ireland Cork Patrick Street 0.7 Zone A €/sq.m/year 1,800 -2.7% 107 913Ireland Dublin Grafton Street 0.7 Zone A €/sq.m/year 4,500 5.9% 297 2,529Ireland Dublin Henry Street 0.7 Zone A €/sq.m/year 3,400 4.6% 202 1,724Ireland Galway Shop Street 0.7 Zone A €/sq.m/year 1,500 25.0% 89 761Ireland Limerick O'Connell Street 0.7 Zone A €/sq.m/year 500 0.0% 30 254Ireland Waterford Broad Street 0.7 Zone A €/sq.m/year 750 0.0% 45 380Italy Bologna Via Indipendenza 0.0 €/sq.m/year 2,200 0.0% 258 2,200Italy Florence Via Calzaiuoli 0.0 €/sq.m/year 3,100 0.0% 364 3,100Italy Florence Via Strozzi 0.0 €/sq.m/year 3,100 0.0% 364 3,100Italy Florence Via Roma 0.0 €/sq.m/year 4,000 n/a 469 4,000Italy Milan Corso Vittorio Emanuele 0.0 €/sq.m/year 5,500 0.0% 645 5,500Italy Milan Via della Spiga 0.0 €/sq.m/year 4,800 0.0% 563 4,800Italy Milan Via Montenapoleone 0.0 €/sq.m/year 8,500 13.3% 998 8,500Italy Milan Via Sant’Andrea 0.0 €/sq.m/year 5,200 8.3% 610 5,200Italy Naples Via Filangieri/Via dei Mille 0.0 €/sq.m/year 1,700 n/a 200 1,700Italy Naples Via Toledo 0.0 €/sq.m/year 1,600 -5.9% 188 1,600Italy Rome Piazza Di Spagna 0.0 €/sq.m/year 6,500 0.0% 763 6,500Italy Rome Piazza San Lorenzo 0.0 €/sq.m/year 6,000 0.0% 704 6,000Italy Rome Via Condotti 0.0 €/sq.m/year 8,000 14.3% 939 8,000
2014/2015 I A Cushman & Wakefield Research Publication2014/2015 I A Cushman & Wakefield Research Publication
Source: Cushman & Wakefield
28
29
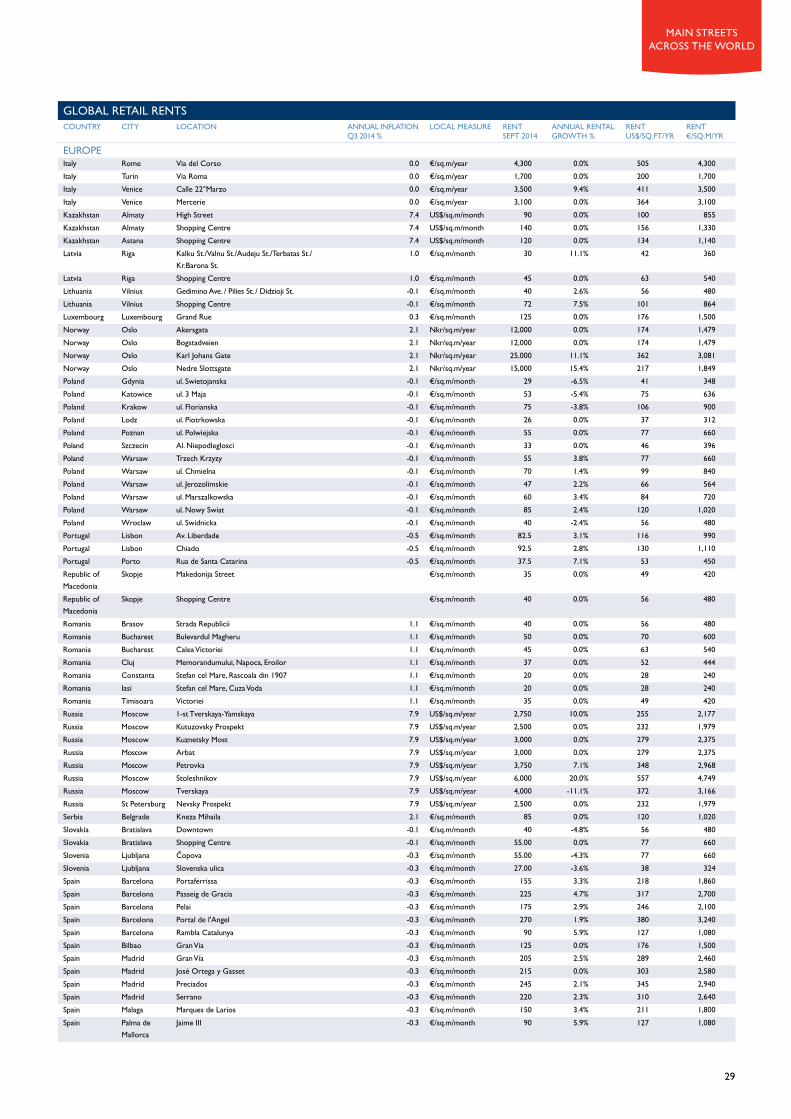
GloBal retail rentscountry city location annual inFlation
q3 2014 %local measure rent
SEPT 2014annual rental GROWTH %
rent uS$/Sq.FT/YR
rent €/Sq.M/YR
EuROPEItaly Rome Via del Corso 0.0 €/sq.m/year 4,300 0.0% 505 4,300Italy Turin Via Roma 0.0 €/sq.m/year 1,700 0.0% 200 1,700Italy Venice Calle 22°Marzo 0.0 €/sq.m/year 3,500 9.4% 411 3,500Italy Venice Mercerie 0.0 €/sq.m/year 3,100 0.0% 364 3,100Kazakhstan Almaty High Street 7.4 uS$/sq.m/month 90 0.0% 100 855Kazakhstan Almaty Shopping Centre 7.4 uS$/sq.m/month 140 0.0% 156 1,330Kazakhstan Astana Shopping Centre 7.4 uS$/sq.m/month 120 0.0% 134 1,140Latvia Riga Kalku St./Valnu St./Audeju St./Terbatas St./
Kr.Barona St.1.0 €/sq.m/month 30 11.1% 42 360
Latvia Riga Shopping Centre 1.0 €/sq.m/month 45 0.0% 63 540Lithuania Vilnius Gedimino Ave. / Pilies St. / Didzioji St. -0.1 €/sq.m/month 40 2.6% 56 480Lithuania Vilnius Shopping Centre -0.1 €/sq.m/month 72 7.5% 101 864Luxembourg Luxembourg Grand Rue 0.3 €/sq.m/month 125 0.0% 176 1,500Norway Oslo Akersgata 2.1 Nkr/sq.m/year 12,000 0.0% 174 1,479Norway Oslo Bogstadveien 2.1 Nkr/sq.m/year 12,000 0.0% 174 1,479Norway Oslo Karl Johans Gate 2.1 Nkr/sq.m/year 25,000 11.1% 362 3,081Norway Oslo Nedre Slottsgate 2.1 Nkr/sq.m/year 15,000 15.4% 217 1,849Poland Gdynia ul. Swietojanska -0.1 €/sq.m/month 29 -6.5% 41 348Poland Katowice ul. 3 Maja -0.1 €/sq.m/month 53 -5.4% 75 636Poland Krakow ul. Florianska -0.1 €/sq.m/month 75 -3.8% 106 900Poland Lodz ul. Piotrkowska -0.1 €/sq.m/month 26 0.0% 37 312Poland Poznan ul. Polwiejska -0.1 €/sq.m/month 55 0.0% 77 660Poland Szczecin Al. Niepodleglosci -0.1 €/sq.m/month 33 0.0% 46 396Poland Warsaw Trzech Krzyzy -0.1 €/sq.m/month 55 3.8% 77 660Poland Warsaw ul. Chmielna -0.1 €/sq.m/month 70 1.4% 99 840Poland Warsaw ul. Jerozolimskie -0.1 €/sq.m/month 47 2.2% 66 564Poland Warsaw ul. Marszalkowska -0.1 €/sq.m/month 60 3.4% 84 720Poland Warsaw ul. Nowy Swiat -0.1 €/sq.m/month 85 2.4% 120 1,020Poland Wroclaw ul. Swidnicka -0.1 €/sq.m/month 40 -2.4% 56 480Portugal Lisbon Av. Liberdade -0.5 €/sq.m/month 82.5 3.1% 116 990Portugal Lisbon Chiado -0.5 €/sq.m/month 92.5 2.8% 130 1,110Portugal Porto Rua de Santa Catarina -0.5 €/sq.m/month 37.5 7.1% 53 450Republic of Macedonia
Skopje Makedonija Street €/sq.m/month 35 0.0% 49 420
Republic of Macedonia
Skopje Shopping Centre €/sq.m/month 40 0.0% 56 480
Romania Brasov Strada Republicii 1.1 €/sq.m/month 40 0.0% 56 480Romania Bucharest Bulevardul Magheru 1.1 €/sq.m/month 50 0.0% 70 600Romania Bucharest Calea Victoriei 1.1 €/sq.m/month 45 0.0% 63 540Romania Cluj Memorandumului, Napoca, Eroilor 1.1 €/sq.m/month 37 0.0% 52 444Romania Constanta Stefan cel Mare, Rascoala din 1907 1.1 €/sq.m/month 20 0.0% 28 240Romania Iasi Stefan cel Mare, Cuza Voda 1.1 €/sq.m/month 20 0.0% 28 240Romania Timisoara Victoriei 1.1 €/sq.m/month 35 0.0% 49 420Russia Moscow 1-st Tverskaya-Yamskaya 7.9 uS$/sq.m/year 2,750 10.0% 255 2,177Russia Moscow Kutuzovsky Prospekt 7.9 uS$/sq.m/year 2,500 0.0% 232 1,979Russia Moscow Kuznetsky Most 7.9 uS$/sq.m/year 3,000 0.0% 279 2,375Russia Moscow Arbat 7.9 uS$/sq.m/year 3,000 0.0% 279 2,375Russia Moscow Petrovka 7.9 uS$/sq.m/year 3,750 7.1% 348 2,968Russia Moscow Stoleshnikov 7.9 uS$/sq.m/year 6,000 20.0% 557 4,749Russia Moscow Tverskaya 7.9 uS$/sq.m/year 4,000 -11.1% 372 3,166Russia St Petersburg Nevsky Prospekt 7.9 uS$/sq.m/year 2,500 0.0% 232 1,979Serbia Belgrade Kneza Mihaila 2.1 €/sq.m/month 85 0.0% 120 1,020Slovakia Bratislava Downtown -0.1 €/sq.m/month 40 -4.8% 56 480Slovakia Bratislava Shopping Centre -0.1 €/sq.m/month 55.00 0.0% 77 660Slovenia Ljubljana Čopova -0.3 €/sq.m/month 55.00 -4.3% 77 660Slovenia Ljubljana Slovenska ulica -0.3 €/sq.m/month 27.00 -3.6% 38 324Spain Barcelona Portaferrissa -0.3 €/sq.m/month 155 3.3% 218 1,860Spain Barcelona Passeig de Gracia -0.3 €/sq.m/month 225 4.7% 317 2,700Spain Barcelona Pelai -0.3 €/sq.m/month 175 2.9% 246 2,100Spain Barcelona Portal de l'Angel -0.3 €/sq.m/month 270 1.9% 380 3,240Spain Barcelona Rambla Catalunya -0.3 €/sq.m/month 90 5.9% 127 1,080Spain Bilbao Gran Via -0.3 €/sq.m/month 125 0.0% 176 1,500Spain Madrid Gran Vía -0.3 €/sq.m/month 205 2.5% 289 2,460Spain Madrid José Ortega y Gasset -0.3 €/sq.m/month 215 0.0% 303 2,580Spain Madrid Preciados -0.3 €/sq.m/month 245 2.1% 345 2,940Spain Madrid Serrano -0.3 €/sq.m/month 220 2.3% 310 2,640Spain Malaga Marques de Larios -0.3 €/sq.m/month 150 3.4% 211 1,800Spain Palma de
MallorcaJaime III -0.3 €/sq.m/month 90 5.9% 127 1,080
main streets across the world
GloBal retail rentscountry city location annual inFlation
q3 2014 %local measure rent
SEPT 2014annual rental GROWTH %
rent uS$/Sq.FT/YR
rent €/Sq.M/YR
EuROPESpain Seville Tetuan -0.3 €/sq.m/month 120 0.0% 169 1,440Spain Valencia Colon -0.3 €/sq.m/month 125 0.0% 176 1,500Spain Zaragoza Pl de la Independencia -0.3 €/sq.m/month 85 0.0% 120 1,020Sweden Gothenburg Kungsgatan -0.4 SKr/sq.m/year 8,100 0.0% 104 890Sweden Malmo City Centre -0.4 SKr/sq.m/year 6,200 0.0% 80 681Sweden Stockholm Biblioteksgatan -0.4 SKr/sq.m/year 14,900 1.4% 192 1,636Switzerland Basle Freie Strasse 0.0 SF/sq.m/year 2,900 0.0% 282 2,402Switzerland Bern Marktgasse/Spitalgasse 0.0 SF/sq.m/year 3,100 3.3% 301 2,568Switzerland Geneva Rue de Rhone 0.0 SF/sq.m/year 4,000 0.0% 389 3,314Switzerland Zurich Bahnhofstrasse 0.0 SF/sq.m/year 9,000 1.1% 875 7,456The Netherlands Amsterdam Kalverstraat 0.9 €/sq.m/year 2,900 0.0% 340 2,900The Netherlands Amsterdam P.C. Hooftstraat 0.9 €/sq.m/year 2,000 0.0% 235 2,000The Netherlands Eindhoven Demer 0.9 €/sq.m/year 1,350 -6.9% 158 1,350The Netherlands Maastricht Grote Staat 0.9 €/sq.m/year 1,550 -3.1% 182 1,550The Netherlands Rotterdam Lijnbaan 0.9 €/sq.m/year 1,750 -2.8% 205 1,750The Netherlands The Hague Spuistraat 0.9 €/sq.m/year 1,350 -6.9% 158 1,350The Netherlands utrecht Lange Elisabethstraat 0.9 €/sq.m/year 1,600 0.0% 188 1,600Turkey Ankara Kızılay Bulevard 9.2 uS$/sq.m/month 175 2.9% 195 1,662Turkey Istanbul Abdi Ipekci (European side) 9.2 uS$/sq.m/month 260 20.9% 290 2,470Turkey Istanbul Bagdat Caddesi (Asian side) 9.2 uS$/sq.m/month 280 24.4% 312 2,660Turkey Istanbul Istiklal Street 9.2 uS$/sq.m/month 280 27.3% 312 2,660Turkey Istanbul Valikonagi Caddesi (European side) 9.2 uS$/sq.m/month 220 7.3% 245 2,090Turkey Izmir Alsancak 9.2 uS$/sq.m/month 155 3.3% 173 1,472uk Birmingham High Street 1.5 Zone A/£/sq.ft/year 225 0.0% 186 1,585uk Cardiff queens Street 1.5 Zone A/£/sq.ft/year 200 8.1% 165 1,409uk Edinburgh Princes Street 1.5 Zone A/£/sq.ft/year 190 0.0% 212 1,804uk Glasgow Buchanan Street 1.5 Zone A/£/sq.ft/year 255 0.0% 284 2,422uk Guildford High Street 1.5 Zone A/£/sq.ft/year 285 -8.1% 236 2,008uk Leeds Briggate 1.5 Zone A/£/sq.ft/year 220 0.0% 182 1,550uk London Brompton Road 1.5 Zone A/£/sq.ft/year 675 5.5% 558 4,756uk London Covent Garden 1.5 Zone A/£/sq.ft/year 825 10.0% 682 5,812uk London New Bond Street 1.5 Zone A/£/sq.ft/year 1,250 4.2% 1,216 10,361uk London Oxford Street 1.5 Zone A/£/sq.ft/year 825 5.8% 803 6,838uk London Regent Street 1.5 Zone A/£/sq.ft/year 650 0.0% 632 5,388uk London Sloane Street 1.5 Zone A/£/sq.ft/year 800 0.0% 661 5,636uk Manchester Market Street 1.5 Zone A/£/sq.ft/year 250 2.0% 207 1,761uk Newcastle Northumberland Street 1.5 Zone A/£/sq.ft/year 225 0.0% 186 1,585ukraine Kiev Kreschatik Street 17.5 uS$/sq.m./year 2,400 -20.0% 223 1,900
the middle east & aFricaBahrain manama City Centre Shopping Centre 2.5 BD/sq.m/month 30 n/a 89 756Israel Haifa Haifa Shopping Centre -0.3 NIS/sq.m/year 3,085 -3.6% 78 663Israel Jerusalem Malcha Shopping Centre -0.3 NIS/sq.m/year 5,700 -12.3% 144 1,225Israel Jerusalem King George Street -0.3 NIS/sq.m/year 3,600 0.0% 91 773Israel Tel Aviv Azrieli Shopping Centre -0.3 NIS/sq.m/year 7,500 -8.5% 189 1,611Israel Tel Aviv Ayalon Shopping Centre -0.3 NIS/sq.m/year 6,000 -11.8% 151 1,289Israel Tel Aviv Ramat Aviv -0.3 NIS/sq.m/year 9,800 -22.2% 247 2,105Israel Tel Aviv Dizengoff Shopping Centre -0.3 NIS/sq.m/year 5,800 -17.1% 146 1,246Israel Tel Aviv Dizengoff Street -0.3 NIS/sq.m/year 3,720 -11.4% 94 799Israel Tel Aviv Kikar Hamedina -0.3 NIS/sq.m/year 5,400 -21.7% 136 1,160Jordan amman City Centre (BCD) 2.7 uS$/sq.m/year 400 0.0% 37 317Lebanon Beirut Rue Verdun 2.3 uS$/sq.m/year 800 -20.0% 74 633Lebanon Beirut Rue Hamra 2.3 uS$/sq.m/year 700 -17.6% 65 554Lebanon Beirut Kaslik 2.3 uS$/sq.m/year 700 -30.0% 65 554Lebanon Beirut ABC Centre Achrafieh 2.3 uS$/sq.m/year 2,000 0.0% 186 1,583Lebanon Beirut Beirut Central District 2.3 uS$/sq.m/year 1,000 -16.7% 93 792oman Muscat Shopping Centre 0.7* OR/sq.m/month 22 10.0% 64 543qatar Doha Shopping Centre 2.8** qAR/sq.m/month 370 13.8% 113 965South Africa Cape Town V&A Waterfront 6.3 R/sq.m/month 1,200 0.0% 118 1,009South Africa Johannesburg Sandton City 6.3 R/sq.m/month 1,000 0.0% 99 841South Africa Durban The Pavillion 6.3 R/sq.m/month 450 0.0% 44 378South Africa Pretoria Menlyn Park 6.3 R/sq.m/month 800 0.0% 79 673united Arab Emirates Abu Dhabi City Centre Mall 2.4*** AED/sq.m/year 4,400 0.0% 111 948united Arab Emirates Dubai Shopping Centre 2.4*** AED/sq.ft/year 950 5.6% 259 2,204
Inflation figures sourced from Oxford Economics Forecasts, Macrobond, statisical offices, government data and central banks.* July 2013 - July 2014** June 2013 - June 2014***August 2013 - August 2014
2014/2015 I A Cushman & Wakefield Research Publication
Source: Cushman & Wakefield
30
31
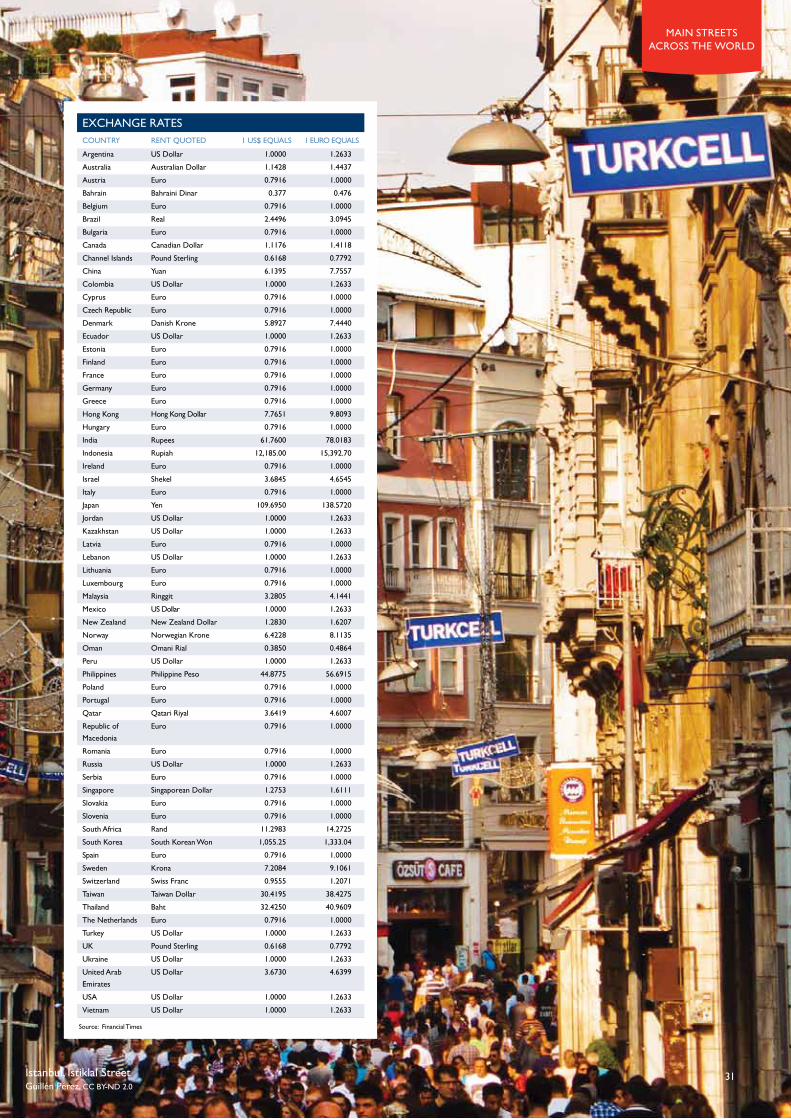
eXchanGe ratescountry rent Quoted 1 us$ eQuals 1 euro eQuals
Argentina uS Dollar 1.0000 1.2633Australia Australian Dollar 1.1428 1.4437Austria Euro 0.7916 1.0000Bahrain Bahraini Dinar 0.377 0.476Belgium Euro 0.7916 1.0000Brazil Real 2.4496 3.0945Bulgaria Euro 0.7916 1.0000Canada Canadian Dollar 1.1176 1.4118Channel Islands Pound Sterling 0.6168 0.7792China yuan 6.1395 7.7557Colombia uS Dollar 1.0000 1.2633Cyprus Euro 0.7916 1.0000Czech Republic Euro 0.7916 1.0000Denmark Danish Krone 5.8927 7.4440Ecuador uS Dollar 1.0000 1.2633Estonia Euro 0.7916 1.0000Finland Euro 0.7916 1.0000France Euro 0.7916 1.0000Germany Euro 0.7916 1.0000Greece Euro 0.7916 1.0000Hong Kong Hong Kong Dollar 7.7651 9.8093Hungary Euro 0.7916 1.0000India Rupees 61.7600 78.0183Indonesia Rupiah 12,185.00 15,392.70Ireland Euro 0.7916 1.0000Israel Shekel 3.6845 4.6545Italy Euro 0.7916 1.0000Japan yen 109.6950 138.5720Jordan uS Dollar 1.0000 1.2633Kazakhstan uS Dollar 1.0000 1.2633Latvia Euro 0.7916 1.0000Lebanon uS Dollar 1.0000 1.2633Lithuania Euro 0.7916 1.0000Luxembourg Euro 0.7916 1.0000Malaysia Ringgit 3.2805 4.1441Mexico uS Dollar 1.0000 1.2633New Zealand New Zealand Dollar 1.2830 1.6207Norway Norwegian Krone 6.4228 8.1135oman Omani Rial 0.3850 0.4864Peru uS Dollar 1.0000 1.2633Philippines Philippine Peso 44.8775 56.6915Poland Euro 0.7916 1.0000Portugal Euro 0.7916 1.0000qatar qatari Riyal 3.6419 4.6007Republic of Macedonia
Euro 0.7916 1.0000
Romania Euro 0.7916 1.0000Russia uS Dollar 1.0000 1.2633Serbia Euro 0.7916 1.0000Singapore Singaporean Dollar 1.2753 1.6111Slovakia Euro 0.7916 1.0000Slovenia Euro 0.7916 1.0000South Africa Rand 11.2983 14.2725South Korea South Korean Won 1,055.25 1,333.04 Spain Euro 0.7916 1.0000Sweden Krona 7.2084 9.1061Switzerland Swiss Franc 0.9555 1.2071Taiwan Taiwan Dollar 30.4195 38.4275Thailand Baht 32.4250 40.9609The Netherlands Euro 0.7916 1.0000Turkey uS Dollar 1.0000 1.2633uk Pound Sterling 0.6168 0.7792ukraine uS Dollar 1.0000 1.2633united Arab Emirates
uS Dollar 3.6730 4.6399
usa uS Dollar 1.0000 1.2633Vietnam uS Dollar 1.0000 1.2633
Source: Financial Times
main streets across the world
Guillén Pérez, CC BY-ND 2.0Istanbul, Istiklal Street
TECHNICAL SPECIFICATIONSThe information contained in this report has been collected as at September 2014, in a comprehensive survey of Cushman & Wakefield’s international offices. Our representation is designed to facilitate the rapid flow of information across borders and is supported by a comprehensive database of market information and regular liaison meetings. This allows for the exchange of local market knowledge and expertise and for the co-ordination of strategy for international investment and locational decision-making.
Data for retail rents relates to our professionals’ opinion of the rent obtainable on a standard unit and/or shopping centre in a prime pitch of 330 locations across 65 countries around the world. The report’s analysis of rental performance does not include some of the locations listed in the ‘Global Retail Rents’ section due to the lack of a historical annual series. Services charges such as building insurance, local taxes and costs of repair payable by the tenant are not included.
In the dynamic international retailing sector, local market characteristics, technological advancements and the evolution of new retail formats are just several of the forces that impact on the size and configuration of retail units. As a result, occupation costs vary from one country to another.
As far as possible, the objective is to provide a realistic comparison, but the exercise is constrained by a number of factors. These include differences in unit configuration, zoning practice and local lease structures such as lease length, the inclusion of rent reviews to open market value and the right to assign the lease.
For the purposes of this survey, the standard main street unit is defined, where possible, as a unit with 150-200 sq.m of sales area. We would expect a unit to have a typical frontage of 6-8 metres. However, an element of flexibility is needed with the size definition, given that unit configuration varies from market to market. Assumptions regarding ancillary space follow local practice.
A shopping centre is defined as a purpose-built retail facility which is planned, developed, owned and centrally-managed as a single property. It typically has a Gross Leasable Area of over 5,000 sq.m and is comprised of over ten retail units. However, an element of flexibility is needed with regards to size and minimum number of units, given that they vary from market to market.
The format selection for each city is based on its dominance of the retail landscape and/or its status as the prime pitch/top destination in the city. The rents represent our agents’ views as to what is consistently achievable for prime space – we do not quote asking rents or the highest rent obtainable. It is assumed that the unit is vacant and is available for letting on the open market, without any request for a premium (key money). However, in many top locations around the world, vacant units are rarely marketed and substantial key money to sitting tenants is often payable.
Rents in most countries are supplied in local currency and converted to uS$ for the purposes of international comparison. Accordingly, the ranking of the most expensive streets can be affected by currency movements from year to year. Rents in the uK, Channel Islands, France and Ireland are originally quoted in Zone A and are converted to an overall basis.
Further information and copies of this report are available from Erin Can
Telephone: +44 207 152 5206Email: [email protected]
Cushman & Wakefield (C&W) is known the world-over as an industry knowledge leader. Through the delivery of timely, accurate,high-quality research reports on the leading trends, markets around the world and business issues of the day, we aim to assist our clientsin making property decisions that meet their objectives and enhance their competitive position. A recognized leader in local and global real estate research, the firm publishes its market information and studies online at cushmanwakefield.com/research-and-insight
2014/2015 I A Cushman & Wakefield Research Publication
32

33
main streets across the world
contacts
GloBal retail serVicesOur specialist agents work together to deliver integrated and innovative solutions to each client, regardless of the size or scope of the assignment. We have real geographical coverage with an on the ground market presence and expert local knowledge.
Our teams have been created specifically to cater for the demands of international clients and cover geographic regions, shopping centres, out of town, leisure and restaurants, and lease advisory. Enhanced by our dedicated cross-border retail teams, we offer the widest range of services from any retail advisory company with true accountability and a clear understanding of our clients’ needs.
our research serVicesCushman & Wakefield Research provides a strategic advisory and supporting role to our clients. Consultancy projects are undertaken on a local and international basis, providing in-depth advice and analysis, detailed market appraisals and location and investment strategies. Typical projects include:
the americasMaria SicolaExecutive Managing Director The [email protected]+1 415 773 3542
ASIA PACIFICSigrid ZialcitaManaging Director Asia [email protected]+65 6232 0875
emeaMartin Mahmuti Senior Investment Analyst EMEA Capital Markets Investment [email protected] +44 20 7152 5963
the americasMatt WinnSenior Managing Director Global Retail COO and Head of Retail-AmericasTel: +(1) 404 853 [email protected]
ASIA PACIFICJames HawkeyManaging DirectorHead of Retail-APACTel: + (86) 21 8665 8877 [email protected]
GloBalJohn StrachanPartnerHead of Global RetailTel: +44 20 7152 [email protected]
emeaJustin TaylorPartnerHead of Retail-EMEATel: +(44) 20 7152 [email protected]
GloBal retail contacts
• reliable and comparable data and market intelligence
• site specific, location analysis, ranking and targeting for occupation or investment
• analysis of future development activity and existing supply/competition
• market research and demand analysis by retail/industry sector
• rental analysis, forecasts & investment and portfolio strategy

2014/2015 I A Cushman & Wakefield Research Publication
This report has been prepared solely for information purposes. It does not purport to be a complete description of the markets or developments contained in this material. The information on which this report is based has been obtained from sources we believe to be reliable, but we have not independently verified such information and we do not guarantee that the information is accurate or complete.
Cushman & Wakefield advises and represents clients on all aspects of property occupancy and investment. Founded in 1917, it has 250 offices in 60 countries, employing more than 16,000 professionals. It offers a complete range of services to its occupier and investor clients for all property types, including leasing, sales and acquisitions, equity, debt and structured finance, corporate finance and investment banking, appraisal, consulting, corporate services, and property, facilities, project and risk management.
A recognized leader in local and global real estate research, the firm publishes its market information and studies online at www.cushmanwakefield.com/research-and-insight
©2014 Cushman & Wakefield, Inc. All rights reserved.
Cushman & Wakefield, LLP43-45 Portman SquareLondon W1A 3BGwww.cushmanwakefield.com
34
Beboy, fotolia.com
Avenue des Champs-Élysées

cushmanwakefield.com