Embed Size (px)
Citation preview
Proceedings World Geothermal Congress 2015
Melbourne, Australia, 19-25 April 2015
1
Main Results of a Long-Term Monitoring of the Bouillante Geothermal Reservoir During Its
Exploitation
Hervé Traineau1, Eric Lasne
1 and Bernard Sanjuan
2
1CFG Services - 3 Av. Claude Guillemin – BP6429 – 45064 Orléans cedex2, France
2BRGM – 3, Av. Claude Guillemin – BP6009 – 45060 Orléans cedex2, France
Keywords: Bouillante, Guadeloupe, Caribbean, reservoir monitoring, geochemical monitoring, lumped parameter modeling,
pressure decline, reservoir volume, brine reinjection, amorphous silica saturation index.
ABSTRACT
The Bouillante geothermal field is developed around the Bouillante Bay along the western coast of Basse-Terre Island,
Guadeloupe, F.W.I. The total installed capacity of the geothermal power plant is now 15,5 MWe. The steam field includes two
producers (wells BO-5, BO-6), one injector (well BO-2) and two observation wells (wells BO-4, BO-7). Since 2002, a detailed
reservoir monitoring has been done and the main recorded parameters are: production flow rate, dynamic wellhead pressures and
static wellhead pressures, reservoir fluid geochemical monitoring. In addition, P and T profiles have been done several times.
The pressure drawdown within the reservoir was nul or minimal when a first 4,5 MW-unit was operating. When the second 11
MW-unit was put on line in 2005, a sharp pressure decline was observed and ranged up to 6 bars. It appears to be closely related to
the total mass of extracted fluid as shown by the modeling of pressure decline using a lumped parameter model. The best history
matching is obtained by considering an open, double-tank reservoir with a substantial natural recharge. By analogy, the nowadays
exploited reservoir sector is considered as a peripheral outflow zone (the Cocagne fault) connected to a main deep reservoir located
somewhere below the Bouillante Bay. Predictions of reservoir pressure decline in response to different production scenarios are
now available to optimize the power output. They are also useful to prevent boiling and the development of a steam cap in the
exploited reservoir area.
A geochemical monitoring is carried out regularly on HP separated water and steam phases. Between 2002 and 2013, the volume of
fluids extracted from the reservoir (without reinjection) is estimated to be in the range of 35 x 106 tons. No production-induced
chemical change has been observed in NCG content, chloride and other major elements contents. The temperature profiles show no
temperature decline through time. This suggests a large, deep reservoir with a rather uniform fluid chemical composition and
temperature conditions feeding the nowadays exploited reservoir sector.
Benefits of brine reinjection in reservoir pressure support and enhancing energy extraction have not been assessed yet. In order to
prevent silica scaling, the minimum reinjection temperature in well BO-2 has been set at 163°C corresponding to an ASSI Index of
0,9. This also reduces the risk of cold-front breakthrough and cooling of production wells which are rather close to the injection
well BO-2, due to local topographic and environmental constraints.
1. INTRODUCTION
The Bouillante geothermal field is developed around the Bouillante Bay along the western coast of Basse-Terre Island,
Guadeloupe, F.W.I. (Error! Reference source not found.). It has been first surveyed in the 1960-1970’s. Four vertical exploratory
wells (BO-1 to BO-4) have been drilled between 1970 and 1977 from 350 to 2400 m deep. They evidenced a 250°C sodium-
chloride reservoir suitable for electricity generation. A first small, double-flash turbine (4,5 MWe gross capacity) fed by well BO-2
has been built close to the well BO-2 (Figure 1) and operated by the French national electricity utility EDF between 1986-1992.
Then the company Géothermie Bouillante SA, a subsidiary of BRGM Group and EDF Group, bought this plant and is operating it
since 1996. In 1998, the poor producer well BO-4 has been successfully stimulated by cold sea water injection and its capacity
increased to about 2 MWe (Correia et al., 2000). In 2000-2001, three new directional production wells (1200 to 1400 m drilled
length) have been drilled close to the previous ones. Two of them (BO-5, BO-6) showed high permeability conditions and are good
producers. A second single-flash turbine (11 MWe gross capacity) has been built and commissioned in 2005. The total field
capacity is now 15,5 MWe. The steam field now includes two production wells (BO-5, BO-6), one injection well (BO-2) and two
observation wells (BO-4, BO-7). Reinjection of hot brine into the reservoir was first tested in 2010-2011 and is effective from early
2014. All of the seven deep wells drilled since 1970 are located within an area of less than 1 km2 (Figure 1).
Since 2002, a detailed monitoring of the Bouillante geothermal reservoir has been done by CFG Services (a geothermal consulting
company subsidiary of BRGM Group) which managed the overall operation and maintenance of the geothermal plant between
1996 and 2011 and is now in charge of the reservoir monitoring only. The main recorded parameters are:
- Production and reinjection flow rates;
- Dynamic wellhead pressures, static wellhead pressures and water levels in observation wells;
- Reservoir pressure drawdown and temperature change within the reservoir through regular P-T profiles;
- Separation Pressures conditions (HP and LP) and steam dryness;
- Reservoir fluid and surface hot spring geochemistry (in collaboration with BRGM);
- Scaling in production wells, separator and brine transport pipes, material corrosion.
Traineau et al.
2
These parameters have been stored in a data base which represents an invaluable tool for the knowledge of the reservoir, modeling
and forecasting its behavior over mid and long-term exploitation. This paper focuses on the analysis of the reservoir pressure
response in relation with the production rate and the results of the geochemical monitoring of reservoir fluid discharged by
production wells over ten years (2002-2013). Sanjuan et al. (2010) already presented results obtained on the monitoring of surface
hot springs.
2. THE BOUILLANTE GEOTHERMAL FIELD
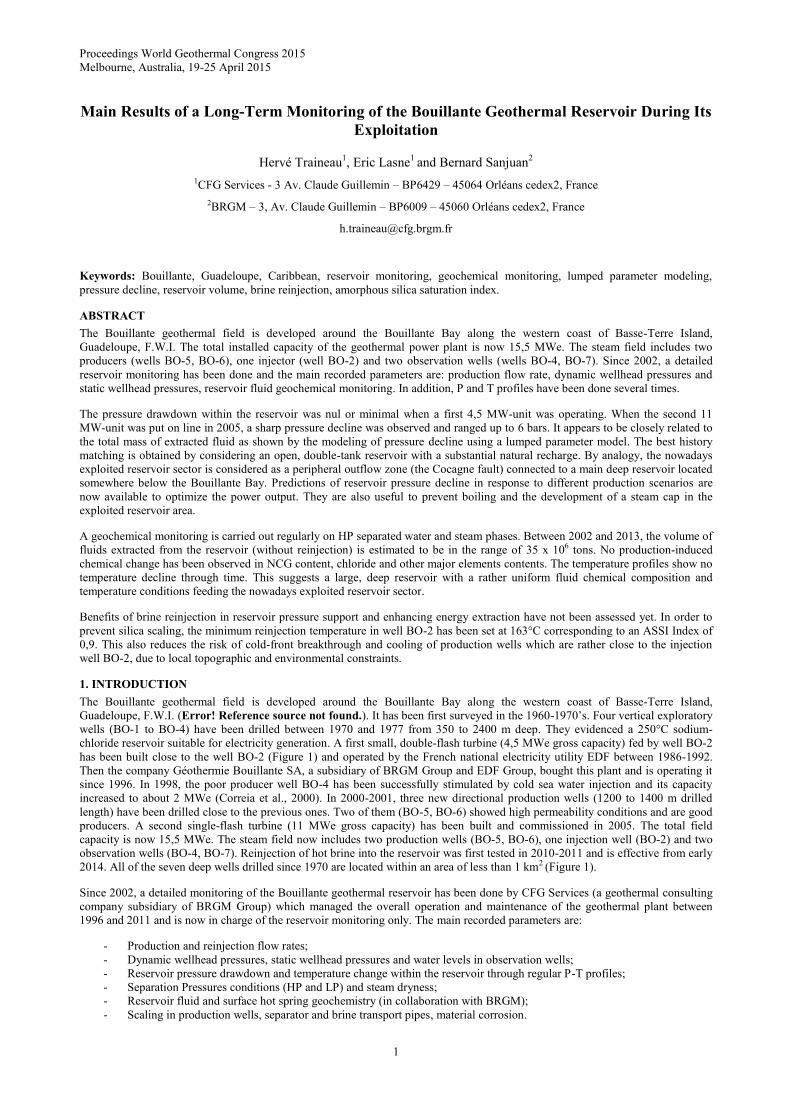
The geological and tectonic frameworks of the Bouillante geothermal field have been already described by Traineau et al. (1997)
and more recently by Bouchot et al. (2010). It is summarized on Figure 1. Around Bouillante, a recent volcanic activity has been
recognized related to the so-called “Bouillante Volcanic Chain” (Gadalia et al., 1988). Several eruptive centers have been dated
between 1,1 My and 0,5 My (Sanjuan et al., 2002). They delivered basic andesite to andesitic magmas as pyroclastic materials
mainly and a few lava flows. Bouillante is located at the intersection of two regional, active tectonic lineaments: (1) the Capesterre-
Bouillante regional fault trending WNW-ESE which crosses the island of Basse-Terre and (2) the sub-marine Montserrat-
Bouillante regional fault trending NNW-SSE (Bouysse et al., 1988). Several eruptive centers immediately north of Bouillante are
located within a WNW-ESE corridor which is considered as the western horsetail fault end of the regional Bouillante-Capesterre
normal fault (Bouchot et al., 2010; Figure 1). This combination of recent volcanic activity and tectonic activity is highly favorable
to the emplacement of shallow magmatic intrusions which would represent a heat source for the development of the geothermal
system.
Figure 1: Simplified map of the Bouillante geothermal field with the location of the wells (adapted from Bouchot et al.,
2010).
Surface manifestations are abundant and most of them are submarine and scattered at the bottom of the Bouillante Bay (Sanjuan et
al., 2002). On the ground, the main area of hydrothermal manifestations is observed along the coast in the southern part of the city
of Bouillante (“boiling”). There are hot springs, fumaroles, steaming grounds and a few mud pools along a W-E trend, more or less
in line with the trace of the Cocagne Fault which is the permeable, fractured reservoir zone intersected by the production wells. In
several places, temperature at shallow depth is close to 100°C. These surface manifestations are indicative of geothermal fluid
leakages along the fault from the reservoir which tops at 300 m depth only. The other main areas of surface manifestation are
observed in the northern part of the Bouillante Bay with submarine hot springs, gas emissions (CO2, CH4, He, Rn), hot sands
(Figure 1). Mineralized fractures in brecciated lavas outcropping at Pointe Marsolle point out the possible existence of a fault zone
trending WNW-ESE and controlling discharges of geothermal fluids. A 120°C hot spring has been measured in a circular-shape
area which could correspond to the site of a fossil hydrothermal explosion (Sanjuan et al., 2002). Pebbles of hydrothermalized
breccia are abundant along the shoreline. Its cement contains neoformed minerals such as adularia, silica, illite-smectite mixed-
layered clays, indicative of temperature in the range of 250°C or higher (Patrier et al., 2003). Adularia has been dated at 250±50 ky
by K/Ar method (Verati et al., 2014). This gives an insight in the age of the Bouillante hydrothermal system. Its initial stage could
be dated sometime between 250 ky and 500 ky, the latter age corresponding to the most recent volcanic activity recorded. Other
isolated hot springs are known 2 km south of Bouillante (Thomas) and 4 km northward (Pigeon island) outlining geothermal fluid
circulations at distance of the Bouillante Bay along the fault network.
Traineau et al.
3
All the information gathered during the survey of the Bouillante geothermal field point out a reservoir centered below the
Bouillante Bay. The Figure 1 shows the location and trajectory of existing wells. They appear to be sited at the southeast margin of
the reservoir. Wells BO-2, BO-5 and BO-6 intersect the Cocagne fault considered as an outflow zone connected to (and fed by) the
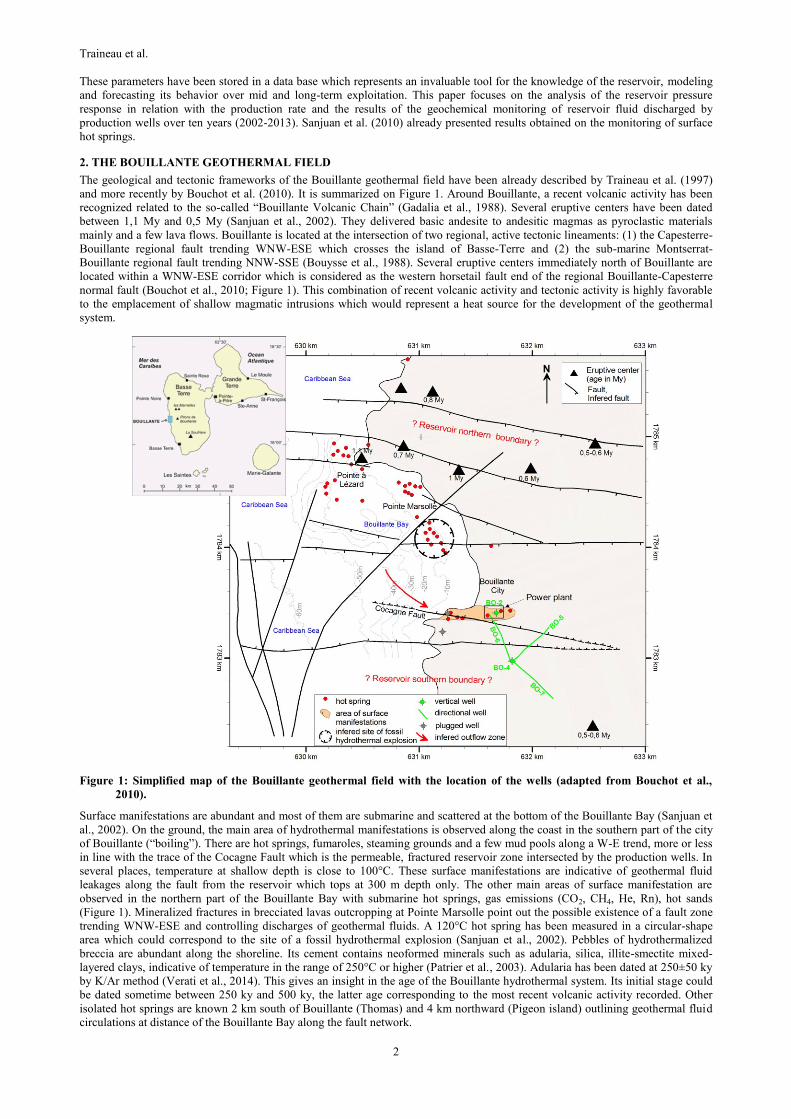
main reservoir. Wells BO-4 and BO-7 are in a peripheral location. Figure 2 shows the temperature profiles carried out in the
Bouillante wells in 2002. The maximum temperature (252°C) has been recorded in directional wells BO-5 and BO-6 which
intersect the Cocagne fault at an elevation between -700 masl and -800 masl (Figure 1). Vertical well BO-2 which is located very
close to the fault intersects the top of the reservoir at shallow level and exhibits high temperature conditions (245°C) at 330 m.a.s.l.
According to their peripheral location, wells BO-4 and BO-7 show slightly lower temperature conditions.
Figure 2: Temperature profiles in the Bouillante wells in 2002 (left) and static pressure profiles in well BO-2 between 1970
and 2010 (right).
3. PRODUCTION AND PRESSURE CHANGE HISTORY
Until 2014, there was no large fluid reinjection in the reservoir. Therefore the pressure change history described here is ascribed to
the discharge of fluid only. Production data and pressure data are given in Figure 3 on a monthly average basis. Production history
started in the 1970’s with the discharge testing of well BO-2. Initial pressure conditions in the reservoir were recorded during the
drilling of well BO-2 in 1970 (WHP: 16,5 bars-g; BHP at 335 m: 44,4 bars-g; Figure 2). From 1986 to 2002, well BO-2 was the
sole producer to supply the Unit 1 (4,5 MWe) with an average production rate of 30-40 kg/s. During this period, there was no
observation well to monitor the pressure response of the reservoir permanently. A pressure profile carried out in well BO-2 in 1993
showed a small drawdown (~ 2 bars) but some calibration errors could be also involved in the 1970 pressure values. The static
pressure profiles obtained in 1993, 1999 and 2002 are more or less identical (Figure 2) and measured BO-2 wellhead pressure was
14-14,5 bars-g (Sigurdsson, 2007). No or minimal drawdown (0,5 to 1 bar) is observed near well BO-2 during this period. It means
that the geothermal system received natural recharge similar to the BO-2 discharge flow rate (30-40 kg/s).
In July 2002, well BO-2 was closed and became the principal observation well to monitor the reservoir pressure drawdown on a
daily basis until 2013. On Figure 3, the reservoir pressure drawdown refers to the decline of BO-2 wellhead pressure with its initial
pressure set at 14,5 bars-g. Between July 2002 to mid-2004, either the newly drilled BO-5 well or BO-6 well supplied steam to Unit
1 with a production rate ranging from 10 to 40 kg/s. Reservoir pressure drawdown still remained minimal (0,5-1 bar). On Mid-
2004, testing of the new Unit 2 (11 MWe) induced a slight increase in the discharge flow rate. Its commissioning in January 2005
required a sharp increase in the discharge flow rate up to 150 kg/s. In the same time, a drop in the reservoir pressure of about 3 bars
was observed during the first year. The years after, the production flow rate varied between 120 to 170 kg/s. Steam was delivered
by wells BO-5, well BO-6 and well BO-4 which had been stimulated successfully in 1998. At the end of 2008, the pressure drop as
measured at the wellhead of the BO-2 observation well reached a maximum of 6 bars (Figure 3). The static pressure profile carried
out in well BO-2 in 2007 confirmed the pressure decline within the reservoir (Figure 2). Between 2009 and 2013, several periods of
plant shutdowns and overhaul maintenances have been recorded during several months. During these periods without fluid
discharge, the pressure recovery in the reservoir was rapid and significant as shown by Figure 3. The maximum recovery was
observed at the beginning of 2011 (+ 3 bars). The most recent pressure profile carried out in July 2010 well recorded the pressure
recovery (Figure 2).
Traineau et al.
4
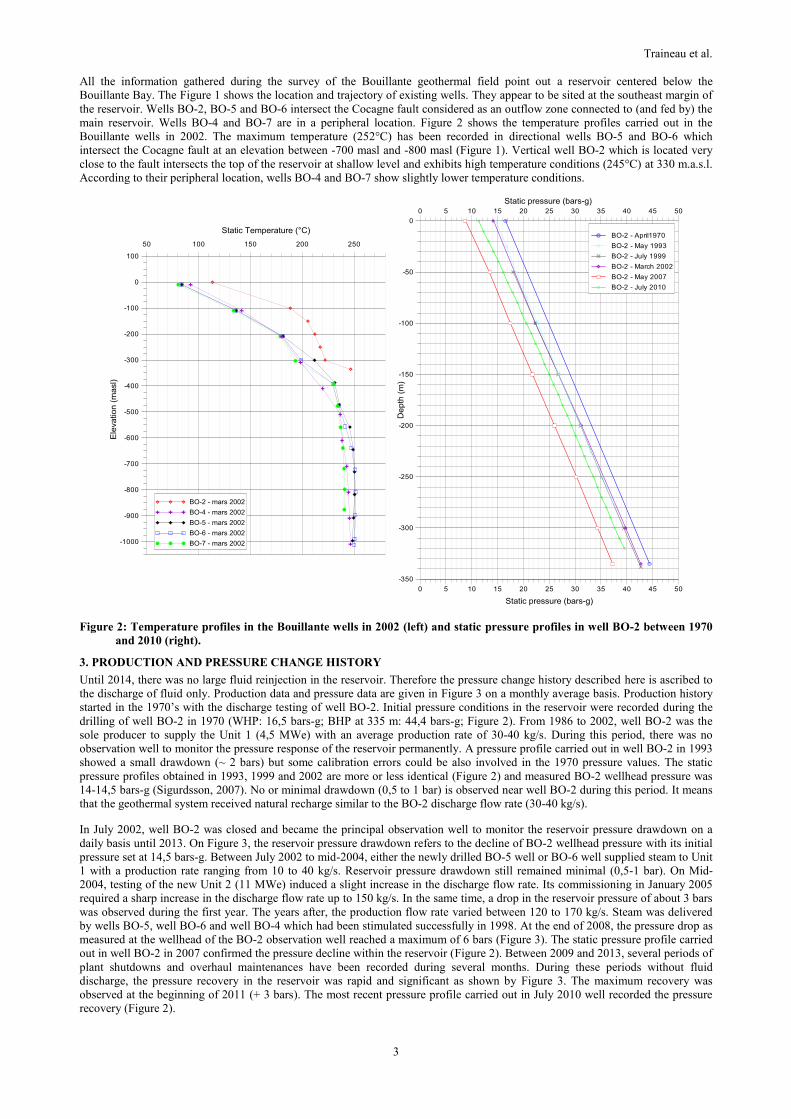
Figure 3: Production flow rate and observed reservoir pressure drawdown between July 2002 and 2013, with the simulated
pressure drawdown by using LUMPFIT (Axelsson, 1989). The table contains parameters of the best matching
lumped parameter model calculated by LUMPFIT and simulated reservoir volumes.
The reservoir pressure response has been simulated with the lumped parameter model LUMPFIT (Axelsson, 1989). This model is
independent of the reservoir geometry. The matching between reservoir response and production started mid 2002 because the
previous conditions are not well defined. The best matching was obtained by considering an open reservoir model with two tanks.
This model simulates the sharp pressure drop during 2005 and the pressure recovery episodes between 2009 and 2012 very
accurately (Figure 3). It supports the assumption that the geothermal system benefits from substantial natural recharge which is at
least equivalent to the 30-40 kg/s observed during the period 1993-2002 as stated by Sigurdsson (2007). There are analogies
between this two-tanks model and the characteristics of the Bouillante reservoir. The nowadays exploited reservoir sector can be
considered as an outflow zone along the Cocagne fault (Tank n°1) connected to a main deep central reservoir (Tank n°2) located
somewhere below the Bouillante Bay (Figure 1).
By using the calculated storage coefficients 1 and 2, the volumes of the tanks simulated by LUMPFIT can be estimated. Other
required parameters are water compressibility and rock compressibility at the reservoir conditions (250°C), porosity set at 10% and
fluid density at the reservoir conditions (see table inserted in Figure 3). Estimated reservoir volumes are 0,7 km3 for tank n°1 and
7,9 km3 for tank n°2. Although they are only indicative, these figures are rather consistent with the geology if we considered a
reservoir thickness of 1000 m (Figure 1). The main central reservoir mentioned above would be about 10 times larger than the
nowadays exploited reservoir sector.
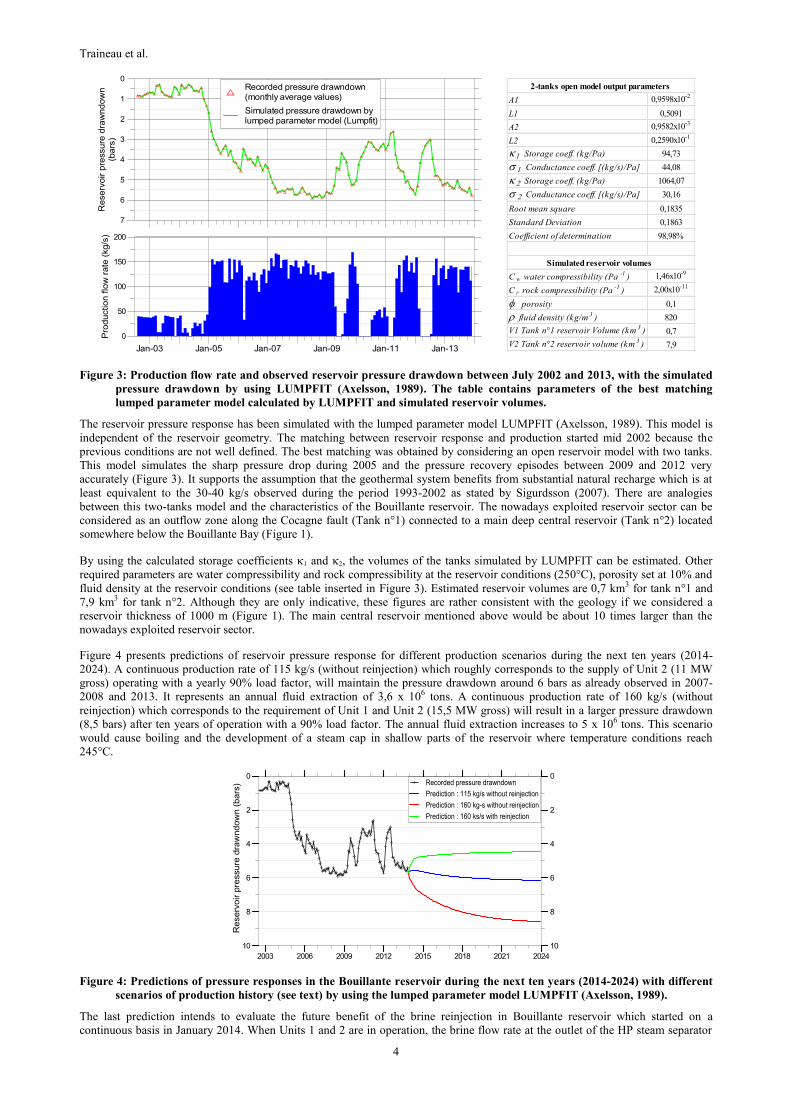
Figure 4 presents predictions of reservoir pressure response for different production scenarios during the next ten years (2014-
2024). A continuous production rate of 115 kg/s (without reinjection) which roughly corresponds to the supply of Unit 2 (11 MW
gross) operating with a yearly 90% load factor, will maintain the pressure drawdown around 6 bars as already observed in 2007-
2008 and 2013. It represents an annual fluid extraction of 3,6 x 10⁶ tons. A continuous production rate of 160 kg/s (without
reinjection) which corresponds to the requirement of Unit 1 and Unit 2 (15,5 MW gross) will result in a larger pressure drawdown
(8,5 bars) after ten years of operation with a 90% load factor. The annual fluid extraction increases to 5 x 10⁶ tons. This scenario
would cause boiling and the development of a steam cap in shallow parts of the reservoir where temperature conditions reach
245°C.
Figure 4: Predictions of pressure responses in the Bouillante reservoir during the next ten years (2014-2024) with different
scenarios of production history (see text) by using the lumped parameter model LUMPFIT (Axelsson, 1989).
The last prediction intends to evaluate the future benefit of the brine reinjection in Bouillante reservoir which started on a
continuous basis in January 2014. When Units 1 and 2 are in operation, the brine flow rate at the outlet of the HP steam separator
A1 0,9598x10⁻²
L1 0,5091
A2 0,9582x10⁻³
L2 0,2590x10⁻¹
Storage coeff. (kg/Pa) 94,73
Conductance coeff. [(kg/s)/Pa] 44,08
Storage coeff. (kg/Pa) 1064,07
Conductance coeff. [(kg/s)/Pa] 30,16
Root mean square 0,1835
Standard Deviation 0,1863
Coefficient of determination 98,98%
C w water compressibility (Pa-1
) 1,46x10⁻⁹
C r rock compressibility (Pa-1
) 2,00x10⁻¹¹
porosity 0,1
fluid density (kg/m3
) 820
V1 Tank n°1 reservoir Volume (km3
) 0,7
V2 Tank n°2 reservoir volume (km3
) 7,9
2-tanks open model output parameters
Simulated reservoir volumes

Traineau et al.
5
represents about 80% of the total discharge rate (160 kg/s), i.e. 128 kg/s. The low-pressure stage of Unit 1 requires 33 kg/s of HP
brine. Therefore the remaining HP brine flow rate available for reinjection is 95 kg/s. To be on the safe side, it is considered that
only 80% of the reinjected brine (76 kg/s) will provide a pressure support to the reservoir. Therefore the net production rate is
estimated to be 84 kg/s (160 kg/s – 76 kg/s) and the annual fluid extraction is theoretically reduced at 2,65 x 10⁶ tons. According to
the prediction shown on Figure 4, the reinjection of the available content of HP brine in the reservoir while operating the two Units
(160 kg/s production rate) will limit the pressure drawdown at less than 5 bars. As a benefit, the risk of boiling at the top of the
reservoir and its environmental adverse effects will be avoided. Such predictions of reservoir pressure decline in response to
different production scenarios by using lumped parameter modeling are very useful for the plant staff to manage the resource
exploitation.
4. GEOCHEMICAL MONITORING
Sanjuan et al. (2010) have already presented results of the geochemical monitoring carried out on reservoir fluids. Since 2010,
additional data have been obtained and this paper intends to update this monitoring. According to Traineau et al. (1997) and
Sanjuan et al. (2001), the Bouillante reservoir contains a Na-Cl type fluid with a TDS around 20 ±1 g/l. Table 1 provides
reconstructed chemical and isotopic compositions (after Sanjuan et al., 2010) considered as pre-exploitation characteristics of the
reservoir fluid because the fluid extraction during the exploitation of Unit 1 (4,5 MWe) before 2001 was relatively small (30-40
kg/s). Its silica and chloride contents are 500 ± 30 mg/l and 12 ± 0,6 mg/l respectively. Its 87Sr/86Sr ratio (0,70496) is similar to that
of andesitic rocks and supports water-rock interactions at high temperature (250°C). NCG content is measured at 0,4 wt%.
According to its chloride and bromium contents, the Bouillante geothermal fluid is a mixing between seawater (55-60%) and
meteoric water (40-45%). The location of the deep reservoir where mixing between seawater and meteoric water, and water-rock
interactions, take place is not well constrained but the distribution of surface hydrothermal manifestations points out a location
below the Bouillante Bay. It is important to mention that during the last 250 000 years and until 20 000 years ago, the sea level was
lower than nowadays and the Bouillante Bay which is less than 100 m deep (see Figure 1) was emerged for a long time (Figure 5).
This might explain a significant recharge of meteoric water into the reservoir during old times before it became sub-marine.
Table 1: Reconstructed chemical and isotopic compositions of the Bouillante reservoir fluid from separated water and
steam condensate collected after phase separation at 163°C (from Sanjuan et al., 2010).
Species Value Species Value
pH 5.3 ± 0.3 Sr (mg/l) 16.0 ± 2.0
TDS (g/l) 20.0 ± 1.0 Ba (mg/l) 6.5 ± 1.0
Cl (g/l) 12.0 ± 0.6 Mn (mg/l) 4.8 ± 1.0
Na (g/l) 5.1 ± 0.3 Li (mg/l) 4.0 ± 0.5
Ca (g/l) 1.85 ± 0.1 F (mg/l) 0.9 ± 0.1
K (mg/l) 750 ± 40 Rb (mg/l) 2.2 ± 0.3
HCO3 (mg/l) 50 ± 20 Cs (µg/l) 260 ± 30
Mg (mg/l) 1.6 ± 0.2 Al (µg/l) 60 ± 10
SO4 (mg/l) 16 ± 1 Fe (mg/l) 3.2 ± 1.0
SiO2 (mg/l) 500 ± 30 Cu (mg/l) 15.0 ± 1.0
H2S (mg/l) 34 ± 3 Ni (mg/l) 2.0 ± 0.5
Br (mg/l) 42 ± 5 Zn (µg/l) 650 ± 100
B (mg/l) 12.5 ± 1.3 As (µg/l) 350 ± 50
NH4 (mg/l) 1.7 ± 0.2 Cr (µg/l) 15.0 ± 2
NO3 (mg/l) <0.5 Co (µg/l) 13.0 ± 1.0
NO2 (mg/l) <0.01 Pb (µg/l) 4.0 ±1.0
PO4 (mg/l) <0.1 Be (µg/l) <0.1
δD (‰) -1.2 ± 0.8 87Sr/86Sr 0.70496± 0.00001
δ 18O (‰) -1.1 ± 0.2
Figure 5: Sea level variations in the Caribbean during the last 250 000 years (from Broecker and Van Donk, 1970).
Since 2002, periodic samplings have been carried out on the two-phase fluid flow at wellhead, on brine phase (separated water) and
steam phase at the outlet of the HP steam separator. The HP separation pressure is set at 6,6 ± 0,3 bars-a. The steam/water ratio for
the 250°C reservoir fluid having an enthalpy of 1086 kJ/kg is approximately 19-20%. Therefore, if compared to the reservoir fluid,
-140
-120
-100
-80
-60
-40
-20
0
-250 -200 -150 -100 -50 0
Se
a le
ve
l (m
)
Time (103 years)
Traineau et al.
6
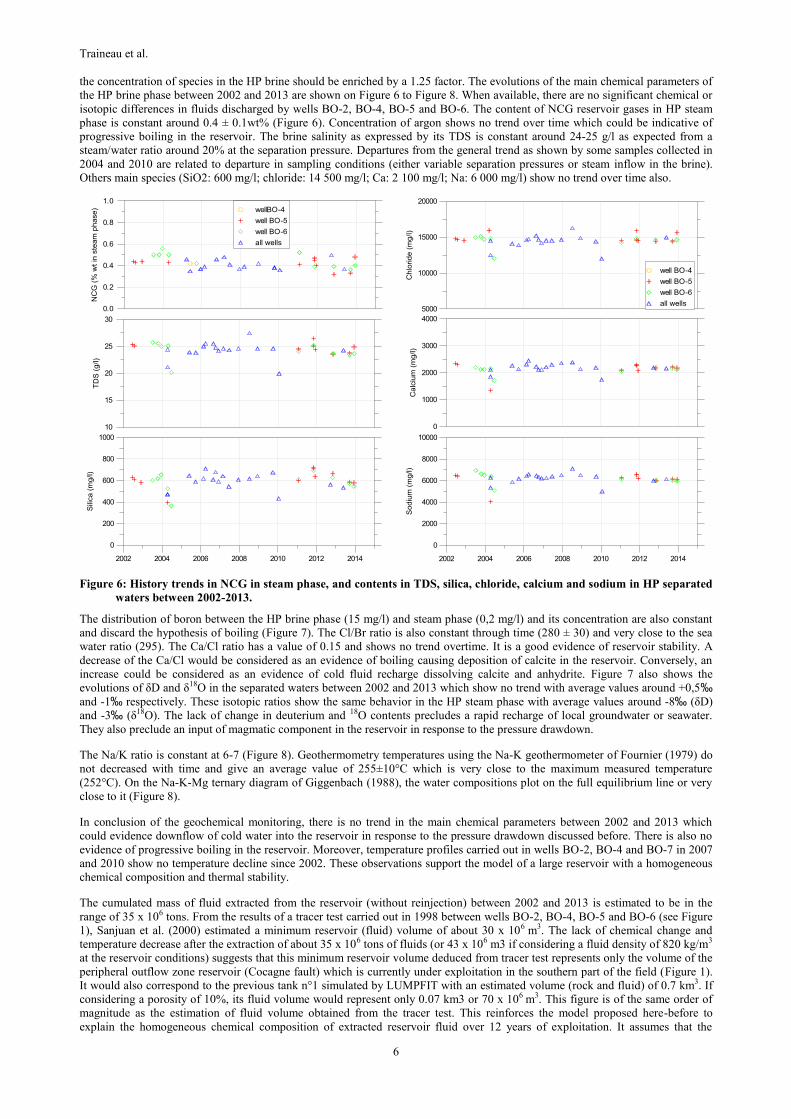
the concentration of species in the HP brine should be enriched by a 1.25 factor. The evolutions of the main chemical parameters of
the HP brine phase between 2002 and 2013 are shown on Figure 6 to Figure 8. When available, there are no significant chemical or
isotopic differences in fluids discharged by wells BO-2, BO-4, BO-5 and BO-6. The content of NCG reservoir gases in HP steam
phase is constant around 0.4 ± 0.1wt% (Figure 6). Concentration of argon shows no trend over time which could be indicative of
progressive boiling in the reservoir. The brine salinity as expressed by its TDS is constant around 24-25 g/l as expected from a
steam/water ratio around 20% at the separation pressure. Departures from the general trend as shown by some samples collected in
2004 and 2010 are related to departure in sampling conditions (either variable separation pressures or steam inflow in the brine).
Others main species (SiO2: 600 mg/l; chloride: 14 500 mg/l; Ca: 2 100 mg/l; Na: 6 000 mg/l) show no trend over time also.
Figure 6: History trends in NCG in steam phase, and contents in TDS, silica, chloride, calcium and sodium in HP separated
waters between 2002-2013.
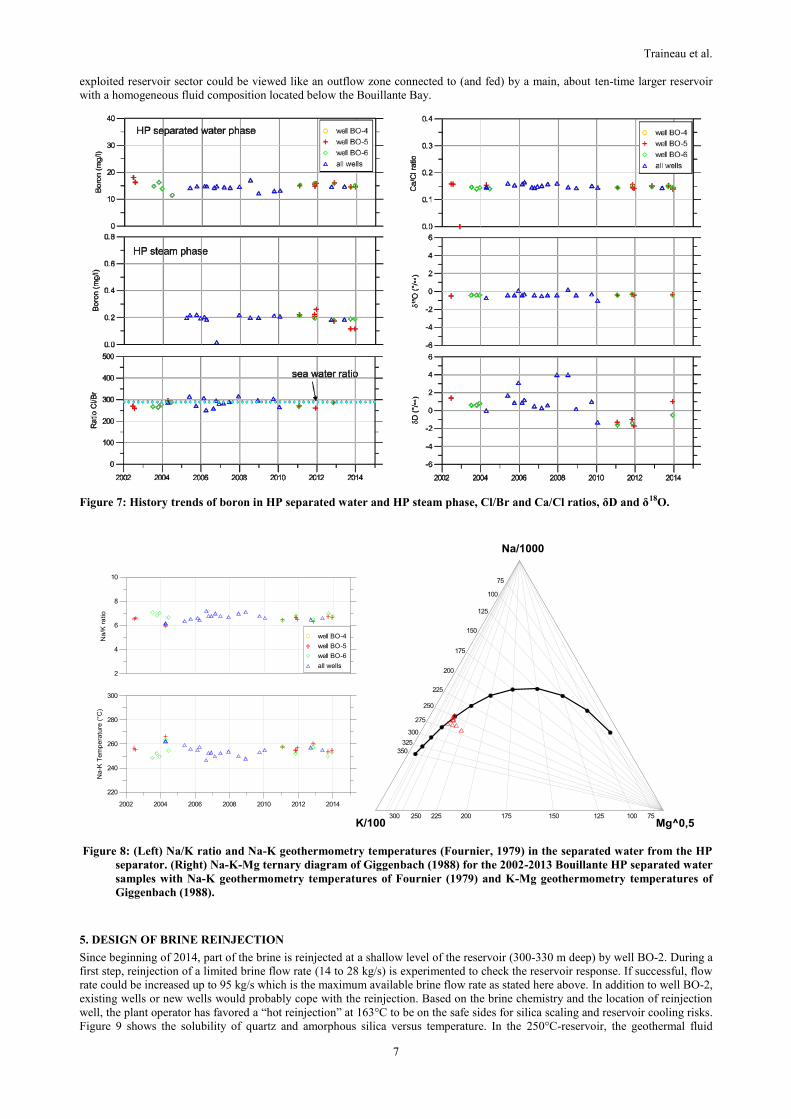
The distribution of boron between the HP brine phase (15 mg/l) and steam phase (0,2 mg/l) and its concentration are also constant
and discard the hypothesis of boiling (Figure 7). The Cl/Br ratio is also constant through time (280 ± 30) and very close to the sea
water ratio (295). The Ca/Cl ratio has a value of 0.15 and shows no trend overtime. It is a good evidence of reservoir stability. A
decrease of the Ca/Cl would be considered as an evidence of boiling causing deposition of calcite in the reservoir. Conversely, an
increase could be considered as an evidence of cold fluid recharge dissolving calcite and anhydrite. Figure 7 also shows the
evolutions of δD and δ18O in the separated waters between 2002 and 2013 which show no trend with average values around +0,5‰
and -1‰ respectively. These isotopic ratios show the same behavior in the HP steam phase with average values around -8‰ (δD)
and -3‰ (δ18O). The lack of change in deuterium and 18O contents precludes a rapid recharge of local groundwater or seawater.
They also preclude an input of magmatic component in the reservoir in response to the pressure drawdown.
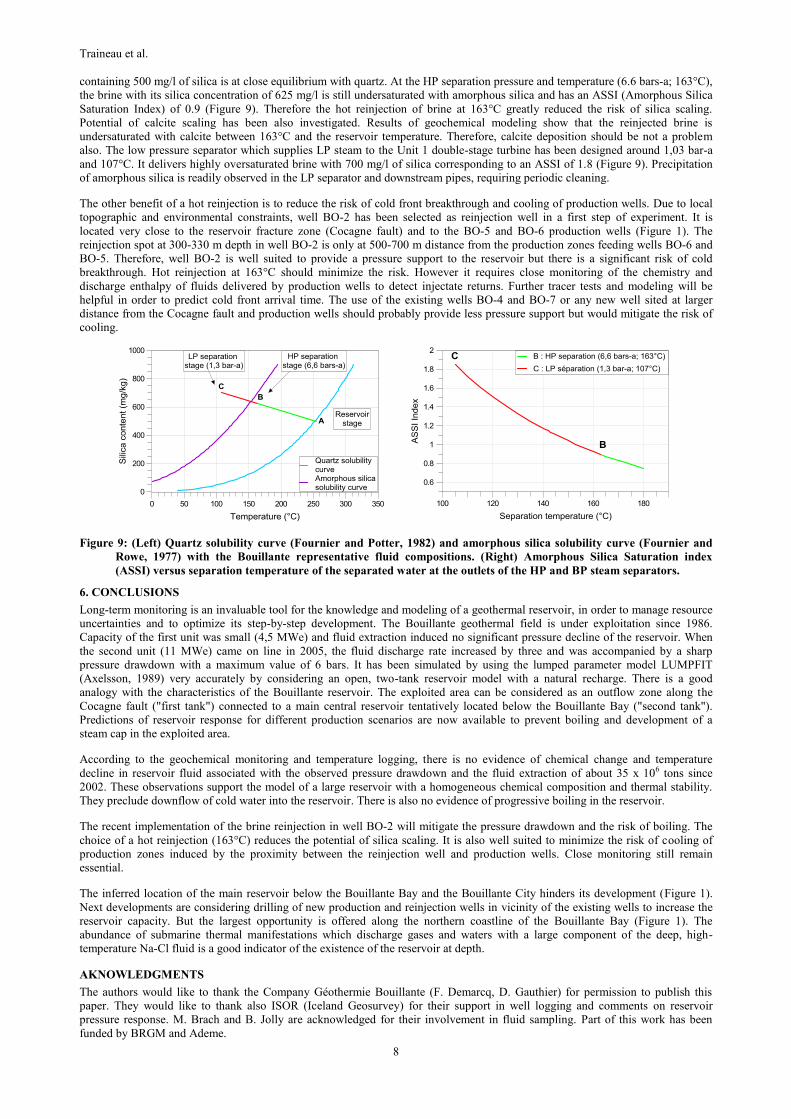
The Na/K ratio is constant at 6-7 (Figure 8). Geothermometry temperatures using the Na-K geothermometer of Fournier (1979) do
not decreased with time and give an average value of 255±10°C which is very close to the maximum measured temperature
(252°C). On the Na-K-Mg ternary diagram of Giggenbach (1988), the water compositions plot on the full equilibrium line or very
close to it (Figure 8).
In conclusion of the geochemical monitoring, there is no trend in the main chemical parameters between 2002 and 2013 which
could evidence downflow of cold water into the reservoir in response to the pressure drawdown discussed before. There is also no
evidence of progressive boiling in the reservoir. Moreover, temperature profiles carried out in wells BO-2, BO-4 and BO-7 in 2007
and 2010 show no temperature decline since 2002. These observations support the model of a large reservoir with a homogeneous
chemical composition and thermal stability.
The cumulated mass of fluid extracted from the reservoir (without reinjection) between 2002 and 2013 is estimated to be in the
range of 35 x 106 tons. From the results of a tracer test carried out in 1998 between wells BO-2, BO-4, BO-5 and BO-6 (see Figure
1), Sanjuan et al. (2000) estimated a minimum reservoir (fluid) volume of about 30 x 106 m3. The lack of chemical change and
temperature decrease after the extraction of about 35 x 106 tons of fluids (or 43 x 106 m3 if considering a fluid density of 820 kg/m3
at the reservoir conditions) suggests that this minimum reservoir volume deduced from tracer test represents only the volume of the
peripheral outflow zone reservoir (Cocagne fault) which is currently under exploitation in the southern part of the field (Figure 1).
It would also correspond to the previous tank n°1 simulated by LUMPFIT with an estimated volume (rock and fluid) of 0.7 km3. If
considering a porosity of 10%, its fluid volume would represent only 0.07 km3 or 70 x 106 m3. This figure is of the same order of
magnitude as the estimation of fluid volume obtained from the tracer test. This reinforces the model proposed here-before to
explain the homogeneous chemical composition of extracted reservoir fluid over 12 years of exploitation. It assumes that the
Traineau et al.
7
exploited reservoir sector could be viewed like an outflow zone connected to (and fed) by a main, about ten-time larger reservoir
with a homogeneous fluid composition located below the Bouillante Bay.
Figure 7: History trends of boron in HP separated water and HP steam phase, Cl/Br and Ca/Cl ratios, δD and δ18O.
Figure 8: (Left) Na/K ratio and Na-K geothermometry temperatures (Fournier, 1979) in the separated water from the HP
separator. (Right) Na-K-Mg ternary diagram of Giggenbach (1988) for the 2002-2013 Bouillante HP separated water
samples with Na-K geothermometry temperatures of Fournier (1979) and K-Mg geothermometry temperatures of
Giggenbach (1988).
5. DESIGN OF BRINE REINJECTION
Since beginning of 2014, part of the brine is reinjected at a shallow level of the reservoir (300-330 m deep) by well BO-2. During a
first step, reinjection of a limited brine flow rate (14 to 28 kg/s) is experimented to check the reservoir response. If successful, flow
rate could be increased up to 95 kg/s which is the maximum available brine flow rate as stated here above. In addition to well BO-2,
existing wells or new wells would probably cope with the reinjection. Based on the brine chemistry and the location of reinjection
well, the plant operator has favored a “hot reinjection” at 163°C to be on the safe sides for silica scaling and reservoir cooling risks.
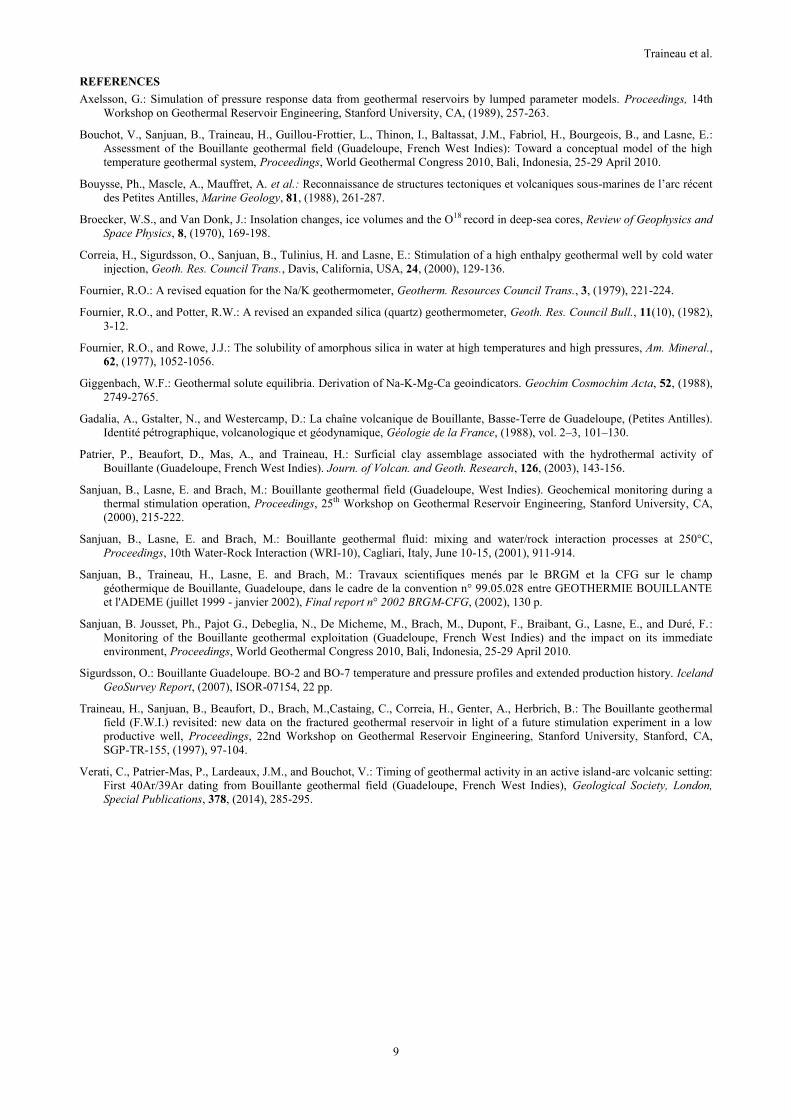
Figure 9 shows the solubility of quartz and amorphous silica versus temperature. In the 250°C-reservoir, the geothermal fluid
Traineau et al.
8
containing 500 mg/l of silica is at close equilibrium with quartz. At the HP separation pressure and temperature (6.6 bars-a; 163°C),
the brine with its silica concentration of 625 mg/l is still undersaturated with amorphous silica and has an ASSI (Amorphous Silica
Saturation Index) of 0.9 (Figure 9). Therefore the hot reinjection of brine at 163°C greatly reduced the risk of silica scaling.
Potential of calcite scaling has been also investigated. Results of geochemical modeling show that the reinjected brine is
undersaturated with calcite between 163°C and the reservoir temperature. Therefore, calcite deposition should be not a problem
also. The low pressure separator which supplies LP steam to the Unit 1 double-stage turbine has been designed around 1,03 bar-a
and 107°C. It delivers highly oversaturated brine with 700 mg/l of silica corresponding to an ASSI of 1.8 (Figure 9). Precipitation
of amorphous silica is readily observed in the LP separator and downstream pipes, requiring periodic cleaning.
The other benefit of a hot reinjection is to reduce the risk of cold front breakthrough and cooling of production wells. Due to local
topographic and environmental constraints, well BO-2 has been selected as reinjection well in a first step of experiment. It is
located very close to the reservoir fracture zone (Cocagne fault) and to the BO-5 and BO-6 production wells (Figure 1). The
reinjection spot at 300-330 m depth in well BO-2 is only at 500-700 m distance from the production zones feeding wells BO-6 and
BO-5. Therefore, well BO-2 is well suited to provide a pressure support to the reservoir but there is a significant risk of cold
breakthrough. Hot reinjection at 163°C should minimize the risk. However it requires close monitoring of the chemistry and
discharge enthalpy of fluids delivered by production wells to detect injectate returns. Further tracer tests and modeling will be
helpful in order to predict cold front arrival time. The use of the existing wells BO-4 and BO-7 or any new well sited at larger
distance from the Cocagne fault and production wells should probably provide less pressure support but would mitigate the risk of
cooling.
Figure 9: (Left) Quartz solubility curve (Fournier and Potter, 1982) and amorphous silica solubility curve (Fournier and
Rowe, 1977) with the Bouillante representative fluid compositions. (Right) Amorphous Silica Saturation index
(ASSI) versus separation temperature of the separated water at the outlets of the HP and BP steam separators.
6. CONCLUSIONS
Long-term monitoring is an invaluable tool for the knowledge and modeling of a geothermal reservoir, in order to manage resource
uncertainties and to optimize its step-by-step development. The Bouillante geothermal field is under exploitation since 1986.
Capacity of the first unit was small (4,5 MWe) and fluid extraction induced no significant pressure decline of the reservoir. When
the second unit (11 MWe) came on line in 2005, the fluid discharge rate increased by three and was accompanied by a sharp
pressure drawdown with a maximum value of 6 bars. It has been simulated by using the lumped parameter model LUMPFIT
(Axelsson, 1989) very accurately by considering an open, two-tank reservoir model with a natural recharge. There is a good
analogy with the characteristics of the Bouillante reservoir. The exploited area can be considered as an outflow zone along the
Cocagne fault ("first tank") connected to a main central reservoir tentatively located below the Bouillante Bay ("second tank").
Predictions of reservoir response for different production scenarios are now available to prevent boiling and development of a
steam cap in the exploited area.
According to the geochemical monitoring and temperature logging, there is no evidence of chemical change and temperature
decline in reservoir fluid associated with the observed pressure drawdown and the fluid extraction of about 35 x 106 tons since
2002. These observations support the model of a large reservoir with a homogeneous chemical composition and thermal stability.
They preclude downflow of cold water into the reservoir. There is also no evidence of progressive boiling in the reservoir.
The recent implementation of the brine reinjection in well BO-2 will mitigate the pressure drawdown and the risk of boiling. The
choice of a hot reinjection (163°C) reduces the potential of silica scaling. It is also well suited to minimize the risk of cooling of
production zones induced by the proximity between the reinjection well and production wells. Close monitoring still remain
essential.
The inferred location of the main reservoir below the Bouillante Bay and the Bouillante City hinders its development (Figure 1).
Next developments are considering drilling of new production and reinjection wells in vicinity of the existing wells to increase the
reservoir capacity. But the largest opportunity is offered along the northern coastline of the Bouillante Bay (Figure 1). The
abundance of submarine thermal manifestations which discharge gases and waters with a large component of the deep, high-
temperature Na-Cl fluid is a good indicator of the existence of the reservoir at depth.
AKNOWLEDGMENTS
The authors would like to thank the Company Géothermie Bouillante (F. Demarcq, D. Gauthier) for permission to publish this
paper. They would like to thank also ISOR (Iceland Geosurvey) for their support in well logging and comments on reservoir
pressure response. M. Brach and B. Jolly are acknowledged for their involvement in fluid sampling. Part of this work has been
funded by BRGM and Ademe.
Traineau et al.
9
REFERENCES
Axelsson, G.: Simulation of pressure response data from geothermal reservoirs by lumped parameter models. Proceedings, 14th
Workshop on Geothermal Reservoir Engineering, Stanford University, CA, (1989), 257-263.
Bouchot, V., Sanjuan, B., Traineau, H., Guillou-Frottier, L., Thinon, I., Baltassat, J.M., Fabriol, H., Bourgeois, B., and Lasne, E.:
Assessment of the Bouillante geothermal field (Guadeloupe, French West Indies): Toward a conceptual model of the high
temperature geothermal system, Proceedings, World Geothermal Congress 2010, Bali, Indonesia, 25-29 April 2010.
Bouysse, Ph., Mascle, A., Mauffret, A. et al.: Reconnaissance de structures tectoniques et volcaniques sous-marines de l’arc récent
des Petites Antilles, Marine Geology, 81, (1988), 261-287.
Broecker, W.S., and Van Donk, J.: Insolation changes, ice volumes and the O18 record in deep-sea cores, Review of Geophysics and
Space Physics, 8, (1970), 169-198.
Correia, H., Sigurdsson, O., Sanjuan, B., Tulinius, H. and Lasne, E.: Stimulation of a high enthalpy geothermal well by cold water
injection, Geoth. Res. Council Trans., Davis, California, USA, 24, (2000), 129-136.
Fournier, R.O.: A revised equation for the Na/K geothermometer, Geotherm. Resources Council Trans., 3, (1979), 221-224.
Fournier, R.O., and Potter, R.W.: A revised an expanded silica (quartz) geothermometer, Geoth. Res. Council Bull., 11(10), (1982),
3-12.
Fournier, R.O., and Rowe, J.J.: The solubility of amorphous silica in water at high temperatures and high pressures, Am. Mineral.,
62, (1977), 1052-1056.
Giggenbach, W.F.: Geothermal solute equilibria. Derivation of Na-K-Mg-Ca geoindicators. Geochim Cosmochim Acta, 52, (1988),
2749-2765.
Gadalia, A., Gstalter, N., and Westercamp, D.: La chaîne volcanique de Bouillante, Basse-Terre de Guadeloupe, (Petites Antilles).
Identité pétrographique, volcanologique et géodynamique, Géologie de la France, (1988), vol. 2–3, 101–130.
Patrier, P., Beaufort, D., Mas, A., and Traineau, H.: Surficial clay assemblage associated with the hydrothermal activity of
Bouillante (Guadeloupe, French West Indies). Journ. of Volcan. and Geoth. Research, 126, (2003), 143-156.
Sanjuan, B., Lasne, E. and Brach, M.: Bouillante geothermal field (Guadeloupe, West Indies). Geochemical monitoring during a
thermal stimulation operation, Proceedings, 25th Workshop on Geothermal Reservoir Engineering, Stanford University, CA,
(2000), 215-222.
Sanjuan, B., Lasne, E. and Brach, M.: Bouillante geothermal fluid: mixing and water/rock interaction processes at 250°C,
Proceedings, 10th Water-Rock Interaction (WRI-10), Cagliari, Italy, June 10-15, (2001), 911-914.
Sanjuan, B., Traineau, H., Lasne, E. and Brach, M.: Travaux scientifiques menés par le BRGM et la CFG sur le champ
géothermique de Bouillante, Guadeloupe, dans le cadre de la convention n° 99.05.028 entre GEOTHERMIE BOUILLANTE
et l'ADEME (juillet 1999 - janvier 2002), Final report n° 2002 BRGM-CFG, (2002), 130 p.
Sanjuan, B. Jousset, Ph., Pajot G., Debeglia, N., De Micheme, M., Brach, M., Dupont, F., Braibant, G., Lasne, E., and Duré, F.:
Monitoring of the Bouillante geothermal exploitation (Guadeloupe, French West Indies) and the impact on its immediate
environment, Proceedings, World Geothermal Congress 2010, Bali, Indonesia, 25-29 April 2010.
Sigurdsson, O.: Bouillante Guadeloupe. BO-2 and BO-7 temperature and pressure profiles and extended production history. Iceland
GeoSurvey Report, (2007), ISOR-07154, 22 pp.
Traineau, H., Sanjuan, B., Beaufort, D., Brach, M.,Castaing, C., Correia, H., Genter, A., Herbrich, B.: The Bouillante geothermal
field (F.W.I.) revisited: new data on the fractured geothermal reservoir in light of a future stimulation experiment in a low
productive well, Proceedings, 22nd Workshop on Geothermal Reservoir Engineering, Stanford University, Stanford, CA,
SGP-TR-155, (1997), 97-104.
Verati, C., Patrier-Mas, P., Lardeaux, J.M., and Bouchot, V.: Timing of geothermal activity in an active island-arc volcanic setting:
First 40Ar/39Ar dating from Bouillante geothermal field (Guadeloupe, French West Indies), Geological Society, London,
Special Publications, 378, (2014), 285-295.