Embed Size (px)
Citation preview
General EconomyNational Accounts 1Industrial Productions,Shipments and Inventories 2Foreign Trade and International Balance of Payments 3Business Operation and Labor's Share 4Business Conditions 5Productivity and Wage Cost 6Prices 7Consumer Price Index of Selected Countries 8Other Economic Indicators 9
Population,Employment and UnemploymentPopulation and Labor Force 10Employed and Employees 11Employees by Type of Employment 12Employment Index for Regular Employees 13Employees of Selected Countries 14Unemployment and Employment Insurance 15Unemployment Rate of Selected Countries 16Job openings-to-applicants ratio 17Job Openings, Job Applications and Placements 18Active job openings-to-applicants ratio by prefecture 19New job openings-to-applicants ratio by prefecture 20Employment Condition 21Employment Adjustment 22
WagesAverage Monthly Cash Earnings of Regular Employees 23Earnings of Selected Countries 24Starting Monthly Salary for New Graduates 25Springtime Wage Increase 26Bonuses 27
Working HoursTotal Hours Worked and Scheduled Hours Worked 28Non-scheduled Hours Worked 29
Industrial InjuriesIndustrial Injuries 30
Salary worker's Living ConditionsFamily Income and Expenditure – Income 31Family Income and Expenditure - Consumption Expenditures 32Ratio of Income Tax and Social Security Contributions to National Income 33
Trade Union,Industrial RelationsIndustrial Relations 34Trade Union Density Rate of Selected Countries 35
(Signs) S.A. : Seasonally adjusted METI : Ministry of Economy, Trade and Industryp : Preliminary figure r : Revised figure MLIT : Ministry of Land, Infrastructure and TransportCAO : Cabinet Office BOJ : The Bank of JapanMIC : Ministry of Internal Affairs and Communications TSR : Tokyo Shoko Research.Ltd.MOF : Ministry of FinanceMHLW : Ministry of Health, Labour and Welfare
April 27, 2018
JILPT Statistical Information
Main Labor Economic Indicators

Real (nominal) Per capita
¥billion % % % %494,017.2 -1.1 0.5 0.7 0.7494,478.0 0.1 0.8 -0.3 -0.6507,246.0 2.6 2.6 0.7 -0.4518,468.5 2.2 -0.3 1.8 1.0533,904.0 3.0 1.4 1.5 0.5539,254.8 1.0 1.2 2.4 1.0
2013 Oct-Dec 131,885.9 0.0 0.0 1.1 -0.22014 Jan-Mar 127,297.7 1.0 0.9 0.6 -0.2
Apr-Jun 126,731.9 0.2 -1.8 1.4 0.7Jul-Sep 125,313.6 -0.1 0.0 2.3 1.3
Oct-Dec 134,532.9 0.9 0.6 1.9 1.12015 Jan-Mar 131,890.2 2.4 1.4 1.8 0.8
Apr-Jun 131,442.2 0.4 0.1 0.5 -0.2Jul-Sep 130,378.0 0.2 0.1 1.4 0.6
Oct-Dec 138,275.3 -0.2 -0.3 1.7 0.72016 Jan-Mar 133,808.5 1.1 0.7 2.6 1.0
Apr-Jun 133,009.4 0.1 0.3 2.5 0.9Jul-Sep 131,429.2 -0.1 0.2 2.8 1.3
Oct-Dec 140,198.5 0.2 0.3 2.7 1.12017 Jan-Mar 134,617.6 0.3 0.5 1.4 0.5
Apr-Jun 134,539.8 0.9 0.6 2.2 1.0Jul-Sep 134,191.5 0.7 0.6 2.2 0.6
Oct-Dec 143,139.7 0.3 0.4 1.9 0.8
NOTES: Benchmark year = 2011
Quarterly Estimates of GDP:October - December 2017 (The 2nd Preliminary Estimates)
Compensation of employees per capita = Compensation of employees / Number of employees.Data of number of employees are the compatible time-series data adjusted to the 2010-base benchmarkrevision.
Change fromprevious period S.A.
Annual percentchange
Annual percentchange
Fiscal year
2012201320142015
National Accounts
CAO "SNA(National Accounts of Japan)"CAO "SNA"
MIC "LabourForce Survey"
Gross Domestic Product Compensation of employees
Nominal Change fromprevious period S.A.
Source
2011
2016
-2.5-2
-1.5-1
-0.50
0.51
1.52
Oct-Dec
Jan-Mar
Apr-Jun
Jul-Sep Oct-Dec
Jan-Mar
Apr-Jun
Jul-Sep Oct-Dec
Jan-Mar
Apr-Jun
Jul-Sep Oct-Dec
Jan-Mar
Apr-Jun
Jul-Sep Oct-Dec
2013 2014 2015 2016 2017
Gross Domestic Product(Real)Change from previous period S.A.(%)
Source: CAO "SNA"
1
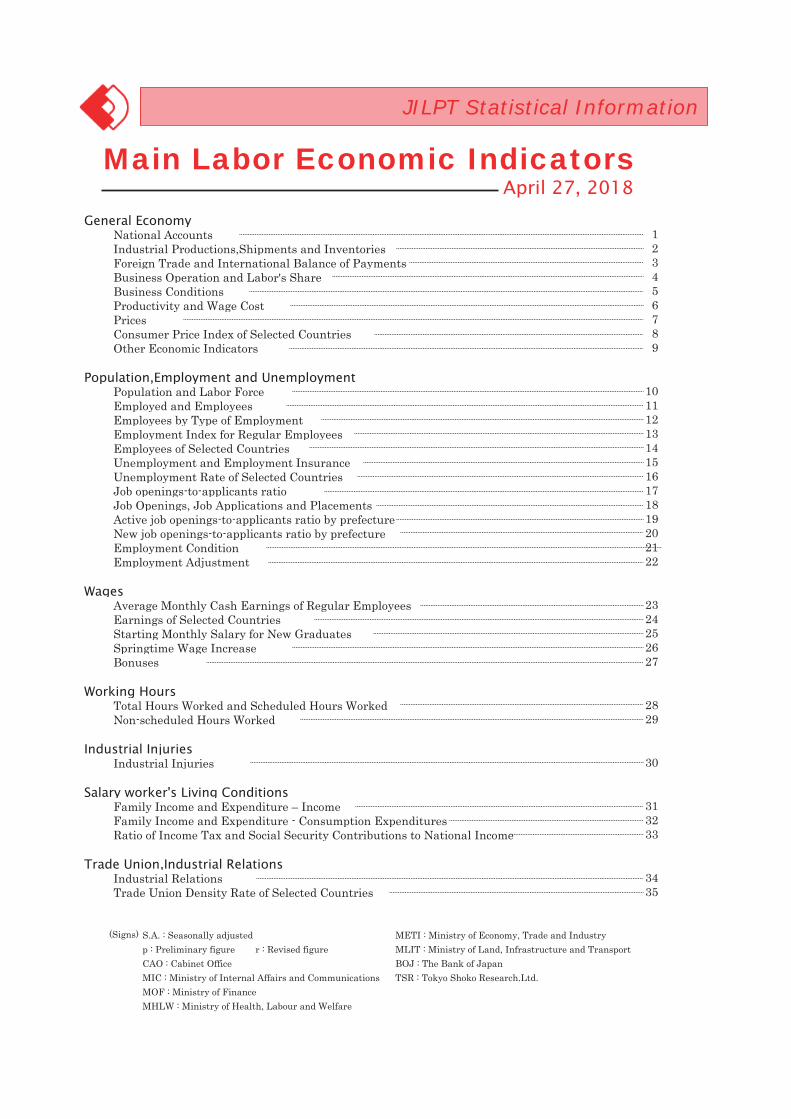
%97.0 -0.8 96.9 105.7 109.099.0 2.1 98.2 112.3 109.897.8 -1.2 96.9 112.3 114.297.7 -0.1 96.3 106.4 114.2
102.0 4.4 100.1 108.4 111.52017 Mar 100.0 -0.5 98.6 109.2 111.0
Apr 102.9 2.9 100.4 110.9 113.1May 100.7 -2.1 98.9 110.7 111.7Jun 101.9 1.2 100.5 108.9 110.7Jul 101.6 -0.3 100.1 108.2 112.4
Aug 102.9 1.3 101.6 107.6 110.1Sep 102.3 -0.6 99.8 107.4 110.7Oct 102.8 0.5 99.4 110.5 113.3Nov 103.5 0.7 101.3 109.8 111.3Dec 105.4 1.8 103.3 109.8 111.7
2017 Jan 100.7 -4.5 98.7 109.3 113.7Feb 102.7 2.0 100.3 109.9 114.0Mar p 103.9 p 1.2 p 100.1 p 113.7 p 117.7 Apr (3.1)May (-1.6)
NOTES:
Industrial Productions, Shipments and Inventories
Inventory Ratio
S.A.
Change fromprevious periodS.A.
( ) Forecast on manufacturing, 2010=100. Indices and change from previous period are revised by the renewalof the reference year (2005 to 2010) and weight for each industry since April, 2013.
Calendar year20132014
Shipment
2017
Source
Inventory
METI "Indices of Industrial Production"
S.A.
Indices of mining & manufacturing
S.A. S.A.
2016
Industrial Production
2015
96
98
100
102
104
106
108
Mar Apr May Jun Jul Aug Sep Oct Nov Dec Jan Feb Mar
2017 2017
Indices of mining & manufacturing (Industrial production) (S.A.)
Source: METI "Indices of Industrial Production"
2
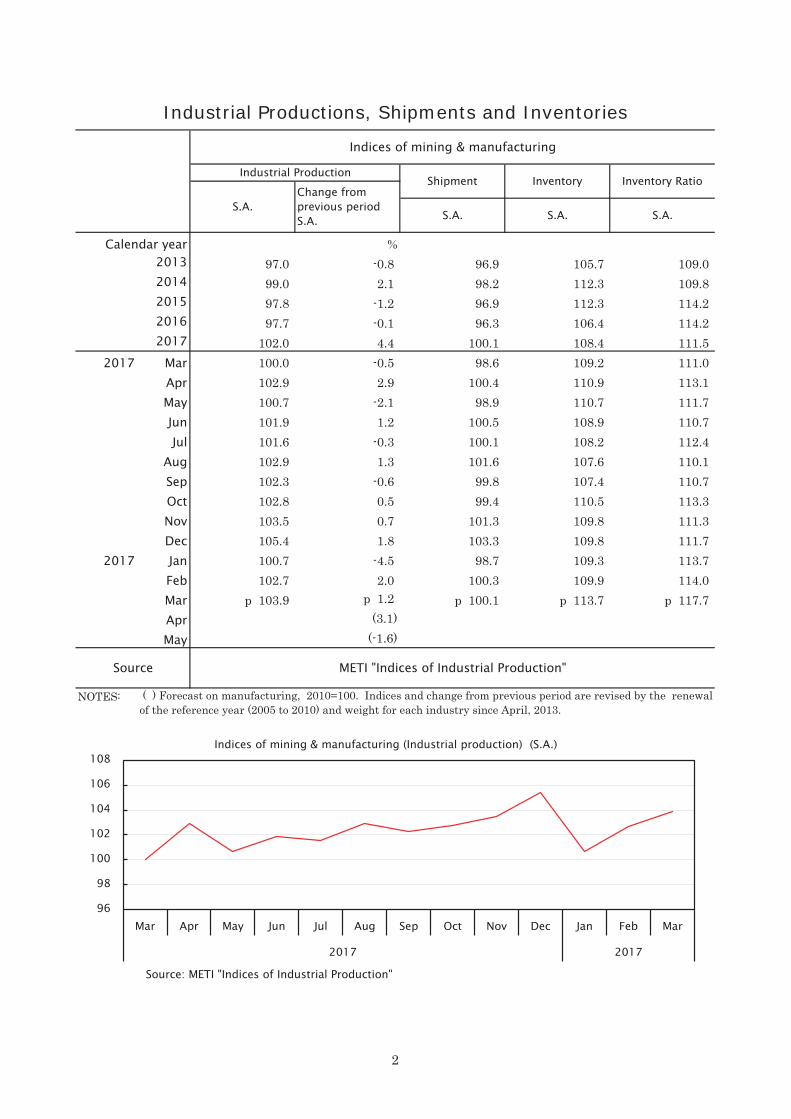
¥100million ¥100million ¥100million ¥100million697,742 812,425 44,566 -122,521730,930 859,091 39,215 -134,988756,139 784,055 165,194r -28,169700,358 660,420 210,615r 43,888r 782,865 753,792 219,514r 42,297r
2017 Feb 63,471 55,426 29,105r 10,838r Mar 72,280 66,245 29,959r 10,935r Apr 63,302 58,519 19,804r 2,719r May 58,516 60,560 16,932r -480r Jun 66,080 61,747 9,252r 4,458r Jul 64,946 60,880 23,471r 3,401r
Aug 62,785 61,817 24,007r 3,523r Sep 68,107 61,569 22,583r 8,012r Oct 66,929 64,144 21,885r 4,064r Nov 69,200 68,148 13,407r 2,180r Dec 73,039 69,477 7,965r 3,308r
2018 Jan 60,863 70,345 6,074p -8,348p Feb 64,633 r 64,634 20,760p 3,114p Mar 73,827 p 65,857
2017201620152014
Calendar year2013
Foreign Trade and International Balance of Payments
Source
Values of foreign trade International balance of payments
Exports Imports Current account Goods and services
MOF "Trade Statistics" MOF ,BOJ "Balance of Payments"
-15,000
-10,000
-5,000
0
5,000
10,000
15,000
Feb Mar Apr May Jun Jul Aug Sep Oct Nov Dec Jan Feb
2017 2018
Goods and services¥100million
Source: MOF, BOJ "Balance of Payments"
3
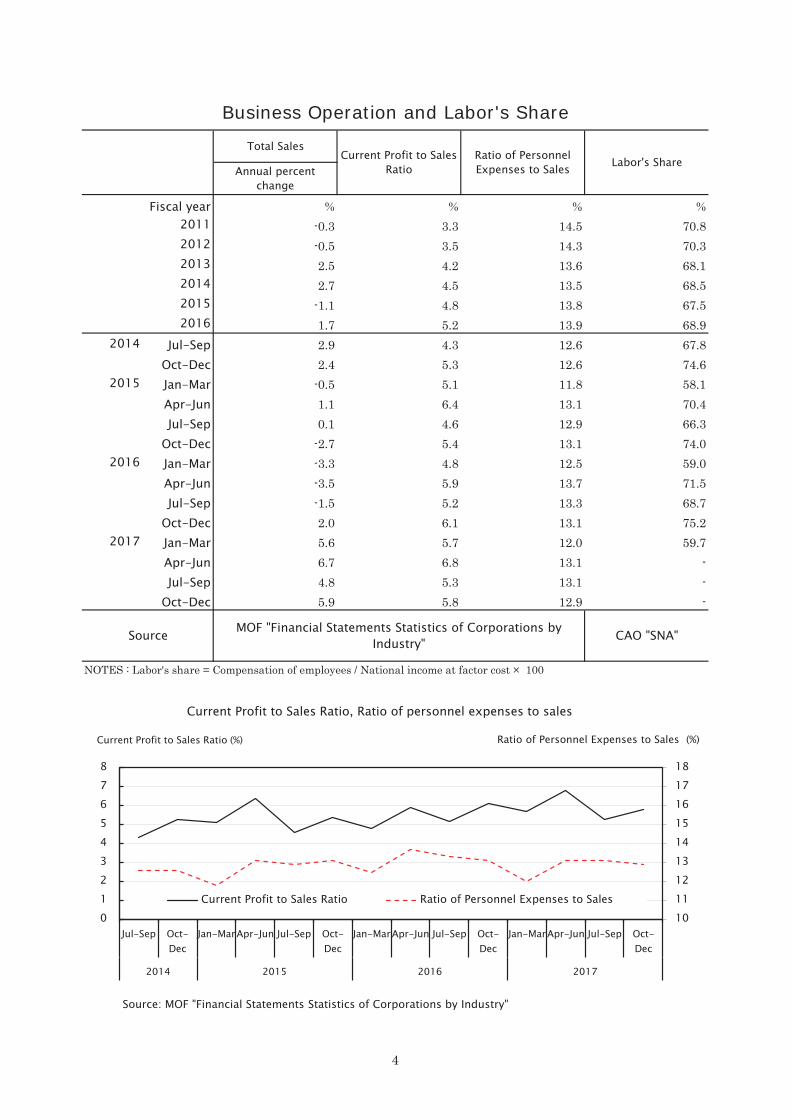
% % % %-0.3 3.3 14.5 70.8-0.5 3.5 14.3 70.32.5 4.2 13.6 68.12.7 4.5 13.5 68.5
-1.1 4.8 13.8 67.51.7 5.2 13.9 68.9
2014 Jul-Sep 2.9 4.3 12.6 67.8Oct-Dec 2.4 5.3 12.6 74.6
2015 Jan-Mar -0.5 5.1 11.8 58.1Apr-Jun 1.1 6.4 13.1 70.4Jul-Sep 0.1 4.6 12.9 66.3
Oct-Dec -2.7 5.4 13.1 74.02016 Jan-Mar -3.3 4.8 12.5 59.0
Apr-Jun -3.5 5.9 13.7 71.5Jul-Sep -1.5 5.2 13.3 68.7
Oct-Dec 2.0 6.1 13.1 75.22017 Jan-Mar 5.6 5.7 12.0 59.7
Apr-Jun 6.7 6.8 13.1 -Jul-Sep 4.8 5.3 13.1 -
Oct-Dec 5.9 5.8 12.9 -
Business Operation and Labor's Share
Labor's ShareAnnual percent
change
MOF "Financial Statements Statistics of Corporations byIndustry"
Fiscal year2011
CAO "SNA"
NOTES : Labor's share = Compensation of employees / National income at factor cost × 100
Source
Total SalesCurrent Profit to Sales
RatioRatio of PersonnelExpenses to Sales
20122013201420152016
101112131415161718
012345678
Jul-Sep Oct-Dec
Jan-MarApr-Jun Jul-Sep Oct-Dec
Jan-MarApr-Jun Jul-Sep Oct-Dec
Jan-MarApr-Jun Jul-Sep Oct-Dec
2014 2015 2016 2017
Current Profit to Sales Ratio, Ratio of personnel expenses to sales
Current Profit to Sales Ratio Ratio of Personnel Expenses to Sales
Ratio of Personnel Expenses to Sales (%)Current Profit to Sales Ratio (%)
Source: MOF "Financial Statements Statistics of Corporations by Industry"
4

Ratio of CurrentProfit to Sales
Manufacturing Non-manufacturing Manufacturing Non-
manufacturing All industries
%Points %Points % % %2013 Mar -8 6
Jun 4 12 4.0 3.4 5.65Sep 12 14Dec 16 20 10.0 7.2 4.97
2014 Mar 17 24Jun 12 19 2.2 2.6 5.91Sep 13 13Dec 12 16 0.5 -1.5 5.61
2015 Mar 12 19Jun 15 23 0.1 -1.4 6.95Sep 12 25Dec 12 25 -4.5 -4.2 5.22
2016 Mar 6 22Jun 6 19 -6.1 -6.9 6.42Sep 6 18Dec 10 18 0.2 -0.6 6.51
2017 Mar 12 20Jun 17 23 5.8 5.6 8.17Sep 22 23Dec 25 23 (3.7) (3.8) (6.25)
2018 Mar 24 23Jun (20) (20) (1.3) (0.9) (7.65)SepDec (1.5) (0.5) (6.30)
NOTES: D.I. <"Favorable" minus "Unfavorable"> ( ) Forecast Large Enterprises = Capital 1 billion yen and more.
Business ConditionsLarge Enterprises
SalesBusiness Conditions D.I.
BOJ "TANKAN"Source
-10-505
1015202530
Mar Jun Sep Dec Mar Jun Sep Dec Mar Jun Sep Dec Mar Jun Sep Dec Mar Jun Sep Dec Mar
2013 2014 2015 2016 2017 2018
Business Conditions D.I.("Favorable"minus"Unfavorable")
Manufacturing Non-manufacturing
Large Enterprises% points
Source: BOJ "TANKAN"
Favo
rabl
eUn
favo
rabl
e
5

97.9 0.3 -1.699.5 1.6 -1.4
101.8 2.4 -1.0100.0 -1.8 1.9
99.7 -0.3 1.1103.0 3.3 -2.3
2017 Jan 105.6 3.5 -0.7Feb 99.3 3.1 -2.8Mar 113.3 4.4 -2.4Apr 94.8 5.0 -3.6May 102.2 3.5 -3.9Jun 101.8 3.6 -2.7Jul 100.9 3.7 -2.9
Aug 103.7 4.7 -4.0Sep 105.3 1.1 1.0Oct 103.6 3.4 -3.7Nov 101.9 1.5 -1.5Dec 103.2 2.2 -1.3
2018 Jan 106.6 1.0 -1.6Feb 101.1 1.8 0.5
NOTES : Calculated by JILPT
Productivity and Wage Cost
Source
Indices(2015=100) Annual percent change Annual percent change
2015
MHLW "Monthly Labour Survey"METI "Indices of Industrial Production"
2017
Labor productivity indices = [(indices of industrial production(manufacturing) / 100) / {(regular employmentindices / 100) * (total hours worked indices / 100) } ]*100
Wage cost = [ { (indices of nominal wage / 100) * (regular employment indices / 100)} / (indices of industrialproduction(manufacturing) / 100) ]*100
Regular employment indices, indices of nominal wage and total hours worked indices : manufacturing, 5employees or more.
2014
Wage cost (Manufacturing)Labor Productivity (Manufacturing)
Calendar year20122013
2016
-8-6-4-202468
Jan Feb Mar Apr May Jun Jul Aug Sep Oct Nov Dec Jan Feb
2017 2018
Labor Productivity (Manufacturing)Annual percent change
Labor Productivity (Manufacturing) Wage cost (Manufacturing)
%
Source: MHLW "Monthly Labour Survey", METI "Indices of Industrial Production"
6

Index Annualchange
Annualchange
Annualchange Index Annual
change% % % %
96.6 0.4 0.4 -0.2 99.2 1.399.2 2.7 2.6 2.2 102.3 3.1
100.0 0.8 0.5 1.4 100.0 -2.399.9 -0.1 -0.3 0.6 96.5 -3.5
100.4 0.5 0.5 0.1 98.7r 2.3r 2017 Feb 99.8 0.3 0.2 0.1 97.9 1.0
Mar 99.9 0.2 0.2 -0.1 98.2 1.4Apr 100.3 0.4 0.3 0.0 98.4 2.1May 100.4 0.4 0.4 0.0 98.4 2.1Jun 100.2 0.4 0.4 0.0 98.5 2.2Jul 100.1 0.4 0.5 0.1 98.7 2.5
Aug 100.3 0.7 0.7 0.2 98.8 2.9Sep 100.5 0.7 0.7 0.2 99.0 3.0Oct 100.6 0.2 0.8 0.2 99.4 3.5Nov 100.9 0.6 0.9 0.3 99.8 3.5Dec 101.2 1.0 0.9 0.3 100.0 3.0
2018 Jan 101.3 1.4 0.9 0.4 100.3 2.7Feb 101.3 1.5 1.0 0.5 100.4r 2.6r Mar 101.0 1.1 0.9 0.5 100.3p 2.1p Apr [ 100.4] [ 0.5] [ 0.6] [ 0.3]
All itemsAll items,less fresh
food
All items,less freshfood andenergy
MIC "Consumer Price Index"
20162015
20132014
2017
Prices
Source
Domestic Corporate GoodsPrice
NOTES : 2015=100 Figures in brackets show Ku-area of Tokyo(preliminary).
BOJ "Corporate Goods PriceIndex"
Calendar year
Consumer Price
-2.0
-1.0
0.0
1.0
2.0
3.0
4.0
Feb Mar Apr May Jun Jul Aug Sep Oct Nov Dec Jan Feb Mar
2017 2018
Consumer Price Domestic Corporate Goods Price
%
Source: MIC "Consumer Price Index", BOJ "Corporate Goods Price Index"
Price Index Annual percent change
7

U.S.A. Germany U.K. FranceAnnual change Annual change Annual change Annual change
% % % %2.1 2.0 2.8 2.01.5 1.5 2.6 0.91.6 0.9 1.5 0.50.1 0.3 0.0 0.01.3 0.5 0.7 0.22.1 1.8 2.7 1.0
2017 Feb 2.7 2.2 2.3 1.2Mar 2.4 1.6 2.3 1.1Apr 2.2 2.0 2.7 1.2May 1.9 1.5 2.9 0.8Jun 1.6 1.6 2.6 0.7Jul 1.7 1.7 2.6 0.7
Aug 1.9 1.8 2.9 0.9Sep 2.2 1.8 3.0 1.0Oct 2.0 1.6 3.0 1.1Nov 2.2 1.8 3.1 1.2Dec 2.1 1.7 3.0 1.2
2018 Jan 2.1 1.6 3.0 1.3Feb 2.2 1.4 2.7 1.2Mar 2.4 1.6 1.6
20152016
Consumer Price Index of Selected Countries
2017
Source MIC "Consumer Price Index (Monthly Report Reference Table) "
Rates of Change in Consumer Price Index
Calendar year201220132014
0.0
0.5
1.0
1.5
2.0
2.5
3.0
3.5
4.0
Feb Mar Apr May Jun Jul Aug Sep Oct Nov Dec Jan Feb
2017 2018
Rates of Change in Consumer Price Index(Annual percent change)
U.S.A. GermanyU.K. France
%
Source: MIC "Consumer Price Index"
8

% % % % / year ¥ / $-0.9 5.8 -4.70 1.364 79.815.8 11.0 -10.46 1.258 97.634.0 -9.0 -10.35 1.180 105.854.1 1.9 -9.44 1.110 121.031.7 6.4 -4.15 0.998 108.84
-1.1 -0.3 -0.48 0.946 112.162017 Feb 1.1 -3.6 -4.84 0.992 113.06
Mar 0.4 2.7 5.36 0.982 113.01Apr -2.1 1.4 -2.15 0.982 110.06May -1.9 -0.6 19.52 0.976 112.21Jun -1.8 0.1 -7.47 0.969 110.91Jul 4.5 -2.1 0.28 0.965 112.44
Aug 3.2 -2.4 -11.98 0.962 109.91Sep -5.5 1.4 4.62 0.955 110.68Oct 2.7 -1.1 7.32 0.955 112.96Nov 5.5 1.7 -2.30 0.954 112.92Dec -9.3 -2.7 -1.97 0.946 112.97
2018 Jan 8.2 -8.6 4.95 0.943 110.77Feb 2.1 8.2 -10.31 0.940 107.82Mar -3.4 0.38 106.00
20122013201420152016
3) US.Dollar/Yen Central Rate, Average in the Month, Tokyo Market
NOTES : 1) Private sector (exc. volatile orders for ships and those from electric power companies) 2) Outstanding Loans and Bills Discounted, Total, Domestically Licensed Banks
2017
New housingconstructionstarted
Bankruptcy Average contractedinterest rate on loans& discounts
Exchange rate 2)Change fromprevious periodS.A.
Change fromprevious periodS.A.
Annual percentchange
Source
Other Economic Indicators
CAO "MachineryOrders"
MLIT "MonthlyEconomic
ConstructionStatistics"
TSR "BusinessFailure Report"
BOJ "AverageContracted Interest
Rates on Loansand Discounts "
BOJ "ForeignExchange Rates"
Calendar year
Machinery Orders1)
95
100
105
110
115
120
125Feb Mar Apr May Jun Jul Aug Sep Oct Nov Dec Jan Feb Mar
2017 2018
Exchange rate¥ / $
Source: BOJ "Foreign Exchange Rates"
9

Annual change Annual change10thous. 10thous. 10thous. % point
11,110 6,565 -31 59.1 -0.211,107 6,593 28 59.3 0.211,109 6,609 16 59.4 0.111,110 6,625 16 59.6 0.211,111 6,673 48 60.0 0.411,108 6,720 47 60.5 0.5
2017 Feb 11,105 6,615 26 59.6 0.3 Mar 11,107 6,621 41 59.6 0.4 Apr 11,104 6,697 52 60.3 0.5 May 11,107 6,757 70 60.8 0.7 Jun 11,108 6,775 42 61.0 0.5 Jul 11,111 6,754 46 60.8 0.5
Aug 11,106 6,762 60 60.9 0.6 Sep 11,112 6,786 60 61.1 0.6 Oct 11,114 6,762 47 60.8 0.4 Nov 11,113 6,730 56 60.6 0.6 Dec 11,103 6,716 33 60.5 0.4
2018 Jan 11,102 6,722 55 60.5 0.5 Feb 11,100 6,744 129 60.8 1.2 Mar 11,100 6,793 172 61.2 1.6
2017
Population and Labor Force
MIC "Labour Force Survey"Source
Calendar year
Population of15 years oldand over
Labor force
2016
Labor force participation rate
2012201320142015
020406080
100120140160180200
Feb Mar Apr May Jun Jul Aug Sep Oct Nov Dec Jan Feb Mar
2017 2018
Labor force (Annual change)10thous.
Source: MIC "Labour Force Survey"
10

Women
10thous. 10thous. 10thous. 10thous. 10thous.6,280 -13 5,513 1 9946,326 46 5,567 54 1,0636,371 45 5,613 46 1,1116,401 30 5,663 50 1,1106,465 64 5,750 87 1,147
2017 6,530 65 5,819 69 1,1232017 Feb 6,427 51 5,754 48 1,107
Mar 6,433 69 5,728 58 1,094Apr 6,500 80 5,757 57 1,109May 6,547 76 5,796 57 1,055Jun 6,583 61 5,848 87 1,096Jul 6,563 59 5,839 96 1,129
Aug 6,573 84 5,840 97 1,127Sep 6,596 74 5,866 74 1,126Oct 6,581 61 5,877 62 1,108Nov 6,552 75 5,865 86 1,147Dec 6,542 52 5,863 43 1,186
2018 Jan 6,562 92 5,880 87 1,140Feb 6,578 151 5,875 121 1,148Mar 6,620 187 5,872 144 1,135
Employed
20132012
Employed and Employees
Annual changeNon-agriculturalindustries
Employees
2015
Weekly Hours of Work:1 ~ 34hoursAnnual change
Source MIC "Labour Force Survey"
Calendar year
2016
2014
020406080
100120140160
Feb Mar Apr May Jun Jul Aug Sep Oct Nov Dec Jan Feb Mar
2017 2018
Employees10thous. (Annual change)
Source: MIC "Labour Force Survey"
11

Part-time
worker
Arbeit(temporary worker)
Dispatchedworkerfrom
temporarylabouragency
Contractemployee
Entrustedemployee Other
10thous. 10thous. 10thous. 10thous. 10thous. 10thous. 10thous. 10thous. 10thous.2017 Apr 5,404 3,400 2,004 994 401 133 288 117 71
May 5,441 3,437 2,003 986 388 132 298 122 77Jun 5,505 3,457 2,046 991 413 139 300 124 79Jul 5,497 3,429 2,068 1005 422 140 300 119 82
Aug 5,476 3,421 2,054 1006 417 138 289 126 78Sep 5,511 3,483 2,028 995 412 140 293 116 71Oct 5,525 3,485 2,041 1003 412 136 291 118 81Nov 5,518 3,456 2,061 1001 428 134 293 127 78Dec 5,522 3,441 2,081 1006 438 130 301 128 80
2018 Jan 5,566 3,447 2,119 1012 456 143 313 118 77Feb 5,551 3,430 2,120 1026 450 145 304 117 78Mar 5,528 3,417 2,111 1052 440 130 296 113 80
10thous. 10thous. 10thous. 10thous. 10thous. 10thous. 10thous. 10thous. 10thous.2017 Apr 48 14 33 21 16 7 -1 -11 1
May 56 50 5 9 0 1 4 -7 -3Jun 93 68 23 0 11 2 14 0 -5Jul 95 60 35 -4 12 6 17 5 -1
Aug 75 56 18 17 8 3 -2 7 -15Sep 73 76 -2 18 -7 -3 11 -3 -19Oct 72 68 5 18 -21 4 12 0 -8Nov 108 88 20 12 -6 1 1 11 0Dec 59 50 9 -5 -20 3 17 12 3
2018 Jan 111 40 72 0 20 19 29 5 -1Feb 149 33 115 41 28 13 31 5 -4Mar 153 41 113 73 25 -2 11 0 7
% % % % % % % % %2017 Apr - 62.9 37.1 18.4 7.4 2.5 5.3 2.2 1.3
May - 63.2 36.8 18.1 7.1 2.4 5.5 2.2 1.4Jun - 62.8 37.2 18.0 7.5 2.5 5.5 2.3 1.4Jul - 62.4 37.6 18.3 7.7 2.5 5.5 2.2 1.5
Aug - 62.5 37.5 18.4 7.6 2.5 5.3 2.3 1.4Sep - 63.2 36.8 18.1 7.5 2.5 5.3 2.1 1.3Oct - 63.1 36.9 18.2 7.5 2.5 5.3 2.1 1.5Nov - 62.6 37.4 18.1 7.8 2.4 5.3 2.3 1.4Dec - 62.3 37.7 18.2 7.9 2.4 5.5 2.3 1.4
2018 Jan - 61.9 38.1 18.2 8.2 2.6 5.6 2.1 1.4Feb - 61.8 38.2 18.5 8.1 2.6 5.5 2.1 1.4Mar - 61.8 38.2 19.0 8.0 2.4 5.4 2.0 1.4
NOTES: Rates are to the totals of "Regular employee" and "Non-regular employee".
Annual Change
Rates
Source MIC "Labour Force Survey"
Employees by Type of Employment
Employee,excl.
executiveof
company orcorporation
Regularemployee
Non-regular
employee
-20020406080100120140160
30313233343536373839
Apr May Jun Jul Aug Sep Oct Nov Dec Jan Feb Mar
2017 2018
% Regular employee and Non-regular employee
Source: MIC "Labour Force Survey"
10thous.
Annual changes of non-regular employee (right scale)Annual changes of regular
employee (right scale)
Rate of non-regular employee (left scale)
12
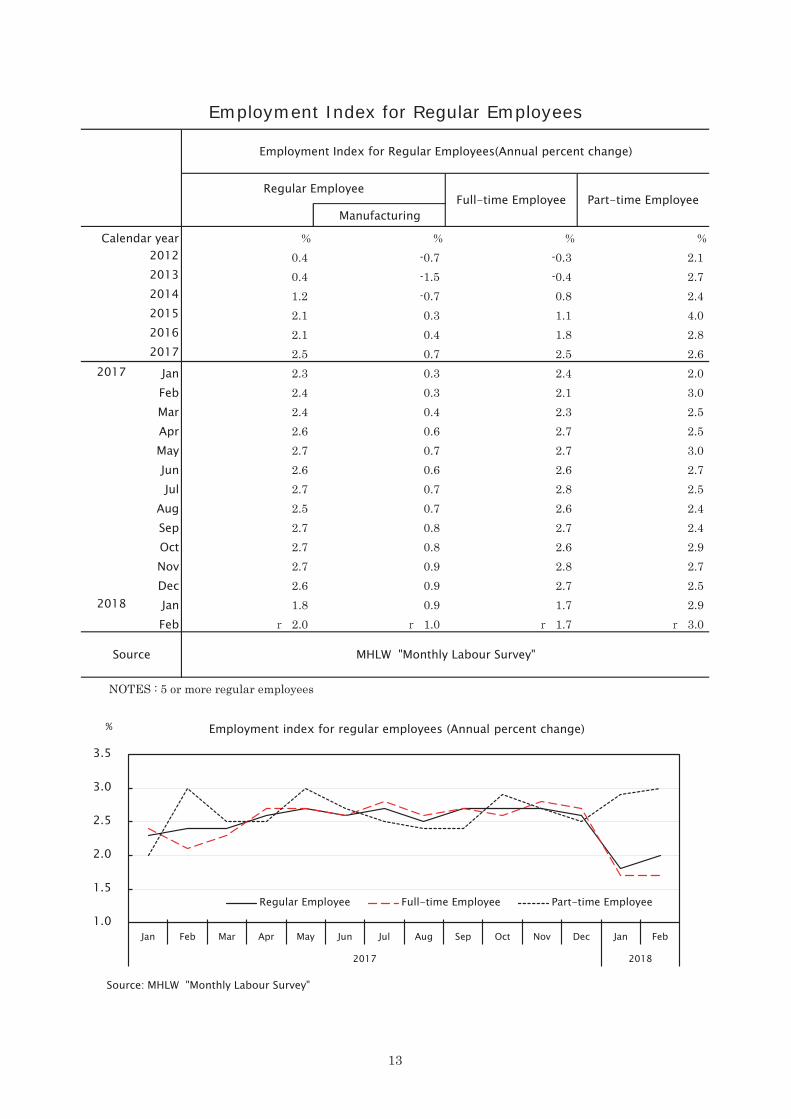
Manufacturing
% % % %0.4 -0.7 -0.3 2.10.4 -1.5 -0.4 2.71.2 -0.7 0.8 2.42.1 0.3 1.1 4.02.1 0.4 1.8 2.82.5 0.7 2.5 2.6
2017 Jan 2.3 0.3 2.4 2.0Feb 2.4 0.3 2.1 3.0Mar 2.4 0.4 2.3 2.5Apr 2.6 0.6 2.7 2.5May 2.7 0.7 2.7 3.0Jun 2.6 0.6 2.6 2.7Jul 2.7 0.7 2.8 2.5
Aug 2.5 0.7 2.6 2.4Sep 2.7 0.8 2.7 2.4Oct 2.7 0.8 2.6 2.9Nov 2.7 0.9 2.8 2.7Dec 2.6 0.9 2.7 2.5
2018 Jan 1.8 0.9 1.7 2.9Feb 2.0 1.0 1.7 3.0
Employment Index for Regular Employees
Source MHLW "Monthly Labour Survey"
NOTES : 5 or more regular employees
2013
2016
Employment Index for Regular Employees(Annual percent change)
Regular EmployeeFull-time Employee Part-time Employee
2014
Calendar year2012
2015
2017
1.0
1.5
2.0
2.5
3.0
3.5
Jan Feb Mar Apr May Jun Jul Aug Sep Oct Nov Dec Jan Feb
2017 2018
% Employment index for regular employees (Annual percent change)
Regular Employee Full-time Employee Part-time Employee
Source: MHLW "Monthly Labour Survey"
13

S.A. Over-the-monthchange
thous. thous. thous. thous. thous.134,175 2,243 34,170 24,572 22,726136,381 2,206 34,620 24,817 22,742138,958 2,577 34,960 25,251 23,184141,843 2,885 35,292 25,773 23,191144,352 2,509 36,320 25,996 23,256146,624 2,272
2017 Feb 145,896 200Mar 145,969 73 36,417 26,145 23,213Apr 146,144 175May 146,299 155Jun 146,538 239 36,330 26,269 23,625Jul 146,728 190
Aug 146,949 221Sep 146,963 14 37,033 26,424 23,667Oct 147,234 271Nov 147,450 216Dec 147,625 175 37,041 26,517 23,661
2018 Jan 147,801 176Feb p 148,127 326p Mar p 148,230 103p
NOTES :Germany, U.K., France : The figure for the quarter, from 15 to 64 years
201420132012
2015
Source
2016
U.S.A. Bureau of Labor Statistics" The Employment Situation"Germany, U.K., France "Eurostat Database(Eurostat)"
U.S.A : Total nonfarm, seasonally adjusted
2017
Employees of Selected Countries
Calendar year
EmployeesU.S.A.
Germany U.K. France
-500
50100150200250300350
Feb Mar Apr May Jun Jul Aug Sep Oct Nov Dec Jan Feb Mar
2017 2018
Employees of the United States(Over-the-month Change, S.A.)
thousands.
Source: Bureau of Labor Statistics "The Employment Situation"
14
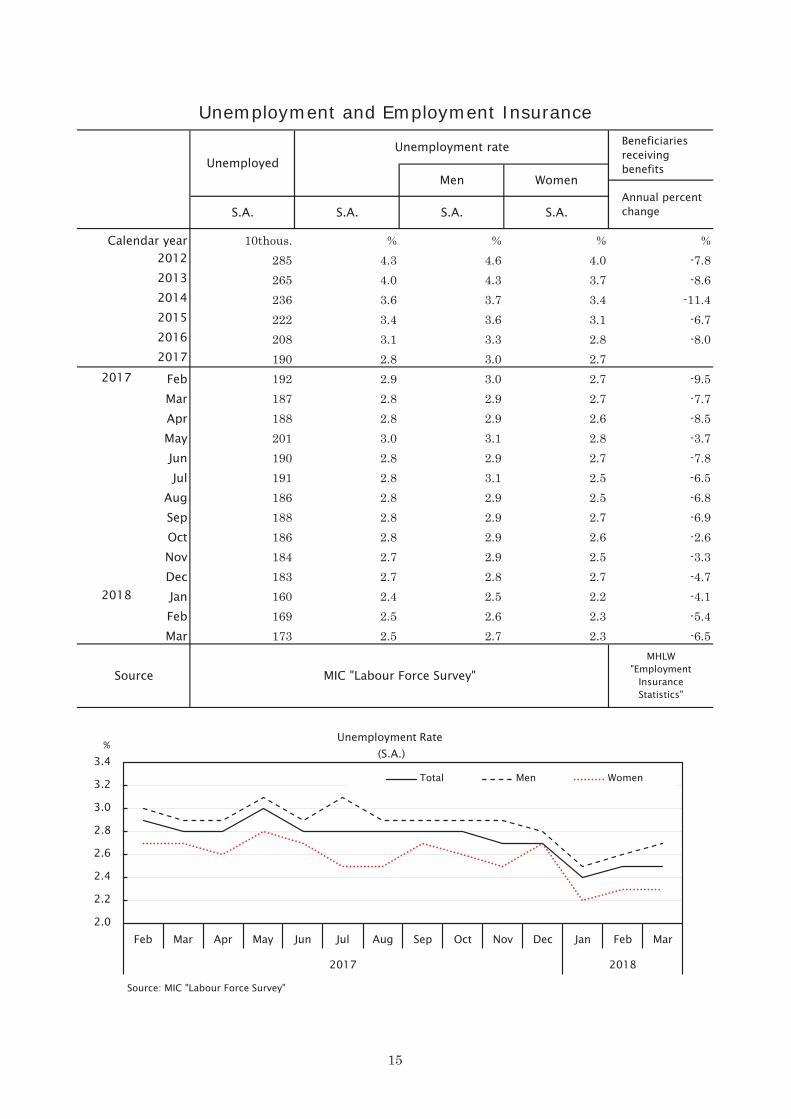
10thous. % % % %285 4.3 4.6 4.0 -7.8265 4.0 4.3 3.7 -8.6236 3.6 3.7 3.4 -11.4222 3.4 3.6 3.1 -6.7208 3.1 3.3 2.8 -8.0190 2.8 3.0 2.7
2017 Feb 192 2.9 3.0 2.7 -9.5Mar 187 2.8 2.9 2.7 -7.7Apr 188 2.8 2.9 2.6 -8.5May 201 3.0 3.1 2.8 -3.7Jun 190 2.8 2.9 2.7 -7.8Jul 191 2.8 3.1 2.5 -6.5
Aug 186 2.8 2.9 2.5 -6.8Sep 188 2.8 2.9 2.7 -6.9Oct 186 2.8 2.9 2.6 -2.6Nov 184 2.7 2.9 2.5 -3.3Dec 183 2.7 2.8 2.7 -4.7
2018 Jan 160 2.4 2.5 2.2 -4.1Feb 169 2.5 2.6 2.3 -5.4Mar 173 2.5 2.7 2.3 -6.5
2013
UnemployedUnemployment rate
MIC "Labour Force Survey"
2017
Unemployment and Employment Insurance
S.A. S.A.Annual percentchange
Men Women
S.A.
Calendar year
20152016
Beneficiariesreceivingbenefits
2014
S.A.
2012
SourceMHLW
"EmploymentInsuranceStatistics"
2.0
2.2
2.4
2.6
2.8
3.0
3.2
3.4
Feb Mar Apr May Jun Jul Aug Sep Oct Nov Dec Jan Feb Mar
2017 2018
%Unemployment Rate
(S.A.)
Total Men Women
Source: MIC "Labour Force Survey"
15

U.S.A. Germany U.K. France
S.A. S.A. S.A. S.A.
% % % %8.1 5.4 7.9 9.87.4 5.2 7.5 10.36.2 5.0 6.1 10.35.3 4.6 5.3 10.44.9 4.1 4.8 10.14.4 3.8 4.4 9.4
2017 Feb 4.7 3.9 4.5 9.6Mar 4.5 3.9 4.5 9.5Apr 4.4 3.9 4.4 9.5May 4.3 3.8 4.4 9.5Jun 4.3 3.8 4.3 9.5Jul 4.3 3.7 4.3 9.6
Aug 4.4 3.7 4.2 9.5Sep 4.2 3.7 4.2 9.4Oct 4.1 3.6 4.3 9.2Nov 4.1 3.6 4.3 9.0Dec 4.1 3.6 4.2 9.0
2018 Jan 4.1 3.5 9.0Feb 4.1 3.5 8.9Mar 4.1
Source U.S.A. Bureau of Labor Statistics" The Employment Situation "Germany, U.K., France "Eurostat Database(Eurostat)"
Unemployment Rate
20122013
2017
20152014
Unemployment Rate of Selected Countries
Calendar year
2016
7
8
9
10
11
3
4
5
6
7
Feb Mar Apr May Jun Jul Aug Sep Oct Nov Dec Jan Feb Mar
2017 2018
%%Unemployment Rate of Selected Countries
(S.A.)
U.S.A. Germany U.K. France (right side)
Source: See above
16
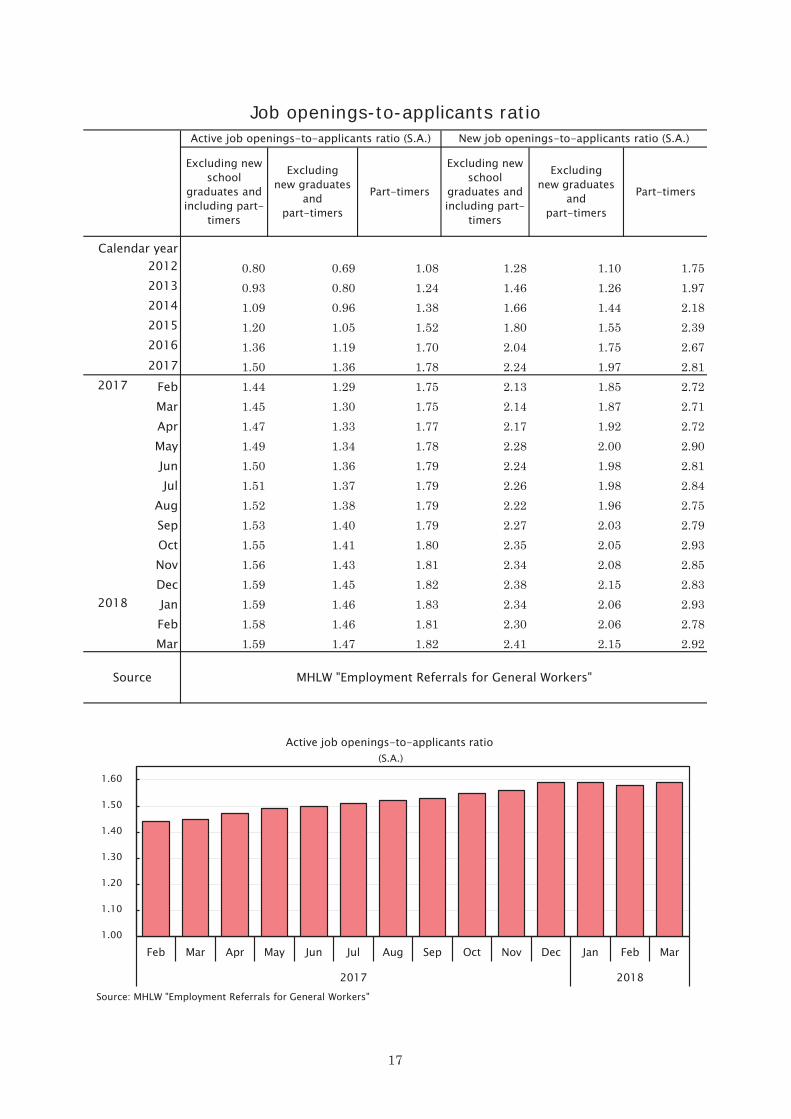
0.80 0.69 1.08 1.28 1.10 1.750.93 0.80 1.24 1.46 1.26 1.971.09 0.96 1.38 1.66 1.44 2.181.20 1.05 1.52 1.80 1.55 2.391.36 1.19 1.70 2.04 1.75 2.67
2017 1.50 1.36 1.78 2.24 1.97 2.812017 Feb 1.44 1.29 1.75 2.13 1.85 2.72
Mar 1.45 1.30 1.75 2.14 1.87 2.71Apr 1.47 1.33 1.77 2.17 1.92 2.72May 1.49 1.34 1.78 2.28 2.00 2.90Jun 1.50 1.36 1.79 2.24 1.98 2.81Jul 1.51 1.37 1.79 2.26 1.98 2.84
Aug 1.52 1.38 1.79 2.22 1.96 2.75Sep 1.53 1.40 1.79 2.27 2.03 2.79Oct 1.55 1.41 1.80 2.35 2.05 2.93Nov 1.56 1.43 1.81 2.34 2.08 2.85Dec 1.59 1.45 1.82 2.38 2.15 2.83
2018 Jan 1.59 1.46 1.83 2.34 2.06 2.93Feb 1.58 1.46 1.81 2.30 2.06 2.78Mar 1.59 1.47 1.82 2.41 2.15 2.92
Part-timers
2014
Excluding newschool
graduates andincluding part-
timers
Excludingnew graduates
andpart-timers
Calendar year20122013
20162015
Source
Job openings-to-applicants ratio
Part-timers
Active job openings-to-applicants ratio (S.A.)
MHLW "Employment Referrals for General Workers"
New job openings-to-applicants ratio (S.A.)
Excluding newschool
graduates andincluding part-
timers
Excludingnew graduates
andpart-timers
1.00
1.10
1.20
1.30
1.40
1.50
1.60
Feb Mar Apr May Jun Jul Aug Sep Oct Nov Dec Jan Feb Mar
2017 2018
Active job openings-to-applicants ratio (S.A.)
Source: MHLW "Employment Referrals for General Workers"
17

persons % persons % persons % persons % persons1,938,639 15.8 737,101 12.5 2,435,686 -6.1 576,666 -7.9 181,3272,120,933 9.4 794,255 7.8 2,292,475 -5.9 542,473 -5.9 176,4992,276,733 7.3 833,610 5.0 2,092,574 -8.7 502,221 -7.4 168,2192,373,739 4.3 863,045 3.5 1,979,477 -5.4 478,288 -4.8 158,9182,529,959 6.6 910,698 5.5 1,865,558 -5.8 447,452 -6.4 150,6572,696,364 6.6 962,766 5.7 1,792,673 -3.9 430,034 -3.9 145,943
2017 Feb 2,724,603 5.9 1,014,039 4.9 1,779,833 -4.9 465,468 -7.7 149,816Mar 2,806,583 6.1 980,579 6.5 1,879,857 -4.3 491,188 -3.5 196,790Apr 2,676,726 6.0 923,450 3.2 1,939,779 -4.6 555,596 -4.5 164,258May 2,614,855 6.7 912,056 6.9 1,921,183 -3.7 452,813 -2.9 156,805Jun 2,632,079 6.5 964,041 6.3 1,869,242 -4.0 420,940 -5.1 156,012Jul 2,616,575 6.3 922,441 3.5 1,785,034 -4.2 380,718 -5.1 135,796
Aug 2,660,853 6.4 943,856 6.3 1,767,273 -3.7 403,206 -2.3 129,520Sep 2,720,143 6.1 997,035 5.6 1,766,027 -3.5 414,578 -4.0 144,580Oct 2,800,172 7.2 1,023,751 7.1 1,769,272 -3.0 409,910 -3.3 145,768Nov 2,786,973 6.8 942,437 5.5 1,707,048 -3.4 366,217 -4.1 133,180Dec 2,725,070 8.1 922,213 9.6 1,611,495 -3.2 324,839 -3.2 119,897
2018 Jan 2,750,177 6.1 1,030,077 2.3 1,640,863 -4.4 441,428 -7.1 110,778Feb 2,838,833 4.2 1,015,561 0.2 1,689,667 -5.1 431,557 -7.3 136,880Mar 2,893,473 3.1 1,010,782 3.1 1,781,453 -5.2 459,065 -6.5 181,109
MHLW "Employment Referrals for General Workers"
Annualpercentchange
Source
Monthly active jobopenings New job openings
Annualpercentchange
Annualpercentchange
Monthly activeapplications New applications
Personswho found
employment
Job Openings, Job Applications and Placements
Annualpercentchange
Calendar year201220132014201520162017
-10
-5
0
5
10
15
Feb Mar Apr May Jun Jul Aug Sep Oct Nov Dec Jan Feb Mar
2017 2018
% New job openings · New applications
New applications New job openings
(Annual percent change)
Source: MHLW "Employment Referrals for General Workers"
18
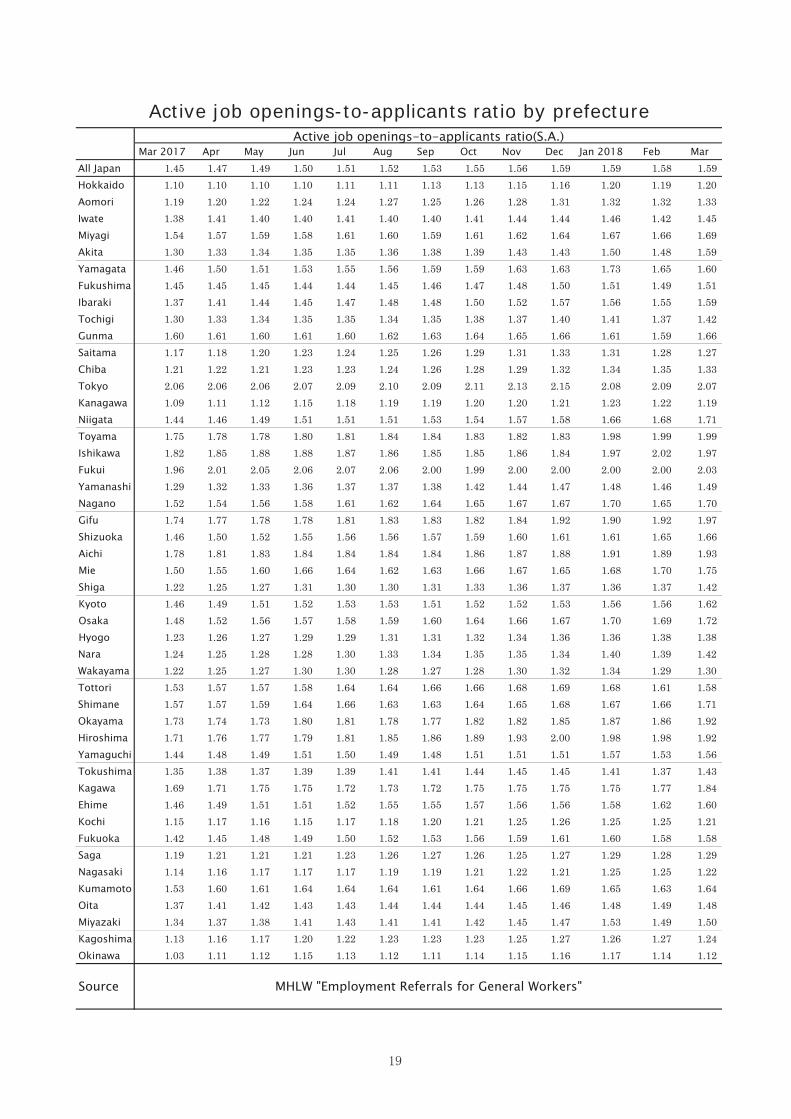
Mar 2017 Apr May Jun Jul Aug Sep Oct Nov Dec Jan 2018 Feb MarAll Japan 1.45 1.47 1.49 1.50 1.51 1.52 1.53 1.55 1.56 1.59 1.59 1.58 1.59Hokkaido 1.10 1.10 1.10 1.10 1.11 1.11 1.13 1.13 1.15 1.16 1.20 1.19 1.20Aomori 1.19 1.20 1.22 1.24 1.24 1.27 1.25 1.26 1.28 1.31 1.32 1.32 1.33Iwate 1.38 1.41 1.40 1.40 1.41 1.40 1.40 1.41 1.44 1.44 1.46 1.42 1.45Miyagi 1.54 1.57 1.59 1.58 1.61 1.60 1.59 1.61 1.62 1.64 1.67 1.66 1.69Akita 1.30 1.33 1.34 1.35 1.35 1.36 1.38 1.39 1.43 1.43 1.50 1.48 1.59Yamagata 1.46 1.50 1.51 1.53 1.55 1.56 1.59 1.59 1.63 1.63 1.73 1.65 1.60Fukushima 1.45 1.45 1.45 1.44 1.44 1.45 1.46 1.47 1.48 1.50 1.51 1.49 1.51Ibaraki 1.37 1.41 1.44 1.45 1.47 1.48 1.48 1.50 1.52 1.57 1.56 1.55 1.59Tochigi 1.30 1.33 1.34 1.35 1.35 1.34 1.35 1.38 1.37 1.40 1.41 1.37 1.42Gunma 1.60 1.61 1.60 1.61 1.60 1.62 1.63 1.64 1.65 1.66 1.61 1.59 1.66Saitama 1.17 1.18 1.20 1.23 1.24 1.25 1.26 1.29 1.31 1.33 1.31 1.28 1.27Chiba 1.21 1.22 1.21 1.23 1.23 1.24 1.26 1.28 1.29 1.32 1.34 1.35 1.33Tokyo 2.06 2.06 2.06 2.07 2.09 2.10 2.09 2.11 2.13 2.15 2.08 2.09 2.07Kanagawa 1.09 1.11 1.12 1.15 1.18 1.19 1.19 1.20 1.20 1.21 1.23 1.22 1.19Niigata 1.44 1.46 1.49 1.51 1.51 1.51 1.53 1.54 1.57 1.58 1.66 1.68 1.71Toyama 1.75 1.78 1.78 1.80 1.81 1.84 1.84 1.83 1.82 1.83 1.98 1.99 1.99Ishikawa 1.82 1.85 1.88 1.88 1.87 1.86 1.85 1.85 1.86 1.84 1.97 2.02 1.97Fukui 1.96 2.01 2.05 2.06 2.07 2.06 2.00 1.99 2.00 2.00 2.00 2.00 2.03Yamanashi 1.29 1.32 1.33 1.36 1.37 1.37 1.38 1.42 1.44 1.47 1.48 1.46 1.49Nagano 1.52 1.54 1.56 1.58 1.61 1.62 1.64 1.65 1.67 1.67 1.70 1.65 1.70Gifu 1.74 1.77 1.78 1.78 1.81 1.83 1.83 1.82 1.84 1.92 1.90 1.92 1.97Shizuoka 1.46 1.50 1.52 1.55 1.56 1.56 1.57 1.59 1.60 1.61 1.61 1.65 1.66Aichi 1.78 1.81 1.83 1.84 1.84 1.84 1.84 1.86 1.87 1.88 1.91 1.89 1.93Mie 1.50 1.55 1.60 1.66 1.64 1.62 1.63 1.66 1.67 1.65 1.68 1.70 1.75Shiga 1.22 1.25 1.27 1.31 1.30 1.30 1.31 1.33 1.36 1.37 1.36 1.37 1.42Kyoto 1.46 1.49 1.51 1.52 1.53 1.53 1.51 1.52 1.52 1.53 1.56 1.56 1.62Osaka 1.48 1.52 1.56 1.57 1.58 1.59 1.60 1.64 1.66 1.67 1.70 1.69 1.72Hyogo 1.23 1.26 1.27 1.29 1.29 1.31 1.31 1.32 1.34 1.36 1.36 1.38 1.38Nara 1.24 1.25 1.28 1.28 1.30 1.33 1.34 1.35 1.35 1.34 1.40 1.39 1.42Wakayama 1.22 1.25 1.27 1.30 1.30 1.28 1.27 1.28 1.30 1.32 1.34 1.29 1.30Tottori 1.53 1.57 1.57 1.58 1.64 1.64 1.66 1.66 1.68 1.69 1.68 1.61 1.58Shimane 1.57 1.57 1.59 1.64 1.66 1.63 1.63 1.64 1.65 1.68 1.67 1.66 1.71Okayama 1.73 1.74 1.73 1.80 1.81 1.78 1.77 1.82 1.82 1.85 1.87 1.86 1.92Hiroshima 1.71 1.76 1.77 1.79 1.81 1.85 1.86 1.89 1.93 2.00 1.98 1.98 1.92Yamaguchi 1.44 1.48 1.49 1.51 1.50 1.49 1.48 1.51 1.51 1.51 1.57 1.53 1.56Tokushima 1.35 1.38 1.37 1.39 1.39 1.41 1.41 1.44 1.45 1.45 1.41 1.37 1.43Kagawa 1.69 1.71 1.75 1.75 1.72 1.73 1.72 1.75 1.75 1.75 1.75 1.77 1.84Ehime 1.46 1.49 1.51 1.51 1.52 1.55 1.55 1.57 1.56 1.56 1.58 1.62 1.60Kochi 1.15 1.17 1.16 1.15 1.17 1.18 1.20 1.21 1.25 1.26 1.25 1.25 1.21Fukuoka 1.42 1.45 1.48 1.49 1.50 1.52 1.53 1.56 1.59 1.61 1.60 1.58 1.58Saga 1.19 1.21 1.21 1.21 1.23 1.26 1.27 1.26 1.25 1.27 1.29 1.28 1.29Nagasaki 1.14 1.16 1.17 1.17 1.17 1.19 1.19 1.21 1.22 1.21 1.25 1.25 1.22Kumamoto 1.53 1.60 1.61 1.64 1.64 1.64 1.61 1.64 1.66 1.69 1.65 1.63 1.64Oita 1.37 1.41 1.42 1.43 1.43 1.44 1.44 1.44 1.45 1.46 1.48 1.49 1.48Miyazaki 1.34 1.37 1.38 1.41 1.43 1.41 1.41 1.42 1.45 1.47 1.53 1.49 1.50Kagoshima 1.13 1.16 1.17 1.20 1.22 1.23 1.23 1.23 1.25 1.27 1.26 1.27 1.24Okinawa 1.03 1.11 1.12 1.15 1.13 1.12 1.11 1.14 1.15 1.16 1.17 1.14 1.12
Source
Active job openings-to-applicants ratio(S.A.)
Active job openings-to-applicants ratio by prefecture
MHLW "Employment Referrals for General Workers"
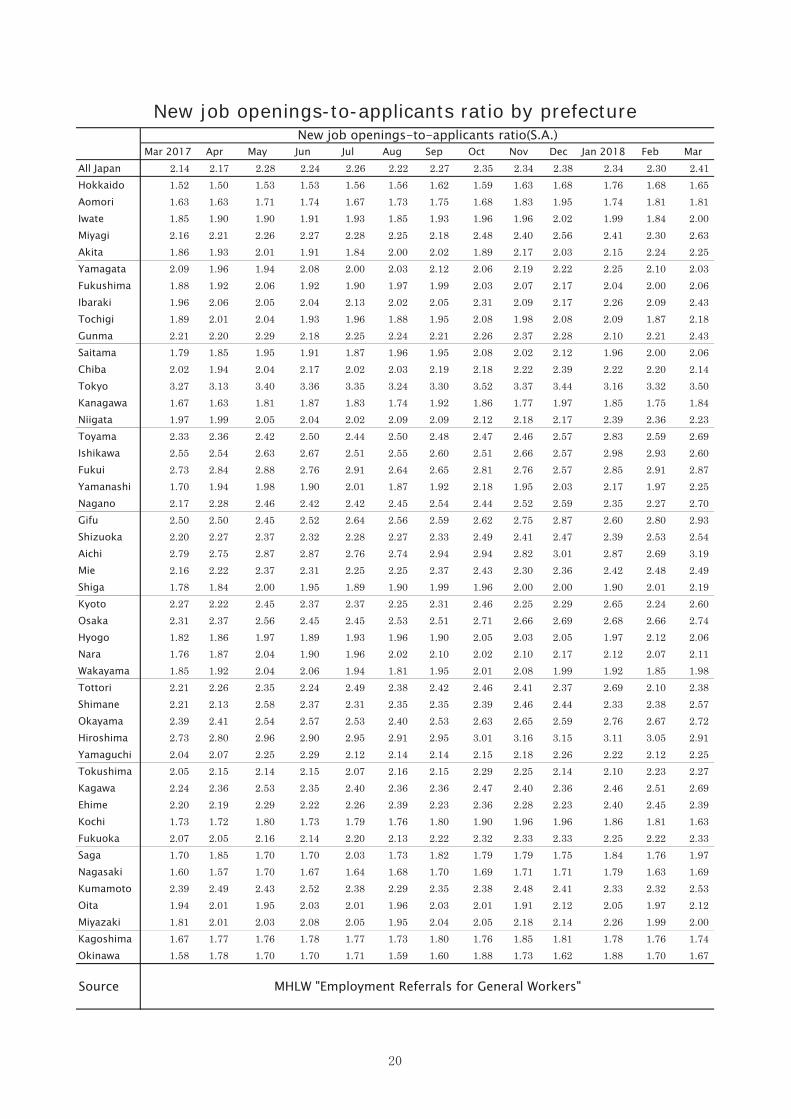
Mar 2017 Apr May Jun Jul Aug Sep Oct Nov Dec Jan 2018 Feb MarAll Japan 2.14 2.17 2.28 2.24 2.26 2.22 2.27 2.35 2.34 2.38 2.34 2.30 2.41Hokkaido 1.52 1.50 1.53 1.53 1.56 1.56 1.62 1.59 1.63 1.68 1.76 1.68 1.65Aomori 1.63 1.63 1.71 1.74 1.67 1.73 1.75 1.68 1.83 1.95 1.74 1.81 1.81Iwate 1.85 1.90 1.90 1.91 1.93 1.85 1.93 1.96 1.96 2.02 1.99 1.84 2.00Miyagi 2.16 2.21 2.26 2.27 2.28 2.25 2.18 2.48 2.40 2.56 2.41 2.30 2.63Akita 1.86 1.93 2.01 1.91 1.84 2.00 2.02 1.89 2.17 2.03 2.15 2.24 2.25Yamagata 2.09 1.96 1.94 2.08 2.00 2.03 2.12 2.06 2.19 2.22 2.25 2.10 2.03Fukushima 1.88 1.92 2.06 1.92 1.90 1.97 1.99 2.03 2.07 2.17 2.04 2.00 2.06Ibaraki 1.96 2.06 2.05 2.04 2.13 2.02 2.05 2.31 2.09 2.17 2.26 2.09 2.43Tochigi 1.89 2.01 2.04 1.93 1.96 1.88 1.95 2.08 1.98 2.08 2.09 1.87 2.18Gunma 2.21 2.20 2.29 2.18 2.25 2.24 2.21 2.26 2.37 2.28 2.10 2.21 2.43Saitama 1.79 1.85 1.95 1.91 1.87 1.96 1.95 2.08 2.02 2.12 1.96 2.00 2.06Chiba 2.02 1.94 2.04 2.17 2.02 2.03 2.19 2.18 2.22 2.39 2.22 2.20 2.14Tokyo 3.27 3.13 3.40 3.36 3.35 3.24 3.30 3.52 3.37 3.44 3.16 3.32 3.50Kanagawa 1.67 1.63 1.81 1.87 1.83 1.74 1.92 1.86 1.77 1.97 1.85 1.75 1.84Niigata 1.97 1.99 2.05 2.04 2.02 2.09 2.09 2.12 2.18 2.17 2.39 2.36 2.23Toyama 2.33 2.36 2.42 2.50 2.44 2.50 2.48 2.47 2.46 2.57 2.83 2.59 2.69Ishikawa 2.55 2.54 2.63 2.67 2.51 2.55 2.60 2.51 2.66 2.57 2.98 2.93 2.60Fukui 2.73 2.84 2.88 2.76 2.91 2.64 2.65 2.81 2.76 2.57 2.85 2.91 2.87Yamanashi 1.70 1.94 1.98 1.90 2.01 1.87 1.92 2.18 1.95 2.03 2.17 1.97 2.25Nagano 2.17 2.28 2.46 2.42 2.42 2.45 2.54 2.44 2.52 2.59 2.35 2.27 2.70Gifu 2.50 2.50 2.45 2.52 2.64 2.56 2.59 2.62 2.75 2.87 2.60 2.80 2.93Shizuoka 2.20 2.27 2.37 2.32 2.28 2.27 2.33 2.49 2.41 2.47 2.39 2.53 2.54Aichi 2.79 2.75 2.87 2.87 2.76 2.74 2.94 2.94 2.82 3.01 2.87 2.69 3.19Mie 2.16 2.22 2.37 2.31 2.25 2.25 2.37 2.43 2.30 2.36 2.42 2.48 2.49Shiga 1.78 1.84 2.00 1.95 1.89 1.90 1.99 1.96 2.00 2.00 1.90 2.01 2.19Kyoto 2.27 2.22 2.45 2.37 2.37 2.25 2.31 2.46 2.25 2.29 2.65 2.24 2.60Osaka 2.31 2.37 2.56 2.45 2.45 2.53 2.51 2.71 2.66 2.69 2.68 2.66 2.74Hyogo 1.82 1.86 1.97 1.89 1.93 1.96 1.90 2.05 2.03 2.05 1.97 2.12 2.06Nara 1.76 1.87 2.04 1.90 1.96 2.02 2.10 2.02 2.10 2.17 2.12 2.07 2.11Wakayama 1.85 1.92 2.04 2.06 1.94 1.81 1.95 2.01 2.08 1.99 1.92 1.85 1.98Tottori 2.21 2.26 2.35 2.24 2.49 2.38 2.42 2.46 2.41 2.37 2.69 2.10 2.38Shimane 2.21 2.13 2.58 2.37 2.31 2.35 2.35 2.39 2.46 2.44 2.33 2.38 2.57Okayama 2.39 2.41 2.54 2.57 2.53 2.40 2.53 2.63 2.65 2.59 2.76 2.67 2.72Hiroshima 2.73 2.80 2.96 2.90 2.95 2.91 2.95 3.01 3.16 3.15 3.11 3.05 2.91Yamaguchi 2.04 2.07 2.25 2.29 2.12 2.14 2.14 2.15 2.18 2.26 2.22 2.12 2.25Tokushima 2.05 2.15 2.14 2.15 2.07 2.16 2.15 2.29 2.25 2.14 2.10 2.23 2.27Kagawa 2.24 2.36 2.53 2.35 2.40 2.36 2.36 2.47 2.40 2.36 2.46 2.51 2.69Ehime 2.20 2.19 2.29 2.22 2.26 2.39 2.23 2.36 2.28 2.23 2.40 2.45 2.39Kochi 1.73 1.72 1.80 1.73 1.79 1.76 1.80 1.90 1.96 1.96 1.86 1.81 1.63Fukuoka 2.07 2.05 2.16 2.14 2.20 2.13 2.22 2.32 2.33 2.33 2.25 2.22 2.33Saga 1.70 1.85 1.70 1.70 2.03 1.73 1.82 1.79 1.79 1.75 1.84 1.76 1.97Nagasaki 1.60 1.57 1.70 1.67 1.64 1.68 1.70 1.69 1.71 1.71 1.79 1.63 1.69Kumamoto 2.39 2.49 2.43 2.52 2.38 2.29 2.35 2.38 2.48 2.41 2.33 2.32 2.53Oita 1.94 2.01 1.95 2.03 2.01 1.96 2.03 2.01 1.91 2.12 2.05 1.97 2.12Miyazaki 1.81 2.01 2.03 2.08 2.05 1.95 2.04 2.05 2.18 2.14 2.26 1.99 2.00Kagoshima 1.67 1.77 1.76 1.78 1.77 1.73 1.80 1.76 1.85 1.81 1.78 1.76 1.74Okinawa 1.58 1.78 1.70 1.70 1.71 1.59 1.60 1.88 1.73 1.62 1.88 1.70 1.67
Source MHLW "Employment Referrals for General Workers"
New job openings-to-applicants ratio(S.A.)New job openings-to-applicants ratio by prefecture

Medium-sizedEnterprises
SmallEnterprises
All industries Manufacturing Nonmanufacturing All industries All industries
%points %points %points %points %points2012 Jun 3 8 -3 1 1
Sep 2 7 -3 1 0Dec 4 10 -3 -1 0
2013 Mar 3 11 -6 -2 -3Jun 2 8 -4 -1 -1Sep -1 4 -7 -5 -7Dec -3 3 -11 -8 -12
2014 Mar -6 2 -14 -12 -15Jun -6 2 -14 -10 -12Sep -8 -1 -16 -13 -16Dec -9 -1 -18 -15 -18
2015 Mar -10 -2 -18 -17 -20Jun -9 -2 -17 -16 -16Sep -9 -4 -16 -18 -19Dec -12 -5 -20 -21 -21
2016 Mar -11 -3 -20 -21 -20Jun -10 -3 -18 -19 -19Sep -12 -5 -19 -20 -20Dec -13 -6 -19 -23 -24
2017 Mar -15 -8 -22 -26 -28Jun -16 -10 -21 -25 -27Sep -18 -11 -24 -30 -32Dec -19 -13 -25 -33 -34
2018 Mar -22 -18 -28 -34 -37Jun (-21) (-15) (-27) (-35) (-40)
NOTES : D.I. <"Excessive" minus "Insufficient"> ( ) Forecast Large enterprises = capital with 1 billion yen and more
Medium-sized enterprises = capital with 100 million yen to less than 1 billion yenSmall enterprises = capital with 20 million yen to less than 100 million yen.
Large Enterprises
Employment Condition
Source BOJ "TANKAN"
Employment Condition D.I.
-35-30-25-20-15-10
-505
1015
Jun Sep Dec Mar Jun Sep Dec Mar Jun Sep Dec Mar Jun Sep Dec Mar Jun Sep Dec Mar Jun Sep Dec Mar
2012 2013 2014 2015 2016 2017 2018
% points Employment Condition D.I. ("Excessive"minus"Insufficient")
ManufacturingNon manufacturing
Large Enterprises
Source: BOJ "TANKAN"
Exce
ssiv
eIn
suff
icie
nt
21

All industries Manufacturing All industries Manufacturing
% % points points2013 Nov 30 31 17 102014 Feb 28 30 22 14
May 28 31 18 13Aug 27 30 23 17Nov 27 31 22 17
2015 Feb 30 32 31 24May 28 33 28 24Aug 28 32 29 26Nov 28 31 33 27
2016 Feb 25 27 34 30May 26 31 32 29Aug 28 32 33 32Nov 27 29 36 31
2017 Feb 25 27 38 33May 27 26 35 34Aug 30 29 37 36Nov 29 29 38 38
2018 Feb 32 29 44 47May (28) (25)Aug (27) (23)
NOTES :
MHLW "Survey on Labour Economy Trend"
D.I. The number of establishments with too few workers minus the number of establishments with too manyworkers. ( ) Forecast
Employment Adjustment
Source
Ratio of establishment for employmentadjustment enforced.
Judgement on overs and shorts ofregular staff,etc D.I.
05
101520253035404550
Nov Feb May Aug Nov Feb May Aug Nov Feb May Aug Nov Feb May Aug Nov Feb
2013 2014 2015 2016 2017 2018
points Judgement on overs and shorts of Regular staff,etc D.I. ("Insufficient"minus"Excessive")
All industries Manufacturing
Source: MHLW "Survey on Labour Economy Trends"
Exce
ssiv
eIn
suff
icie
nt
22

Manufacturing Manufacturing
¥ % % % % % %314,126 -0.9 -0.2 -0.9 -0.2 -0.2 -0.3314,048 -0.4 -0.7 -0.9 -1.2 -0.9 -1.0316,567 0.4 1.8 -2.8 -1.6 -0.1 -0.4313,801 0.1 0.4 -0.9 -0.5 0.2 0.3315,590 0.5 0.6 0.7 0.7 0.2 0.2
2017 316,966 0.4 1.3 -0.2 0.7 0.4 0.42017 Jan 269,790 0.3 1.7 -0.1 1.2 0.4 0.6
Feb 262,845 0.4 1.1 0.0 0.7 0.1 0.2Mar 278,677 0.0 0.5 -0.3 0.1 -0.1 -0.1Apr 275,224 0.5 1.3 0.0 0.8 0.4 0.4May 269,968 0.6 1.2 0.0 0.6 0.5 0.7Jun 433,043 0.4 1.7 -0.1 1.2 0.5 0.5Jul 370,823 -0.6 0.7 -1.1 0.2 0.5 0.5
Aug 273,886 0.7 0.1 -0.1 -0.7 0.4 0.2Sep 267,248 0.9 2.7 -0.1 1.6 0.7 0.7Oct 267,433 0.2 1.0 -0.1 0.6 0.3 0.3Nov 277,885 0.9 1.1 0.1 0.5 0.4 0.3Dec 551,896 0.9 2.2 -0.3 1.1 0.6 0.6
2018 Jan 272,902 1.2 0.4 -0.6 -1.3 1.1 1.1Feb r 265,434 r 1.0 r 1.2 r -0.8 r -0.6 r 0.6 r 0.6
2016
MHLW "Monthly Labour Survey"Source
2014
Calendar year
Total cash earningsScheduled
cashearnings
2015
Average Monthly Cash Earnings of Regular Employees
NOTES : 5 or more regular employees
Real wages(Total cash earnings)
Annualpercentchange
Annualpercentchange
Contractualcash
earnings
2013
Annual percent change
2012
Annual percent change
-1.5
-1.0
-0.5
0.0
0.5
1.0
1.5
Jan Feb Mar Apr May Jun Jul Aug Sep Oct Nov Dec Jan Feb
2017 2018
%
Total cash earnings Scheduled cash… Real Wages
Annual percent changeTotal cash earnings·Scheduled cash earnings·Real wages (Total cash earnings)
Source: MHLW "Monthly Labour Survey"
23
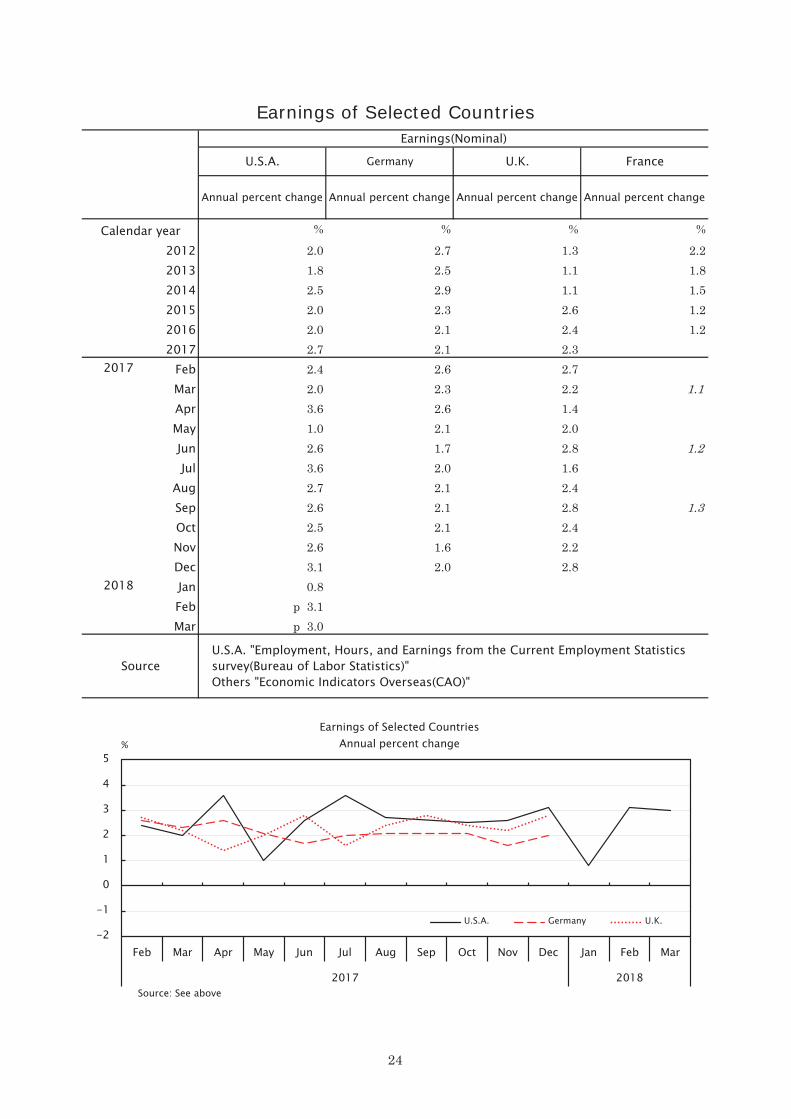
% % % %
2.0 2.7 1.3 2.21.8 2.5 1.1 1.82.5 2.9 1.1 1.52.0 2.3 2.6 1.22.0 2.1 2.4 1.22.7 2.1 2.3
2017 Feb 2.4 2.6 2.7Mar 2.0 2.3 2.2 1.1Apr 3.6 2.6 1.4May 1.0 2.1 2.0Jun 2.6 1.7 2.8 1.2Jul 3.6 2.0 1.6
Aug 2.7 2.1 2.4Sep 2.6 2.1 2.8 1.3Oct 2.5 2.1 2.4Nov 2.6 1.6 2.2Dec 3.1 2.0 2.8
2018 Jan 0.8Feb p 3.1Mar p 3.0
20162015
U.S.A. "Employment, Hours, and Earnings from the Current Employment Statisticssurvey(Bureau of Labor Statistics)"Others "Economic Indicators Overseas(CAO)"
Calendar year
Earnings of Selected Countries
Annual percent change Annual percent change Annual percent change Annual percent change
2017
201220132014
Source
Earnings(Nominal)
U.S.A. Germany U.K. France
-2
-1
0
1
2
3
4
5
Feb Mar Apr May Jun Jul Aug Sep Oct Nov Dec Jan Feb Mar
2017 2018
%
Earnings of Selected CountriesAnnual percent change
U.S.A. Germany U.K.
Source: See above
24

Men Women Men WomenCalendar year ¥thous. ¥thous. ¥thous. ¥thous.
1990 133.0 126.0 169.9 162.91991 140.8 133.2 179.4 172.31992 146.6 139.5 186.9 180.11993 150.6 142.4 190.3 181.91994 153.8 145.5 192.4 184.51995 154.0 144.7 194.2 184.01996 154.5 146.1 193.2 183.61997 156.0 147.3 193.9 186.21998 156.5 147.9 195.5 186.31999 157.6 148.3 196.6 188.72000 157.1 147.6 196.9 187.42001 158.1 148.7 198.3 188.62002 157.5 148.8 198.5 188.82003 157.5 147.0 201.3 192.52004 156.1 147.2 198.3 189.52005 155.7 148.0 196.7 189.32006 157.6 149.4 199.8 190.82007 158.8 150.8 198.8 191.42008 160.0 154.3 201.3 194.62009 160.8 153.0 201.4 194.92010 160.7 153.2 200.3 193.52011 159.4 151.8 205.0 197.92012 160.1 153.6 201.8 196.52013 158.9 151.3 200.2 195.12014 161.3 154.2 202.9 197.22015 163.4 156.2 204.5 198.82016 163.5 157.2 205.9 200.02017 164.2 158.4 207.8 204.1
Starting Monthly Salary for New GraduatesStarting Monthly salary for new graduates
Graduates of senior high schools Graduates of universities
MHLW "Basic Survey on Wage Structures"Source
150
160
170
180
190
200
210
220
1990 91 92 93 94 95 96 97 98 99 2000 01 02 03 04 05 06 07 08 09 10 11 12 13 14 15 16 17
¥thous. Starting Monthly Salary for New Graduates of Universities
MenWomen
Source: MHLW "Basic Survey on Wage Structures"
25

Calendar year ¥ ¥ % % %1990 15,026 11,050 5.94 5.53 4.61991 14,911 11,447 5.65 5.52 4.11992 13,662 10,707 4.95 4.98 3.41993 11,077 8,699 3.89 3.91 1.61994 9,118 6,902 3.13 3.04 1.31995 8,376 6,184 2.83 2.69 0.11996 8,712 6,148 2.86 2.64 0.51997 8,927 6,213 2.90 2.63 0.31998 8,323 5,381 2.66 2.24 -0.01999 7,005 4,042 2.21 1.67 -0.72000 6,499 3,798 2.06 1.56 -0.72001 6,328 3,775 2.01 1.54 -0.12002 5,265 2,913 1.66 1.19 -1.32003 5,233 2,860 1.63 1.17 -0.72004 5,348 3,048 1.67 1.26 -0.72005 5,422 3,359 1.71 1.37 -0.22006 5,661 3,587 1.79 1.47 -0.12007 5,890 3,807 1.87 1.55 0.12008 6,149 3,787 1.99 1.54 -0.52009 5,630 1.83 -1.72010 5,516 1.82 -0.52011 5,555 1.83 -0.12012 5,400 1.78 -0.12013 5,478 1.80 -1.02014 6,711 2.19 0.62015 7,367 2.38 1.22016 6,639 2.14 0.12017 6,570 2.11
Survey on "Small and medium enterprises" is ceased in 2009. on Wage Structure by fixing the structure of employee(sex, educational level, age, and years of service).
Major enterprises Small and mediumenterprises Major enterprises
Laspeyres WageIndex
Annual ChangeSmall and mediumenterprises
NOTES: Laspeyres Wage Index is estimated based on data from the Ministry of Health, Labour and Welfare's Basic Survey
SourceMHLW
"Conditions Relating to Claim and Result ofSpring Wage Negotiation"
JILPT "Useful LaborStatistics"
Springtime Wage Increase
Average pay raise agreed upon Wage-increase percentage
0
1
2
3
4
5
6
7
199091 92 93 94 95 96 97 98 99200001 02 03 04 05 06 07 08 09 10 11 12 13 14 15 16 17
% Springtime wage-increase percentage
Major enterprises
Small and medium enterprises
Source: MHLW "Conditions Relating to Claim and Result of Spring Wage Negotiation"
26

Calendar year ¥ % ¥ % ¥ % ¥ %1990 697,946 8.0 424,084 765,542 6.8 492,1741991 736,444 5.5 453,127 6.3 794,011 3.6 511,549 3.51992 759,721 2.7 463,154 2.2 796,447 0.2 510,969 -0.21993 751,793 -0.9 457,116 -1.3 786,656 -0.3 512,871 0.41994 749,982 -1.1 460,874 0.7 796,035 0.1 504,242 -1.81995 750,221 0.4 463,660 0.5 798,848 1.9 512,219 1.51996 773,481 3.3 470,819 1.8 819,667 2.8 519,376 1.71997 798,340 2.9 478,058 1.5 848,575 2.8 519,072 -0.11998 810,685 1.11 467,902 -2.1 833,801 -1.83 504,221 -2.91999 768,230 -5.65 440,665 -3.9 801,235 -4.40 477,805 -3.42000 758,804 -0.54 442,921 0.1 799,232 0.76 471,809 -1.62001 783,113 2.86 438,079 -1.6 812,934 1.76 454,251 -4.12002 749,803 -4.30 412,853 -7.1 755,551 -5.88 432,261 -5.62003 781,930 3.00 418,818 2.0 771,540 1.97 428,475 -0.92004 810,052 3.53 405,462 -1.5 811,082 3.87 430,278 2.22005 839,313 4.03 410,618 1.3 840,516 5.39 433,214 1.02006 841,817 2.94 416,054 1.3 841,854 2.53 433,825 0.12007 843,779 2.27 407,637 -1.4 845,119 1.47 417,507 -3.42008 842,270 -0.29 406,012 -1.0 831,813 -0.63 424,437 1.02009 710,844 -14.33 363,104 -9.8 726,933 -12.64 380,258 -9.42010 711,890 0.01 367,178 1.0 733,935 0.68 379,292 -0.42011 747,187 4.70 364,252 -0.9 761,294 3.64 372,470 -1.92012 726,345 -2.33 358,366 -1.6 739,295 -2.26 365,680 -1.92013 746,334 1.85 359,308 -0.1 761,364 1.81 366,856 -0.12014 800,653 6.97 370,550 2.7 800,638 6.02 375,431 1.92015 832,292 4.59 356,791 -2.8 830,434 3.08 370,367 -0.32016 843,577 0.82 365,008 2.3 830,609 0.71 370,162 -0.12017 825,150 -0.62 366,502 0.4 830,625 -0.78 380,654 2.8
Source MHLW "The Result ofSummer Bonus"
MHLW "Monthly LabourSurvey"
MHLW "The Result ofYear-end Bonus"
MHLW "Monthly LabourSurvey"
Annualpercentchange
(5 employees or more)Industries covered
(5 employees or more)Annualpercentchange
Annualpercentchange
BonusesSummer Year-end
Principal Enterprises Principal Enterprises
Annualpercentchange
Industries covered
-16-14-12-10-8-6-4-202468
10
199091 92 93 94 95 96 97 98 99200001 02 03 04 05 06 07 08 09 10 11 12 13 14 15 16 17
% Bonuses(Summer,Year-end)
Summer Year-end
Summer Year-end
Source: MHLW "The Result of Summer Bonus", "The Result of Year-end Bonus", "Monthly Labour Survey"
Annual percent change
principal enterprises
industriescovered(5employees or more)
27
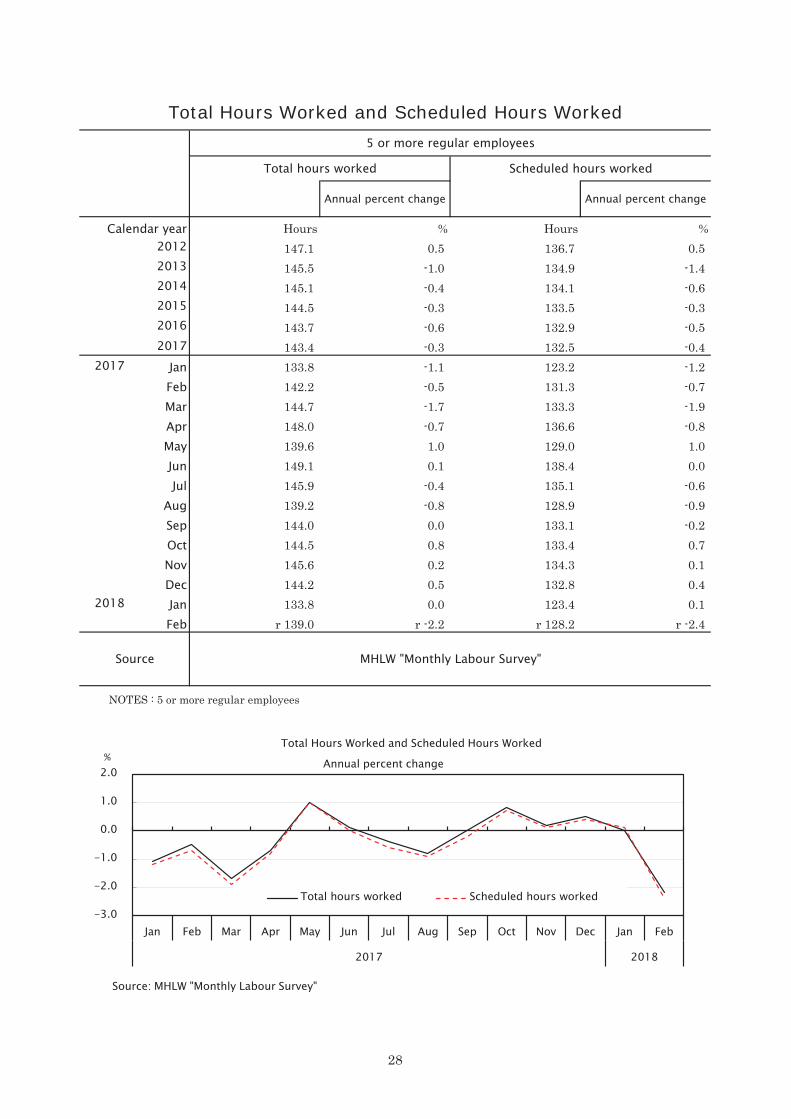
Hours % Hours %147.1 0.5 136.7 0.5145.5 -1.0 134.9 -1.4145.1 -0.4 134.1 -0.6144.5 -0.3 133.5 -0.3143.7 -0.6 132.9 -0.5
2017 143.4 -0.3 132.5 -0.42017 Jan 133.8 -1.1 123.2 -1.2
Feb 142.2 -0.5 131.3 -0.7Mar 144.7 -1.7 133.3 -1.9Apr 148.0 -0.7 136.6 -0.8May 139.6 1.0 129.0 1.0Jun 149.1 0.1 138.4 0.0Jul 145.9 -0.4 135.1 -0.6
Aug 139.2 -0.8 128.9 -0.9Sep 144.0 0.0 133.1 -0.2Oct 144.5 0.8 133.4 0.7Nov 145.6 0.2 134.3 0.1Dec 144.2 0.5 132.8 0.4
2018 Jan 133.8 0.0 123.4 0.1Feb r 139.0 r -2.2 r 128.2 r -2.4
NOTES : 5 or more regular employees
5 or more regular employees
Annual percent change
Source
Total Hours Worked and Scheduled Hours Worked
Annual percent change
MHLW "Monthly Labour Survey"
Total hours worked
2014
20162015
Scheduled hours worked
Calendar year20122013
-3.0
-2.0
-1.0
0.0
1.0
2.0
Jan Feb Mar Apr May Jun Jul Aug Sep Oct Nov Dec Jan Feb
2017 2018
%
Total hours worked Scheduled hours worked
Annual percent change
Total Hours Worked and Scheduled Hours Worked
Source: MHLW "Monthly Labour Survey"
28
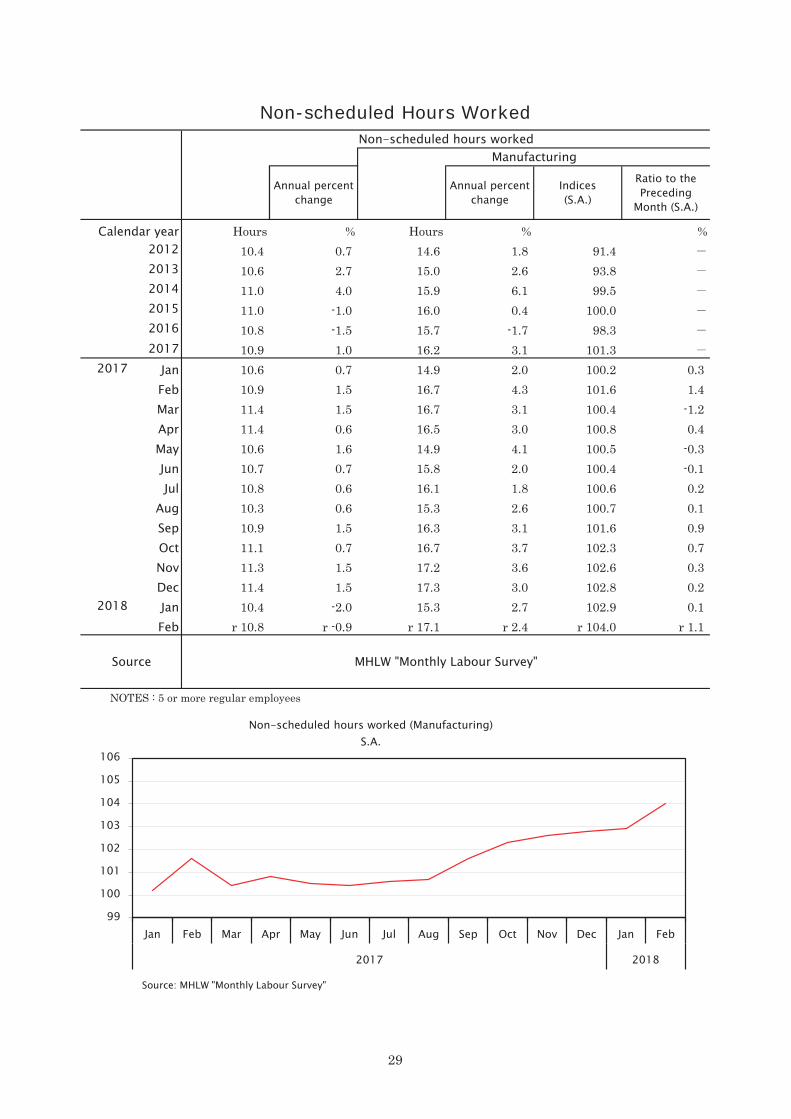
Hours % Hours % %10.4 0.7 14.6 1.8 91.410.6 2.7 15.0 2.6 93.811.0 4.0 15.9 6.1 99.511.0 -1.0 16.0 0.4 100.010.8 -1.5 15.7 -1.7 98.3
2017 10.9 1.0 16.2 3.1 101.32017 Jan 10.6 0.7 14.9 2.0 100.2 0.3
Feb 10.9 1.5 16.7 4.3 101.6 1.4Mar 11.4 1.5 16.7 3.1 100.4 -1.2Apr 11.4 0.6 16.5 3.0 100.8 0.4May 10.6 1.6 14.9 4.1 100.5 -0.3Jun 10.7 0.7 15.8 2.0 100.4 -0.1Jul 10.8 0.6 16.1 1.8 100.6 0.2
Aug 10.3 0.6 15.3 2.6 100.7 0.1Sep 10.9 1.5 16.3 3.1 101.6 0.9Oct 11.1 0.7 16.7 3.7 102.3 0.7Nov 11.3 1.5 17.2 3.6 102.6 0.3Dec 11.4 1.5 17.3 3.0 102.8 0.2
2018 Jan 10.4 -2.0 15.3 2.7 102.9 0.1Feb r 10.8 r -0.9 r 17.1 r 2.4 r 104.0 r 1.1
NOTES : 5 or more regular employees
MHLW "Monthly Labour Survey"Source
Non-scheduled hours worked
Annual percentchange
Manufacturing
Indices(S.A.)
2013201420152016
Non-scheduled Hours Worked
Ratio to thePreceding
Month (S.A.)
Annual percentchange
Calendar year2012
99
100
101
102
103
104
105
106
Jan Feb Mar Apr May Jun Jul Aug Sep Oct Nov Dec Jan Feb
2017 2018
Non-scheduled hours worked (Manufacturing)S.A.
Source: MHLW "Monthly Labour Survey"
29
Annual change Annual changeCalendar year
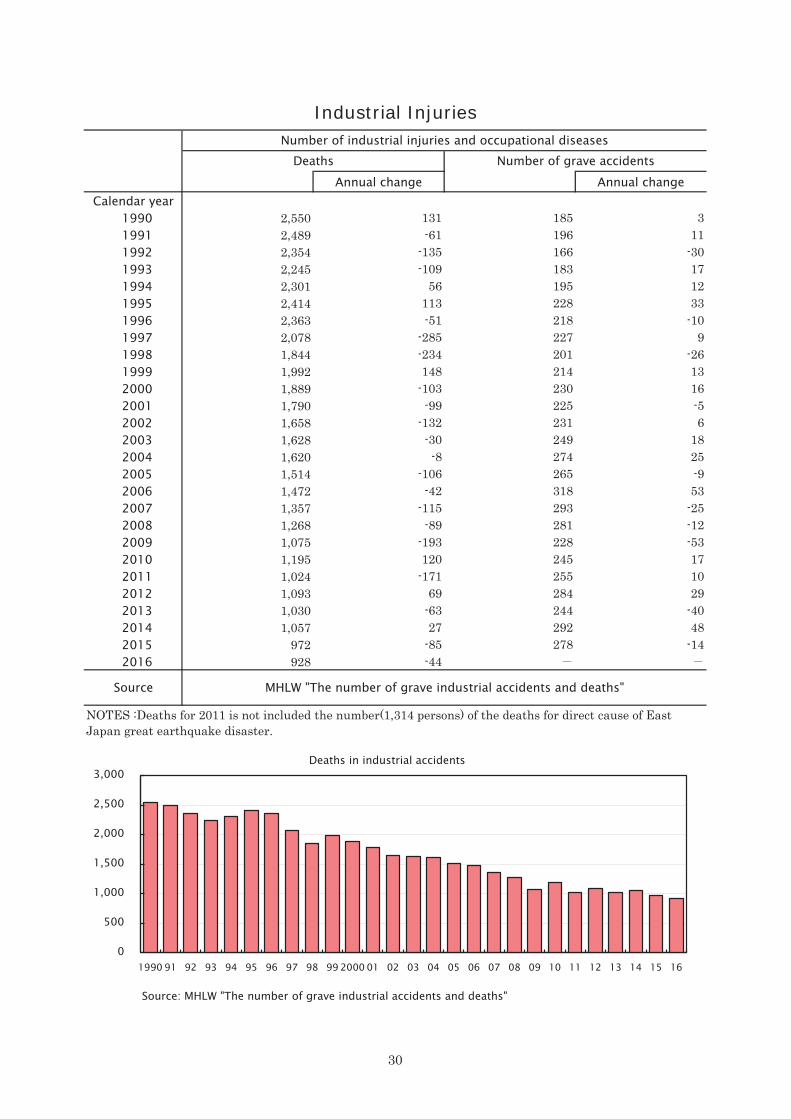
1990 2,550 131 185 3 1991 2,489 -61 196 11 1992 2,354 -135 166 -30 1993 2,245 -109 183 17 1994 2,301 56 195 12 1995 2,414 113 228 33 1996 2,363 -51 218 -10 1997 2,078 -285 227 9 1998 1,844 -234 201 -26 1999 1,992 148 214 13 2000 1,889 -103 230 16 2001 1,790 -99 225 -5 2002 1,658 -132 231 6 2003 1,628 -30 249 18 2004 1,620 -8 274 25 2005 1,514 -106 265 -9 2006 1,472 -42 318 53 2007 1,357 -115 293 -25 2008 1,268 -89 281 -12 2009 1,075 -193 228 -53 2010 1,195 120 245 17 2011 1,024 -171 255 10 2012 1,093 69 284 29 2013 1,030 -63 244 -40 2014 1,057 27 292 48 2015 972 -85 278 -14 2016 928 -44
Deaths
NOTES :Deaths for 2011 is not included the number(1,314 persons) of the deaths for direct cause of EastJapan great earthquake disaster.
Source MHLW "The number of grave industrial accidents and deaths"
Industrial InjuriesNumber of industrial injuries and occupational diseases
Number of grave accidents
0
500
1,000
1,500
2,000
2,500
3,000
1990 91 92 93 94 95 96 97 98 99 2000 01 02 03 04 05 06 07 08 09 10 11 12 13 14 15 16
Deaths in industrial accidents
Source: MHLW "The number of grave industrial accidents and deaths"
30

¥ % ¥ % %518,506 1.6 425,005 1.1 1.1523,589 1.0 426,132 0.3 -0.2519,761 -0.7 423,541 -0.6 -3.8525,669 1.1 427,270 0.9 -0.1526,973 0.2 428,697 0.3 0.4533,820 1.3 434,415 1.3 0.7
2017 Jan 441,064 1.6 360,495 1.3 0.7Feb 484,038 1.1 402,541 2.1 1.7Mar 445,607 -1.1 363,023 -1.7 -2.0Apr 472,047 -1.7 384,297 -1.0 -1.5May 421,497 -1.2 308,120 -1.7 -2.2Jun 735,477 0.6 593,992 0.7 0.2Jul 598,042 4.1 480,878 2.7 2.1
Aug 485,099 1.0 401,134 2.4 1.6Sep 437,497 3.0 358,526 3.2 2.3Oct 501,416 3.2 415,634 2.7 2.4Nov 443,186 2.5 361,293 2.7 2.0Dec 940,875 1.7 783,054 1.7 0.4
2018 Jan 442,129 0.2 360,360 0.0 -1.7Feb 503,989 4.1 420,059 4.4 2.6
201220132014
Family Income and Expenditure - Income
Annual percentchange(Nominal)
Annual percentchange(Real)
Calendar year
2017
20152016
MIC "Family Income and Expenditure Survey"Source
Workers' households(Two-or-more-person)
Income Disposable income
Annual percentchange(Nominal)
-3
-2
-1
0
1
2
3
4
Jan Feb Mar Apr May Jun Jul Aug Sep Oct Nov Dec Jan Feb
2017 2018
%Annual percent change
Source: MIC "Family Income and Expenditure Survey"
Real Disponsable income(Salary workers' households -Two-or-more-persons-)
31

All householdsConsumptionexpenditures
¥ % % % %313,874 1.6 1.6 73.9 1.1319,170 1.7 1.2 74.9 1.0318,755 -0.1 -3.3 75.3 -2.9315,379 -1.1 -2.1 73.8 -2.3309,591 -1.8 -1.7 72.2 -1.7
2017 313,057 1.1 0.5 72.1 -0.32017 Jan 307,150 -1.7 -2.3 85.2 -1.2
Feb 298,092 0.1 -0.3 74.1 -3.8Mar 337,075 0.7 0.4 92.9 -1.3Apr 329,949 -2.4 -2.9 85.9 -1.4May 315,194 2.8 2.3 102.3 -0.1Jun 296,653 7.2 6.7 49.9 2.3Jul 308,818 2.1 1.5 64.2 -0.2
Aug 301,574 0.0 -0.8 75.2 0.6Sep 295,211 -0.4 -1.3 82.3 -0.3Oct 313,733 2.6 2.3 75.5 0.0Nov 301,164 2.4 1.7 83.4 1.7Dec 352,076 0.8 -0.5 45.0 -0.1
2018 Jan 317,659 3.4 1.7 88.2 2.0Feb 289,177 -3.0 -4.7 68.8 0.1
Source
Family Income and Expenditure - Consumption Expenditures
Annual percentchange(Nominal)
Annual percentchange (Real)
Consumption expenditures
Two-or-more-person Households
Annual percentchange (Real)
Averagepropensity to
consume
MIC "Family Income and Expenditure Survey"
20152016
20132014
Workers Households
Calendar year2012
-6
-4
-2
0
2
4
6
8
Jan Feb Mar Apr May Jun Jul Aug Sep Oct Nov Dec Jan Feb
2017 2018
Consumption Expenditures (Real)
Two-or-more-person Households Workers Households
Annual percent change%
Source: MIC "Family Income and Expenditure Survey"
32

Fiscal year % % %1991 37.4 26.6 10.71992 36.3 25.1 11.21993 36.3 24.8 11.51994 35.4 23.5 11.91995 35.8 23.4 12.41996 35.5 23.1 12.41997 36.5 23.6 12.91998 36.3 23.0 13.31999 35.5 22.3 13.22000 36.0 22.9 13.12001 36.7 22.8 13.92002 35.2 21.3 13.92003 34.4 20.6 13.72004 35.0 21.3 13.72005 36.3 22.5 13.82006 37.2 23.1 14.12007 38.2 23.7 14.52008 39.3 23.5 15.82009 37.2 21.3 15.82010 37.2 21.6 15.72011 38.8 22.1 16.62012 39.7 22.7 17.02013 r 39.9 r 23.1 16.82014 r 42.1 25.0 17.22015 r 42.6 r 25.4 r 17.22016 r 42.8 r 25.1 r 17.72017 r 42.7 r 25.0 r 17.72018 42.5 24.9 17.6
Source MOF "National Burden Ratio"
NOTES : 2017,2018 = Forecast
Ratio of Income Tax and Social Security Contributions to National Income
Ratio of income tax and socialsecurity contributions to
national incomeTax burden Social security burden
0
10
20
30
40
50
1991 92 93 94 95 96 97 98 99 2000 01 02 03 04 05 06 07 08 09 10 11 12 13 14 15 16 17 18
Ratio of Income Tax and Social Security Contributions to National Income
Social security burden Tax burden
Source: MOF "National Burden Ratio"
%
33

10thous. % % % %1,226 25.2 61.0 24.0 2.01,240 24.5 58.7 23.3 1.81,254 24.4 57.2 22.5 1.81,266 24.2 58.2 22.0 1.81,270 24.1 59.8 21.6 1.71,261 23.8 59.9 21.2 1.61,245 23.2 58.1 20.5 1.61,229 22.6 58.4 20.1 1.51,209 22.4 56.9 19.6 1.51,183 22.2 57.2 19.5 1.41,154 21.5 54.2 18.8 1.41,121 20.7 53.5 17.7 1.31,080 20.2 54.8 16.8 1.31,053 19.6 51.9 16.6 1.21,031 19.2 50.6 15.8 1.21,014 18.7 47.7 15.0 1.21,004 18.2 46.7 14.8 1.11,008 18.1 47.5 14.3 1.11,007 18.1 45.3 13.9 1.11,008 18.5 46.2 14.2 1.11,005 18.5 46.6 14.2 1.1
996 * 18.1 - - -989 17.9 45.8 13.3 1.0988 17.7 44.9 13.1 1.0985 17.5 45.3 12.4 1.0988 17.4 45.7 12.2 0.9994 17.3 44.3 12.2 0.9998 17.1 44.3 11.8 0.9
NOTES:
Industrial Relations
1996 1997 1998
2009 2010
2014 2013
2011 2012
2002
100 ~ 999employees
1993 1994 1995
Source
2005 2006 2007 2008
*Figure for the estimated density rate for 2011 is used the numbers from“Supplementary-estimatedfigures for Labour Force Survey in June 2011 due to the Great East Japan Earthquake” was postedby Statistics Bureau of MIC. It requires attention to analyze chronologically."-" means that the estimated density rate by size of establishment is not calculated because the dataof number of employees of whole Japan (including Iwate, Miyagi and Fukushima prefectures) is notavailable in Labour Force Survey in June 2011.
MHLW "Basic Survey on Labour Unions"
Estimateddensity rate
Calendar year 1990 1991 1992
2003 2004
Unionmembership
2017
2015 2016
1 ~ 99 employees
Private enterprises Estimated density rate (by size of establishment)
1000 employees andover
1999 2000 2001
5
10
15
20
25
30
900950
1,0001,0501,1001,1501,2001,2501,3001,3501,400
199091 92 93 94 95 96 97 98 99200001 02 03 04 05 06 07 08 09 10 11 12 13 14 15 16 17
Union membership and Density Rate(Estimated)
Union membership Estimated density rate
10thous. %
Source: MHLW "Basic Survey on Labour Unions"
34

Calendar year1990 16.0 31.2 9.8 18.41991 16.0 36.0 9.6 17.21992 15.7 33.9 9.61993 15.7 31.8 9.31994 15.5 30.4 8.9 14.51995 14.9 29.2 32.4 8.7 13.81996 14.5 27.8 31.4 8.3 13.31997 14.1 27.0 30.7 8.3 12.21998 13.9 25.9 29.9 8.2 12.61999 13.9 25.3 29.7 8.1 11.92000 13.4 24.6 29.8 8.0 12.02001 13.3 23.7 29.3 7.9 12.02002 13.3 23.5 28.8 8.1 11.62003 12.9 23.0 29.3 7.9 11.02004 12.5 22.2 28.8 7.7 10.62005 12.5 21.7 28.6 7.7 10.32006 12.0 20.7 28.3 7.6 10.32007 12.1 19.9 28.0 7.5 10.82008 12.4 19.1 27.5 7.6 10.52009 12.3 18.9 27.4 7.7 10.12010 11.9 18.6 26.6 7.7 9.82011 11.8 18.5 26.0 7.7 10.12012 11.3 18.3 26.1 7.7 10.32013 11.3 18.1 25.6 7.7 10.32014 11.1 25.0 10.32015 11.1 24.72016 10.7 23.52017 10.7
Source
U.S.A "Union Members in 2017(Bureau of Labor Statistics)"U.K. "Trade Union Membership 2015(Dept. for Business, Innovation & Skills)"Germany,France "Trade Union Density in OECD countries(OECD)"KOREA (Ministry of Employment and Labor)
Trade Union Density Rate of Selected Countries
Trade Union Density Rate
U.S.A. U.K.Germany France Korea
05
10152025303540
1990 91 92 93 94 95 96 97 98 99 2000 01 02 03 04 05 06 07 08 09 10 11 12 13 14 15 16 17
Trade Union Density Rate of Selected Countries
U.S.A. U.K. Germany France Korea%
Source: See abobe
35