Embed Size (px)
Citation preview

1
TMA
Mahmoud M. El-HalwagiDepartment of Chemical Engineering
Texas A&M UniversityCollege Station, Texas 77843-3122
USAE-Mail: [email protected]
http://cheweb.tamu.edu/faculty/El-Halwagi
Pan American Advanced Studies Institute Program on Process Systems Engineering August 16-25, 2005, Iguazu Falls
2
Reactor Decanter
Scrubber
Distillation
BoilerSJE
OxygenAmmoniaPropylene
WaterBFW
Tail Gases
ANto Sales
Wastewater(to Biotreatment)
OffgasCondensate
AqueousLayer Distillation
Bottoms
EjectorCondensate
Bottleneck
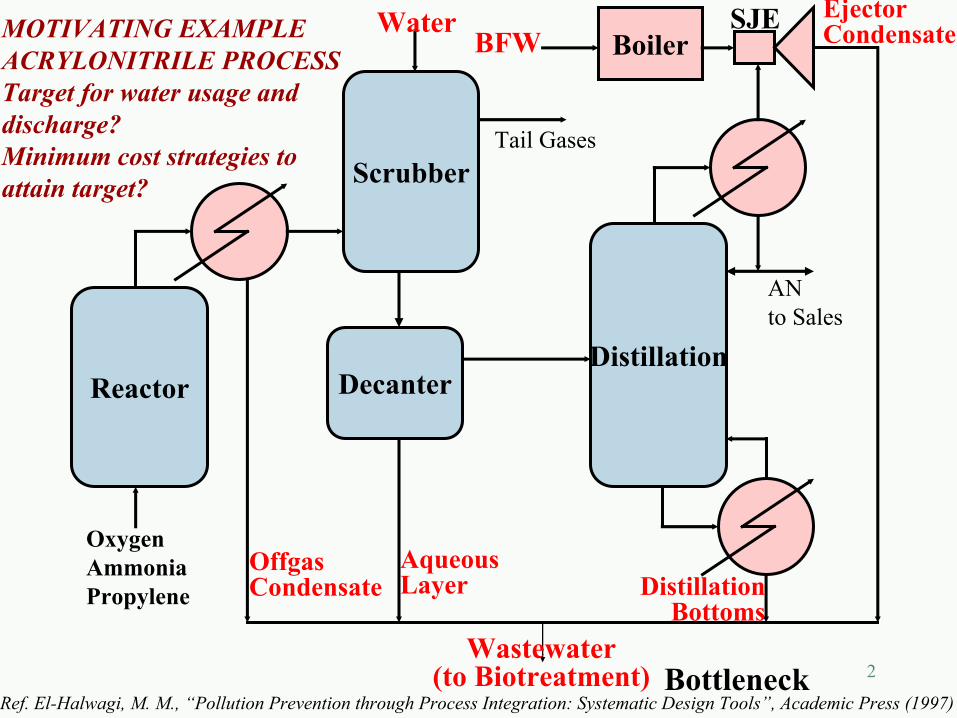
MOTIVATING EXAMPLEACRYLONITRILE PROCESSTarget for water usage and discharge?Minimum cost strategies to attain target?
Ref. El-Halwagi, M. M., “Pollution Prevention through Process Integration: Systematic Design Tools”, Academic Press (1997)
3
Reactor Decanter
Scrubber
Distillation
OxygenAmmoniaPropylene
Tail Gases
ANto Sales
Wastewater(to Biotreatment)
OffgasCondensate
AqueousLayer Distillation
Bottoms
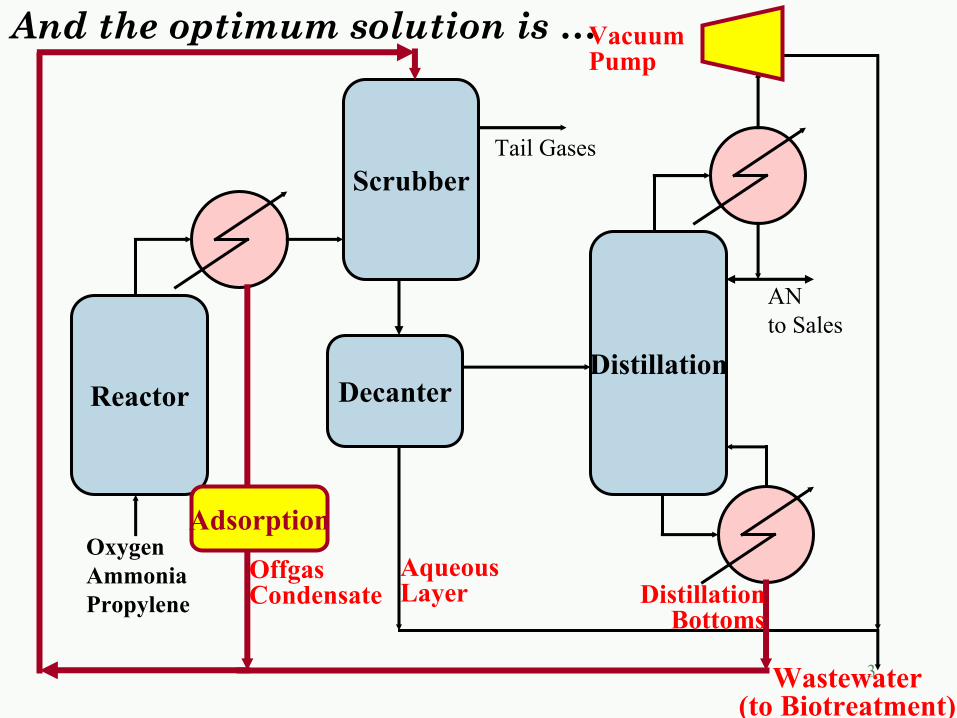
VacuumPump
Adsorption
And the optimum solution is …
4
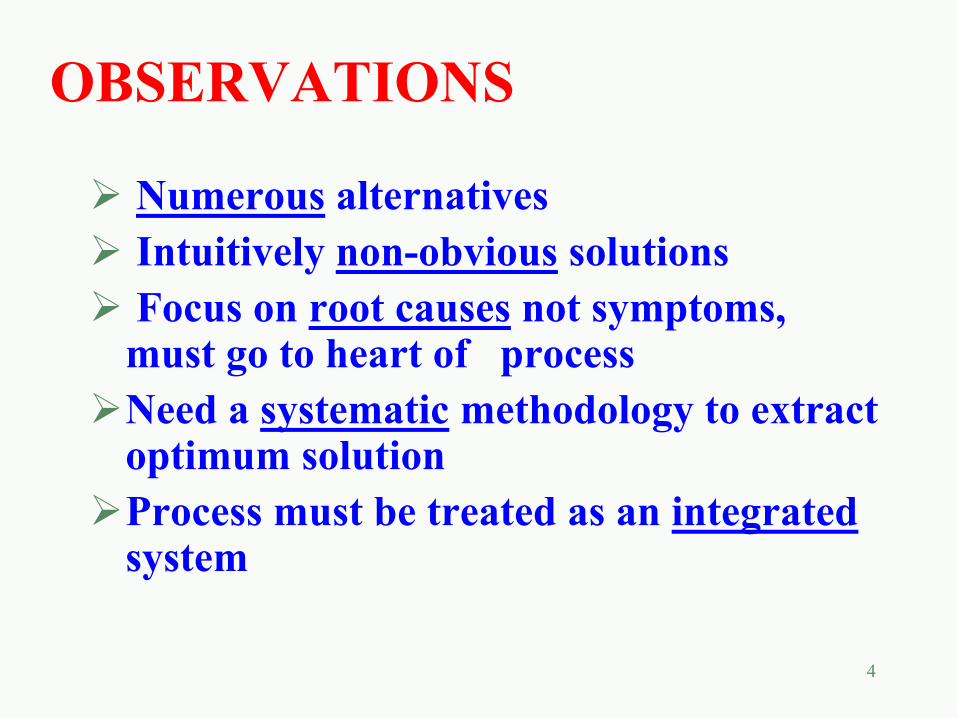
OBSERVATIONS
Numerous alternativesIntuitively non-obvious solutionsFocus on root causes not symptoms, must go to heart of process Need a systematic methodology to extract optimum solutionProcess must be treated as an integratedsystem
5
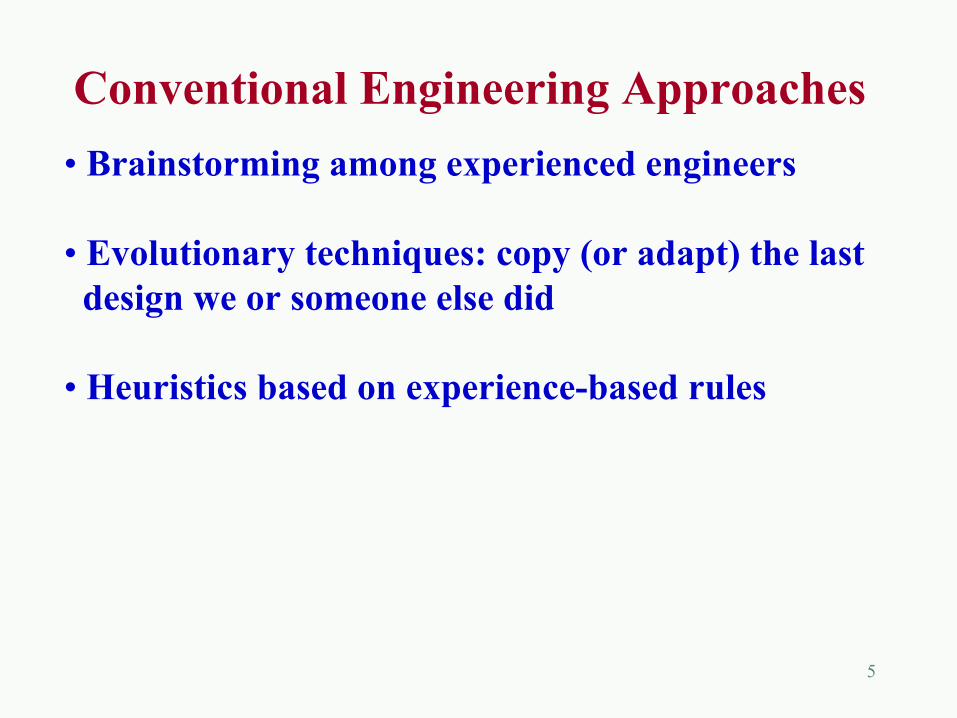
Conventional Engineering Approaches• Brainstorming among experienced engineers
• Evolutionary techniques: copy (or adapt) the last design we or someone else did
• Heuristics based on experience-based rules
6
State of the art:Systematic, fundamental, and generally applicable techniques can be learned and applied to synthesize optimal designs for improving process performance.
This is possible via Process Synthesis and Integration + Optimization:
You will learn the fundamentalsand applications of process synthesis, integration,
and optimization
7
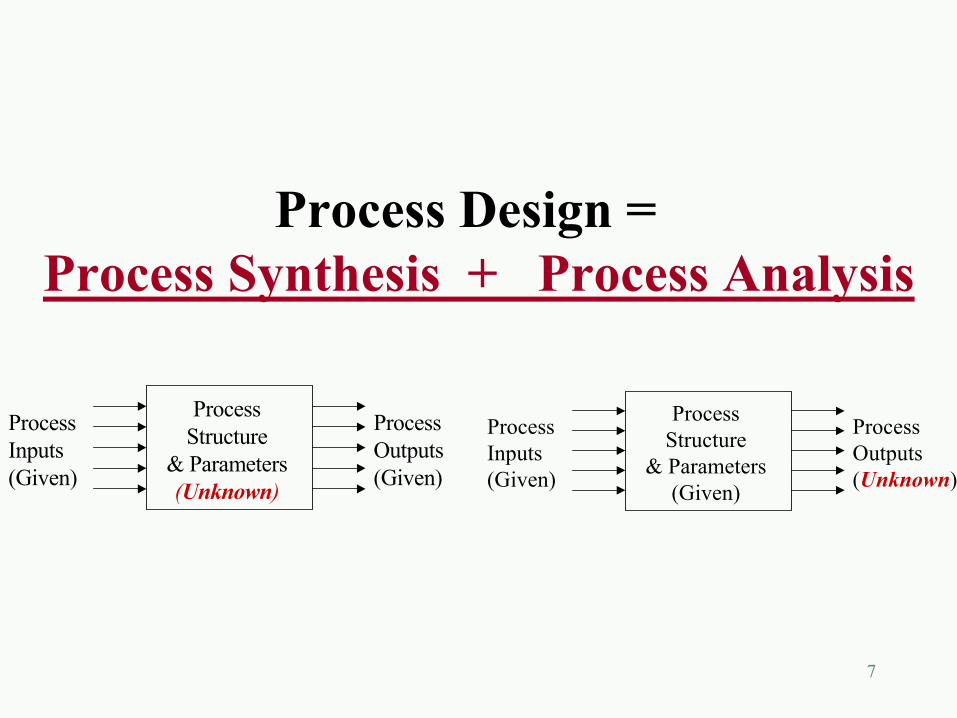
Process Design = Process Synthesis + Process Analysis
Process Inputs(Given)
Process Outputs(Given)
ProcessStructure
& Parameters(Unknown)
Process Inputs(Given)
Process Outputs(Unknown)
ProcessStructure
& Parameters(Given)
8
PROCESS INTEGRATION
A holistic approach to process design and operation that
emphasizes the unity of the process and optimizes its
design and operation
9
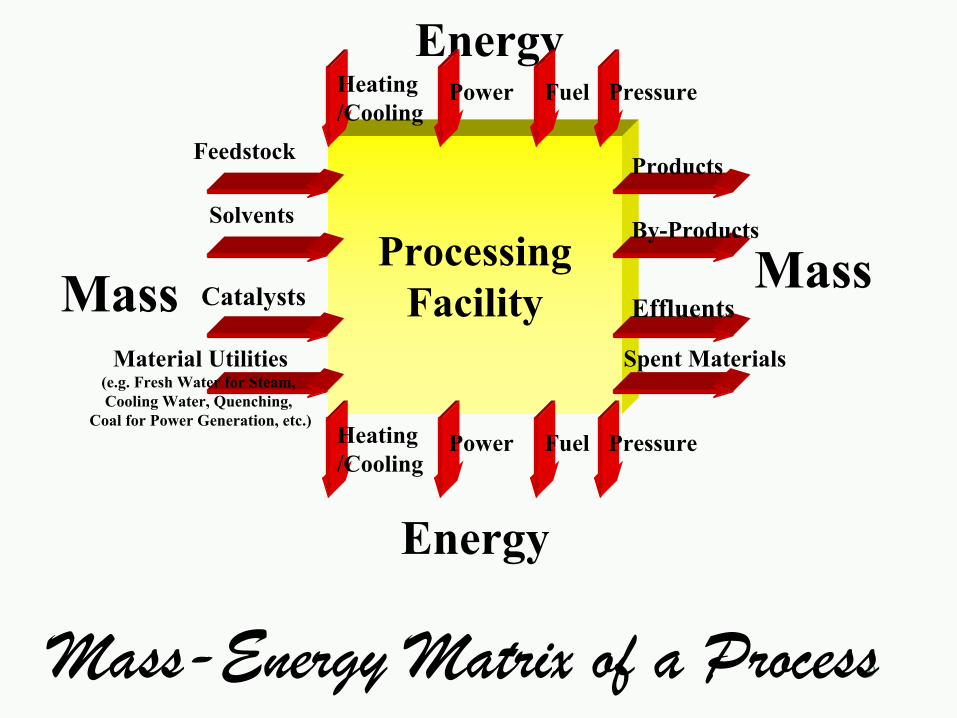
ProcessingFacility
Feedstock
Material Utilities(e.g. Fresh Water for Steam, Cooling Water, Quenching,
Coal for Power Generation, etc.)
Solvents
CatalystsMass
Products
By-Products
Effluents
Spent Materials
Mass
Energy
Energy
Mass-Energy Matrix of a Process
Heating/Cooling
FuelPower Pressure
Heating/Cooling
FuelPower Pressure
10
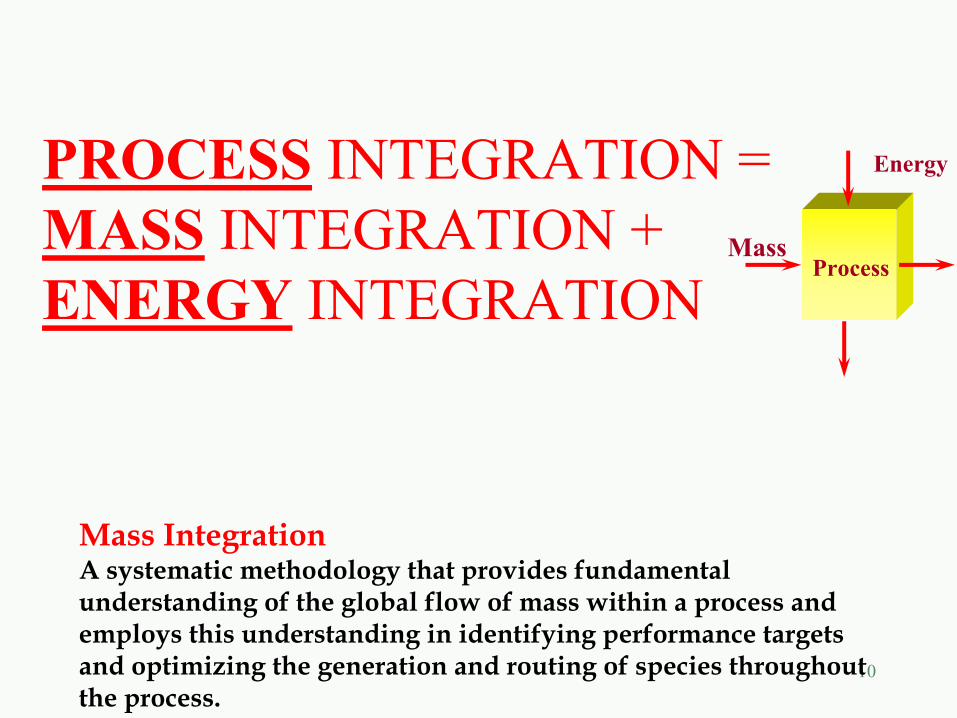
PROCESS INTEGRATION = MASS INTEGRATION +ENERGY INTEGRATION
Process
Energy
Mass
Mass IntegrationA systematic methodology that provides fundamental understanding of the global flow of mass within a process and employs this understanding in identifying performance targets and optimizing the generation and routing of species throughout the process.
11
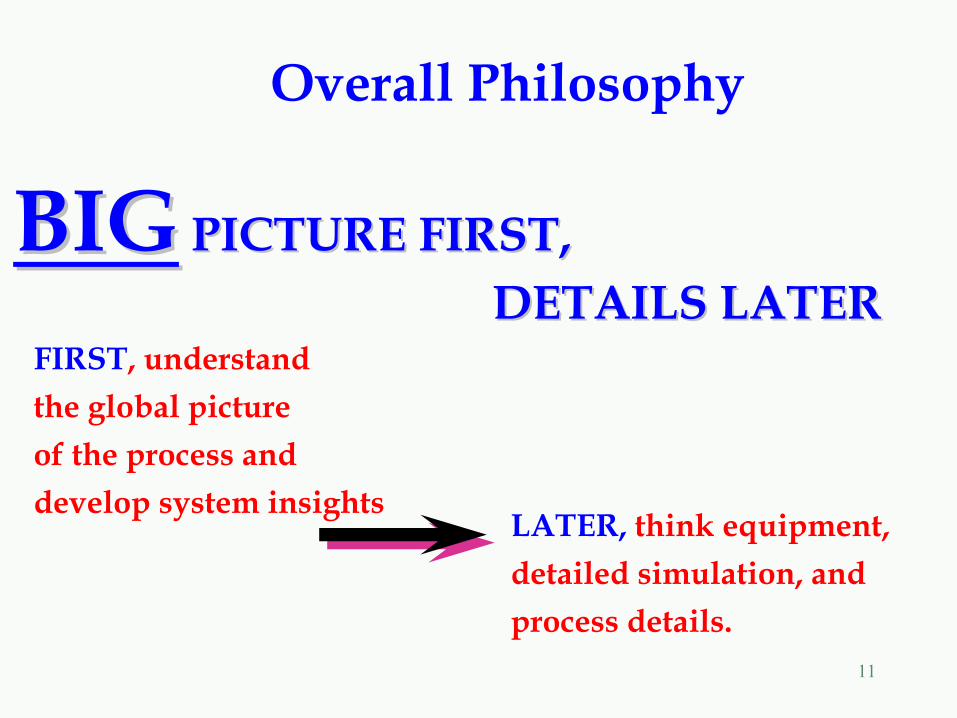
BIGBIG PICTURE FIRST, PICTURE FIRST, DETAILS LATERDETAILS LATER
FIRST, understandthe global pictureof the process anddevelop system insights
LATER, think equipment,detailed simulation, andprocess details.
Overall Philosophy
12
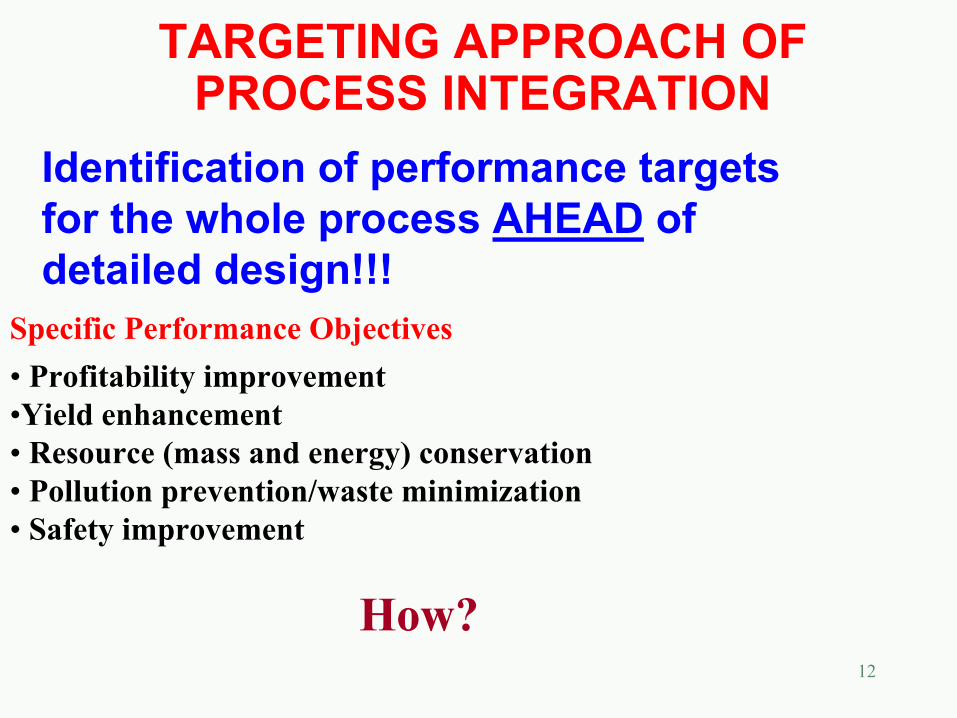
TARGETING APPROACH OF PROCESS INTEGRATION
Identification of performance targets for the whole process AHEAD of detailed design!!!
• Profitability improvement•Yield enhancement• Resource (mass and energy) conservation• Pollution prevention/waste minimization• Safety improvement
Specific Performance Objectives
How?
13
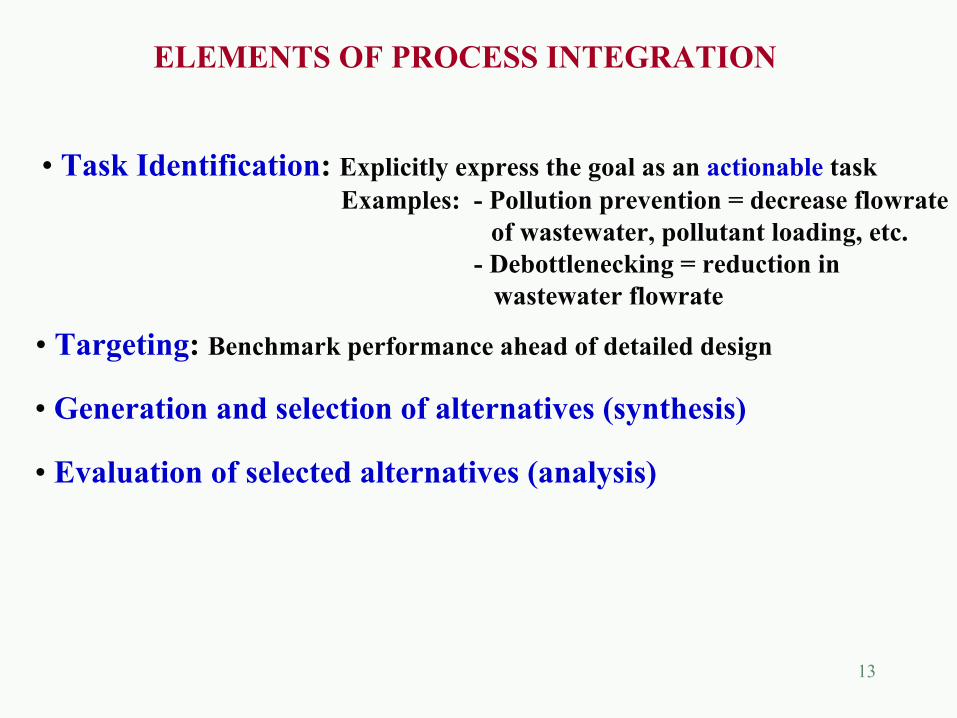
ELEMENTS OF PROCESS INTEGRATION
• Task Identification: Explicitly express the goal as an actionable task Examples: - Pollution prevention = decrease flowrate
of wastewater, pollutant loading, etc.- Debottlenecking = reduction in
wastewater flowrate
• Targeting: Benchmark performance ahead of detailed design
• Generation and selection of alternatives (synthesis)
• Evaluation of selected alternatives (analysis)
14
LECTURE OUTLINE•Overall mass targeting• Stream rerouting and direct recycle opportunities• Incorporation of separation• General strategies for mass integration• Will focus on graphical techniques
15
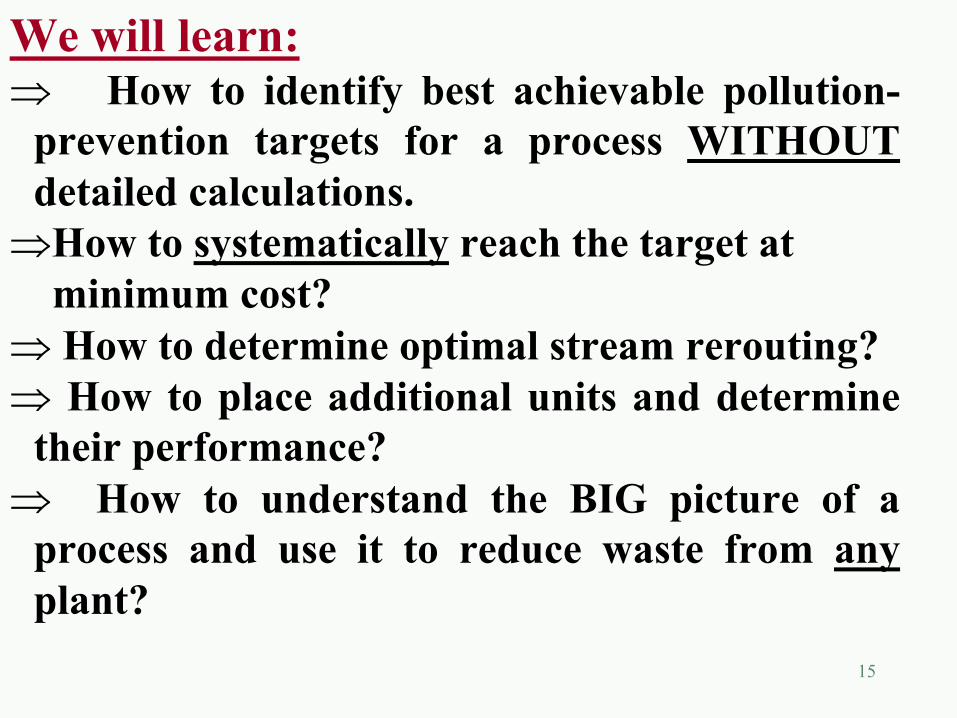
We will learn:⇒ How to identify best achievable pollution-
prevention targets for a process WITHOUT detailed calculations.
⇒How to systematically reach the target at minimum cost?
⇒ How to determine optimal stream rerouting?⇒ How to place additional units and determine
their performance?⇒ How to understand the BIG picture of a
process and use it to reduce waste from anyplant?
16
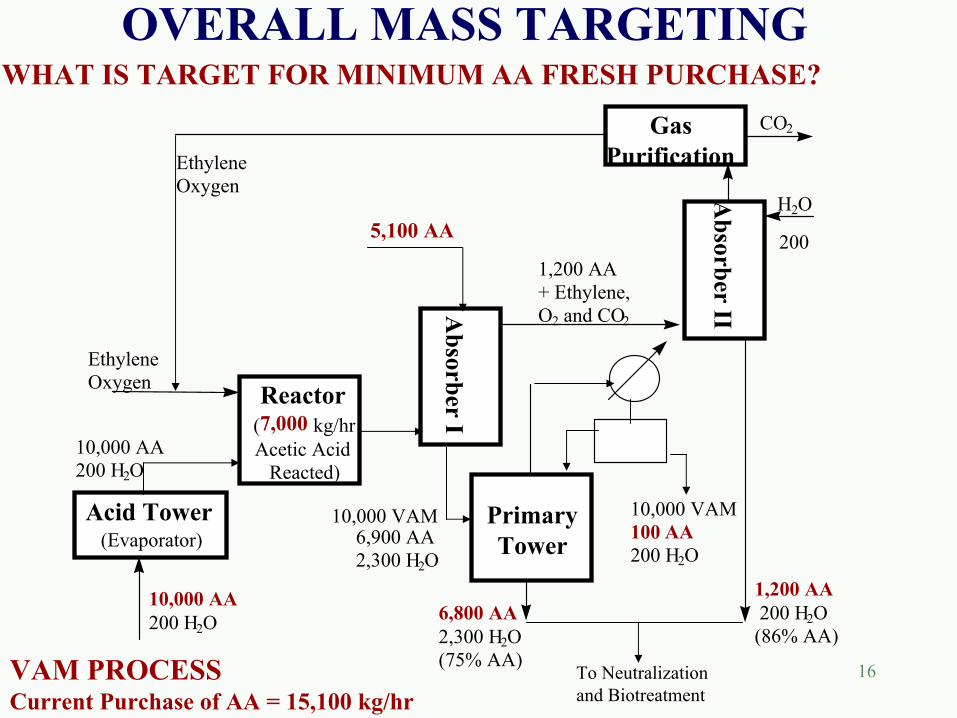
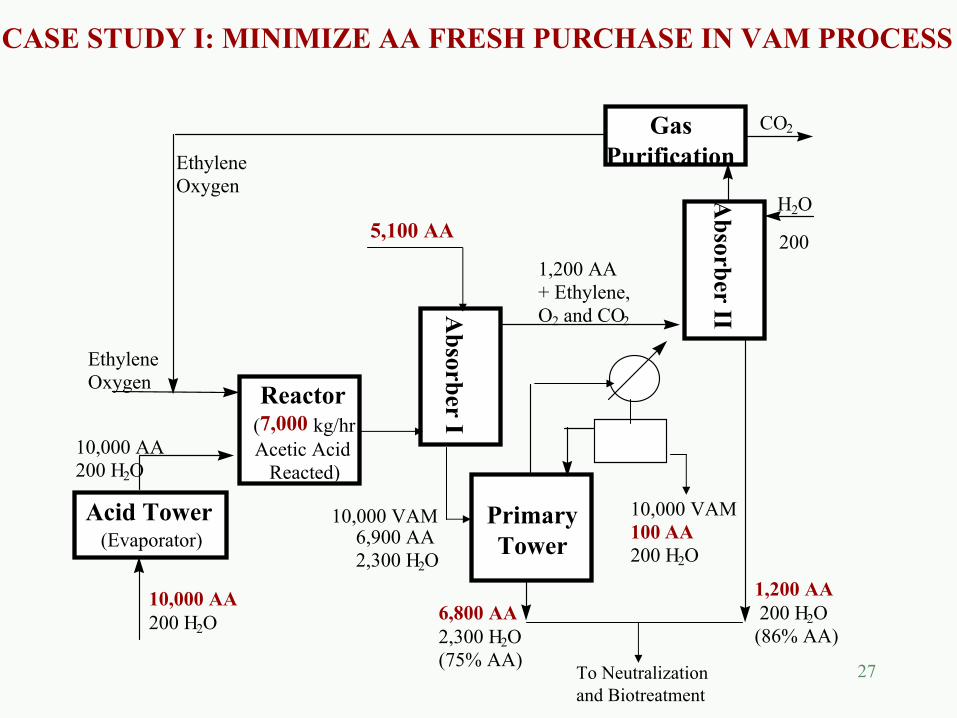
WHAT IS TARGET FOR MINIMUM AA FRESH PURCHASE?
Acid Tower(Evaporator)
Reactor(7,000 kg/hrAcetic Acid
Reacted)
Absorber I
Absorber II
GasPurification
PrimaryTower
EthyleneOxygen
CO2
H2O
200
EthyleneOxygen
10,000 AA200 H2O
10,000 AA200 H2O
5,100 AA
1,200 AA+ Ethylene, O2 and CO2
10,000 VAM6,900 AA2,300 H2O
6,800 AA2,300 H2O(75% AA)
10,000 VAM100 AA200 H2O
1,200 AA200 H2O
(86% AA)
To Neutralizationand Biotreatment
VAM PROCESSCurrent Purchase of AA = 15,100 kg/hr
OVERALL MASS TARGETING
17
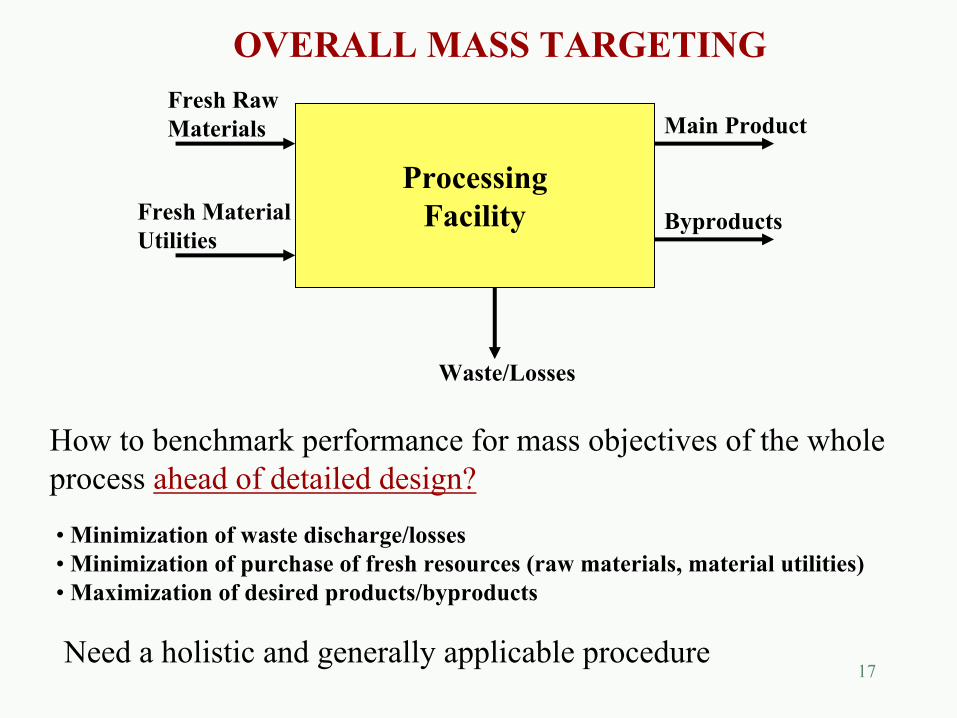
OVERALL MASS TARGETING
ProcessingFacility
Fresh Raw Materials
Fresh MaterialUtilities
Main Product
Byproducts
Waste/Losses
How to benchmark performance for mass objectives of the whole process ahead of detailed design?
• Minimization of waste discharge/losses• Minimization of purchase of fresh resources (raw materials, material utilities)• Maximization of desired products/byproducts
Need a holistic and generally applicable procedure
18
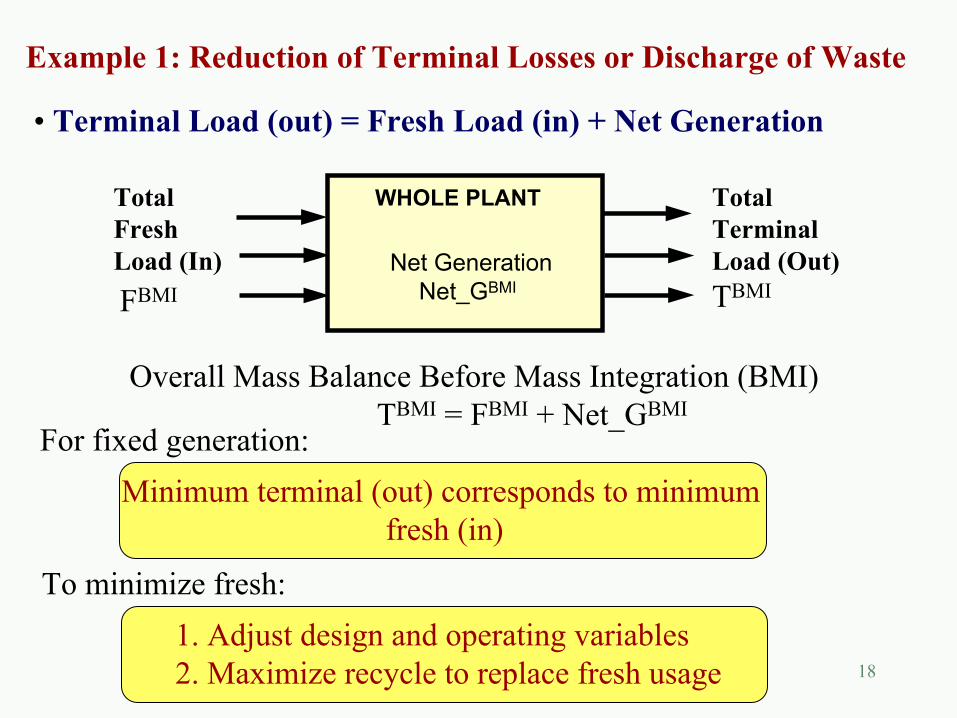
Minimum terminal (out) corresponds to minimum fresh (in)
For fixed generation:
Example 1: Reduction of Terminal Losses or Discharge of Waste
• Terminal Load (out) = Fresh Load (in) + Net Generation
Net GenerationNet_GBMI
WHOLE PLANTTotalFresh Load (In)
TotalTerminal Load (Out)TBMIFBMI
Overall Mass Balance Before Mass Integration (BMI)TBMI = FBMI + Net_GBMI
1. Adjust design and operating variables 2. Maximize recycle to replace fresh usage
To minimize fresh:
19
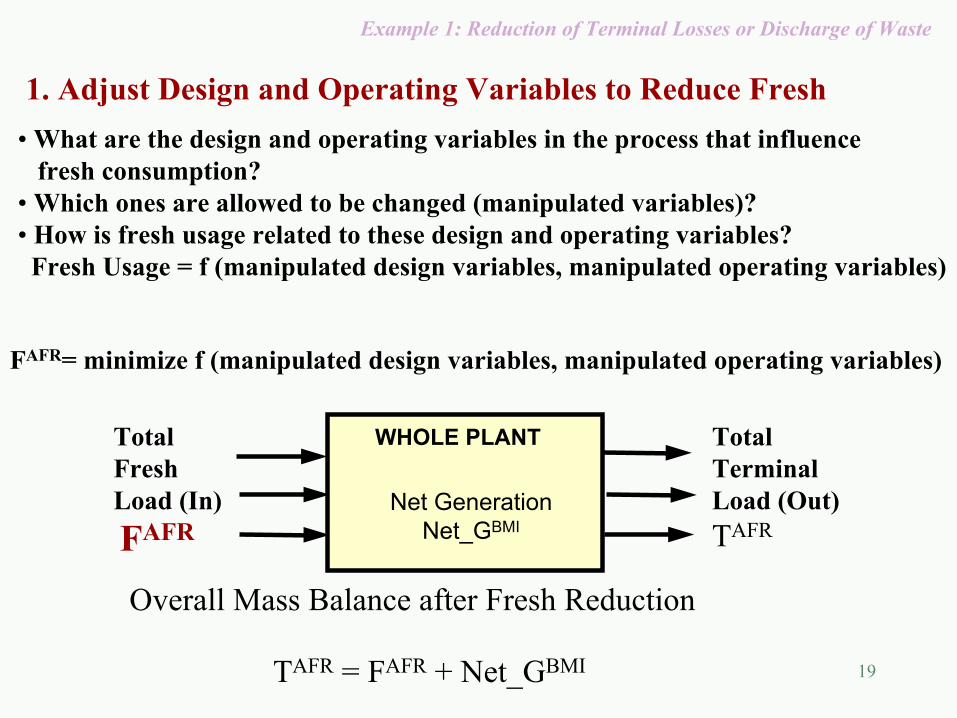
1. Adjust Design and Operating Variables to Reduce Fresh
Net GenerationNet_GBMI
WHOLE PLANTTotalFresh Load (In)
TotalTerminal Load (Out)TAFRFAFR
Overall Mass Balance after Fresh Reduction
TAFR = FAFR + Net_GBMI
Example 1: Reduction of Terminal Losses or Discharge of Waste
• What are the design and operating variables in the process that influence fresh consumption?
• Which ones are allowed to be changed (manipulated variables)?• How is fresh usage related to these design and operating variables?
Fresh Usage = f (manipulated design variables, manipulated operating variables)
FAFR= minimize f (manipulated design variables, manipulated operating variables)
20
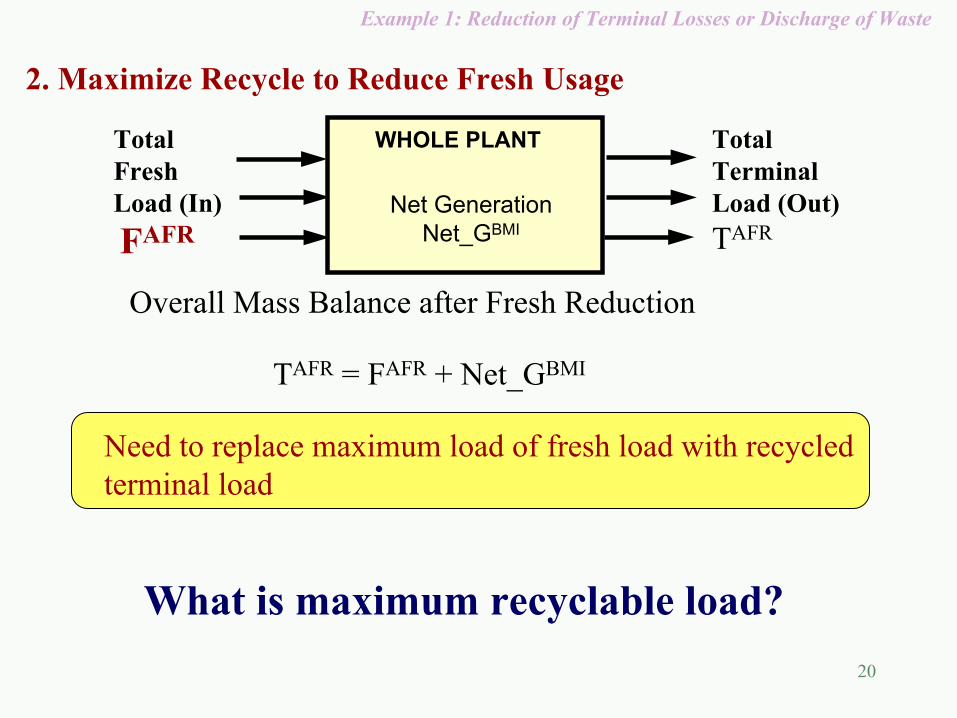
What is maximum recyclable load?
Example 1: Reduction of Terminal Losses or Discharge of Waste
2. Maximize Recycle to Reduce Fresh Usage
Net GenerationNet_GBMI
WHOLE PLANTTotalFresh Load (In)
TotalTerminal Load (Out)TAFRFAFR
Overall Mass Balance after Fresh Reduction
TAFR = FAFR + Net_GBMI
Need to replace maximum load of fresh load with recycledterminal load
21
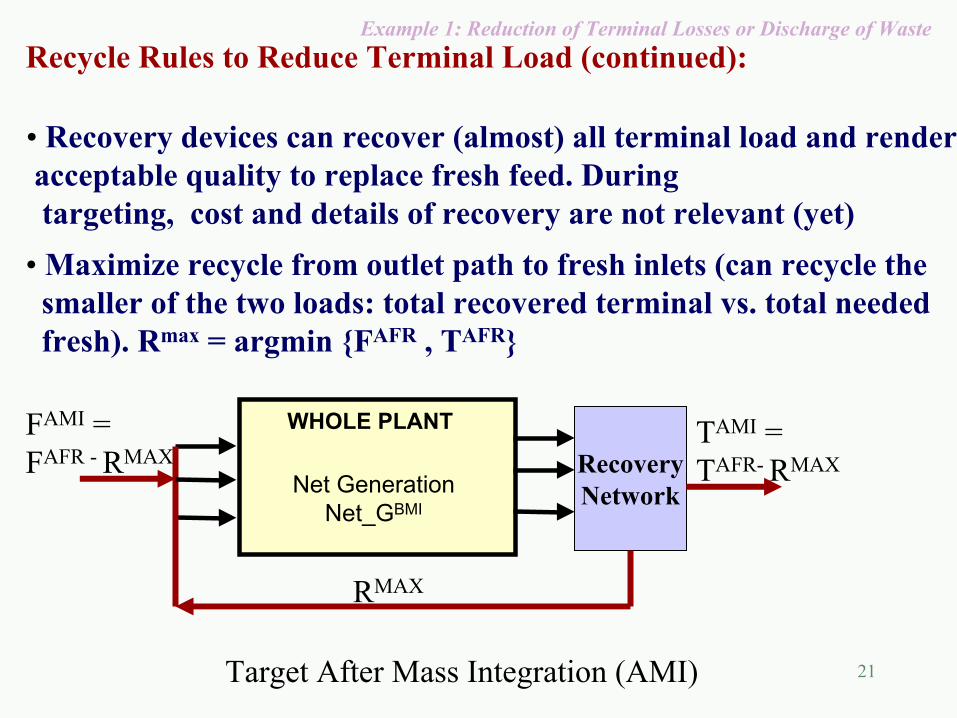
Recycle Rules to Reduce Terminal Load (continued):
• Recovery devices can recover (almost) all terminal load and renderacceptable quality to replace fresh feed. During targeting, cost and details of recovery are not relevant (yet)
• Maximize recycle from outlet path to fresh inlets (can recycle thesmaller of the two loads: total recovered terminal vs. total needed fresh). Rmax = argmin {FAFR , TAFR}
WHOLE PLANT TAMI = TAFR- RMAX
Target After Mass Integration (AMI)
RecoveryNetwork
RMAX
FAMI = FAFR - RMAX
Net GenerationNet_GBMI
Example 1: Reduction of Terminal Losses or Discharge of Waste
22
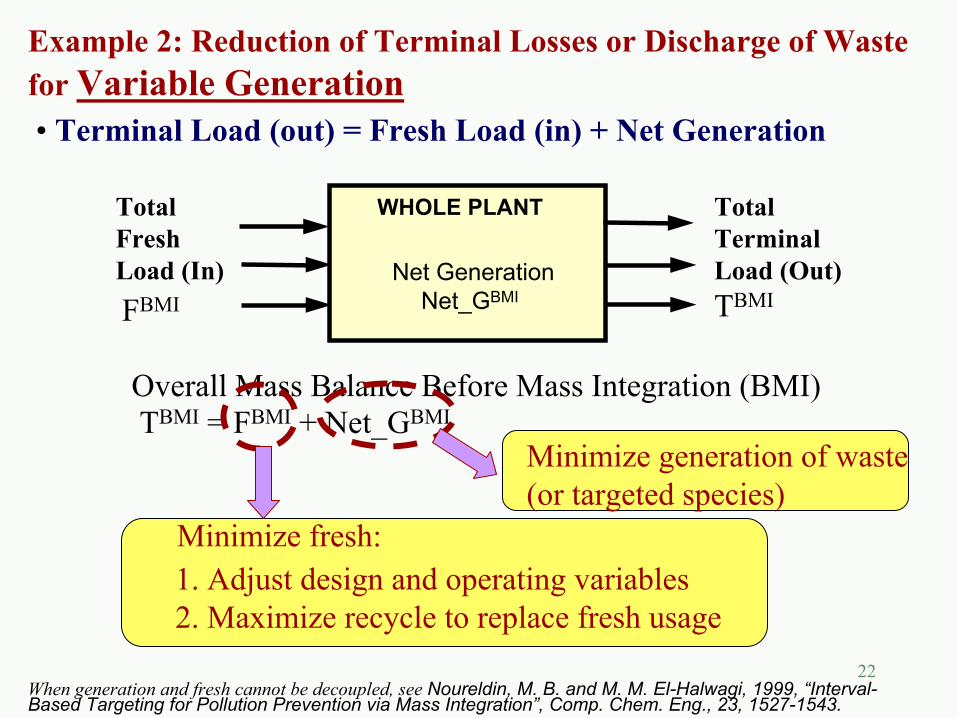
Example 2: Reduction of Terminal Losses or Discharge of Wastefor Variable Generation• Terminal Load (out) = Fresh Load (in) + Net Generation
Net GenerationNet_GBMI
WHOLE PLANTTotalFresh Load (In)
TotalTerminal Load (Out)TBMIFBMI
Overall Mass Balance Before Mass Integration (BMI)TBMI = FBMI + Net_GBMI
1. Adjust design and operating variables 2. Maximize recycle to replace fresh usage
When generation and fresh cannot be decoupled, see Noureldin, M. B. and M. M. El-Halwagi, 1999, “Interval-Based Targeting for Pollution Prevention via Mass Integration”, Comp. Chem. Eng., 23, 1527-1543.
Minimize generation of waste(or targeted species)
Minimize fresh:
23
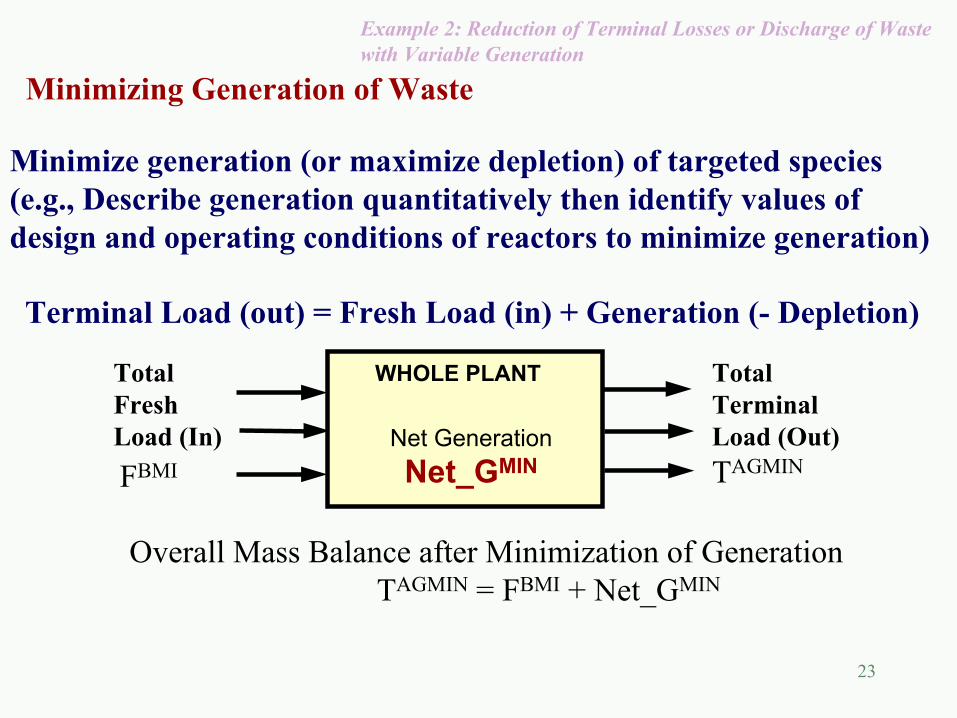
Minimizing Generation of Waste
Terminal Load (out) = Fresh Load (in) + Generation (- Depletion)
Net GenerationNet_GMIN
WHOLE PLANTTotalFresh Load (In)
TotalTerminal Load (Out)TAGMINFBMI
Overall Mass Balance after Minimization of GenerationTAGMIN = FBMI + Net_GMIN
Minimize generation (or maximize depletion) of targeted species(e.g., Describe generation quantitatively then identify values ofdesign and operating conditions of reactors to minimize generation)
Example 2: Reduction of Terminal Losses or Discharge of Wastewith Variable Generation
24
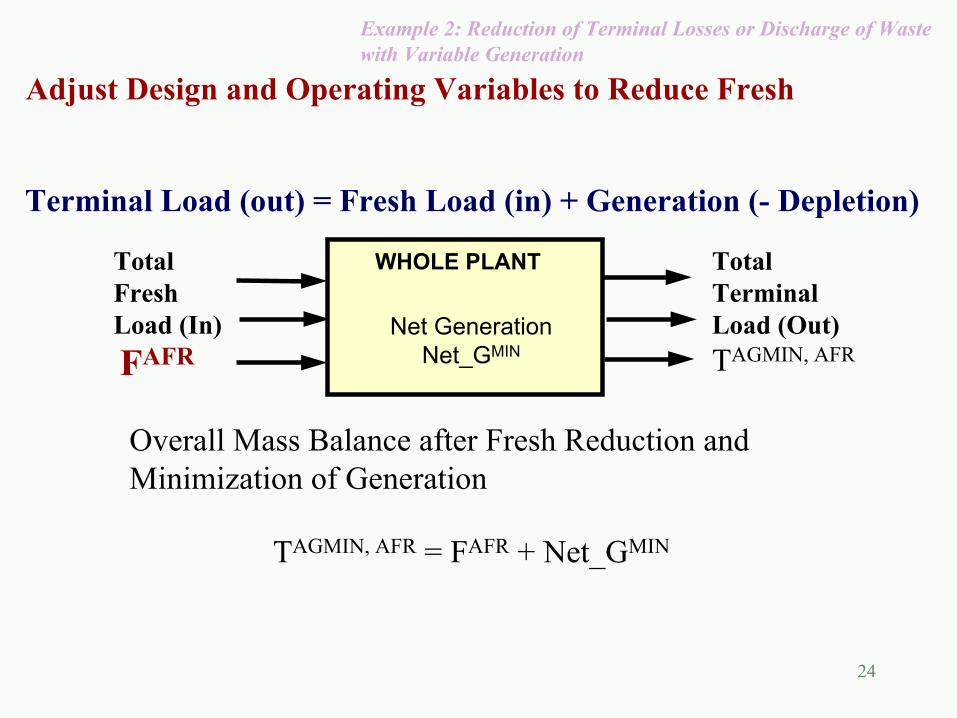
Adjust Design and Operating Variables to Reduce Fresh
Terminal Load (out) = Fresh Load (in) + Generation (- Depletion)
Net GenerationNet_GMIN
WHOLE PLANTTotalFresh Load (In)
TotalTerminal Load (Out)TAGMIN, AFRFAFR
Overall Mass Balance after Fresh Reduction and Minimization of Generation
TAGMIN, AFR = FAFR + Net_GMIN
Example 2: Reduction of Terminal Losses or Discharge of Wastewith Variable Generation
25
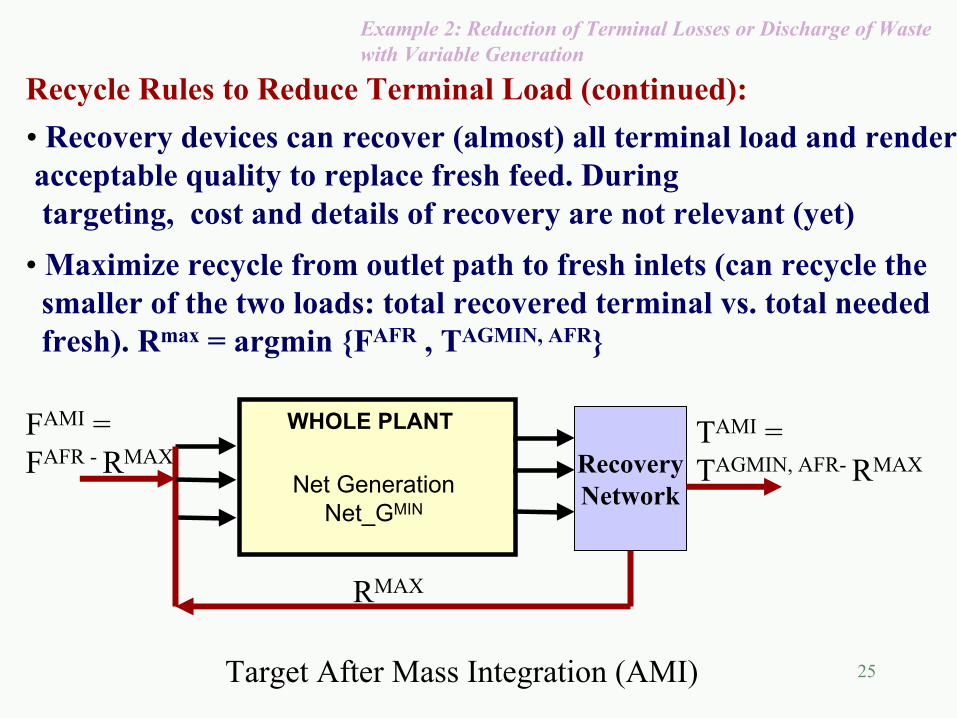
Recycle Rules to Reduce Terminal Load (continued):• Recovery devices can recover (almost) all terminal load and renderacceptable quality to replace fresh feed. During targeting, cost and details of recovery are not relevant (yet)
• Maximize recycle from outlet path to fresh inlets (can recycle thesmaller of the two loads: total recovered terminal vs. total needed fresh). Rmax = argmin {FAFR , TAGMIN, AFR}
WHOLE PLANT TAMI = TAGMIN, AFR- RMAX
Target After Mass Integration (AMI)
RecoveryNetwork
RMAX
FAMI = FAFR - RMAX
Net GenerationNet_GMIN
Example 2: Reduction of Terminal Losses or Discharge of Wastewith Variable Generation
26
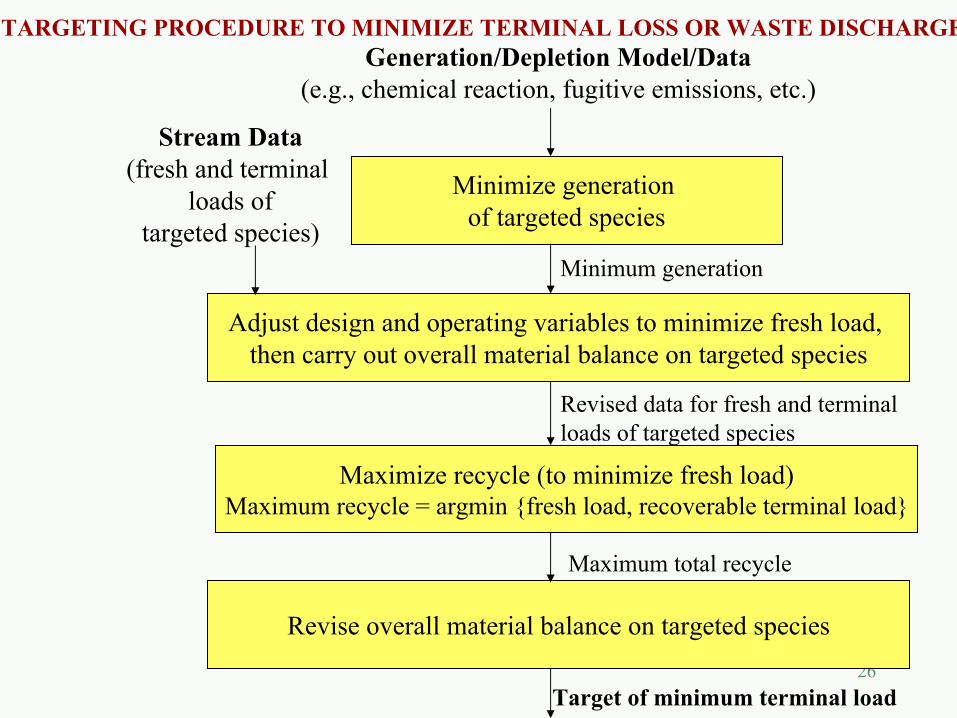
Minimize generation of targeted species
Generation/Depletion Model/Data(e.g., chemical reaction, fugitive emissions, etc.)
Adjust design and operating variables to minimize fresh load, then carry out overall material balance on targeted species
Stream Data(fresh and terminal
loads oftargeted species)
Minimum generation
Maximize recycle (to minimize fresh load)Maximum recycle = argmin {fresh load, recoverable terminal load}
Revised data for fresh and terminalloads of targeted species
Revise overall material balance on targeted species
Maximum total recycle
Target of minimum terminal load
TARGETING PROCEDURE TO MINIMIZE TERMINAL LOSS OR WASTE DISCHARGE
27
Acid Tower(Evaporator)
Reactor(7,000 kg/hrAcetic Acid
Reacted)
Absorber I
Absorber II
GasPurification
PrimaryTower
EthyleneOxygen
CO2
H2O
200
EthyleneOxygen
10,000 AA200 H2O
10,000 AA200 H2O
5,100 AA
1,200 AA+ Ethylene, O2 and CO2
10,000 VAM6,900 AA2,300 H2O
6,800 AA2,300 H2O(75% AA)
10,000 VAM100 AA200 H2O
1,200 AA200 H2O
(86% AA)
To Neutralizationand Biotreatment
CASE STUDY I: MINIMIZE AA FRESH PURCHASE IN VAM PROCESS
28
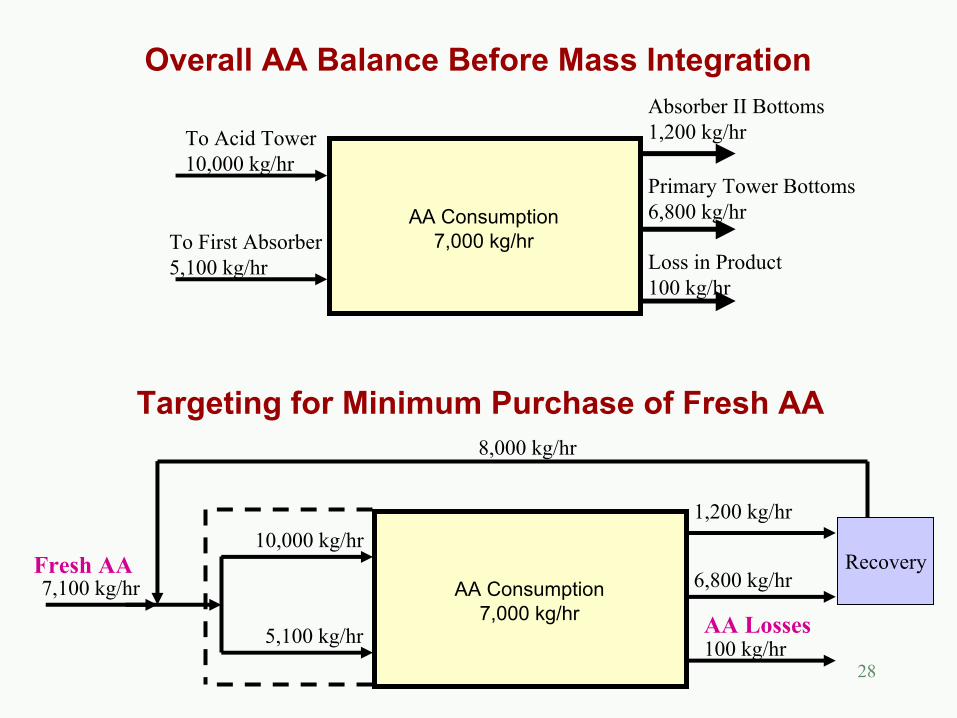
AA Consumption7,000 kg/hr
Overall AA Balance Before Mass Integration
To First Absorber5,100 kg/hr
To Acid Tower10,000 kg/hr
Absorber II Bottoms1,200 kg/hr
Primary Tower Bottoms6,800 kg/hr
Loss in Product100 kg/hr
AA Consumption7,000 kg/hr
5,100 kg/hr
10,000 kg/hr1,200 kg/hr
6,800 kg/hr
100 kg/hr
Recovery
8,000 kg/hr
7,100 kg/hrFresh AA
AA Losses
Targeting for Minimum Purchase of Fresh AA
29
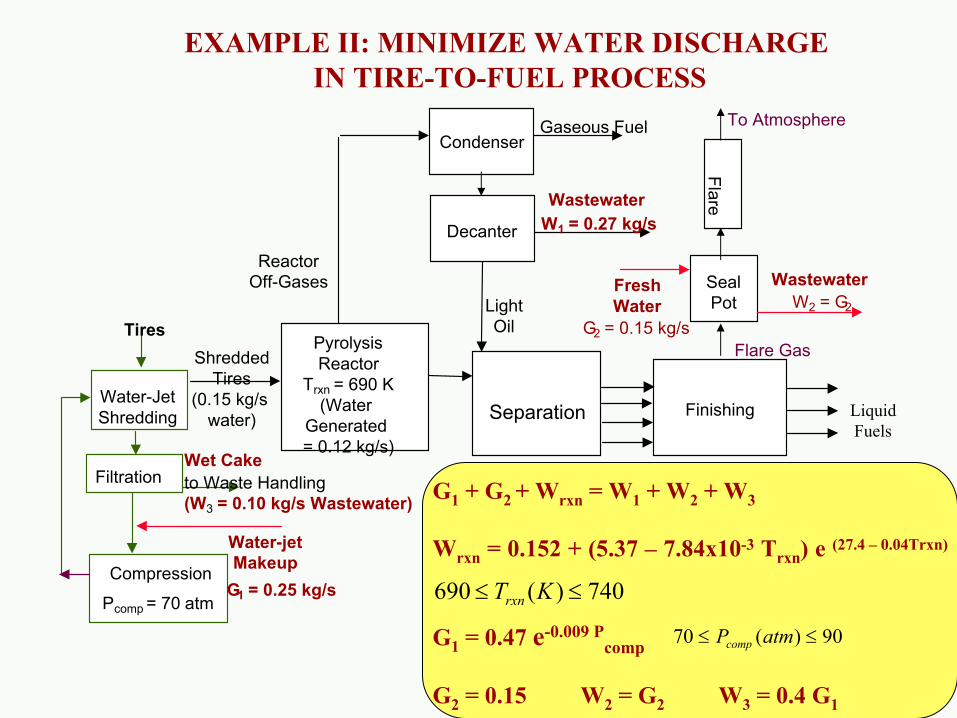
LightOil
Finishing
Wastewater
LiquidFuels
PyrolysisReactor
Trxn = 690 K(Water
Generated = 0.12 kg/s)
Condenser
Separation
SealPot
Flare Gas
Flare
ShreddedTires
(0.15 kg/s water)
ReactorOff-Gases
Gaseous Fuel
Decanter
To Atmosphere
Wastewater W2 = G2
FreshWater
Water-JetShredding
FiltrationWet Cake to Waste Handling (W3 = 0.10 kg/s Wastewater)
Water-jetMakeupCompression
Tires G2 = 0.15 kg/s
W1 = 0.27 kg/s
G1 = 0.25 kg/sPcomp = 70 atm
EXAMPLE II: MINIMIZE WATER DISCHARGE IN TIRE-TO-FUEL PROCESS
G1 + G2 + Wrxn = W1 + W2 + W3
Wrxn = 0.152 + (5.37 – 7.84x10⁻³ Trxn) e (27.4 – 0.04Trxn)
G1 = 0.47 e-0.009 Pcomp
G2 = 0.15 W2 = G2 W3 = 0.4 G1
740)(690 ≤≤ KTrxn
90)(70 ≤≤ atmPcomp
30
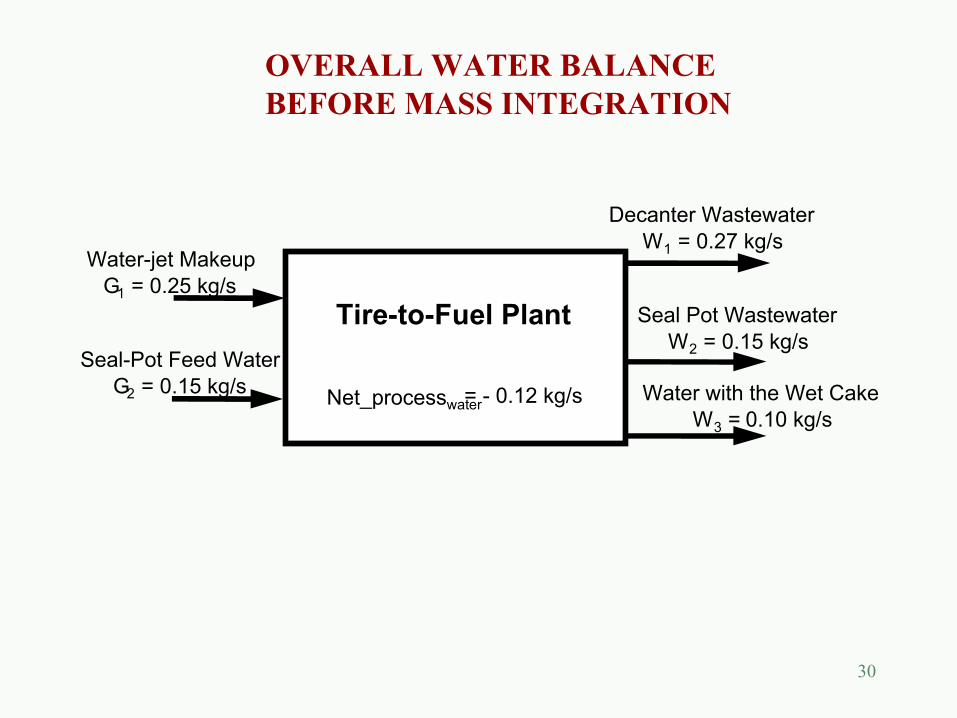
Water-jet MakeupG1 = 0.25 kg/s
Seal-Pot Feed WaterG2 = 0.15 kg/s Net_processwater = - 0.12 kg/s
Tire-to-Fuel Plant Seal Pot WastewaterW2 = 0.15 kg/s
Decanter WastewaterW1 = 0.27 kg/s
Water with the Wet CakeW3 = 0.10 kg/s
OVERALL WATER BALANCEBEFORE MASS INTEGRATION
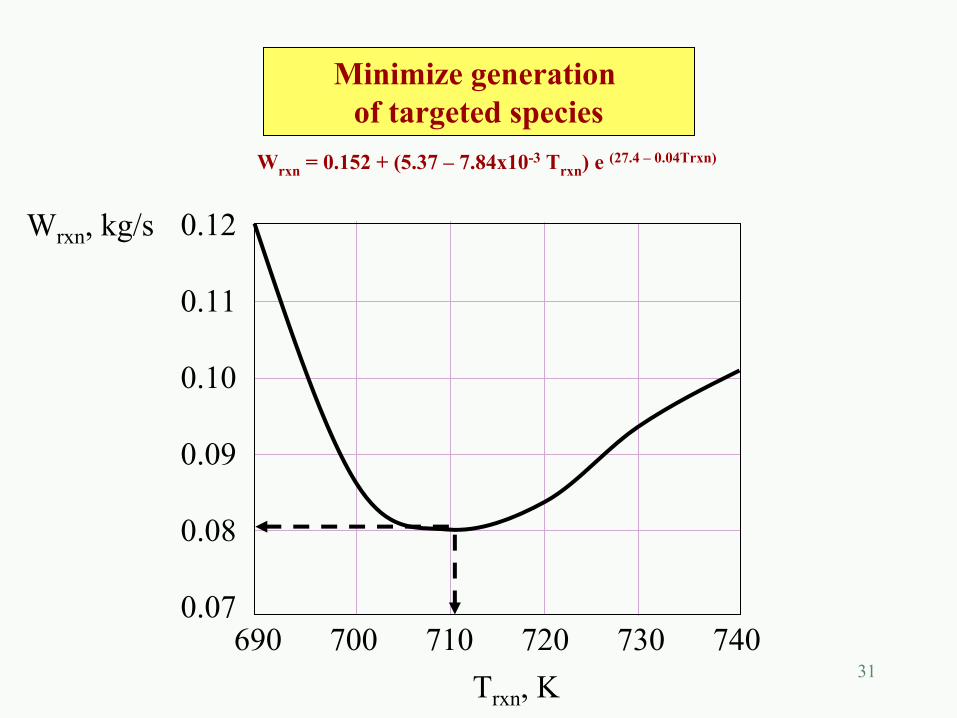
31690 700 710 720 730 740
0.12
0.11
0.10
0.09
0.08
0.07
Trxn, K
Wrxn, kg/s
Minimize generation of targeted species
Wrxn = 0.152 + (5.37 – 7.84x10⁻³ Trxn) e (27.4 – 0.04Trxn)
32
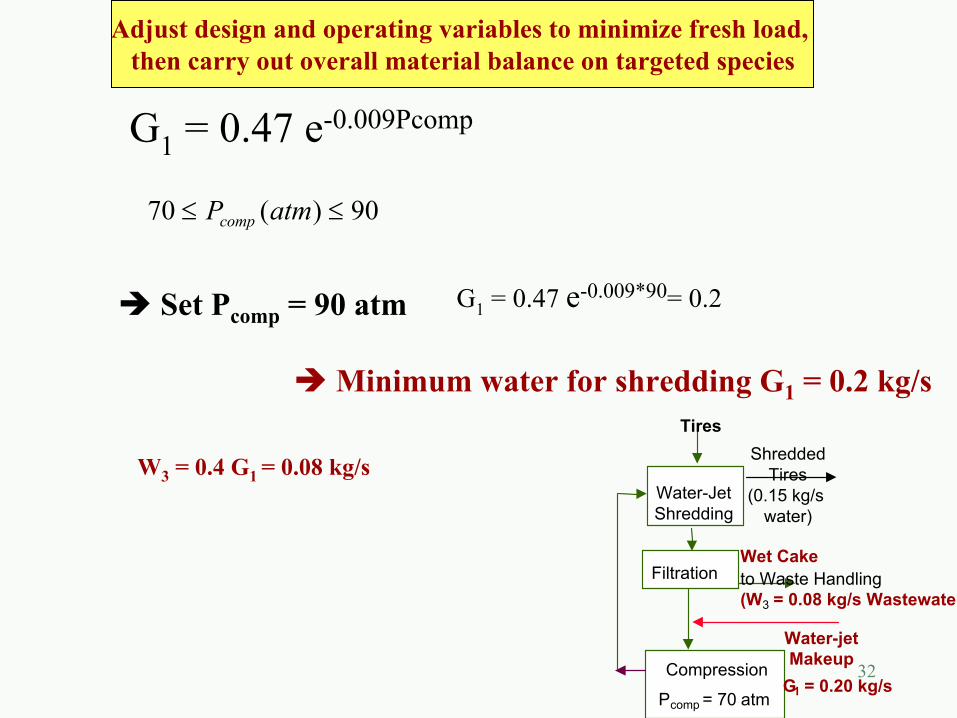
G1 = 0.47 e-0.009Pcomp
Set Pcomp = 90 atm
Minimum water for shredding G1 = 0.2 kg/s
Adjust design and operating variables to minimize fresh load, then carry out overall material balance on targeted species
90)(70 ≤≤ atmPcomp
G1 = 0.47 e-0.009*90= 0.2
W3 = 0.4 G1 = 0.08 kg/s ShreddedTires
(0.15 kg/s water)
Water-JetShredding
FiltrationWet Cake to Waste Handling (W3 = 0.08 kg/s Wastewater
Water-jetMakeupCompression
Tires
G1 = 0.20 kg/sPcomp = 70 atm
33
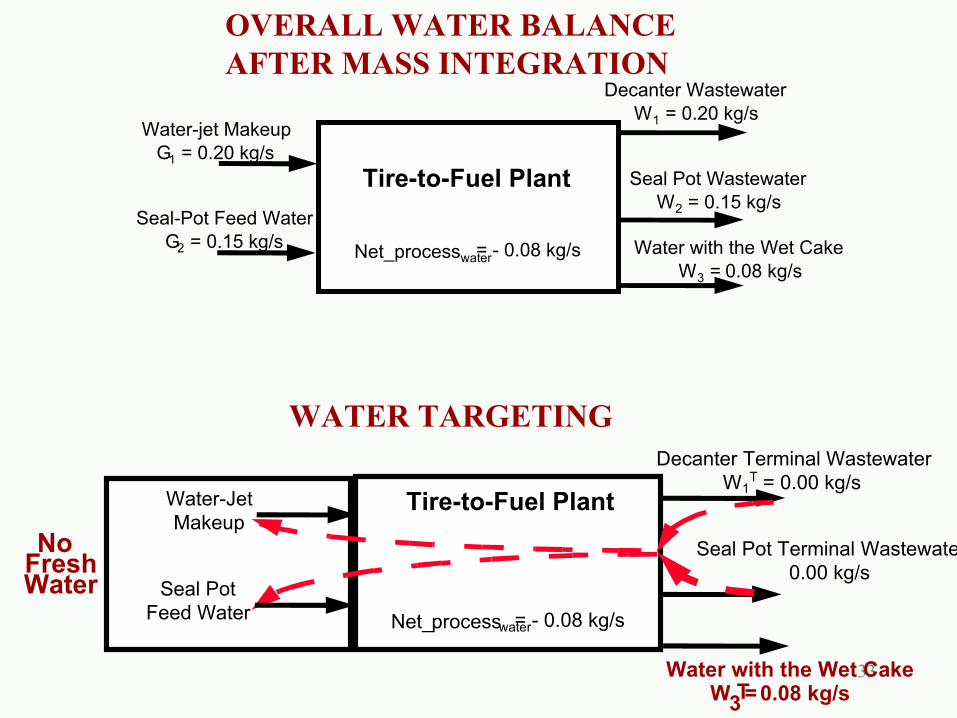
Water-jet MakeupG1 = 0.20 kg/s
Seal-Pot Feed WaterG2 = 0.15 kg/s Net_processwater = - 0.08 kg/s
Tire-to-Fuel Plant Seal Pot WastewaterW2 = 0.15 kg/s
Decanter WastewaterW1 = 0.20 kg/s
Water with the Wet CakeW3 = 0.08 kg/s
Decanter Terminal WastewaterW1
T = 0.00 kg/s
Seal Pot Terminal Wastewate0.00 kg/s
Tire-to-Fuel PlantNo
FreshWater Seal Pot
Feed Water
Water-JetMakeup
Water with the Wet CakeW3T= 0.08 kg/s
Net_processwater= - 0.08 kg/s
OVERALL WATER BALANCEAFTER MASS INTEGRATION
WATER TARGETING
34
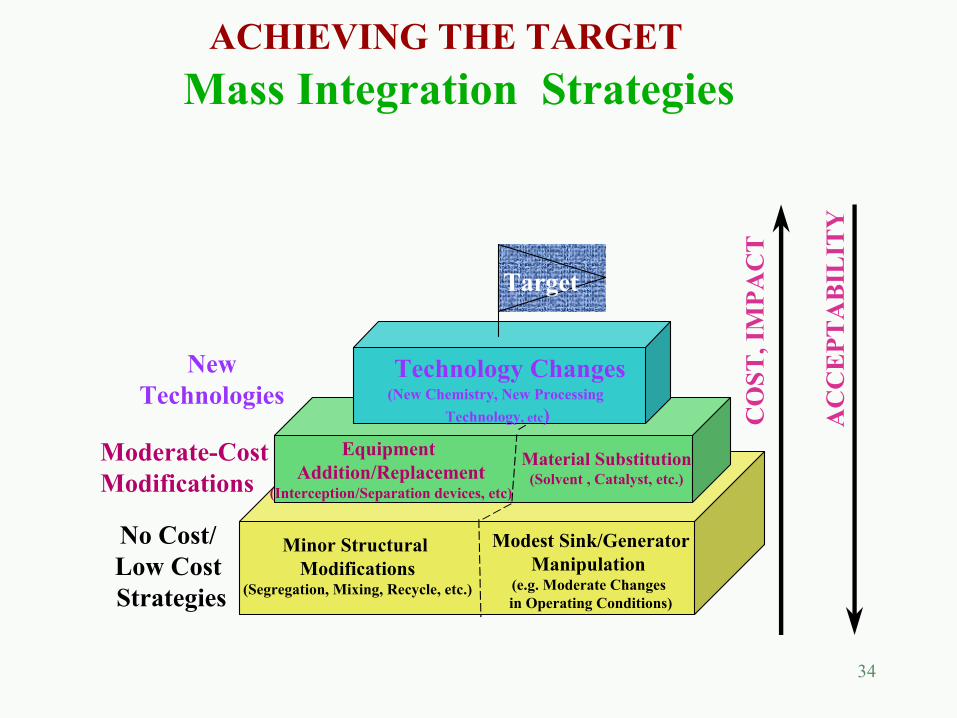
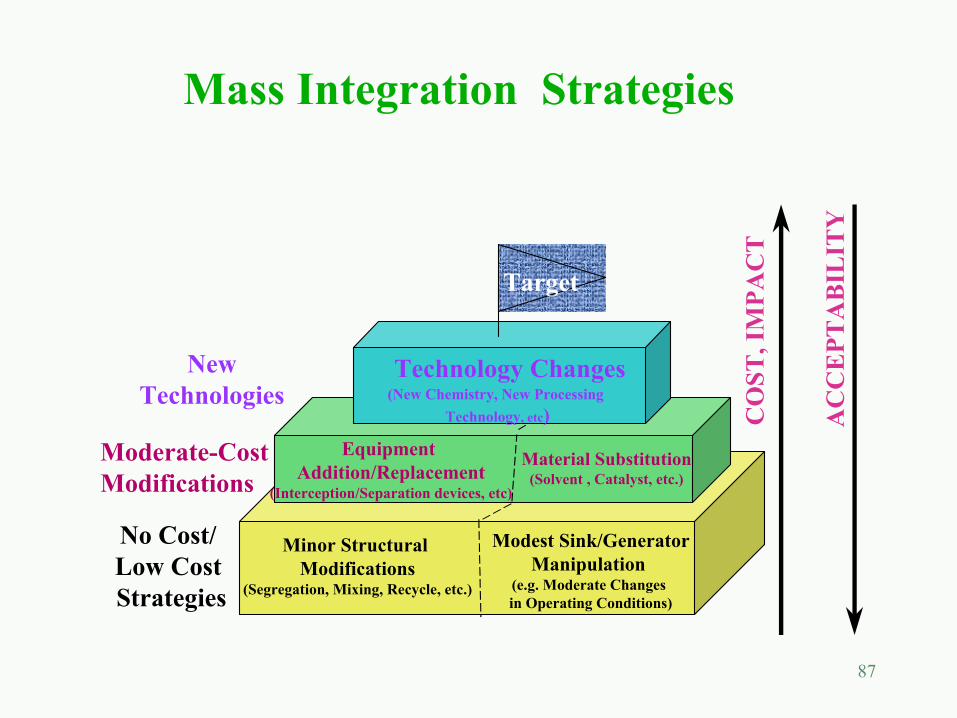
Mass Integration Strategies
No Cost/ Low Cost Strategies
Modest Sink/GeneratorManipulation
(e.g. Moderate Changes in Operating Conditions)
Minor Structural Modifications
(Segregation, Mixing, Recycle, etc.)
Moderate-Cost Modifications
Target
Equipment Addition/Replacement
(Interception/Separation devices, etc)
Material Substitution(Solvent , Catalyst, etc.)
(New Chemistry, New Processing Technology, etc)
Technology ChangesNewTechnologies
CO
ST, I
MPA
CT
AC
CE
PTA
BIL
ITY
ACHIEVING THE TARGET
35
Consider the VAM process described earlier. A new reaction pathway has been developed and will to be used for the production of VAM. This new reaction does not involve acetic acid. The rest of the process remains virtually unchanged and the AA losses with the product are 100kh/hr. What are the targets for minimum fresh usage and discharge/losses of AA?
PRACTICE EXERCISE
36
DIRECT RECYCLE STRATEGIES
Objective: to develop a graphical procedure that determines the target and implementation for minimum usage of the fresh resource, maximum material reuse, and minimum discharge to waste as a result of direct recycle.
Direct Recycle: rerouting of streams without the addition of new units. It involves segregation, mixing, and allocation.
37
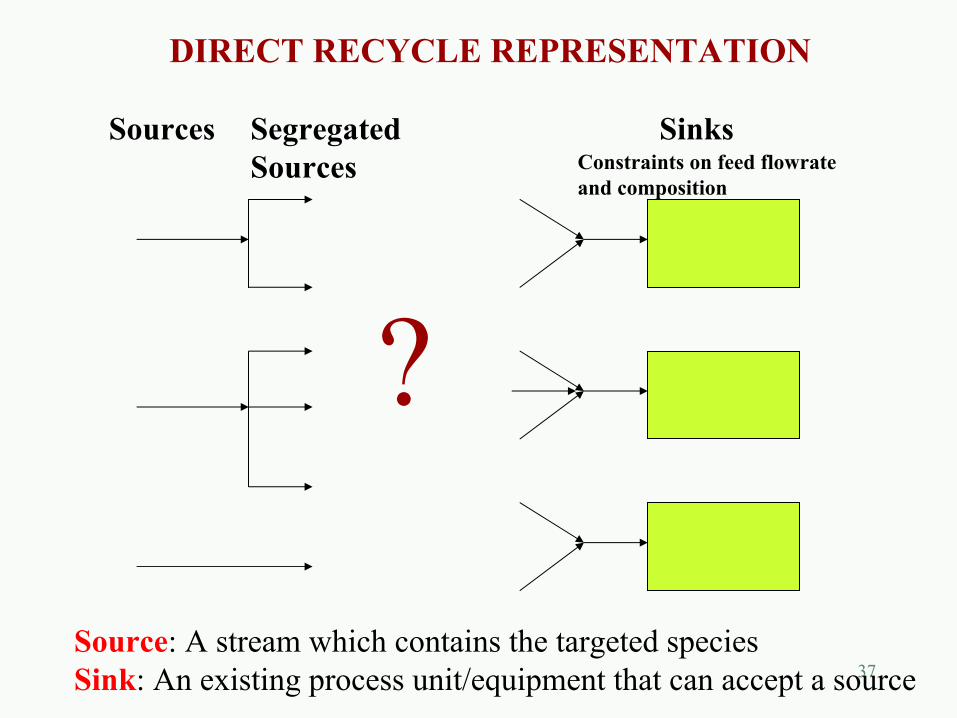
Sources SegregatedSources
SinksConstraints on feed flowrateand composition
?
DIRECT RECYCLE REPRESENTATION
Source: A stream which contains the targeted speciesSink: An existing process unit/equipment that can accept a source
38
PROBLEM STATEMENT
Consider a process with a number of process sources (e.g., process streams, wastes) that can be considered for possible recycle and replacement of the fresh material and/or reduction of waste discharge. Each source, i, has a given flow rate, Wi, and a given composition of a targeted species, yi. Available for service is a fresh (external) resource that can be purchased to supplement the use of process sources in sinks. The sinks are process units such as reactors, separators, etc. Each sink, j, requires a feed whose flow rate, Gj , and an inlet composition of a targeted species, zj, must satisfy certain bounds on their values.
39
DESIGN CHALLENGES
• Should a stream (source) be segregated and split? To how many fractions? What should be the flowrate of each split?
• Should streams or splits of streams be mixed? To what extent?
• What should be the optimum feed entering each sink? What should be its composition?
• What is the minimum amount of fresh resource to be used?
• What is the minimum discharge of unused process sources?
40
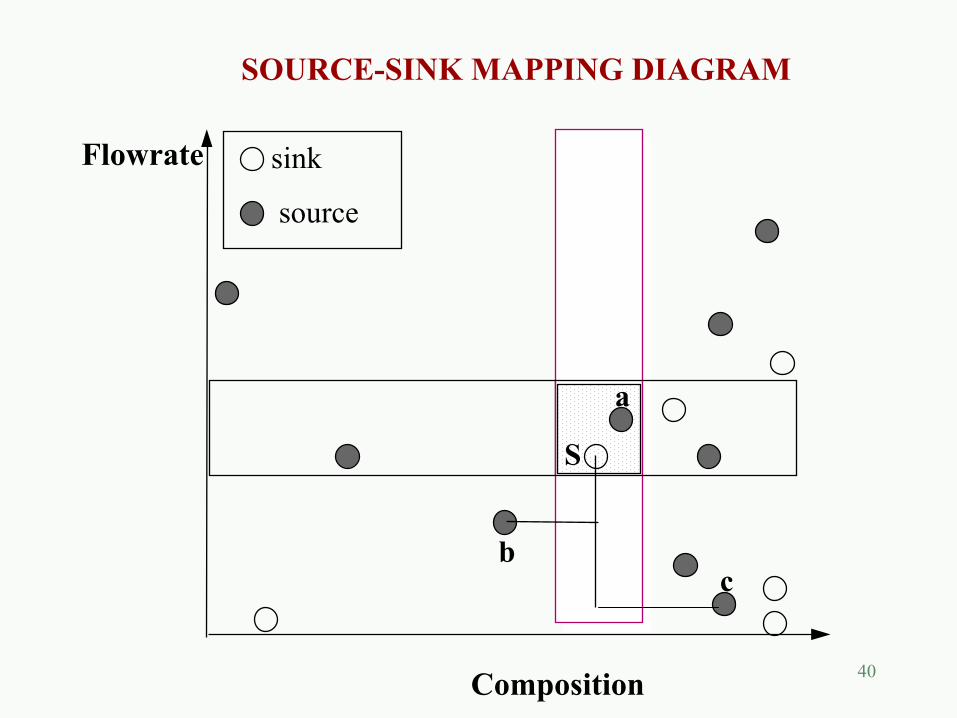
SOURCE-SINK MAPPING DIAGRAM
Composition
sink
source
a
bc
S
Flowrate
41
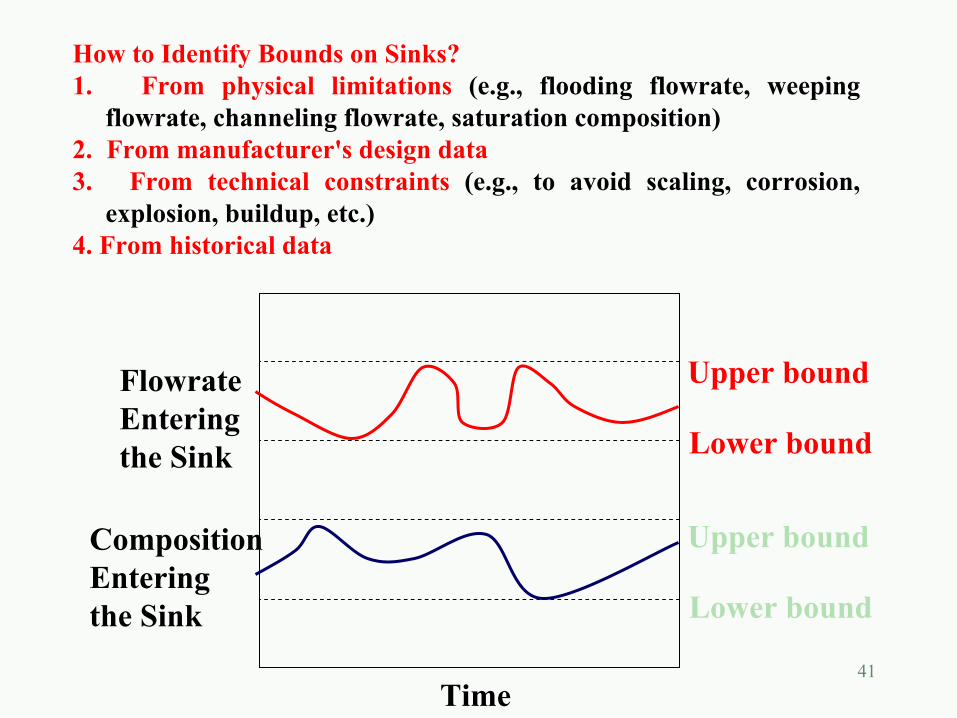
How to Identify Bounds on Sinks?1. From physical limitations (e.g., flooding flowrate, weeping
flowrate, channeling flowrate, saturation composition)2. From manufacturer's design data 3. From technical constraints (e.g., to avoid scaling, corrosion,
explosion, buildup, etc.)4. From historical data
FlowrateEntering the Sink
CompositionEntering the Sink
Upper bound
Lower bound
Upper bound
Lower bound
Time
42
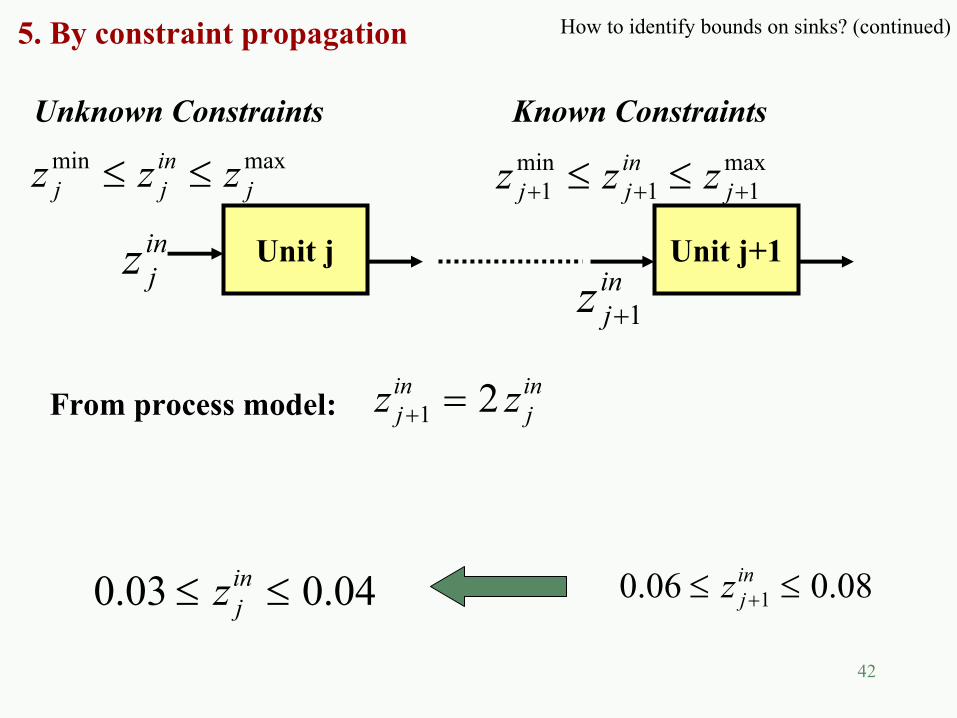
5. By constraint propagation How to identify bounds on sinks? (continued)
Unit j Unit j+1
Known ConstraintsUnknown Constraintsmaxminj
injj zzz ≤≤
injz in
jz 1+
max11
min1 +++ ≤≤ j
injj zzz
From process model:
08.006.0 1 ≤≤ +injz
inj
inj zz 21 =+
04.003.0 ≤≤ injz
43
How to identify bounds on sinks? (continued)
6. Tolerate a certain deviation from nominal case (e.g., allow+/- certain %ages from nominal flowrate and compositions)
44
Flowrate
Composition
Sourcea
Sourceb
ResultingMixture
ya ys yb
Wb
Wa
Wa+Wb
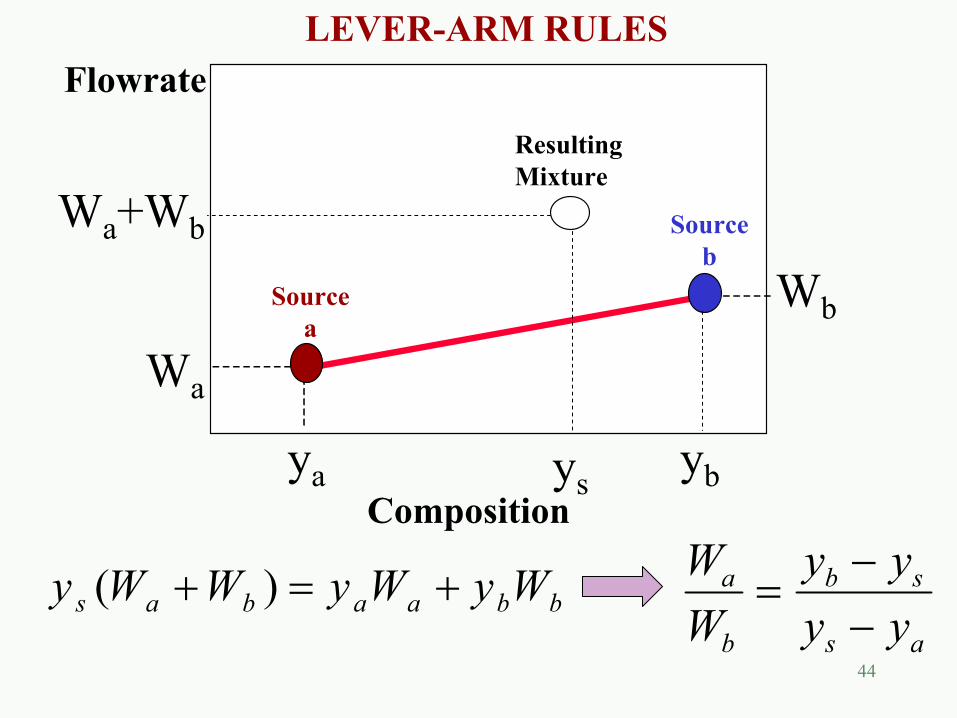
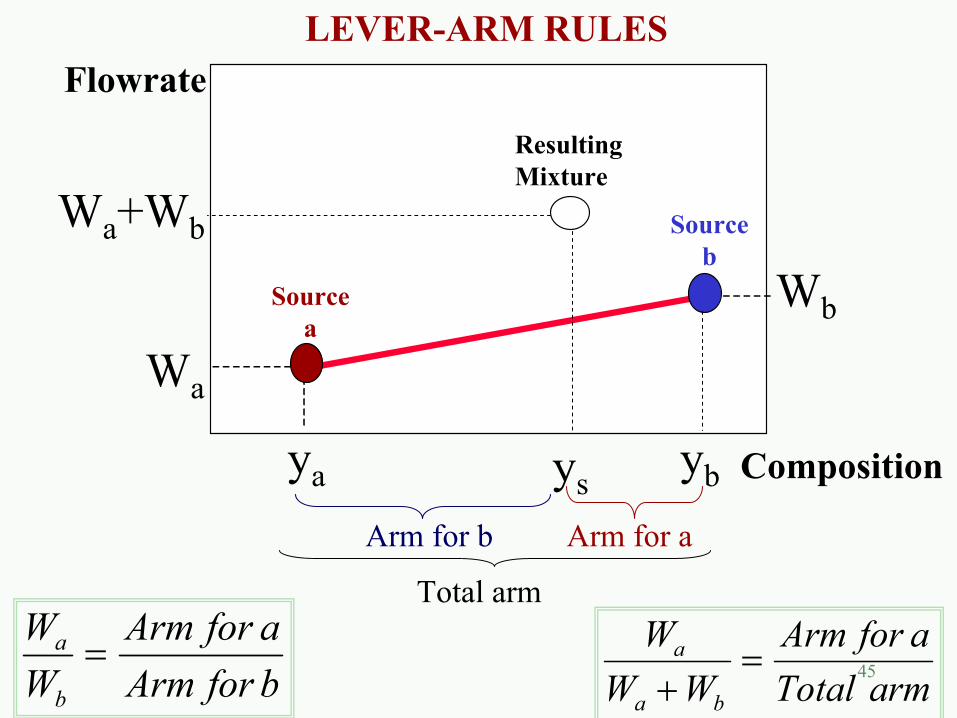
LEVER-ARM RULES
bbaabas WyWyWWy +=+ )(as
sb
b
a
yyyy
WW
−−
=
45
Flowrate
Composition
Sourcea
Sourceb
ResultingMixture
ya ys yb
Wb
Arm for aArm for b
Total arm
Wa
Wa+Wb
bforArmaforArm
WW
b
a =armTotal
aforArmWW
W
ba
a =+
LEVER-ARM RULES
46
Flowrate
Composition
Sourcea
ya
Fresh
Feed toSink j
Fy sink toFeedz
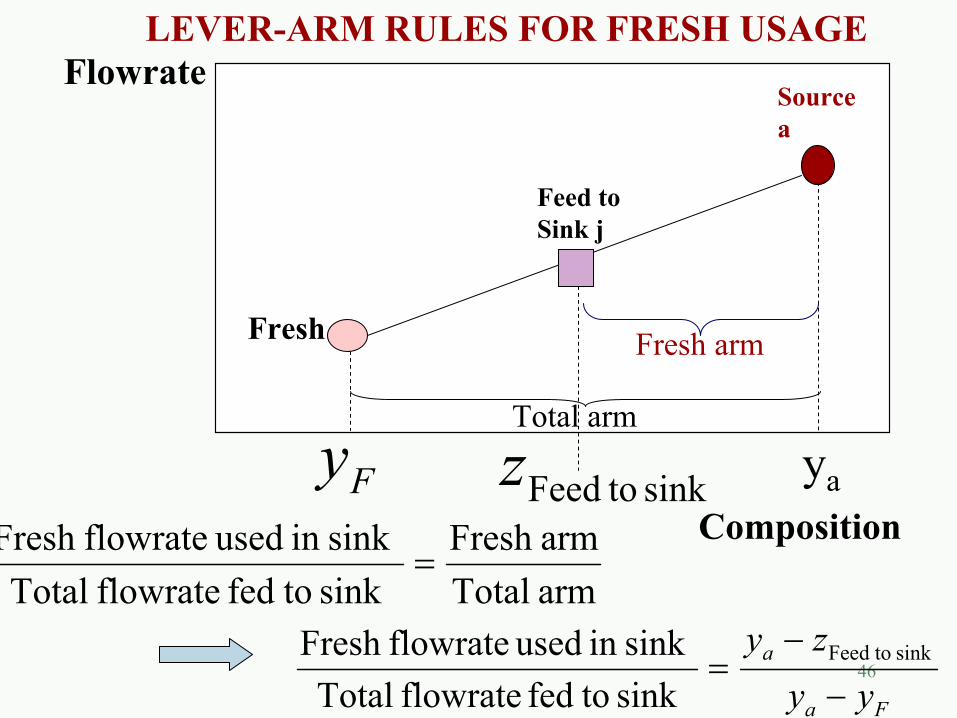
LEVER-ARM RULES FOR FRESH USAGE
armTotalarmFresh
sink tofed flowrate Totalsink in used flowrateFresh
=
Fa
a
yyzy−
−= sinktoFeed
sink tofed flowrate Totalsink in used flowrateFresh
Fresh arm
Total arm
47
FlowrateSourcea
ya
Fresh
Sink j
minjz avg
jz maxjz
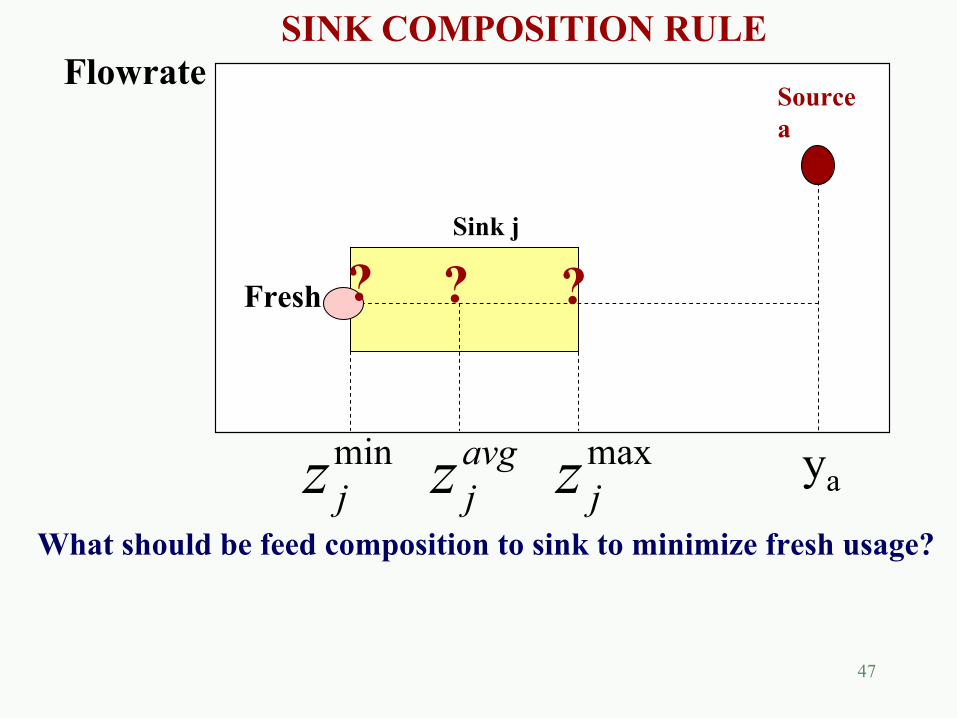
SINK COMPOSITION RULE
What should be feed composition to sink to minimize fresh usage?
???
48
FlowrateSourcea
ya
Fresh
Sink j
maxjz
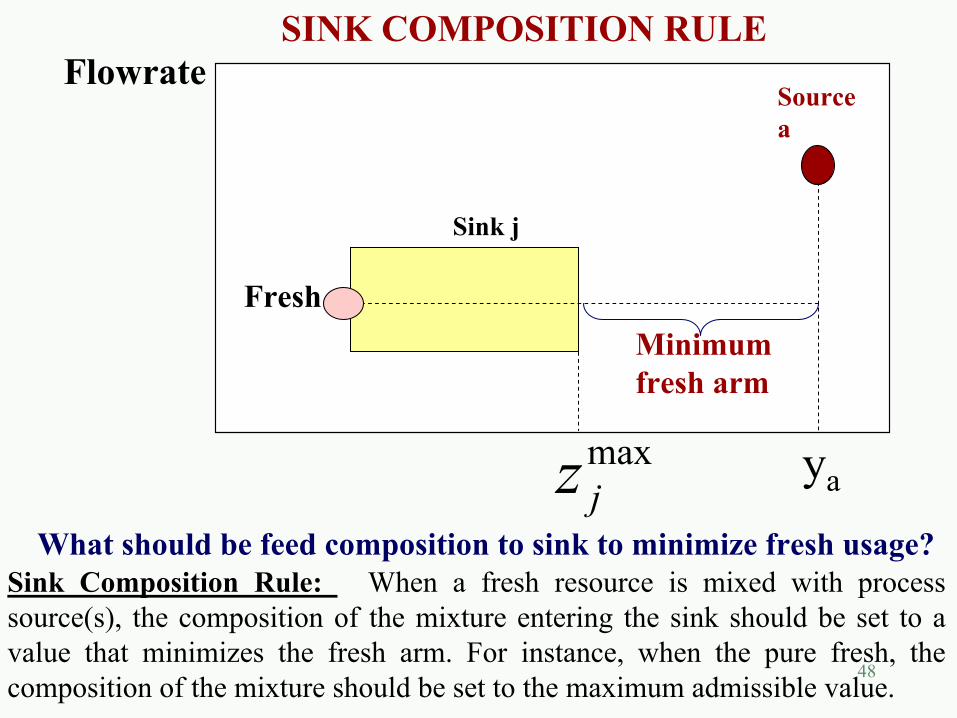
SINK COMPOSITION RULE
What should be feed composition to sink to minimize fresh usage?
Minimumfresh arm
Sink Composition Rule: When a fresh resource is mixed with process source(s), the composition of the mixture entering the sink should be set to a value that minimizes the fresh arm. For instance, when the pure fresh, the composition of the mixture should be set to the maximum admissible value.
49
Flowrate
Composition
Sourcea
Sourceb
ya yb
Fresh
Sink j
maxjzyF
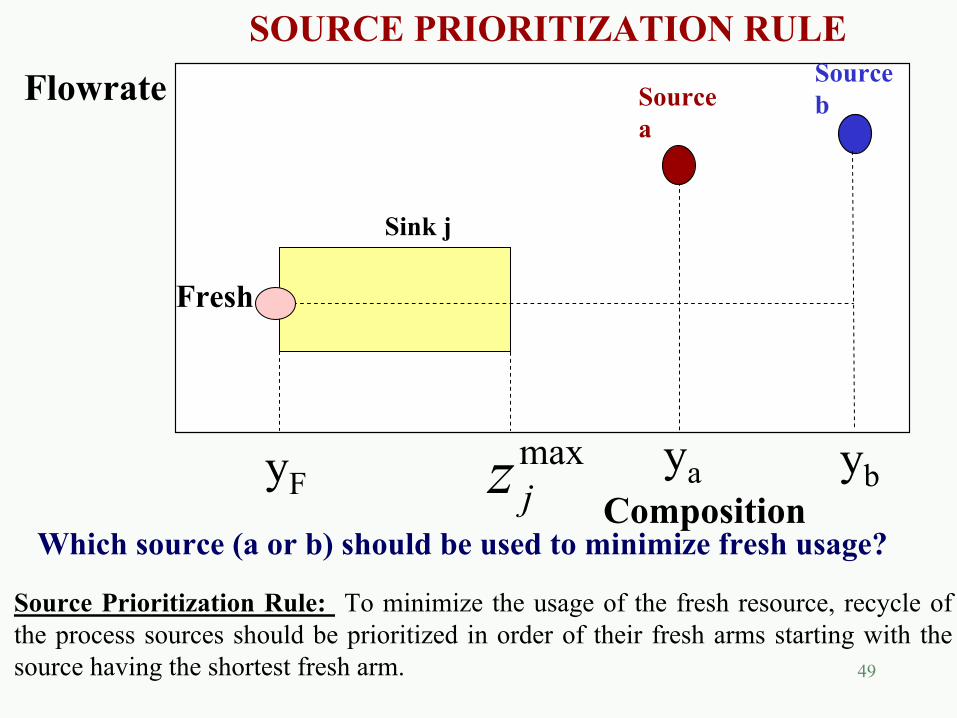
SOURCE PRIORITIZATION RULE
Which source (a or b) should be used to minimize fresh usage?
Source Prioritization Rule: To minimize the usage of the fresh resource, recycle of the process sources should be prioritized in order of their fresh arms starting with the source having the shortest fresh arm.
50
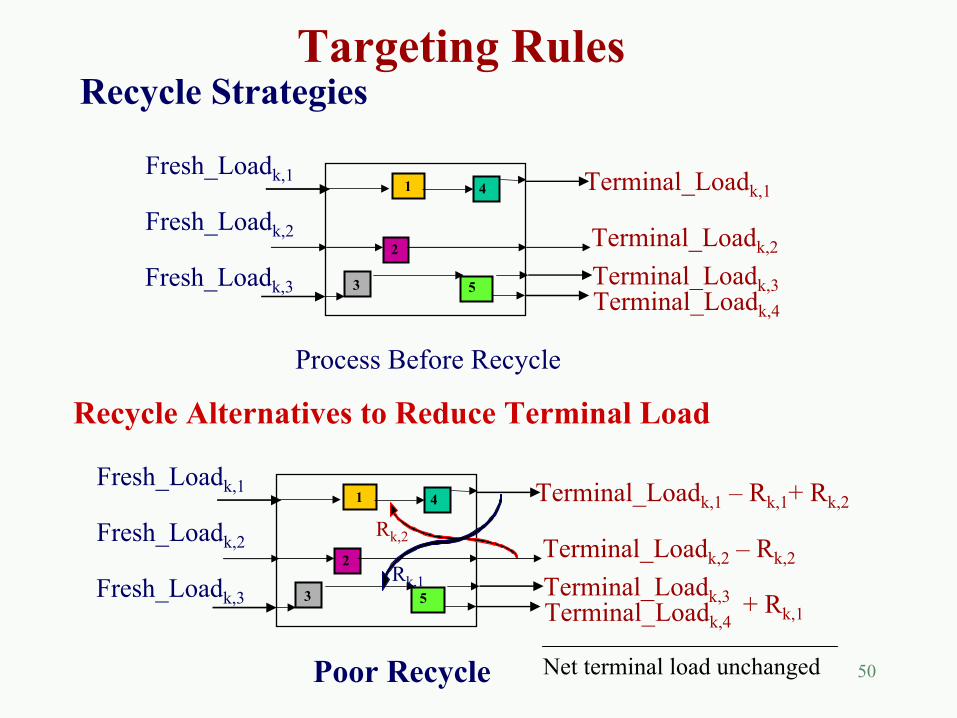
Recycle Alternatives to Reduce Terminal Load
Targeting Rules
1
2
3
4
5
Process Before Recycle
Fresh_Loadk,1
Fresh_Loadk,2
Fresh_Loadk,3
Terminal_Loadk,1
Terminal_Loadk,2
Terminal_Loadk,3Terminal_Loadk,4
1
2
3
4
5
Fresh_Loadk,1
Fresh_Loadk,2
Fresh_Loadk,3
Terminal_Loadk,1 – Rk,1+ Rk,2
Terminal_Loadk,2 – Rk,2
Terminal_Loadk,3Terminal_Loadk,4
+ Rk,1
Rk,1
Rk,2
Poor Recycle Net terminal load unchanged
Recycle Strategies
51
1
2
3
4
5
R k,1
R k,2
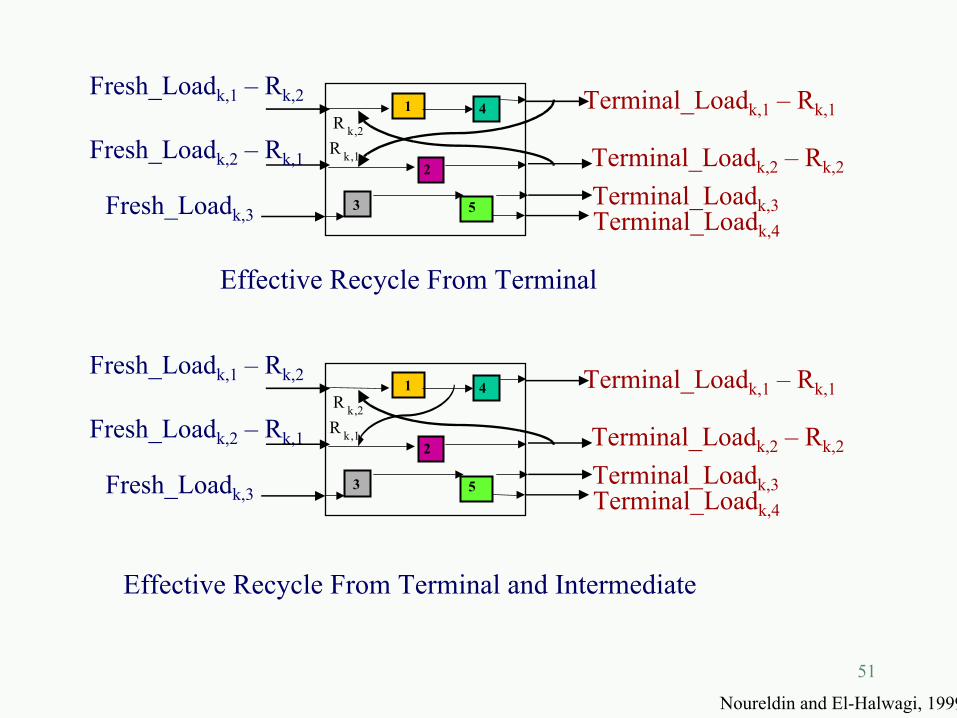
Effective Recycle From Terminal
Effective Recycle From Terminal and Intermediate
Fresh_Loadk,1 – Rk,2
Fresh_Loadk,2 – Rk,1
Fresh_Loadk,3
Terminal_Loadk,1 – Rk,1
Terminal_Loadk,2 – Rk,2
Terminal_Loadk,3Terminal_Loadk,4
1
2
3
4
5
R k,1
R k,2
Fresh_Loadk,1 – Rk,2
Fresh_Loadk,2 – Rk,1
Fresh_Loadk,3
Terminal_Loadk,1 – Rk,1
Terminal_Loadk,2 – Rk,2
Terminal_Loadk,3Terminal_Loadk,4
Noureldin and El-Halwagi, 1999
52
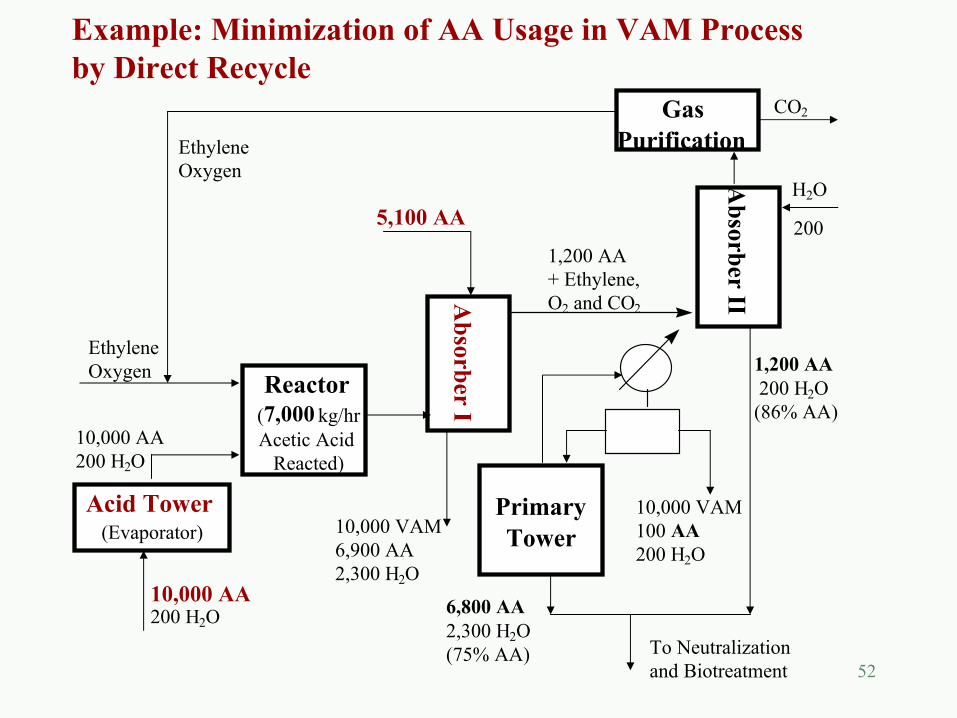
Acid Tower(Evaporator)
Reactor(7,000 kg/hrAcetic Acid
Reacted)
Absorber I
Absorber II
GasPurification
PrimaryTower
EthyleneOxygen
CO2
H2O
200
EthyleneOxygen
10,000 AA200 H2O
10,000 AA200 H2O
5,100 AA
1,200 AA+ Ethylene, O2 and CO2
10,000 VAM6,900 AA2,300 H2O
6,800 AA2,300 H2O(75% AA)
10,000 VAM100 AA200 H2O
1,200 AA200 H2O
(86% AA)
To Neutralization and Biotreatment
Example: Minimization of AA Usage in VAM Processby Direct Recycle
53
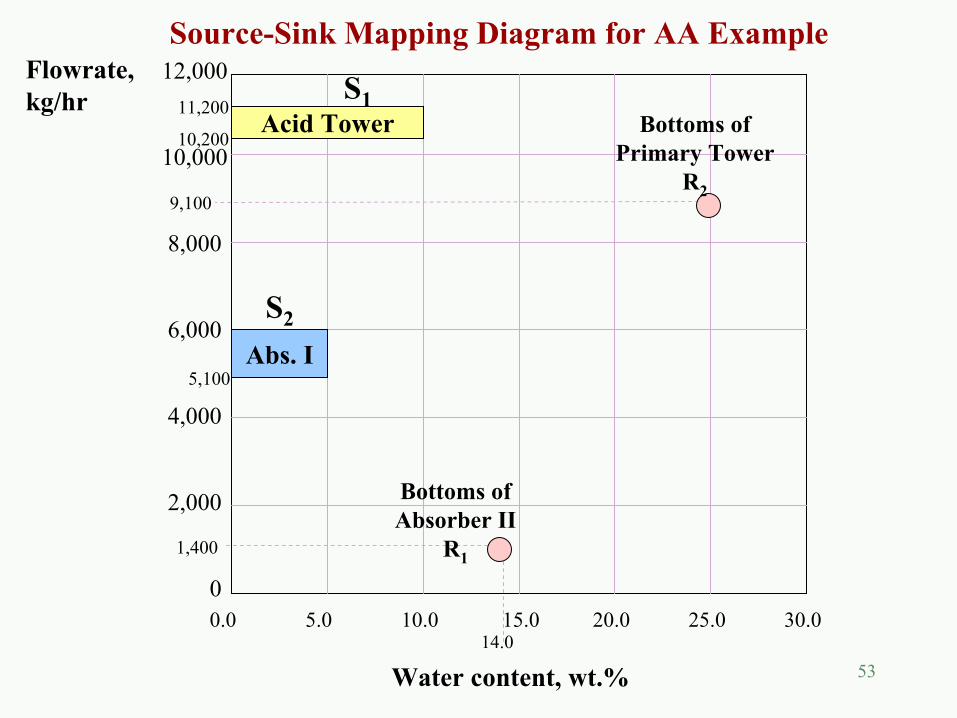
12,000
10,000
8,000
6,000
4,000
2,000
00.0 5.0 10.0 15.0 20.0 25.0 30.0
1,400
14.0
Bottoms ofAbsorber II
R1
9,100
Bottoms ofPrimary Tower
R2
Acid Tower10,200
11,200
Abs. I
S1
S2
5,100
Flowrate, kg/hr
Water content, wt.%
Source-Sink Mapping Diagram for AA Example
54
12,000
10,000
8,000
6,000
4,000
2,000
00.0 5.0 10.0 15.0 20.0 25.0 30.0
1,400
14.0
Bottoms ofAbsorber II
R1
9,100
Bottoms ofPrimary Tower
R2
Acid Tower10,200
11,200
Abs. I
S1
S2
5,100
Flowrate, kg/hr
Water content, wt.%
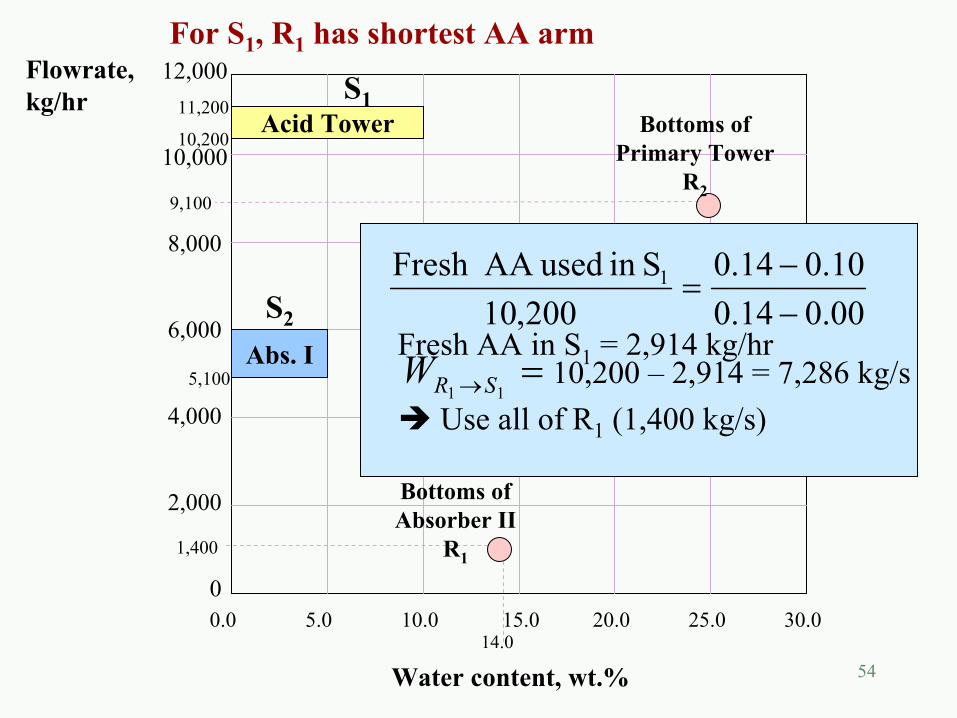
For S1, R1 has shortest AA arm
00.014.010.014.0
200,10Sin usedAA Fresh 1
−−
=
Fresh AA in S1 = 2,914 kg/hr10,200 – 2,914 = 7,286 kg/s=→ 11 SRW
Use all of R1 (1,400 kg/s)
55
12,000
10,000
8,000
6,000
4,000
2,000
00.0 5.0 10.0 15.0 20.0 25.0 30.0
1,400
14.0
Bottoms ofAbsorber II
R1
9,100
Bottoms ofPrimary Tower
R2
Acid Tower10,200
11,200
Abs. I
S1
S2
5,100
Flowrate, kg/hr
Water content, wt.%
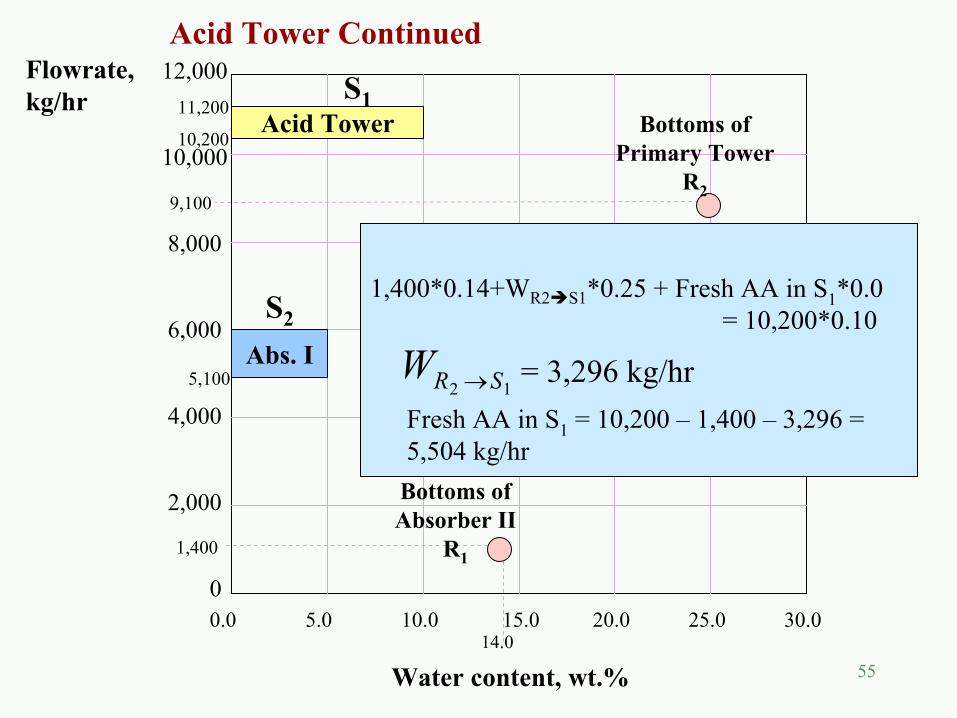
Acid Tower Continued
1,400*0.14+WR2 S1*0.25 + Fresh AA in S1*0.0= 10,200*0.10
12 SRW → = 3,296 kg/hrFresh AA in S1 = 10,200 – 1,400 – 3,296 = 5,504 kg/hr
56
12,000
10,000
8,000
6,000
4,000
2,000
00.0 5.0 10.0 15.0 20.0 25.0 30.0
1,400
14.0
Bottoms ofAbsorber II
R1
9,100
Bottoms ofPrimary Tower
R2
Acid Tower10,200
11,200
Abs. I
S1
S2
5,100
Flowrate, kg/hr
Water content, wt.%
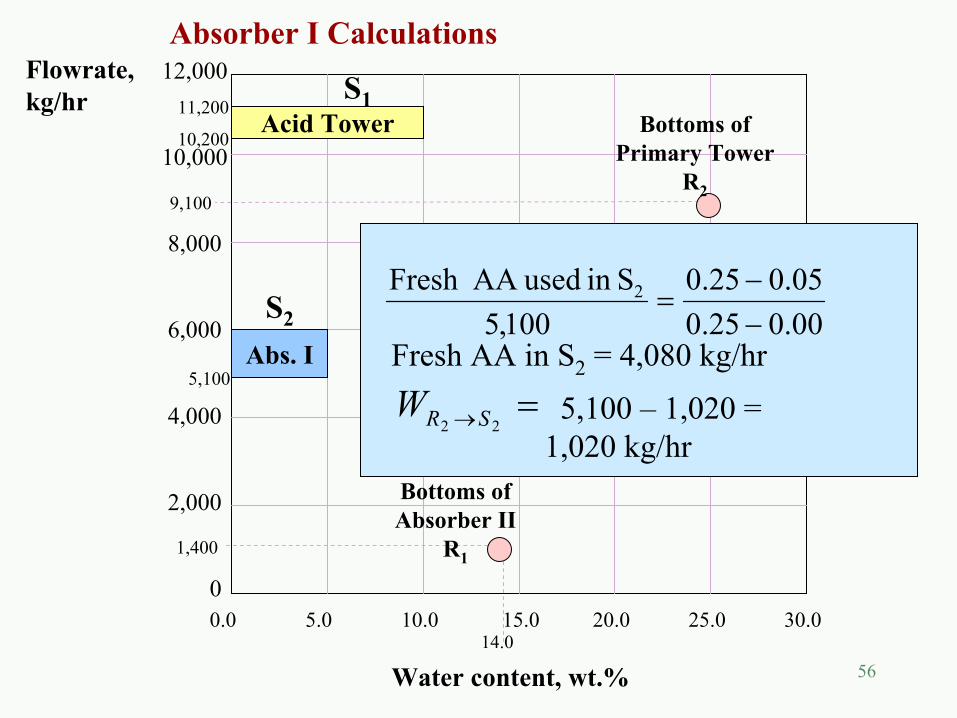
Absorber I Calculations
00.025.005.025.0
100,5Sin usedAA Fresh 2
−−
=
Fresh AA in S2 = 4,080 kg/hr
5,100 – 1,020 = 1,020 kg/hr
=→ 22 SRW
57
S1Acid Tower
S2Abs. I
Waste
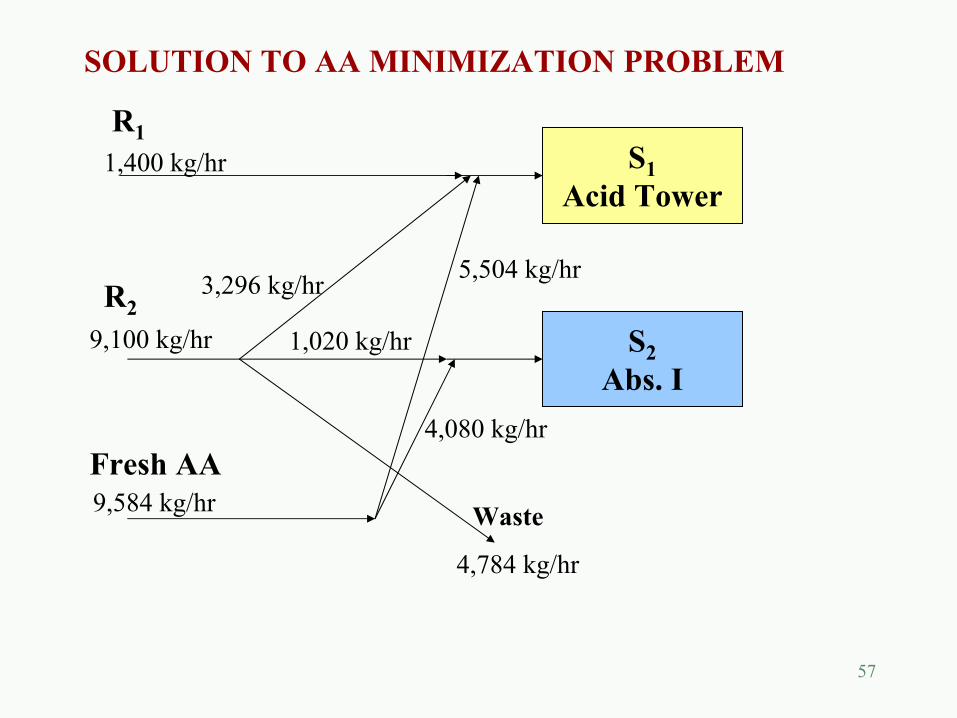
4,080 kg/hr
5,504 kg/hr3,296 kg/hr
1,020 kg/hr
4,784 kg/hr
R1
R2
Fresh AA
1,400 kg/hr
9,100 kg/hr
9,584 kg/hr
SOLUTION TO AA MINIMIZATION PROBLEM
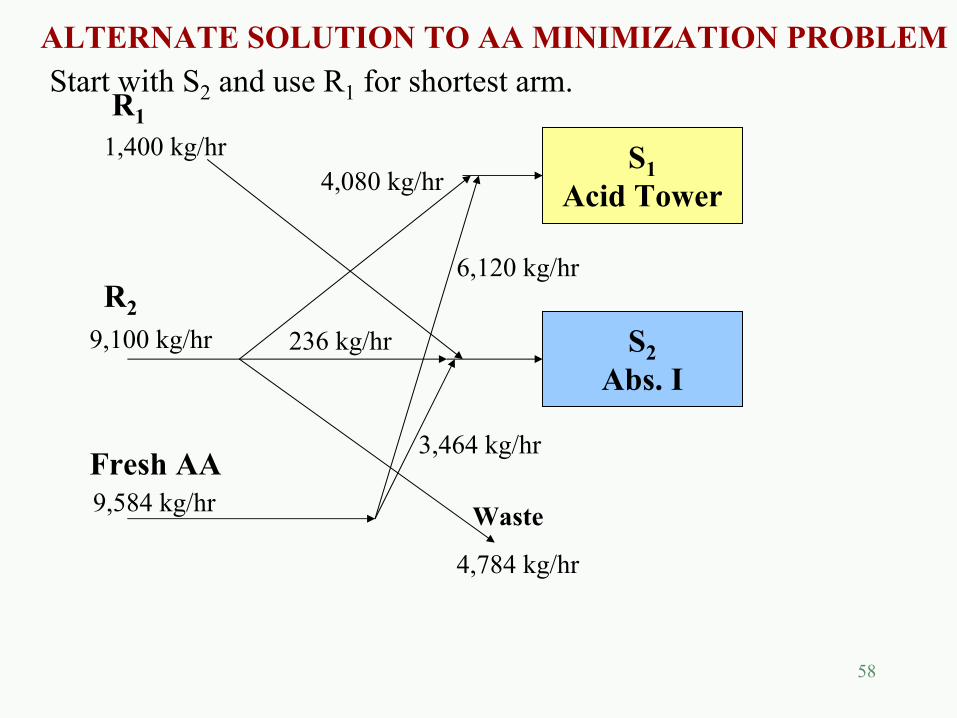
58
S1Acid Tower
S2Abs. I
Waste
6,120 kg/hr
4,080 kg/hr
3,464 kg/hr
236 kg/hr
4,784 kg/hr
R1
R2
Fresh AA
1,400 kg/hr
9,100 kg/hr
9,584 kg/hr
ALTERNATE SOLUTION TO AA MINIMIZATION PROBLEMStart with S2 and use R1 for shortest arm.
59
S1Acid Tower
S2Abs. I
R1
R2
Fresh AAWaste
1,400 kg/hr
9,100 kg/hr
3,772 kg/hr
5,812 kg/hr
9,584 kg/hr
3,688 kg/hr
628 kg/hr
4,784 kg/hr
700 kg/hr
700 kg/hr
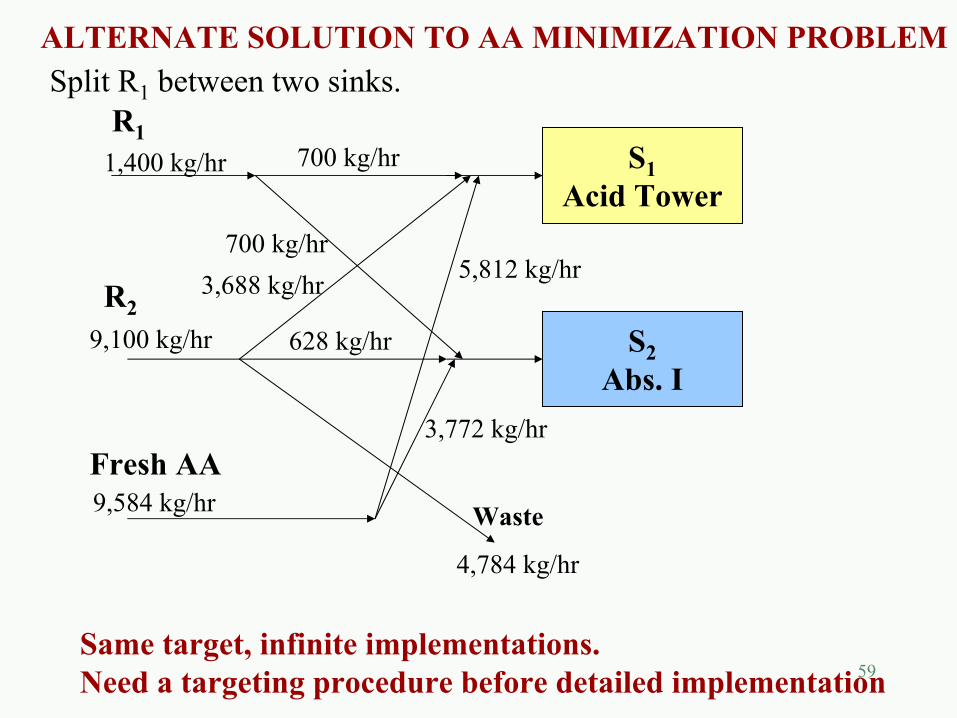
ALTERNATE SOLUTION TO AA MINIMIZATION PROBLEMSplit R1 between two sinks.
Same target, infinite implementations.Need a targeting procedure before detailed implementation
60
MATERIAL RECYCLE PINCH DIAGRAM
61
Load
Flowrate
SinkComposite
Curve
max,1SinkM
max,2SinkM
max,3SinkM
G1 G2 G3
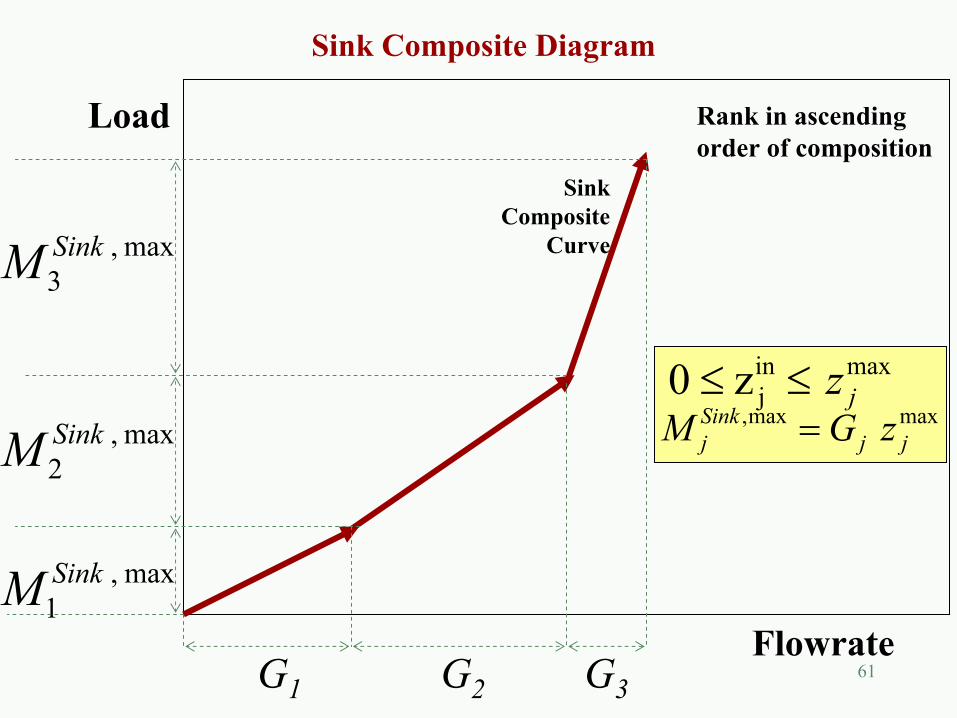
maxinj z 0 jz≤≤
maxmax,jj
Sinkj zGM =
Sink Composite Diagram
Rank in ascendingorder of composition
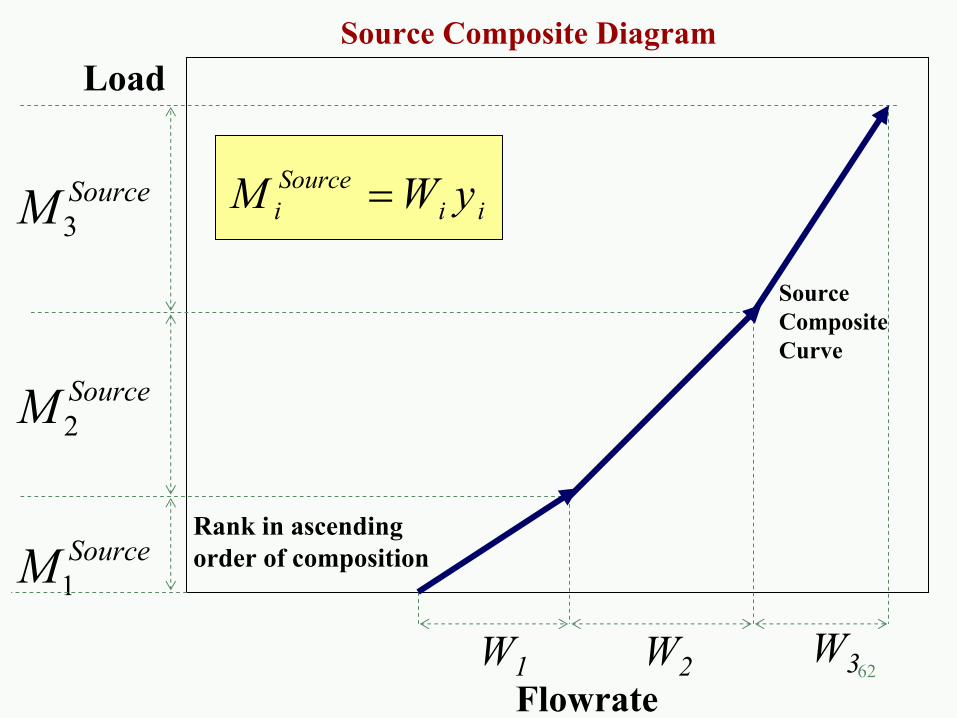
62
Load
Flowrate
SourceM1
SourceM 2
SourceM 3
W1 W2 W3
SourceCompositeCurve
Source Composite Diagram
iiSourcei yWM =
Rank in ascendingorder of composition
63
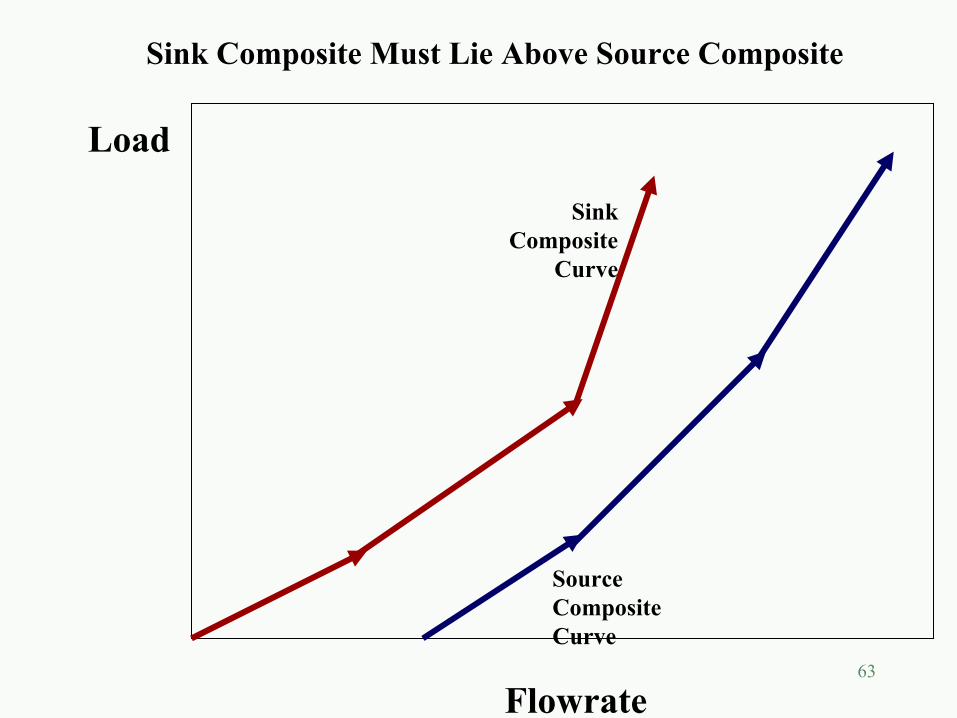
Load
Flowrate
SinkComposite
Curve
SourceCompositeCurve
Sink Composite Must Lie Above Source Composite
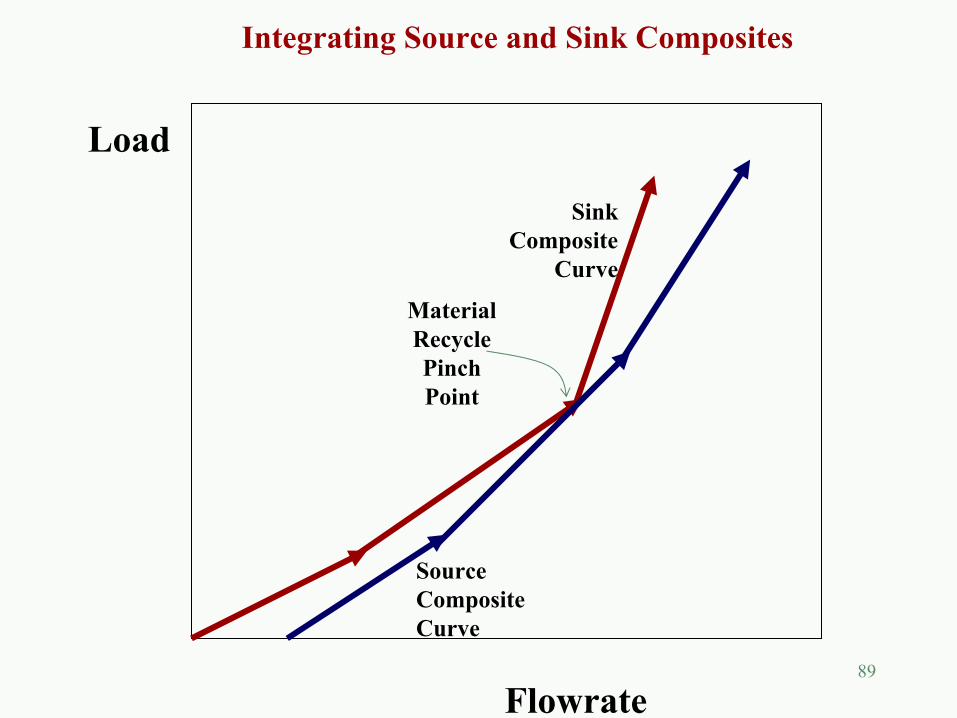
64
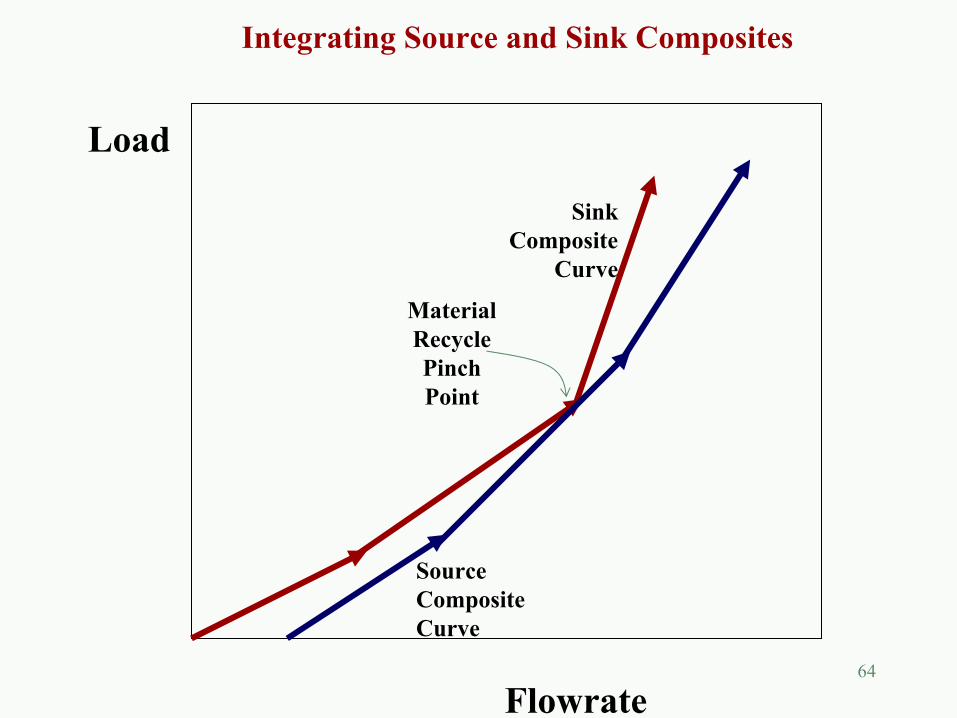
Load
Flowrate
MaterialRecyclePinchPoint
SinkComposite
Curve
SourceCompositeCurve
Integrating Source and Sink Composites
65
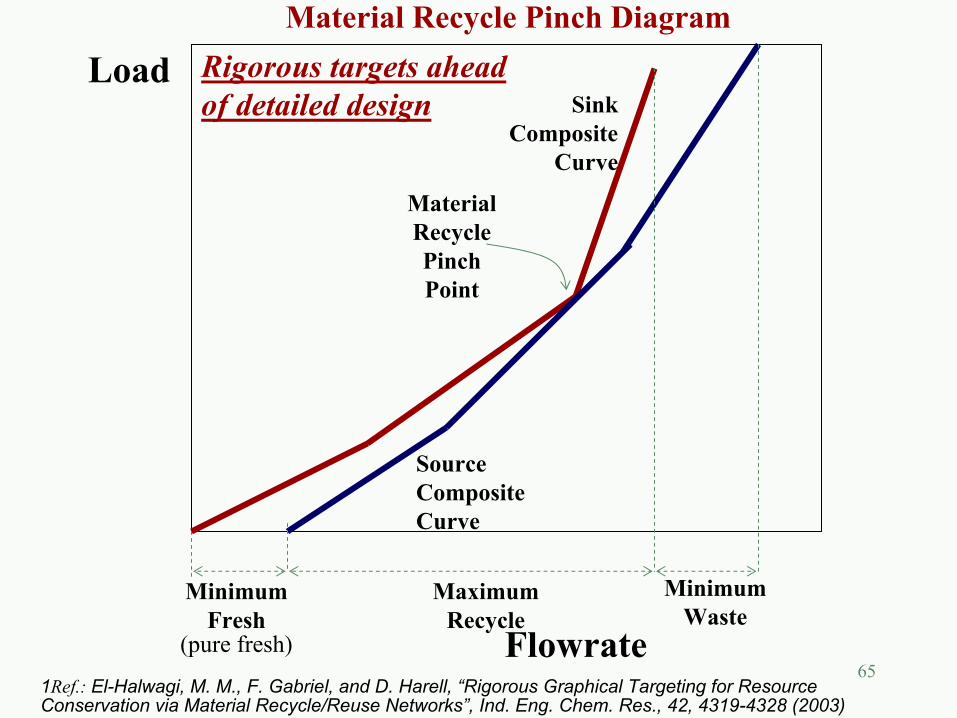
Rigorous targets ahead of detailed design
Load
FlowrateMinimum
WasteMinimum
FreshMaximum
Recycle
MaterialRecyclePinchPoint
SinkComposite
Curve
SourceCompositeCurve
Material Recycle Pinch Diagram
(pure fresh)
1Ref.: El-Halwagi, M. M., F. Gabriel, and D. Harell, “Rigorous Graphical Targeting for Resource Conservation via Material Recycle/Reuse Networks”, Ind. Eng. Chem. Res., 42, 4319-4328 (2003)
66
Load
Flowrate
WasteFresh Recycle
SinkComposite
Curve
SourceCompositeCurve
MinimumWaste
MinimumFresh
α
α
α
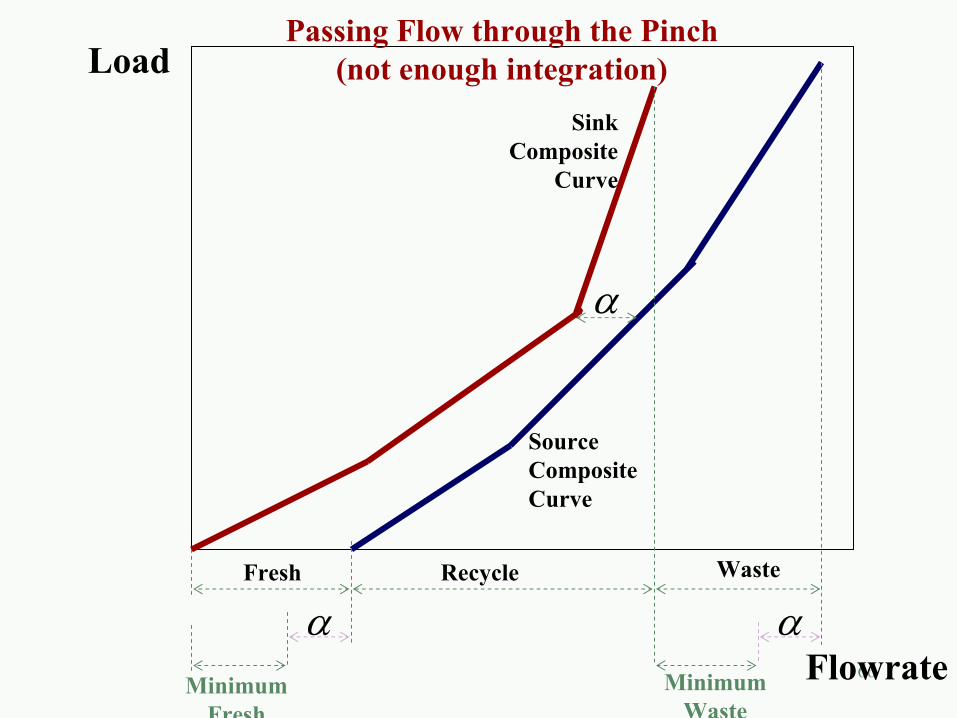
Passing Flow through the Pinch(not enough integration)
67
Load
Flowrate
SinkComposite
Curve
SourceCompositeCurve
InfeasibleRegion
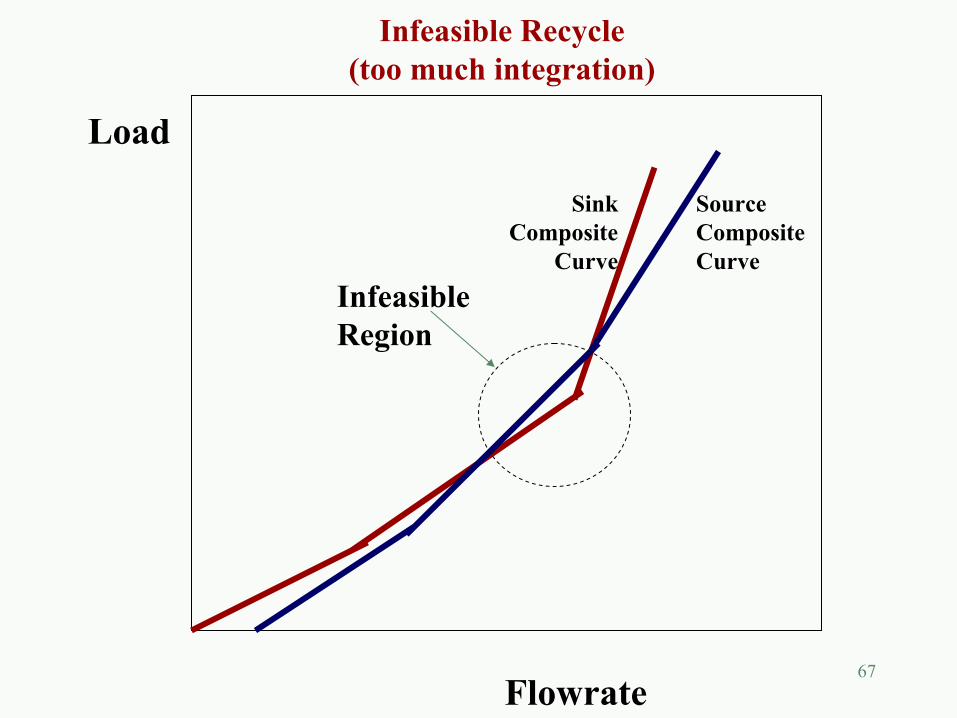
Infeasible Recycle(too much integration)
68
Load
Flowrate
MinimumWaste
MinimumFresh
MaximumRecycle
MaterialRecyclePinchPoint
SinkComposite
Curve SourceCompositeCurve
FreshLocus
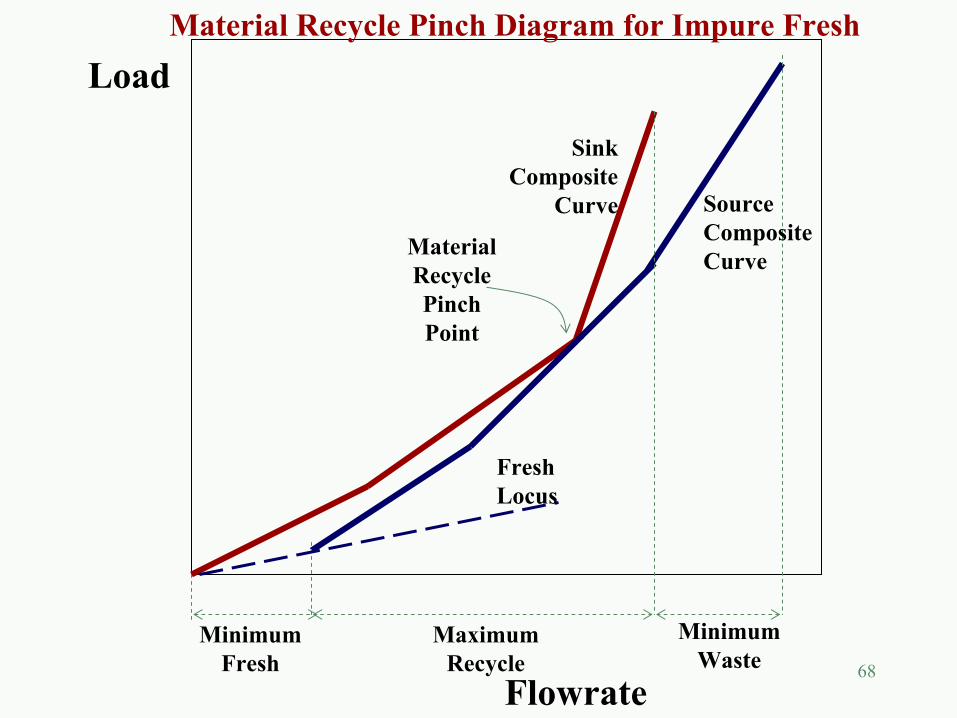
Material Recycle Pinch Diagram for Impure Fresh
69
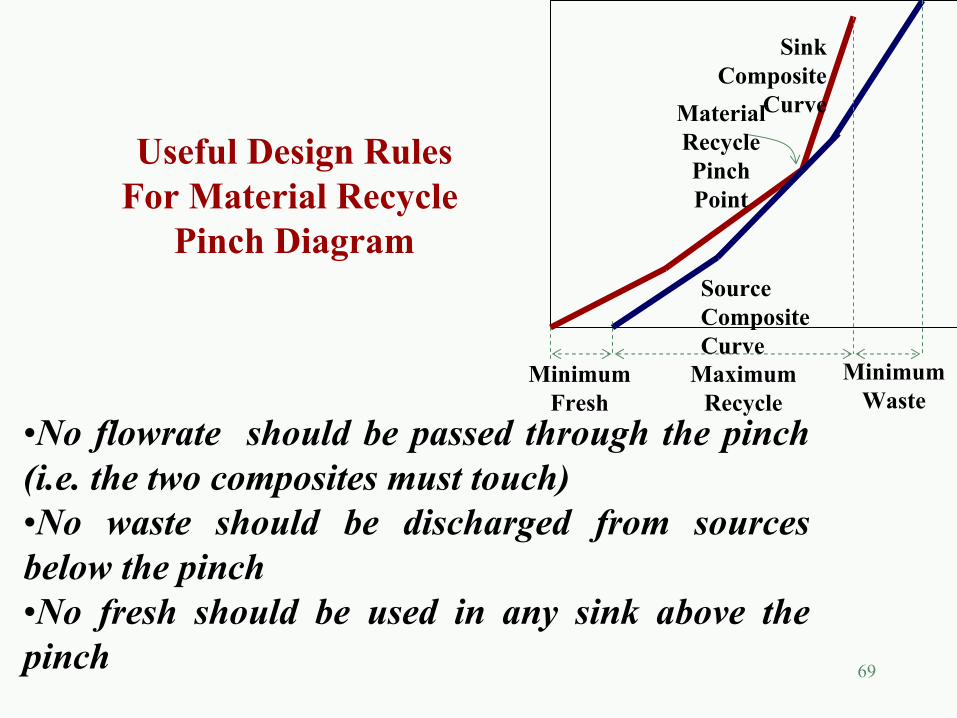
•No flowrate should be passed through the pinch (i.e. the two composites must touch)•No waste should be discharged from sources below the pinch•No fresh should be used in any sink above the pinch
Useful Design RulesFor Material Recycle
Pinch Diagram
MinimumWaste
MinimumFresh
MaximumRecycle
MaterialRecyclePinchPoint
SinkComposite
Curve
SourceCompositeCurve

70
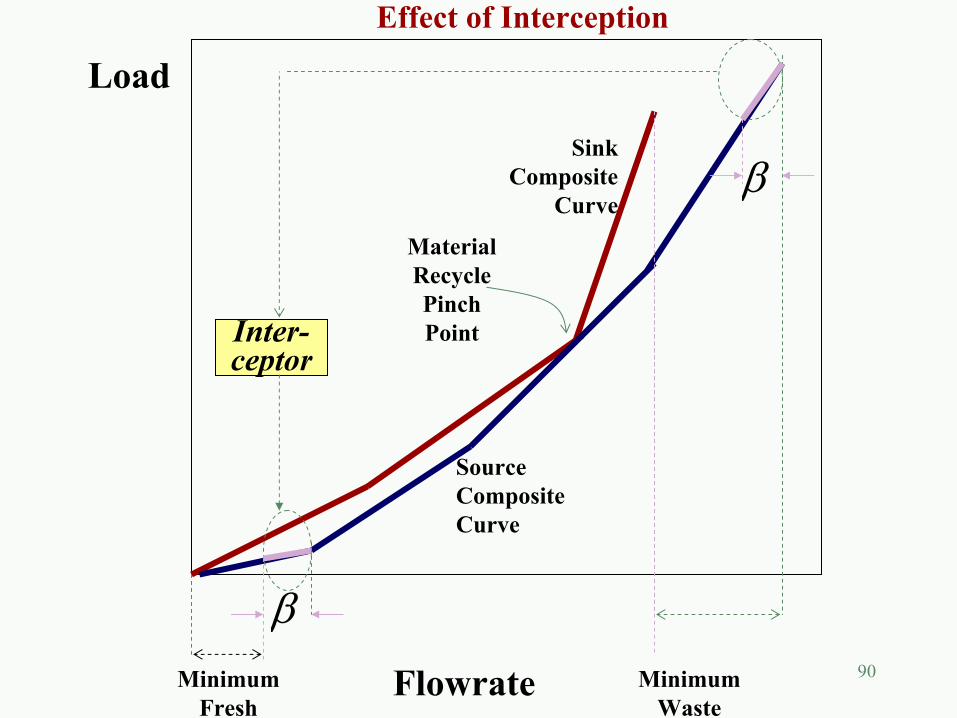
Load
Flowrate MinimumWaste
MinimumFresh
MaterialRecyclePinchPoint
SinkComposite
Curve
SourceCompositeCurve
β
β
Inter-ceptor
Effect of Interception
71
Load
Flowrate
SinkComposite
Curve
SourceCompositeCurve Inter-
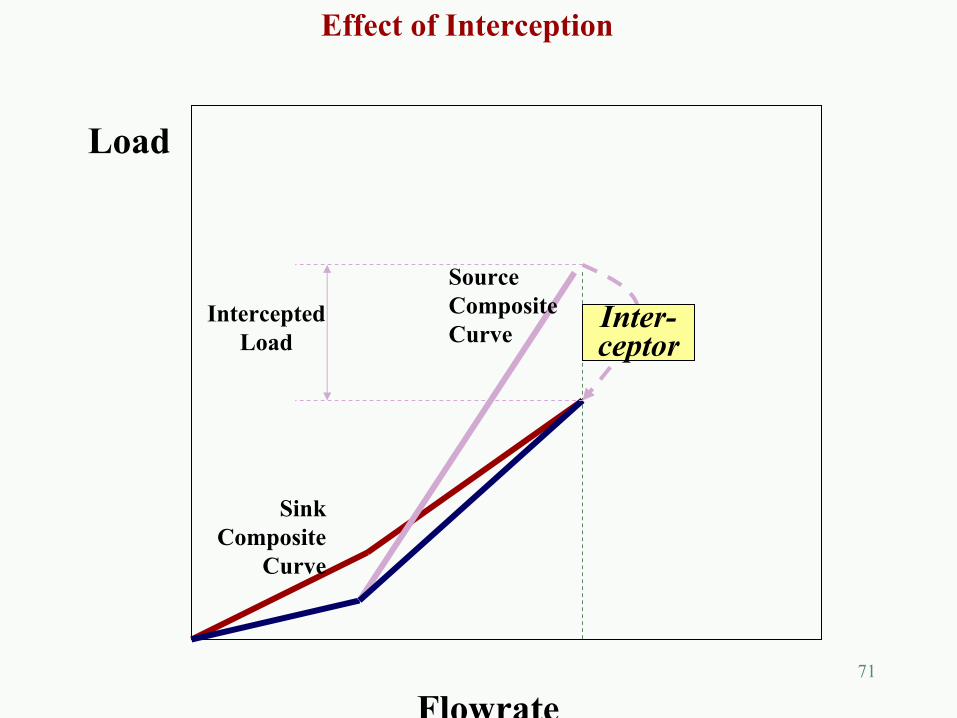
ceptorIntercepted
Load
Effect of Interception
72
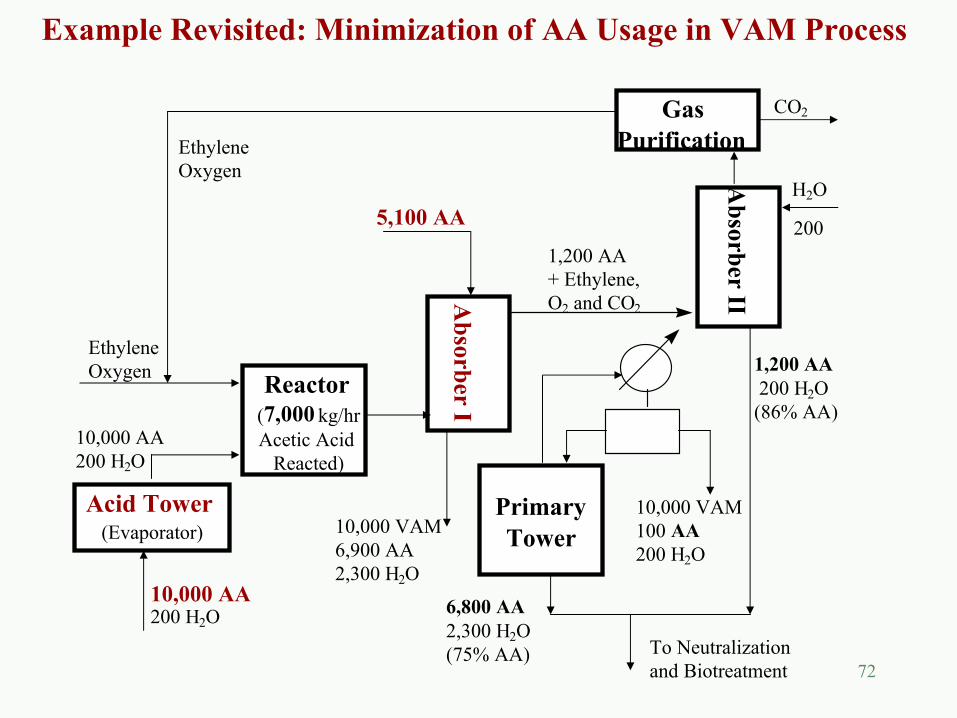
Acid Tower(Evaporator)
Reactor(7,000 kg/hrAcetic Acid
Reacted)
Absorber I
Absorber II
GasPurification
PrimaryTower
EthyleneOxygen
CO2
H2O
200
EthyleneOxygen
10,000 AA200 H2O
10,000 AA200 H2O
5,100 AA
1,200 AA+ Ethylene, O2 and CO2
10,000 VAM6,900 AA2,300 H2O
6,800 AA2,300 H2O(75% AA)
10,000 VAM100 AA200 H2O
1,200 AA200 H2O
(86% AA)
To Neutralization and Biotreatment
Example Revisited: Minimization of AA Usage in VAM Process
730
255
500
750
1000
1250
1500
1750
2000
2250
2500
Loadkg/hr
0 2 4 6 8 10 12 14 16 18 20Flowrate, 1000 kg/hr
250
5.1 15.3
Absrober
AcidTower
1275
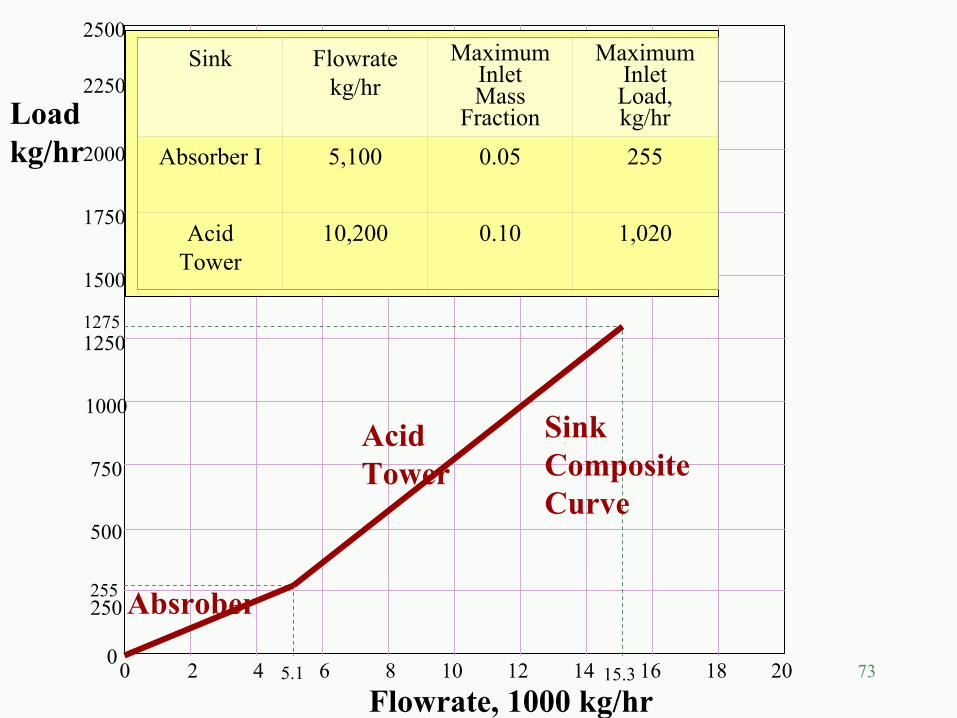
SinkCompositeCurve
Sink Flowratekg/hr
Maximum InletMass
Fraction
Maximum InletLoad, kg/hr
Absorber I 5,100 0.05 255
Acid Tower
10,200 0.10 1,020
740
2471
500
750
1000
1250
1500
1750
2000
2250
2500
Loadkg/hr
0 2 4 6 8 10 12 14 16 18 20Flowrate, 1000 kg/hr
250
1.4 10.5
Absrober IIBottoms
AcidTowerBottoms
196
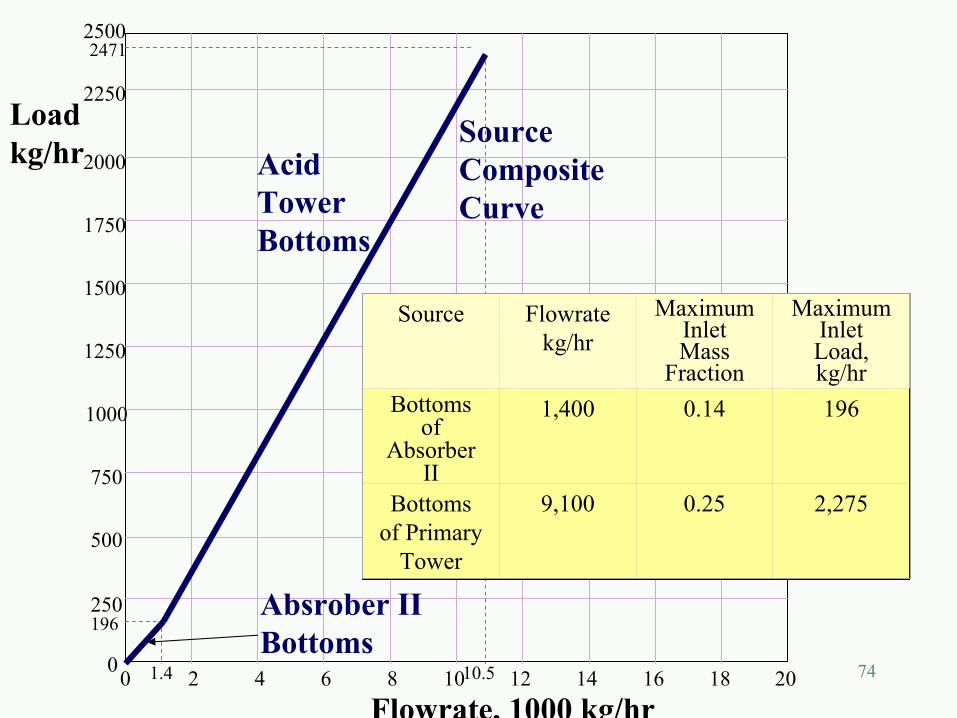
SourceCompositeCurve
Source Flowratekg/hr
Maximum InletMass
Fraction
Maximum InletLoad, kg/hr
Bottoms of
Absorber II
1,400 0.14 196
Bottoms of Primary
Tower
9,100 0.25 2,275
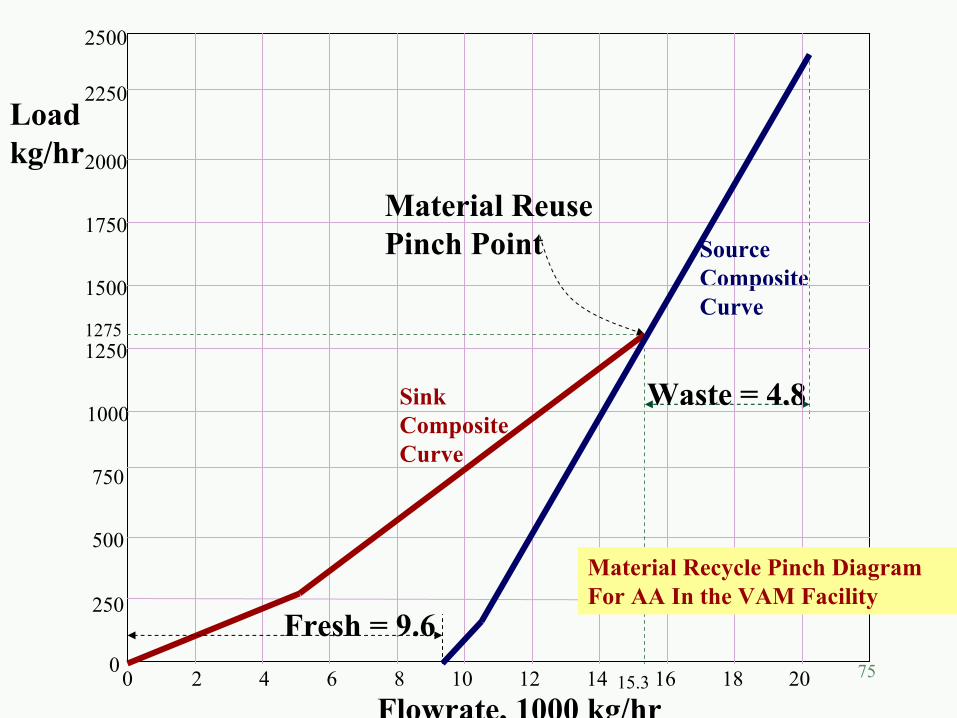
750
500
750
1000
1250
1500
1750
2000
2250
2500
Loadkg/hr
0 2 4 6 8 10 12 14 16 18 20Flowrate, 1000 kg/hr
250
15.3
1275
SinkCompositeCurve
SourceCompositeCurve
Fresh = 9.6
Material ReusePinch Point
Waste = 4.8
Material Recycle Pinch Diagram For AA In the VAM Facility
76
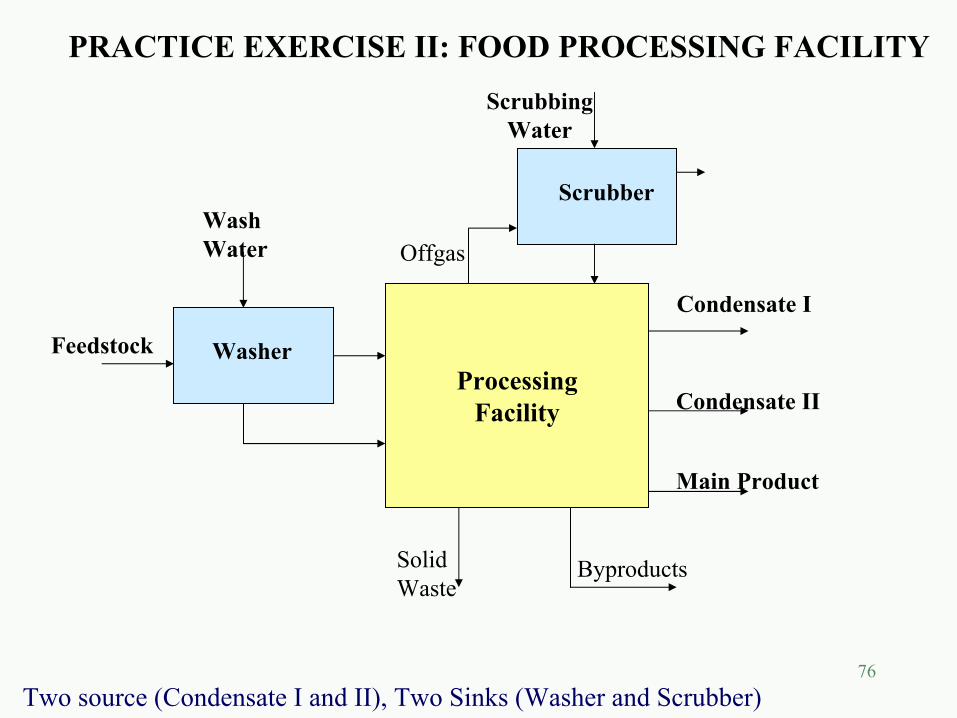
Feedstock Washer
Scrubber
ProcessingFacility
Condensate I
Condensate II
Main Product
Byproducts
WashWater
ScrubbingWater
Offgas
SolidWaste
PRACTICE EXERCISE II: FOOD PROCESSING FACILITY
Two source (Condensate I and II), Two Sinks (Washer and Scrubber)
77
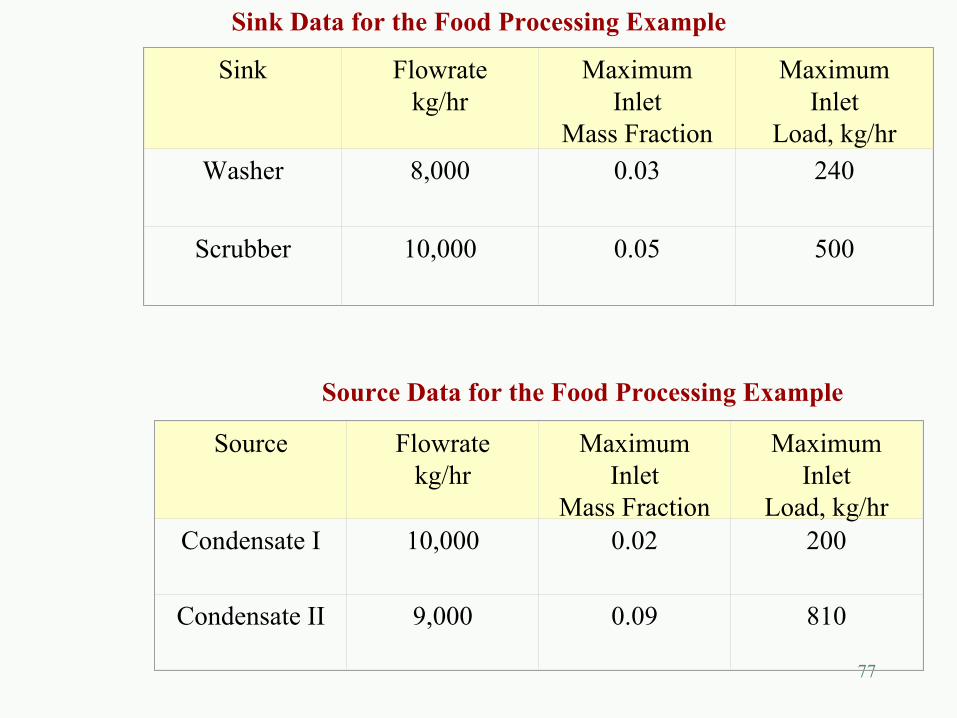
Sink Data for the Food Processing Example
Sink Flowratekg/hr
Maximum Inlet
Mass Fraction
Maximum Inlet
Load, kg/hrWasher 8,000 0.03 240
Scrubber 10,000 0.05 500
Source Data for the Food Processing Example
Source Flowratekg/hr
Maximum Inlet
Mass Fraction
Maximum Inlet
Load, kg/hrCondensate I 10,000 0.02 200
Condensate II 9,000 0.09 810
78
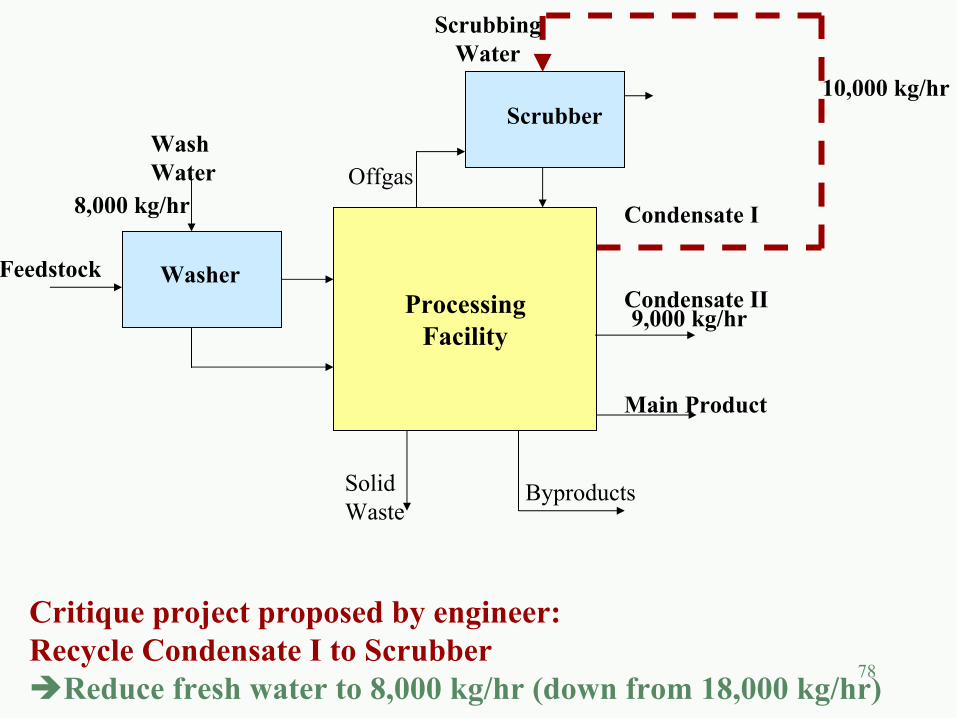
Feedstock Washer
Scrubber
ProcessingFacility
Condensate I
Condensate II
Main Product
Byproducts
WashWater
ScrubbingWater
Offgas
SolidWaste
10,000 kg/hr
9,000 kg/hr
8,000 kg/hr
Critique project proposed by engineer: Recycle Condensate I to Scrubber
Reduce fresh water to 8,000 kg/hr (down from 18,000 kg/hr)
79
CONCLUSIONS• Source and sink optimization rules•Stream rerouting and direct recycle opportunitiesusing source-sink mapping
• Overall targeting for direct recycle usingmaterial recycle pinch diagram
• Big-picture insights unseen by detailed eng.• Short-term projects must fit in integrated strategies
80
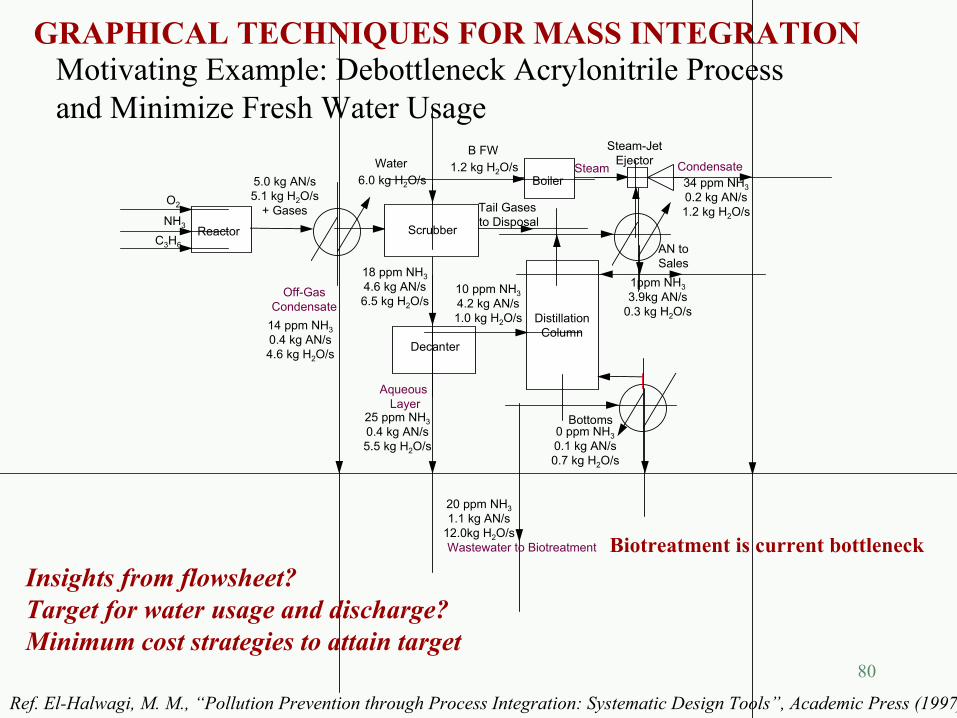
GRAPHICAL TECHNIQUES FOR MASS INTEGRATION
O2
Decanter
DistillationColumn
Aqueous Layer
Reactor ScrubberNH3
C3H6
Steam-JetEjectorSteam
Wastewater to Biotreatment
Off-GasCondensate
Condensate
Bottoms
Water
AN toSales
6.0 kg H2O/s
14 ppm NH30.4 kg AN/s4.6 kg H2O/s
25 ppm NH30.4 kg AN/s5.5 kg H2O/s
34 ppm NH30.2 kg AN/s1.2 kg H2O/s
18 ppm NH34.6 kg AN/s6.5 kg H2O/s
10 ppm NH34.2 kg AN/s1.0 kg H2O/s
5.0 kg AN/s5.1 kg H2O/s
+ Gases
20 ppm NH31.1 kg AN/s
12.0kg H2O/s
Tail Gases to Disposal
B FW1.2 kg H2O/s
Boiler
0 ppm NH30.1 kg AN/s0.7 kg H2O/s
1ppm NH33.9kg AN/s
0.3 kg H2O/s
Motivating Example: Debottleneck Acrylonitrile Process and Minimize Fresh Water Usage
Biotreatment is current bottleneckInsights from flowsheet?Target for water usage and discharge?Minimum cost strategies to attain target
Ref. El-Halwagi, M. M., “Pollution Prevention through Process Integration: Systematic Design Tools”, Academic Press (1997)

81
A systematic methodology that provides fundamental understanding of
the global flow of mass within a process and employs this understanding
in identifying performance targets and optimizing the generation and routing
of species throughout the process.
Critical Need:
Mass integrationTo: • Determine performance targets ahead of detailed design (e.g., minimum raw material consumption, maximum process yield, minimum waste discharge, maximum recovery, etc.)• Identify optimum:1. Allocation (routing) of streams and species2. Changes in generation/depletion of species3. New units to be added to the process4. New materials/streams to be added to the process
Identify optimum revisions in flowsheet to reach target
Big picture first, details later
82
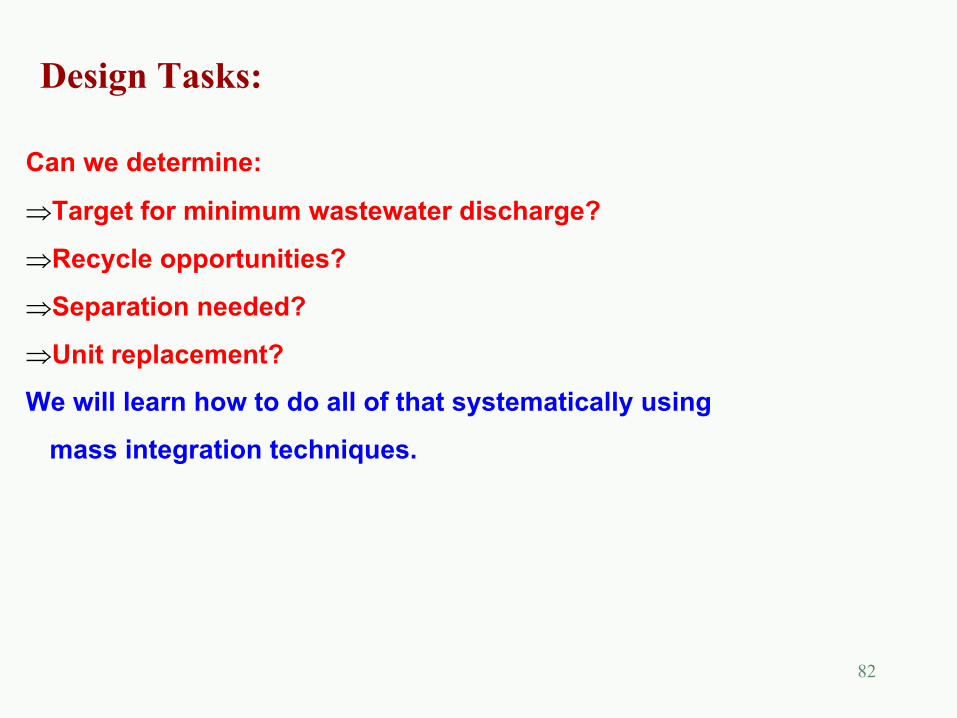
Can we determine:
⇒Target for minimum wastewater discharge?
⇒Recycle opportunities?
⇒Separation needed?
⇒Unit replacement?
We will learn how to do all of that systematically using
mass integration techniques.
Design Tasks:

83
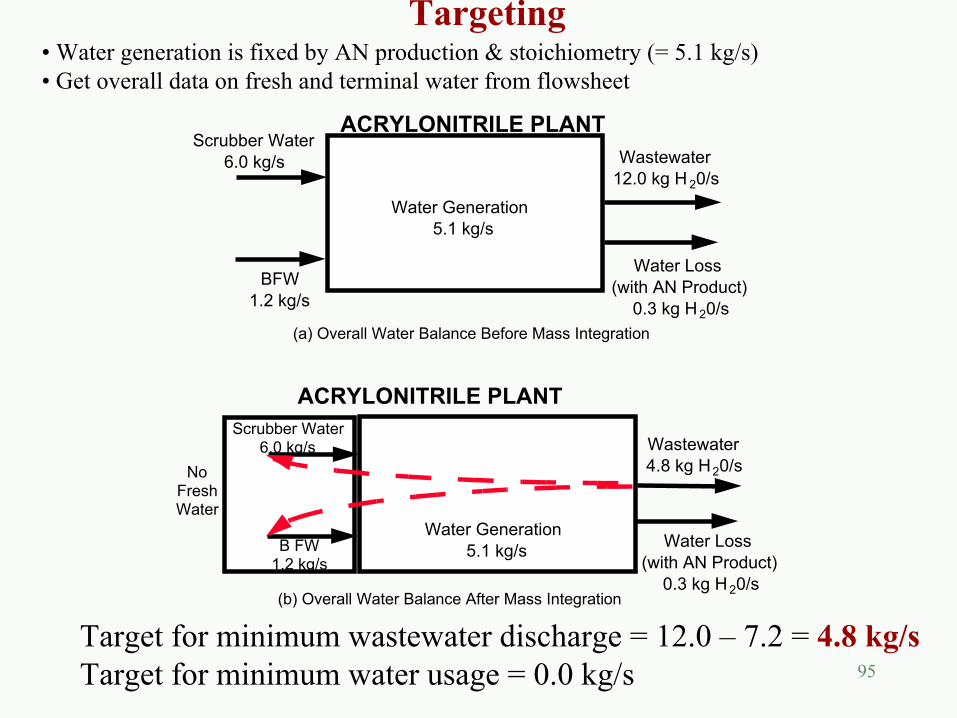
Scrubber Water6.0 kg/s
BFW1.2 kg/s
Water Generation 5.1 kg/s
ACRYLONITRILE PLANTWastewater
12.0 kg H 20/s
Water Loss (with AN Product)
0.3 kg H 20/s
Scrubber Water6.0 kg/s
B FW1.2 kg/s
Water Generation 5.1 kg/s
ACRYLONITRILE PLANT
Wastewater4.8 kg H20/s
Water Loss (with AN Product)
0.3 kg H 20/s
NoFreshWater
(a) Overall Water Balance Before Mass Integration
(b) Overall Water Balance After Mass Integration
Target for minimum wastewater discharge = 12.0 – 7.2 = 4.8 kg/sTarget for minimum water usage = 0.0 kg/s
• Water generation is fixed by AN production & stoichiometry (= 5.1 kg/s)• Get overall data on fresh and terminal water from flowsheet
Targeting

84
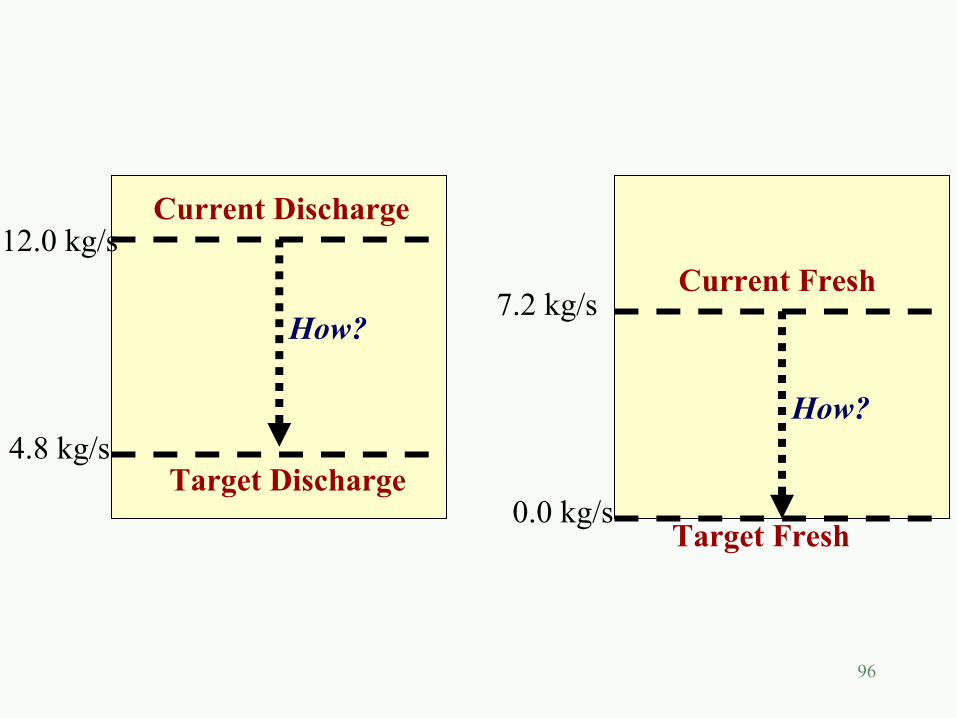
12.0 kg/s
4.8 kg/s
Current Discharge
Target Discharge
How?7.2 kg/s
0.0 kg/s
Current Fresh
Target Fresh
How?

85
DEVELOPMENT OF MASS INTEGRATIONSTRATEGIES TO REACH THE TARGET
86
Mass/Energy-Separating Agents in
Mass/Energy-Separating Agents out
.
.
.
#1
#2
Nsinks
.
.
.
Sources SegregatedSources
Sinks/Generators
Sources(Back toProcess)
InterceptionNetwork
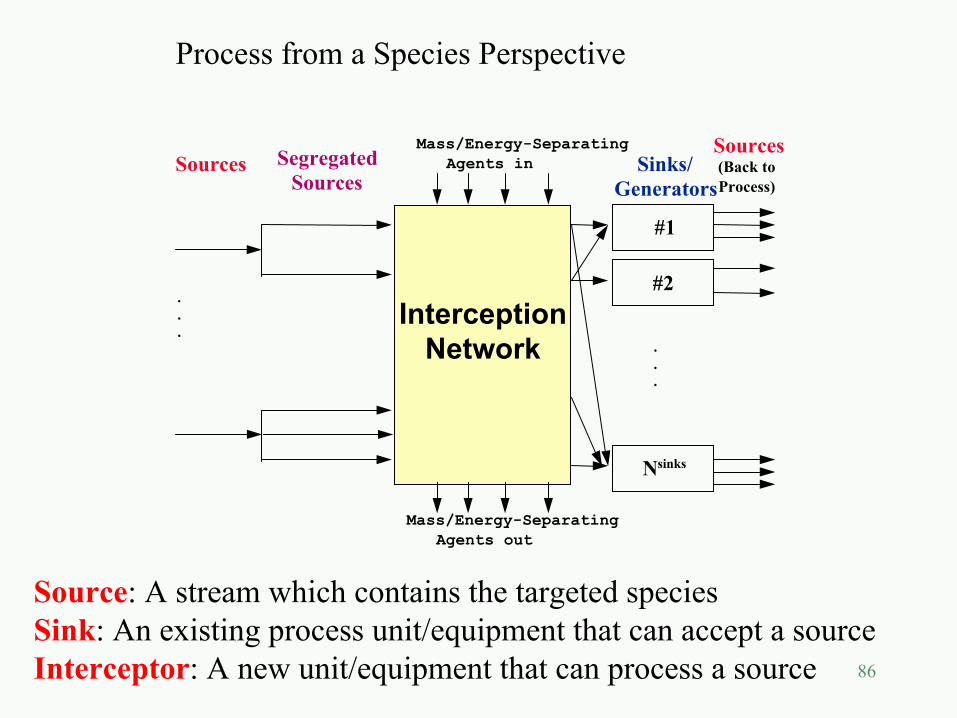
Process from a Species Perspective
Source: A stream which contains the targeted speciesSink: An existing process unit/equipment that can accept a sourceInterceptor: A new unit/equipment that can process a source
87
Mass Integration Strategies
No Cost/ Low Cost Strategies
Modest Sink/GeneratorManipulation
(e.g. Moderate Changes in Operating Conditions)
Minor Structural Modifications
(Segregation, Mixing, Recycle, etc.)
Moderate-Cost Modifications
Target
Equipment Addition/Replacement
(Interception/Separation devices, etc)
Material Substitution(Solvent , Catalyst, etc.)
(New Chemistry, New Processing Technology, etc)
Technology ChangesNewTechnologies
CO
ST, I
MPA
CT
AC
CE
PTA
BIL
ITY
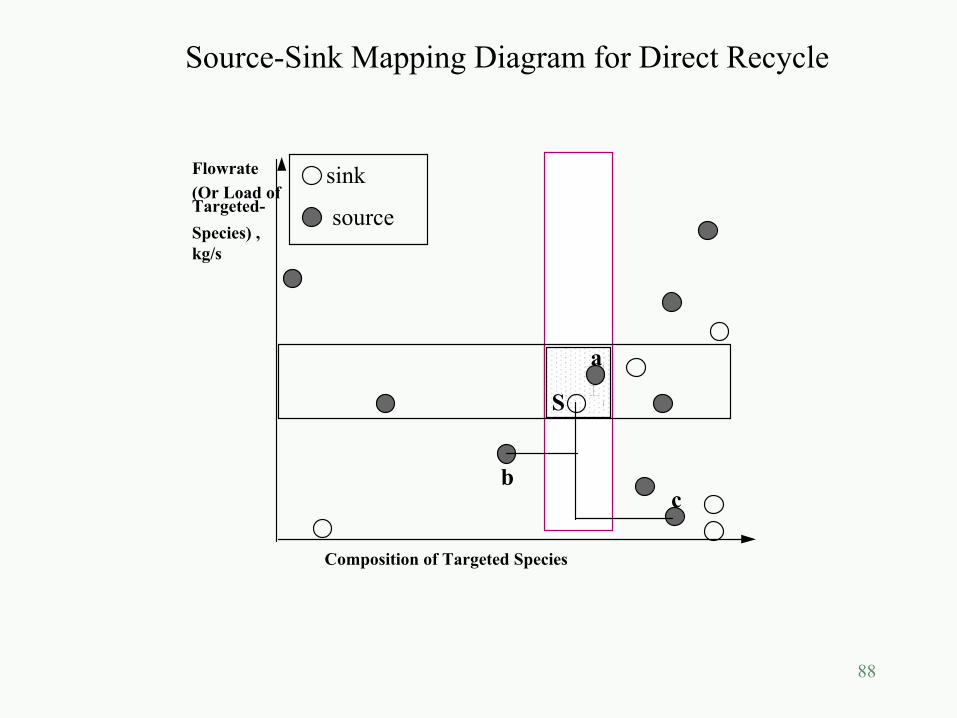
88
Composition of Targeted Species
Flowrate(Or Load ofTargeted-Species) ,kg/s
sink
source
a
bc
S
Source-Sink Mapping Diagram for Direct Recycle
89
Load
Flowrate
MaterialRecyclePinchPoint
SinkComposite
Curve
SourceCompositeCurve
Integrating Source and Sink Composites
90
Load
Flowrate MinimumWaste
MinimumFresh
MaterialRecyclePinchPoint
SinkComposite
Curve
SourceCompositeCurve
β
β
Inter-ceptor
Effect of Interception
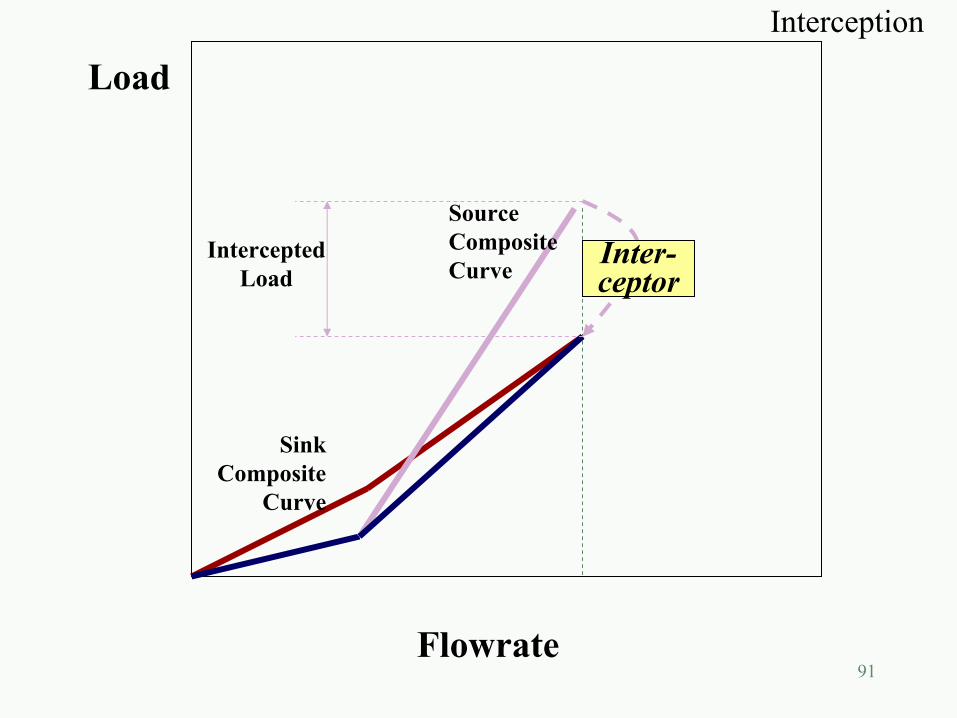
91
Load
Flowrate
SinkComposite
Curve
SourceCompositeCurve Inter-
ceptorIntercepted
Load
Interception
92
DETAILING MASS INTEGRATION STRATEGIES
93
Reactor Decanter
Scrubber
Distillation
BoilerSJE
OxygenAmmoniaPropylene
WaterBFW
Tail Gases
ANto Sales
Wastewater(to Biotreatment)
OffgasCondensate
AqueousLayer Distillation
Bottoms
EjectorCondensate
Bottleneck
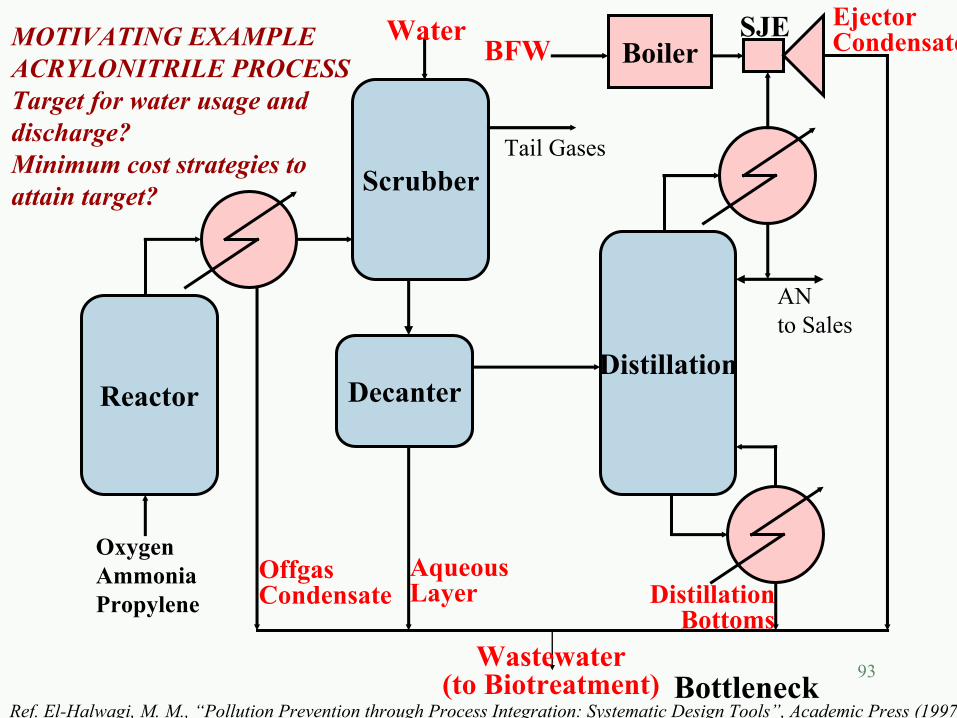
MOTIVATING EXAMPLEACRYLONITRILE PROCESSTarget for water usage and discharge?Minimum cost strategies to attain target?
Ref. El-Halwagi, M. M., “Pollution Prevention through Process Integration: Systematic Design Tools”, Academic Press (1997)
94
O2
Decanter
DistillationColumn
Aqueous Layer
Reactor ScrubberNH3
C3H6
Steam-JetEjectorSteam
Wastewater to Biotreatment
Off-GasCondensate
Condensate
Bottoms
Water
AN toSales
6.0 kg H2O/s
14 ppm NH30.4 kg AN/s4.6 kg H2O/s
25 ppm NH30.4 kg AN/s5.5 kg H2O/s
34 ppm NH30.2 kg AN/s1.2 kg H2O/s
18 ppm NH34.6 kg AN/s6.5 kg H2O/s
10 ppm NH34.2 kg AN/s1.0 kg H2O/s
5.0 kg AN/s5.1 kg H2O/s
+ Gases
20 ppm NH31.1 kg AN/s
12.0kg H2O/s
Tail Gases to Disposal
B FW1.2 kg H2O/s
Boiler
0 ppm NH30.1 kg AN/s0.7 kg H2O/s
1ppm NH33.9kg AN/s
0.3 kg H2O/s
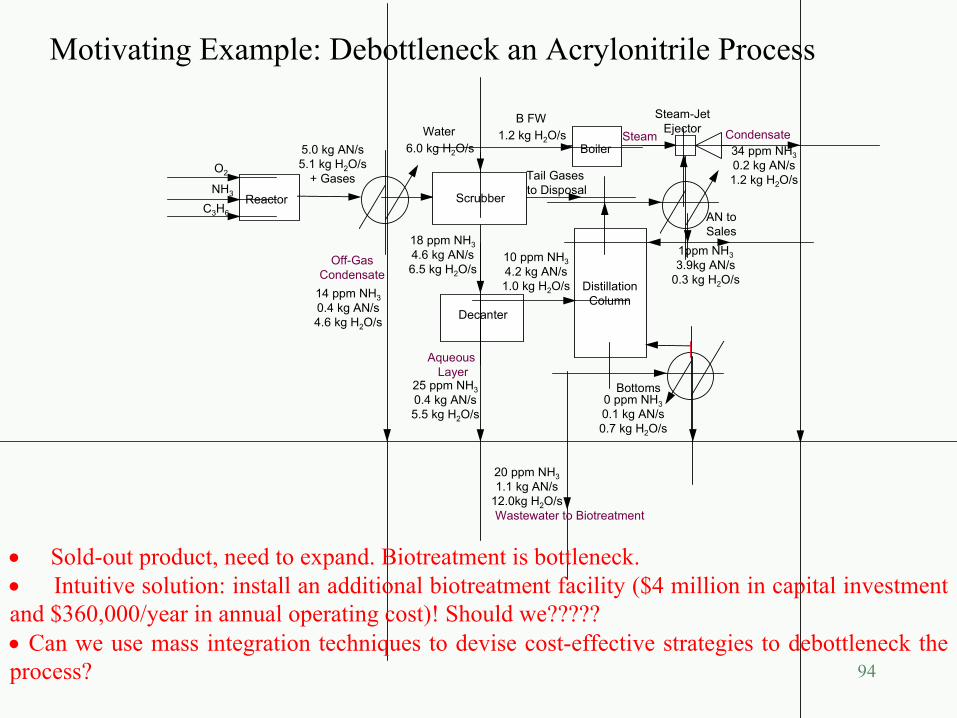
• Sold-out product, need to expand. Biotreatment is bottleneck.• Intuitive solution: install an additional biotreatment facility ($4 million in capital investment and $360,000/year in annual operating cost)! Should we?????• Can we use mass integration techniques to devise cost-effective strategies to debottleneck the process?
Motivating Example: Debottleneck an Acrylonitrile Process
95
Scrubber Water6.0 kg/s
BFW1.2 kg/s
Water Generation 5.1 kg/s
ACRYLONITRILE PLANTWastewater
12.0 kg H 20/s
Water Loss (with AN Product)
0.3 kg H 20/s
Scrubber Water6.0 kg/s
B FW1.2 kg/s
Water Generation 5.1 kg/s
ACRYLONITRILE PLANT
Wastewater4.8 kg H20/s
Water Loss (with AN Product)
0.3 kg H 20/s
NoFreshWater
(a) Overall Water Balance Before Mass Integration
(b) Overall Water Balance After Mass Integration
Target for minimum wastewater discharge = 12.0 – 7.2 = 4.8 kg/sTarget for minimum water usage = 0.0 kg/s
• Water generation is fixed by AN production & stoichiometry (= 5.1 kg/s)• Get overall data on fresh and terminal water from flowsheet
Targeting
96
12.0 kg/s
4.8 kg/s
Current Discharge
Target Discharge
How?7.2 kg/s
0.0 kg/s
Current Fresh
Target Fresh
How?
97
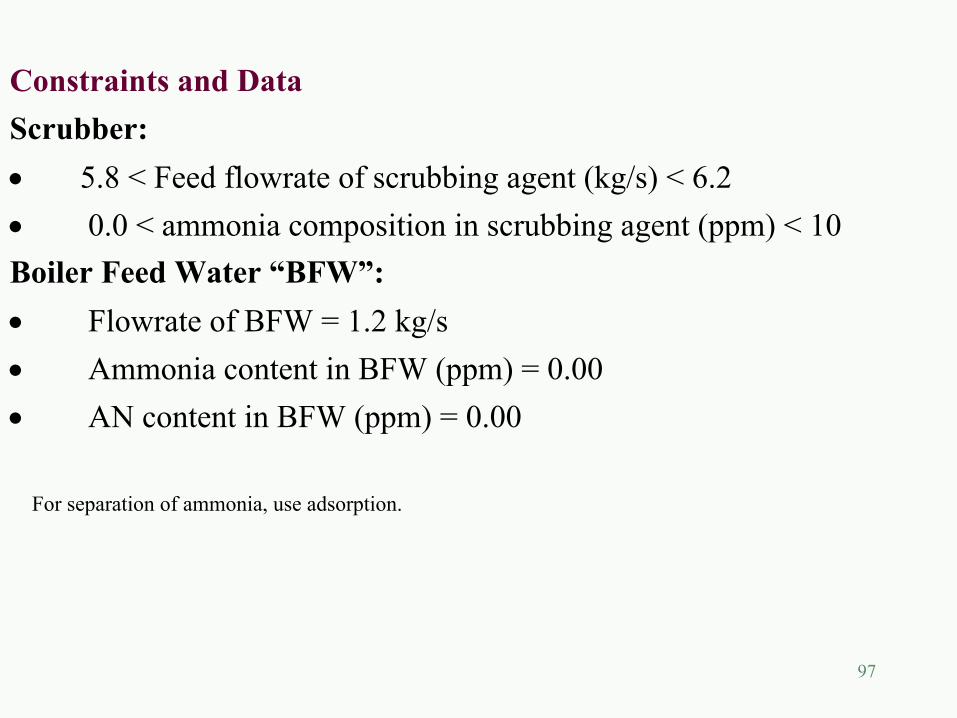
Constraints and DataScrubber:• 5.8 < Feed flowrate of scrubbing agent (kg/s) < 6.2 • 0.0 < ammonia composition in scrubbing agent (ppm) < 10Boiler Feed Water “BFW”:• Flowrate of BFW = 1.2 kg/s• Ammonia content in BFW (ppm) = 0.00• AN content in BFW (ppm) = 0.00
For separation of ammonia, use adsorption.
98
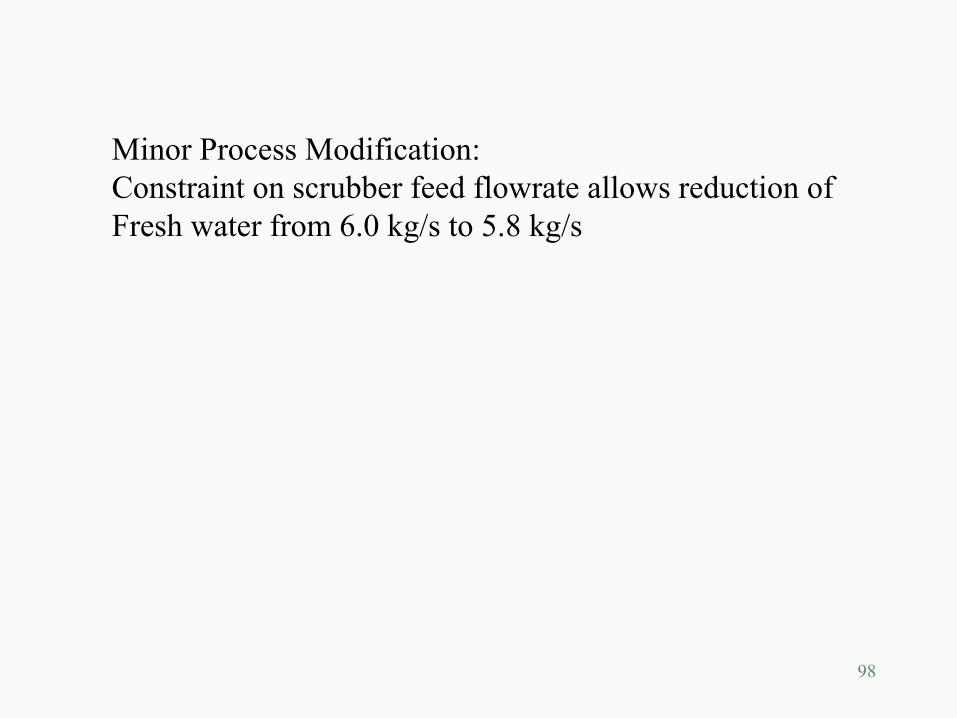
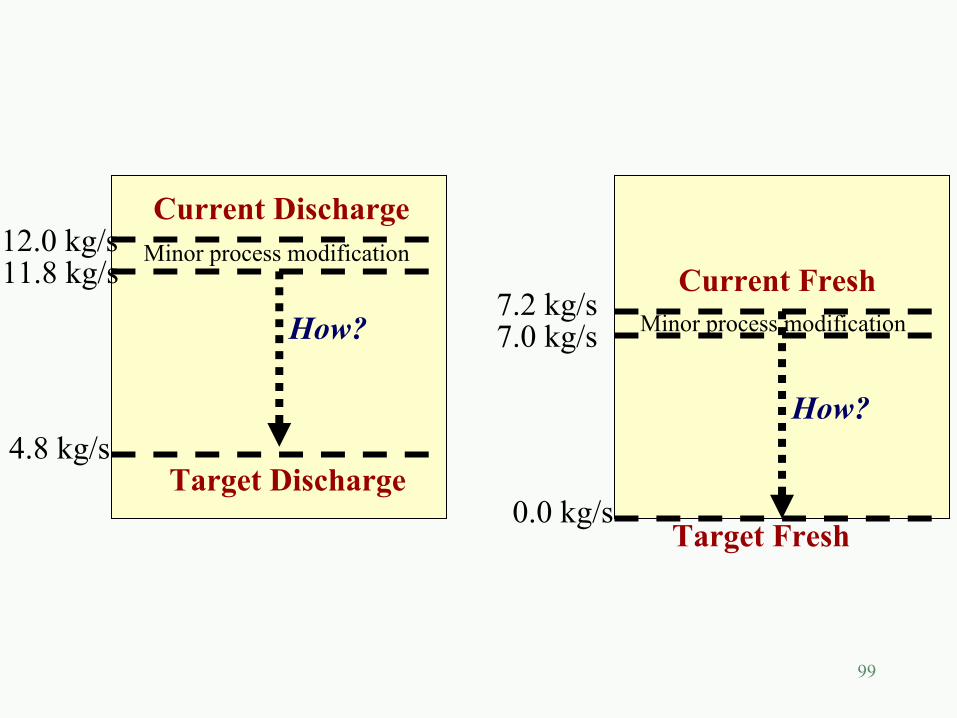
Minor Process Modification:Constraint on scrubber feed flowrate allows reduction ofFresh water from 6.0 kg/s to 5.8 kg/s
99
12.0 kg/s
4.8 kg/s
Current Discharge
Target Discharge
How?7.2 kg/s
0.0 kg/s
Current Fresh
Target Fresh
How?
11.8 kg/s
7.0 kg/s
Minor process modification
Minor process modification
100
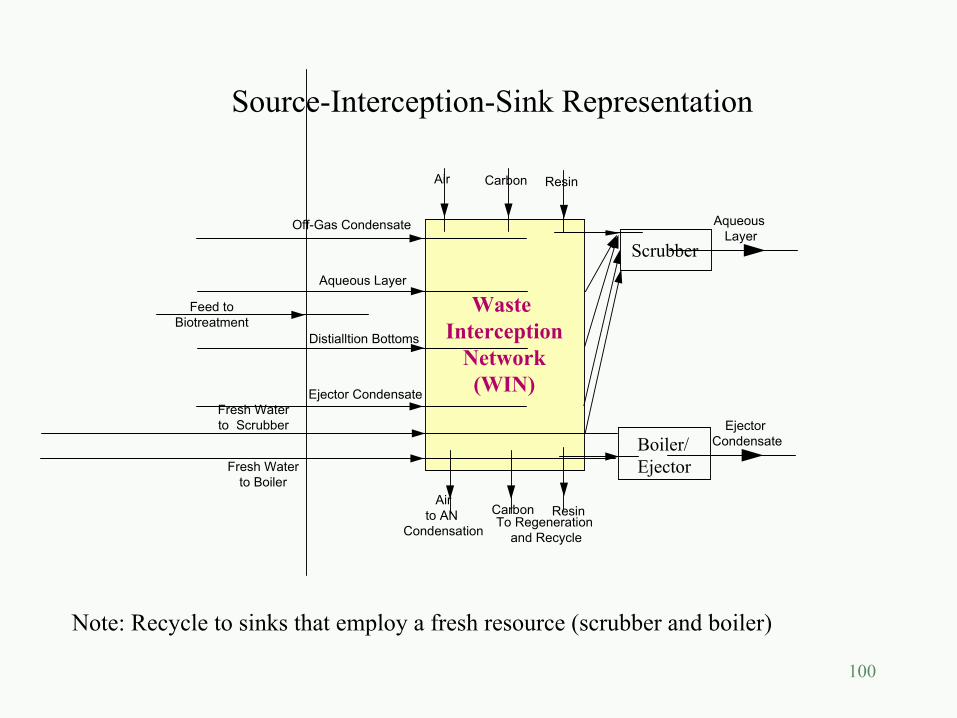
Waste Interception
Network(WIN)
Scrubber
Boiler/Ejector
Air Carbon Resin
Airto AN
CondensationCarbon ResinTo Regeneration
and Recycle
Feed toBiotreatment
Off-Gas Condensate
Aqueous Layer
Distialltion Bottoms
Ejector Condensate
Aqueous Layer
Ejector Condensate
Fresh Waterto Boiler
Fresh Waterto Scrubber
Source-Interception-Sink Representation
Note: Recycle to sinks that employ a fresh resource (scrubber and boiler)
101
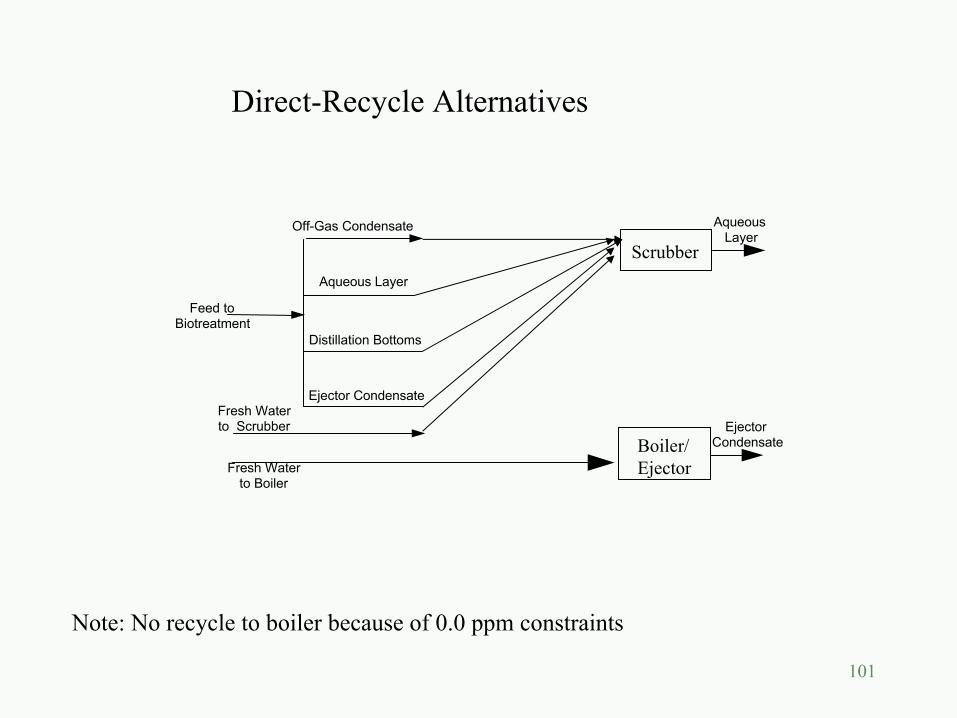
Scrubber
Boiler/Ejector
Feed toBiotreatment
Off-Gas Condensate
Aqueous Layer
Distillation Bottoms
Ejector Condensate
Aqueous Layer
Ejector Condensate
Fresh Waterto Boiler
Fresh Waterto Scrubber
Direct-Recycle Alternatives
Note: No recycle to boiler because of 0.0 ppm constraints
102
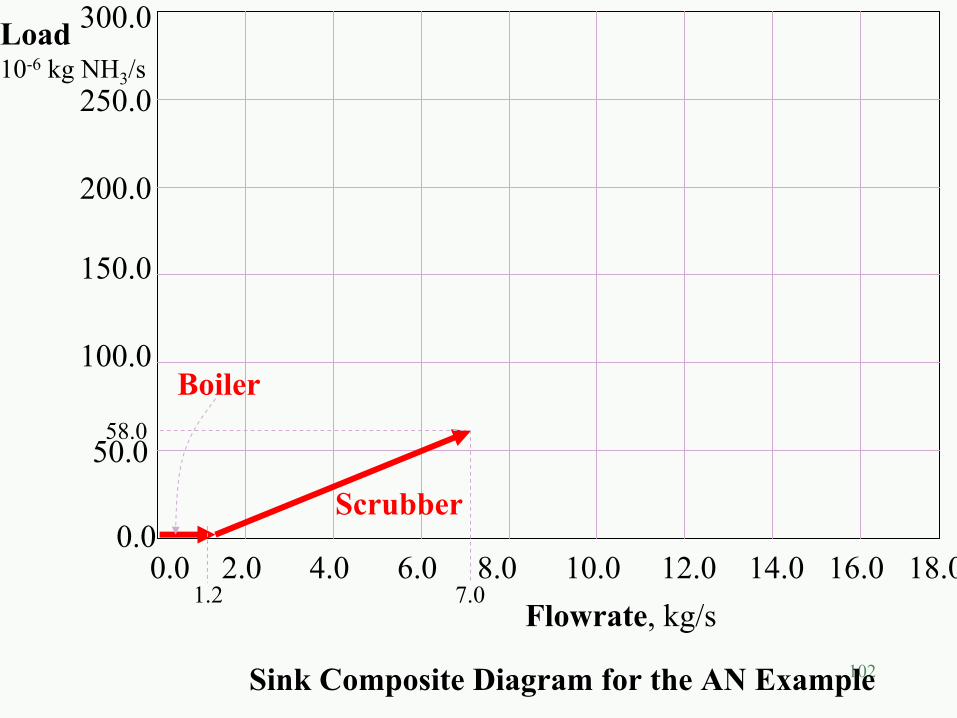
300.0
250.0
200.0
150.0
100.0
50.0
0.00.0 2.0 4.0 6.0 8.0 10.0 12.0 14.0 16.0 18.0
Load10-6 kg NH3/s
Flowrate, kg/s
58.0
7.0
Scrubber
Boiler
Sink Composite Diagram for the AN Example
1.2
103
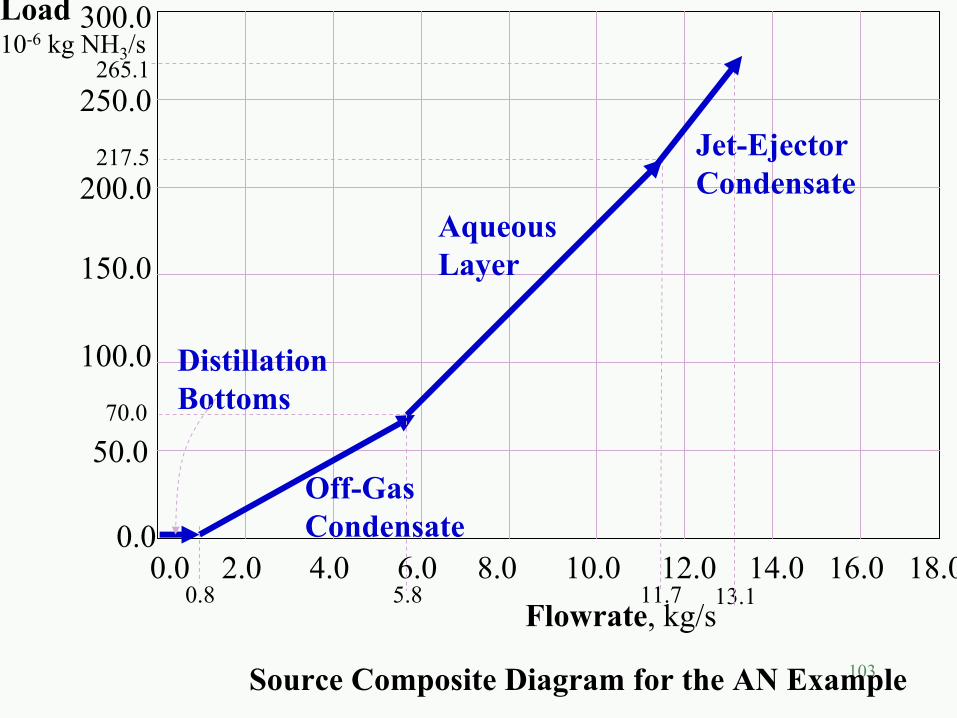
300.0
250.0
200.0
150.0
100.0
50.0
0.00.0 2.0 4.0 6.0 8.0 10.0 12.0 14.0 16.0 18.0
Load10-6 kg NH3/s
Flowrate, kg/s
70.0
5.8
Off-GasCondensate
DistillationBottoms
Source Composite Diagram for the AN Example
0.8 11.7
217.5
AqueousLayer
13.1
265.1
Jet-EjectorCondensate
104
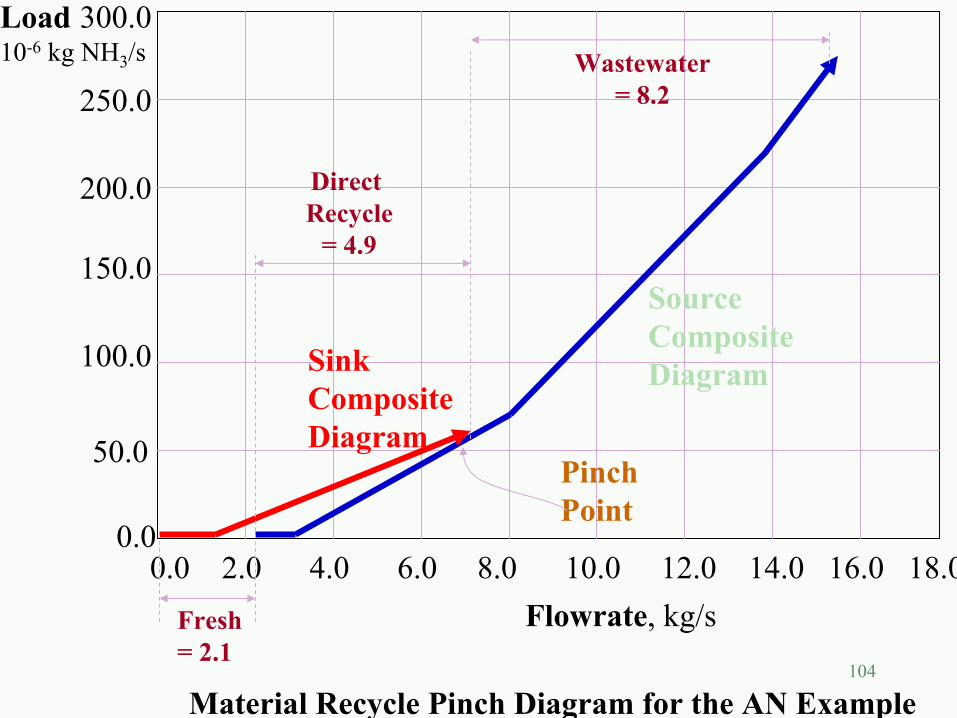
300.0
250.0
200.0
150.0
100.0
50.0
0.00.0 2.0 4.0 6.0 8.0 10.0 12.0 14.0 16.0 18.0
Load10-6 kg NH3/s
Flowrate, kg/s
SourceCompositeDiagram
Material Recycle Pinch Diagram for the AN Example
SinkCompositeDiagram
Fresh= 2.1
Wastewater= 8.2
Direct Recycle
= 4.9
PinchPoint
105
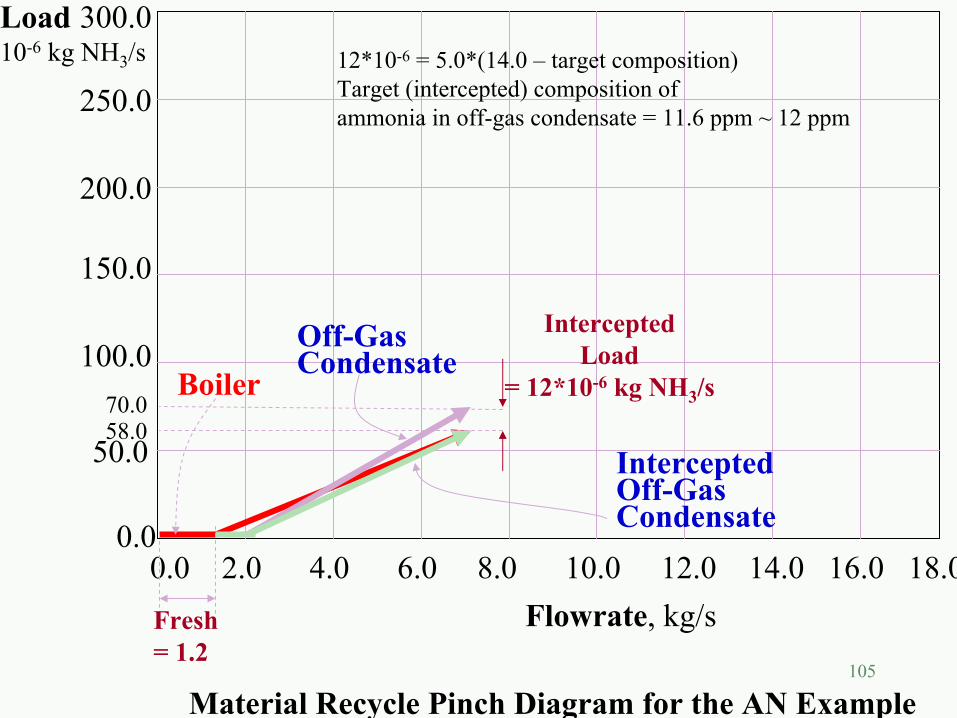
300.0
250.0
200.0
150.0
100.0
50.0
0.00.0 2.0 4.0 6.0 8.0 10.0 12.0 14.0 16.0 18.0
Load10-6 kg NH3/s
Flowrate, kg/s
Material Recycle Pinch Diagram for the AN Example
Fresh= 1.2
InterceptedOff-Gas Condensate
BoilerOff-Gas Condensate
InterceptedLoad
= 12*10-6 kg NH3/s58.070.0
12*10-6 = 5.0*(14.0 – target composition)Target (intercepted) composition of ammonia in off-gas condensate = 11.6 ppm ~ 12 ppm
106
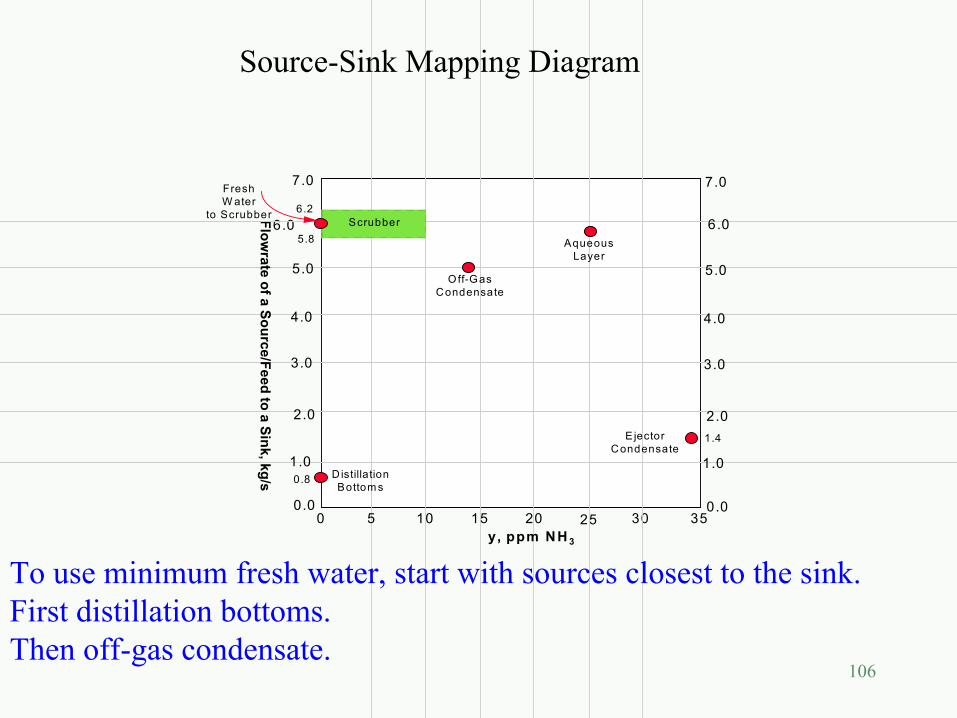
6.0
5 10 15 20 25 30y, ppm NH 3
0.0
2.0
1.0
3.0
4.0
5.0
Flowrate of a Source/Feed to a Sink, kg/s
0
5.8
35
7.0
6.26.0
0.0
2.0
1.0
3.0
4.0
5.0
7.0FreshW ater
to ScrubberScrubber
D istillationBottom s
Off-GasCondensate
AqueousLayer
E jectorCondensate
1.4
0.8
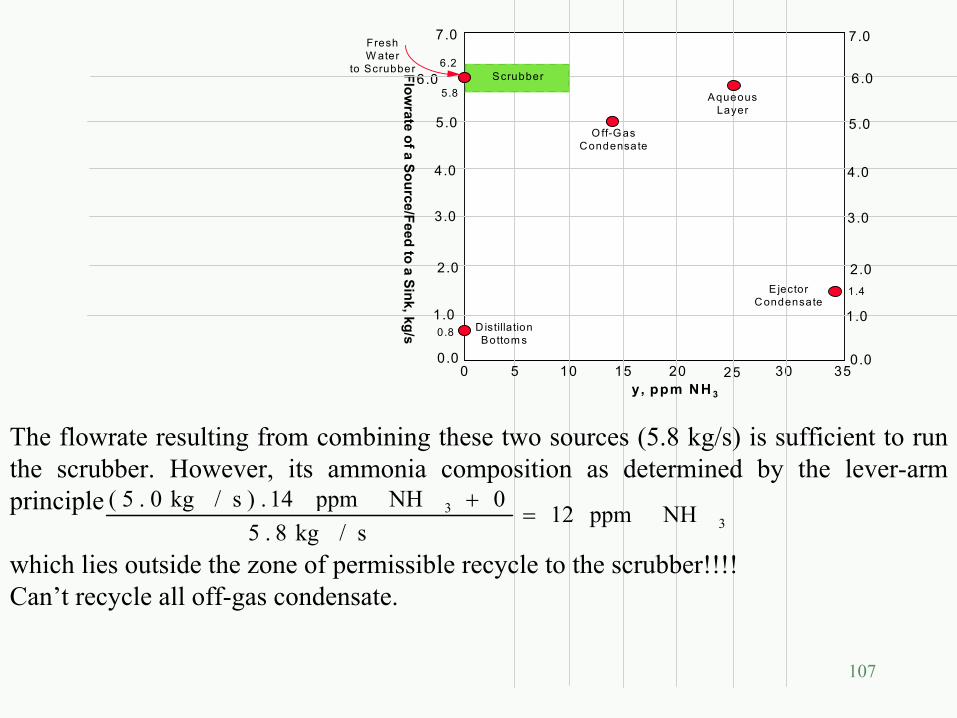
To use minimum fresh water, start with sources closest to the sink.First distillation bottoms.Then off-gas condensate.
Source-Sink Mapping Diagram
107
6.0
5 10 15 20 25 30y, ppm NH 3
0.0
2.0
1.0
3.0
4.0
5.0
Flowrate of a Source/Feed to a Sink, kg/s
0
5.8
35
7.0
6.26.0
0.0
2.0
1.0
3.0
4.0
5.0
7.0FreshW ater
to ScrubberScrubber
D istillationBottom s
O ff-G asCondensate
AqueousLayer
E jectorCondensate
1.4
0.8
The flowrate resulting from combining these two sources (5.8 kg/s) is sufficient to run the scrubber. However, its ammonia composition as determined by the lever-arm principle
which lies outside the zone of permissible recycle to the scrubber!!!! Can’t recycle all off-gas condensate.
( . / ) .. /
5 0 14 05 8
1233
kg s ppm NHkg s
ppm NH+
=
108
6.0
5 10 15 20 25 30y, ppm NH 3
0.0
2.0
1.0
3.0
4.0
5.0
Flowrate of a Source/Feed to a Sink, kg/s
0
5.8
35
7.0
6.26.0
0.0
2.0
1.0
3.0
4.0
5.0
7.0FreshW ater
to ScrubberScrubber
D istillationBottom s
O ff-GasCondensate
AqueousLayer
E jectorCondensate
1.4
0.8
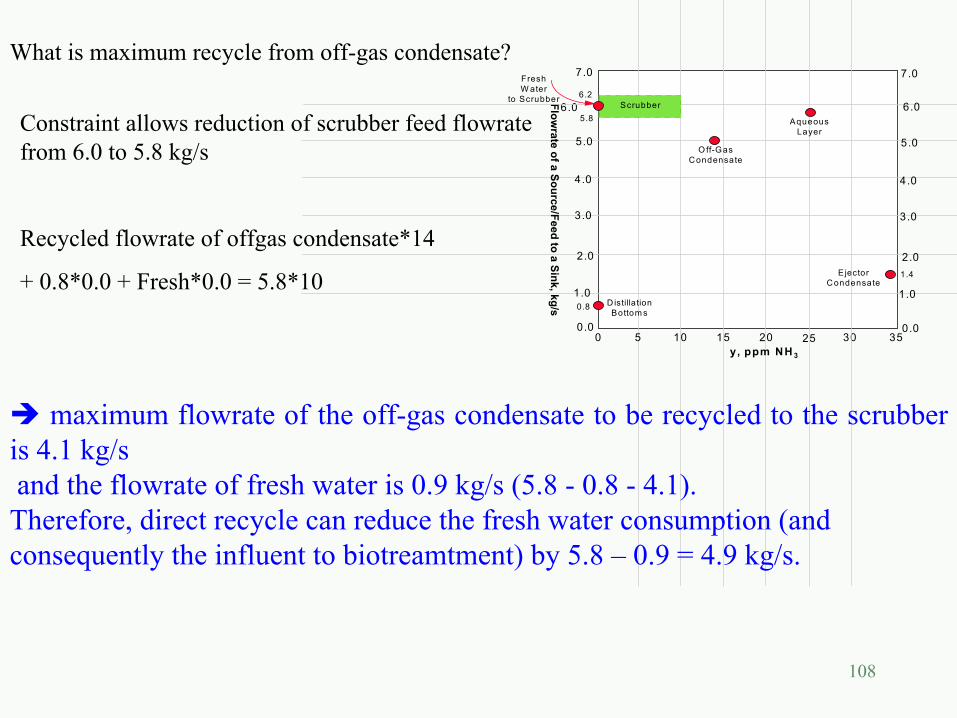
What is maximum recycle from off-gas condensate?
Constraint allows reduction of scrubber feed flowratefrom 6.0 to 5.8 kg/s
Recycled flowrate of offgas condensate*14
+ 0.8*0.0 + Fresh*0.0 = 5.8*10
maximum flowrate of the off-gas condensate to be recycled to the scrubber is 4.1 kg/sand the flowrate of fresh water is 0.9 kg/s (5.8 - 0.8 - 4.1).
Therefore, direct recycle can reduce the fresh water consumption (and consequently the influent to biotreamtment) by 5.8 – 0.9 = 4.9 kg/s.
109
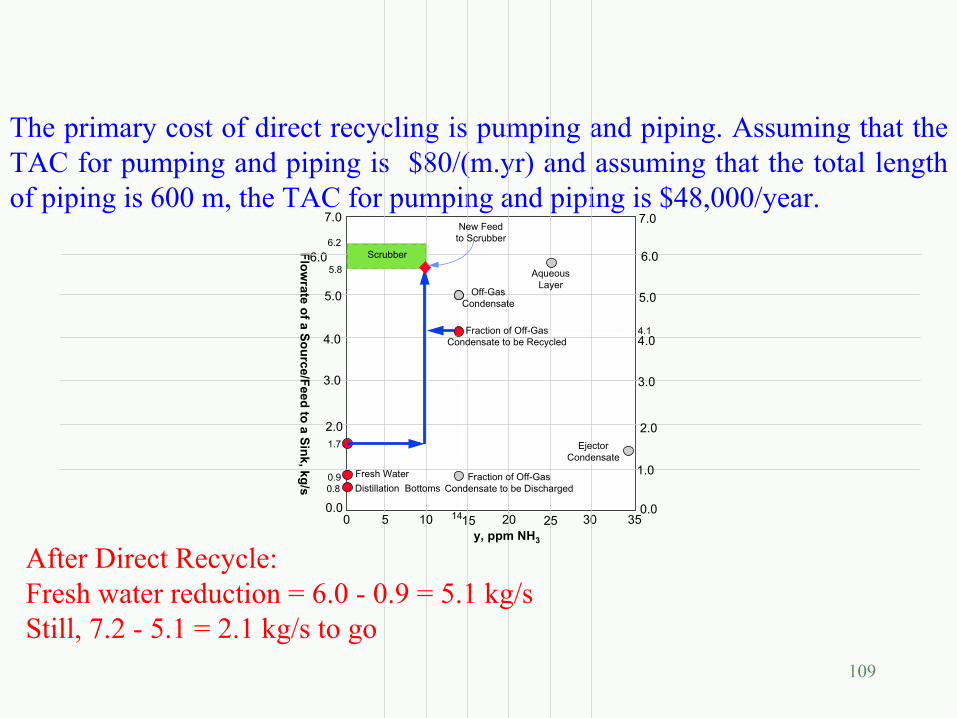
The primary cost of direct recycling is pumping and piping. Assuming that the TAC for pumping and piping is $80/(m.yr) and assuming that the total length of piping is 600 m, the TAC for pumping and piping is $48,000/year.
6.0
5 10 15 20 25 30y, ppm NH3
0.0
2.0
3.0
4.0
5.0
Flowrate of a Source/Feed to a Sink, kg/s
0
5.8
35
7.0
6.26.0
0.0
2.0
1.0
3.0
4.0
5.0
7.0
Fresh Water
Scrubber
Distillation Bottoms
Off-GasCondensate
AqueousLayer
EjectorCondensate
0.80.9
1.7
Fraction of Off-GasCondensate to be Recycled
Fraction of Off-GasCondensate to be Discharged
4.1
14
New Feedto Scrubber
After Direct Recycle:Fresh water reduction = 6.0 - 0.9 = 5.1 kg/sStill, 7.2 - 5.1 = 2.1 kg/s to go
110
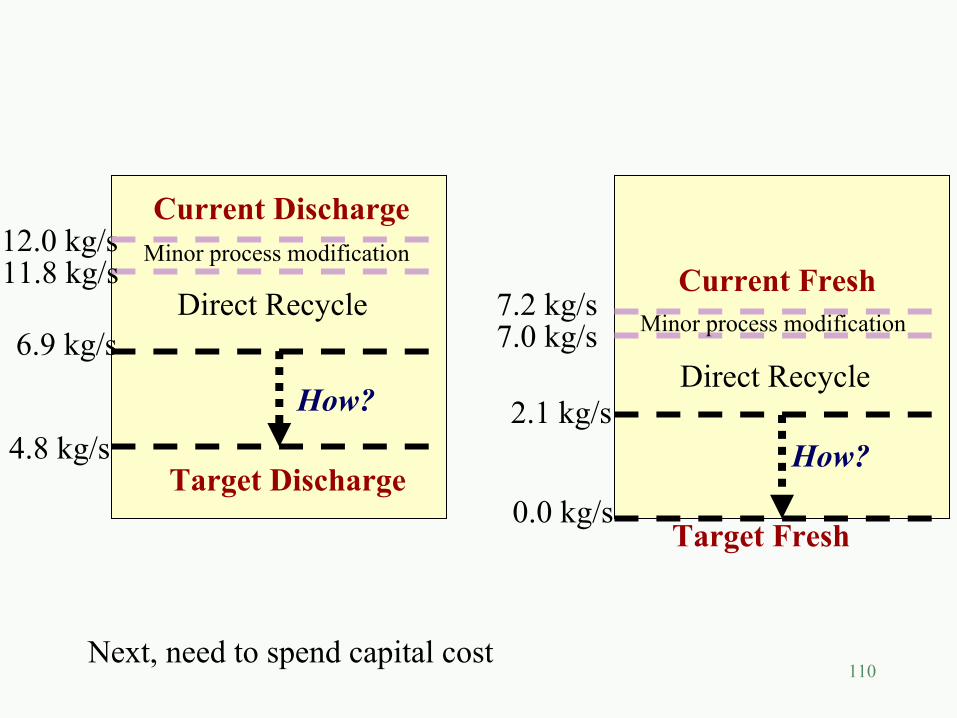
12.0 kg/s
4.8 kg/s
Current Discharge
Target Discharge
How?
7.2 kg/s
0.0 kg/s
Current Fresh
Target Fresh
How?
11.8 kg/s
7.0 kg/s
Minor process modification
Minor process modificationDirect Recycle
Direct Recycle6.9 kg/s
2.1 kg/s
Next, need to spend capital cost
111
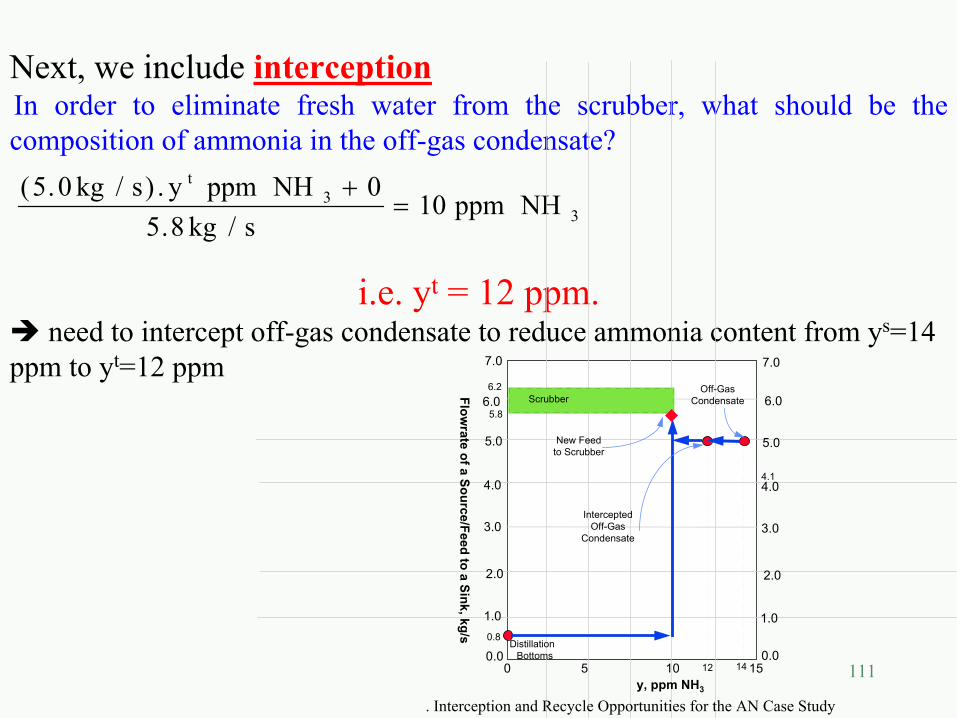
Next, we include interceptionIn order to eliminate fresh water from the scrubber, what should be the composition of ammonia in the off-gas condensate?( . / ) .
. /5 0 0
5 8103
3kg s y ppm NH
kg sppm NH
t +=
i.e. yt = 12 ppm.need to intercept off-gas condensate to reduce ammonia content from ys=14
ppm to yt=12 ppm6.0
5 10 15y, ppm NH3
0.0
2.0
3.0
4.0
5.0
Flowrate of a Source/Feed to a Sink, kg/s
0
5.8
7.0
6.26.0
0.0
2.0
1.0
3.0
4.0
5.0
7.0
Scrubber
Distillation Bottoms
Off-GasCondensate
0.8
4.1
14
New Feedto Scrubber
12
InterceptedOff-Gas
Condensate
1.0
. Interception and Recycle Opportunities for the AN Case Study
112
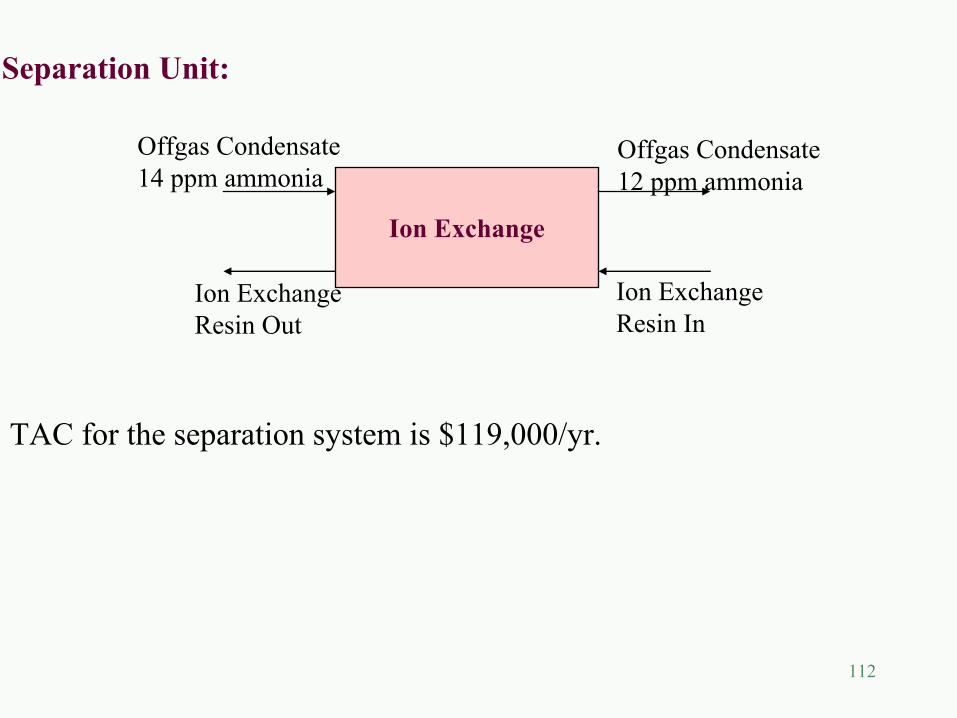
Separation Unit:
TAC for the separation system is $119,000/yr.
Ion Exchange
Offgas Condensate14 ppm ammonia
Offgas Condensate12 ppm ammonia
Ion ExchangeResin In
Ion ExchangeResin Out
113
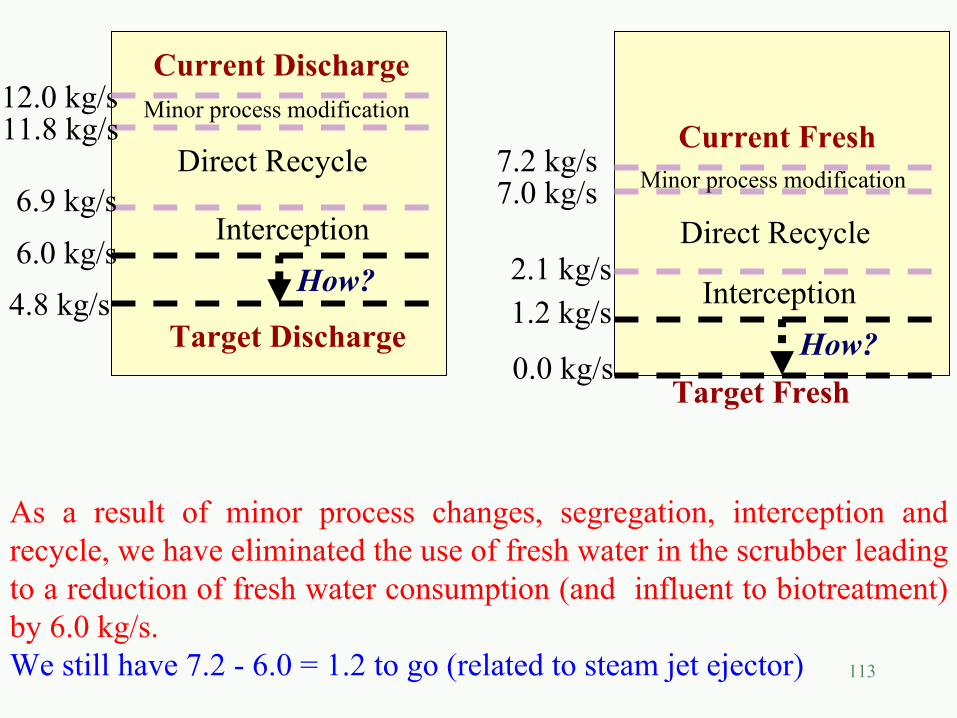
12.0 kg/s
4.8 kg/s
Current Discharge
Target Discharge
How?
7.2 kg/s
0.0 kg/s
Current Fresh
Target FreshHow?
11.8 kg/s
7.0 kg/s
Minor process modification
Minor process modificationDirect Recycle
Direct Recycle6.9 kg/s
2.1 kg/sInterception
Interception6.0 kg/s
1.2 kg/s
As a result of minor process changes, segregation, interception and recycle, we have eliminated the use of fresh water in the scrubber leading to a reduction of fresh water consumption (and influent to biotreatment) by 6.0 kg/s.We still have 7.2 - 6.0 = 1.2 to go (related to steam jet ejector)
114
- Replacement of the steam-jet ejector with a vacuum pump. The operating cost of the ejector and the vacuum pump are comparable. Annualized fixed cost of the pump is $15,000/year.- Operating the column under atmospheric pressure No steam. A simulation study is needed to examine the effect of pressure change. - Relaxing the requirement on BFW quality to few ppm’s of ammonia and AN.
ALTERNATIVES TO STEAM JET EJECTOR
115
O2
Decanter
DistillationColumn
Reactor ScrubberNH3
C3H6
Wastewater to Biotreatment
Off-GasCondensate
Bottoms
AN toSales
14 ppm NH30.4 kg AN/s4.6 kg H2O/s
25 ppm NH30.4 kg AN/s4.8 kg H2O/s
23 ppm NH35.1 kg AN/s5.8 kg H2O/s
21 ppm NH34.7 kg AN/s1.0 kg H2O/s
5.0 kg AN/s5.1 kg H2O/s
+ Gases
25 ppm NH30.4 kg AN/s4.8 kg H2O/s
Tail Gases to Disposal
0 ppm NH30.1 kg AN/s0.7 kg H2O/s
1ppm NH34.6 kg AN/s0.3 kg H2O/s
AdsorptionColumn
Resin
VacuumPump
Tail Gases to Disposal
12 ppm NH30.4 kg AN/s4.6 kg H2O/s
To Regenerationand Recycle
10 ppm NH30.5 kg AN/s5.3 kg H2O/s
AqueousLayer
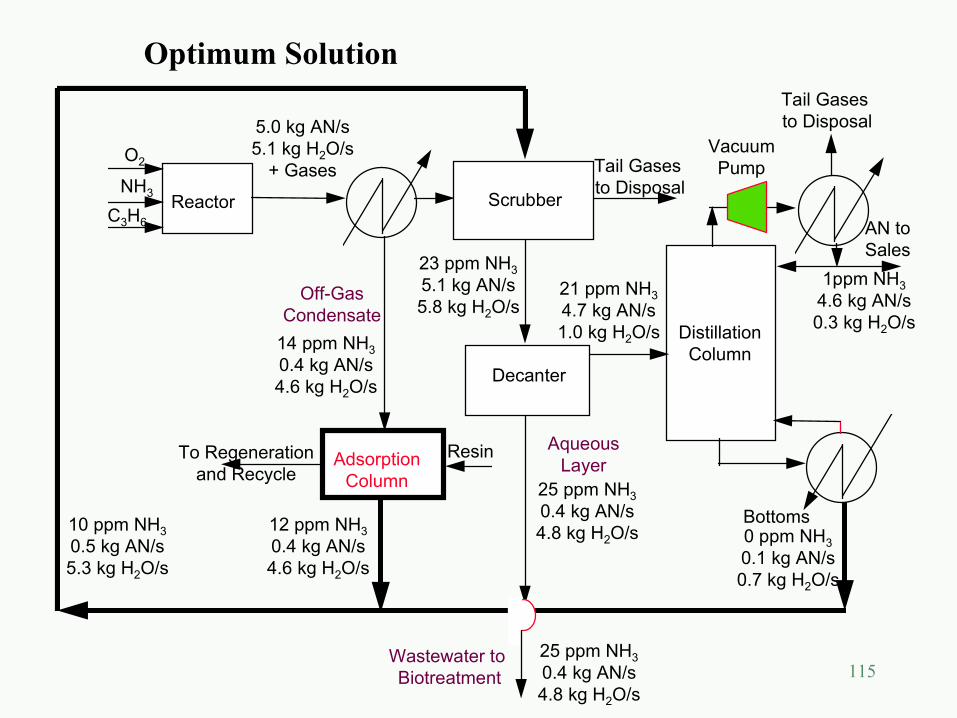
Optimum Solution
116
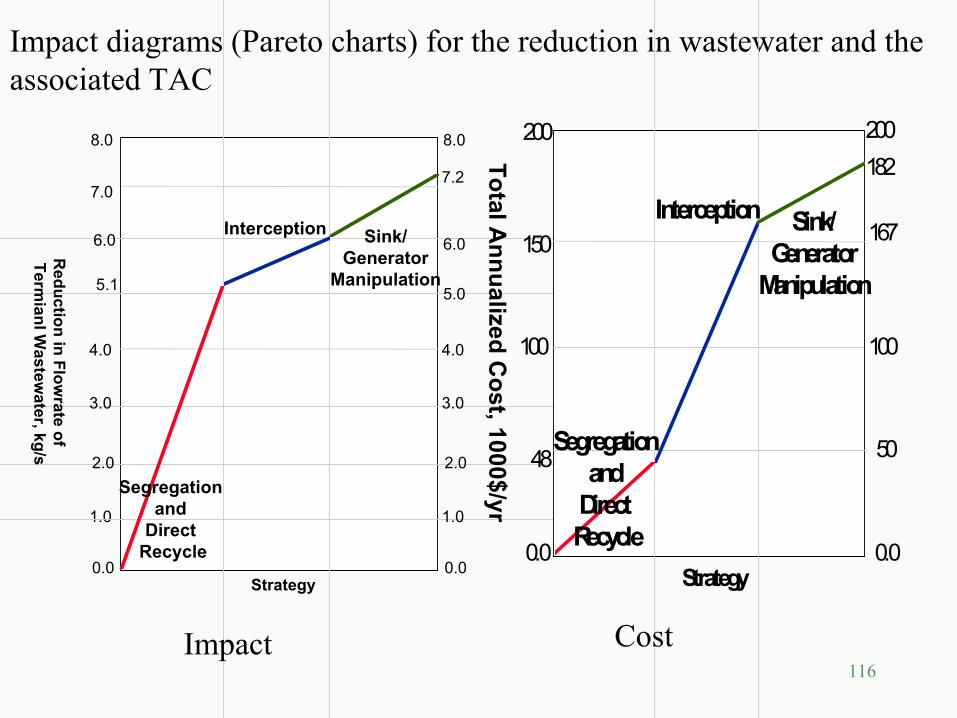
Impact diagrams (Pareto charts) for the reduction in wastewater and the associated TAC
Strategy
Reduction in Flow
rate of Term
ianl Wastew
ater, kg/s
0.0
2.0
3.0
4.0
5.1
7.0
1.0
6.0
8.0
0.0
2.0
3.0
4.0
5.0
7.2
1.0
6.0
8.0
Segregation and
Direct Recycle
Interception Sink/Generator
Manipulation
Strategy
Total Annualized C
ost, 1000$/yrSegregation
and Direct Recycle
Interception Sink/Generator
Manipulation
0.0
150
200
48
100
0.0
167
200
50
100
182
Impact Cost
117
MERITS OF IDENTIFIED SOLUTION
- Acrylonitrile production has increased from 3.9 kg/s to 4.6 kg/s which corresponds to an 18% yield enhancement for the plant. For a selling value of $0.6/kg of AN, the additional production of 0.7 kg AN/s can provide an annual revenue of $13.3 million/yr!- Fresh-water usage and influent to biotreatment facility are decreased by 7.2 kg/s. The value of fresh water and the avoidance of treatment cost are additional benefits.- 40% Debottlenecking: Influent to biotreatment is reduced to 40% of current level. Therefore, the plant production can be expanded 2.5 times the current capacity before the biotreatment facility isdebottlenecked again.Superior solution to the installation of an additional biotreatmentfacility!
118
OBSERVATIONS• Target for debottlenecking the biotreatment facility was
determined ahead of design. • Then, systematic tools were used to generate optimal solutions
that realize the target. • Next, an analysis study is needed to refine the results “ big
picture first, details later”.• Unique and fundamentally different approach than using the
designer’s subjective decisions to alter the process and check the consequences using detailed analysis.
• It is also different from using simple end-of-pipe treatment solutions. Instead, the various species are optimally allocated throughout the process.
• Objectives such as yield enhancement, pollution prevention and cost savings can be simultaneously addressed.
AND YOU CAN (AND SHOULD) TRY IT!
119
- A process is an integrated system and must betreated as such
-Paradigm shift from end-of-pipe treatment to integratedprocess solutions- Targeting for the whole system ahead of detailed design-Systematic mass integration tools for recycle, reuse,separation, and modification- Mass integration: Systematic, insightful, and cost effective
CONCLUSIONS