Embed Size (px)
Citation preview
MISCELLANEOUS TOPICS
Magnitude and Implications of Spontaneous Hemodynamic Variability in Primary Pulmonary Hypertension
STUART RICH, MD, GILBERT E. D’ALONZO, DO, DAVID R. DANTZKER, MD,
and PAUL S. LEVY, ScD
The pulmonary artery (PA) pressure and pulmonary resistance at rest have been noted to vary sponta- neously in patients with primary pulmonary hyper- tension. To evaluate this variation, in 12 patients (8 women, 4 men, aged 43 f 13 years), hourly mea- surements were made for 6 consecutive hours of heart rate, systemic and PA pressures, cardiac output, systemic and pulmonary resistance. After these baseline measurements the patients were tested with hydralazine and nifedipine therapy. Spontaneous variability in pulmonary pressures and resistances occurred in each patient, with the amount of variation (coefficient of variation) in PA pressure averaging 8% and in total pulmonary re- sistance 13 % over the 6 hours. The patients with the most variability in mean PA pressure also had the most variability in cardiac output (r = 0.69, p = 0.02). Variability also correlated with the severity of the disease, as the patients with the highest total
pulmonary resistances also had the most variation for that factor (r = 0.91, p <O.Ol). The amount of variability did not correlate, however, with the acute response to either hydralazine or nifedipine ad- ministration. Based on the average coefficients of variation in these 12 patients, estimates were ob- tained of the percent change needed for an observed change to be attributed to a drug effect with 95% confidence. From these estimates, it was projected that for a single patient, a mean change in pulmo- nary resistance of 36% or a mean change in PA pressure of 22% would be required in order to at- tribute the changes to a drug effect. Thus, sponta- neous hemodynamic variability is a common phe- nomenon in patients with primary pulmonary hypertension and may account for substantial changes in PA pressure and pulmonary resistance at rest.
(Am J Cardiol 1985;55:159-163)
Vasodilator drugs have been reported to lower the pulmonary artery (PA) pressure and pulmonary vas- cular resistance in patients with primary pulmonary hypertension (PPH).1-5 However, PA pressure and pulmonary resistance may change spontaneously, without any drug intervention.6 The implications of this spontaneous variability are not clear, nor is it known if it is a common or unusual phenomenon. We monitored the pulmonary and systemic central hemodynamics of 12 patients with PPH every hour for 6 consecutive hours to determine their magnitude of variation. We then administered vasodilator drugs to these patients and
From the Department of Medicine, University of Illinois College of Medicine, Department of Medicine, University of Michigan Medical School, and the Epidemiology and Biometry Program, University of If- tinOiS School Of Public Health, Chicago, Illinois. Manuscript received June 21, 1984; revised manuscript received August 16, 1984, accepted August 20, 1984.
Address for reprints: Stuart Rich, MD, Section of Cardiology, Unl- versity of Illinois Hospital, P.O. Box 6998, Chicago, Illinois 60680.
noted if there was any relation between the magnitude of hemodynamic variability and drug responsiveness.
Methods Subjects: The study includes 12 consecutive patients (8
women, 4 men) referred to the University of Illinois and University of Michigan Hospitals over a l-year period for evaluation of PPH. They were aged 23 to 60 years old (mean 43 f 13). Each underwent an extensive work-up to determine the cause of the pulmonary hypertension, but no cause was found.7 Each patient was admitted to have hemodynamic testing for evaluation of vasodilator therapy while receiving no vasodilator drugs with the exception of digoxin and diuretic therapy.
Hemodynamic monitoring: A Swan-Ganz catheter was directed into the PA, and a small radial artery cannula was placed for hemodynamic monitoring. Each patient was monitored for at least 6 consecutive hours in an intensive care unit, and values were recorded every hour. Heart rate, systolic, diastolic and mean systemic and PA pressures, pulmonary wedge pressure, and right atria1 pressure were recorded. Cardiac output was determined by the thermodilution tech-
159
160 SPONTANEOUS VARIABILITY IN PULMONARY HYPERTENSION
TABLE I Hemodynamic Characteristics of the Patients Studied
TSR TPR Pt (beazmin) (msm”Flg) (mpmApHg) (Iitezmin) (units) (units) (mlsbveat)
1: ::
Mean f SD
a7 108
:I
i8 113
94f 10
;t zz 2.74 4.31 :: 24 13 102 xi 2.63 E 22
XI 57 3.75 2.65 17 20 15
a7 50 3.75 iA 78 4.21 1.27
2 ;1 23 ia
:: ii:: 4.18 2.08 21 i: 83 :: 4.08 z 12
86 :“I 1 649:614 3.344:?03 30:814 232:14
:ii 25 31 42 43
All patient data represent the mean of the 6 consecutive hourly determinations. CO = cardiac output; HR = heart rate; PAP = mean pulmonary artery pressure; SAP = mean systemic
arterial pressure; SV = stroke volume; TPR = total pulmonary resistance; TSR = total systemic resis-
nique. Systemic and pulmonary resistances were calculated in Wood units from standard formulas.
In each case the serial hemodynamic measurements were made with the patient supine and at rest. Although not the same person made these measurements in all patients, the same person made all of the measurements for any given pa- tient over the B-hour monitoring period. All measurements were made during the daytime and evening hours. The re- producibility and reliability of the thermodilution technique were assessed at both institutions, with simultaneous ther- modilution and Fick cardiac output determinations made on a different group of subjects. The correlation between these techniques was highly significant (r = 0.81, p <O.OOl at the University of Illinois; r = 0.96, p <O.OOl at the University of Michigan).
Drug testing: After the 6-hour baseline period was estab- lished, 8 patients were administered hydralaxine and 10 were given nifedipine. Hydralazine was administered as a 0.3~mglkg slow intravenous infusion or a SO-mg oral dose, with mea- surements made after 30 minutes and 2 hours, respectively. Nifedipine was administered as either a lo- or 20-mg oral dose, and the measurements made after 90 to 120 minutes. A new control state was established before each drug test.
Data management and statistical methods: For each patient the mean level of each of the 7 hemodynamic variables over the 6 time intervals was computed along with the stan-
A
Patient #8
I 2 3 4 5 6 123456
HOUR YOUR
z-50 a- ^ 1
dard deviation and coefficient of variation. These summary statistics were used to characterize the average levels and variability of the hemodynamic values for each person. Mean levels of each of these individual means, standard deviations, and coefficients of variation were computed over the 12 subjects in the study.
The Pearson product-moment correlation coefficient was used to evaluate the following associations; the variability in PA pressure with cardiac output, the mean level of each he- modynamic variable with the standard deviation, the change in PA pressure and total pulmonary resistance after drug administration with the previously determined coefficient of variation for those variables, the hourly changes in cardiac output with the mean PA pressure and with the total pul- monary resistance. The significance of the effect of drug ad- ministration on the PA pressure and the total pulmonary re- sistance was evaluated by the t test for paired data.
Under the assumption that within each subject repeated determinations of the hemodynamic variables follow a normal distribution, the probability that 2 determinations in the same individual differ by more than a certain percent can be ex- pressed as a function of the specific percent and the coefficient of variation of the distribution of repeat determinations. For a given coefficient of variation and percent, this probability can be obtained numerically by use of the standard normal distribution. Based on the above rationale, we evaluated this
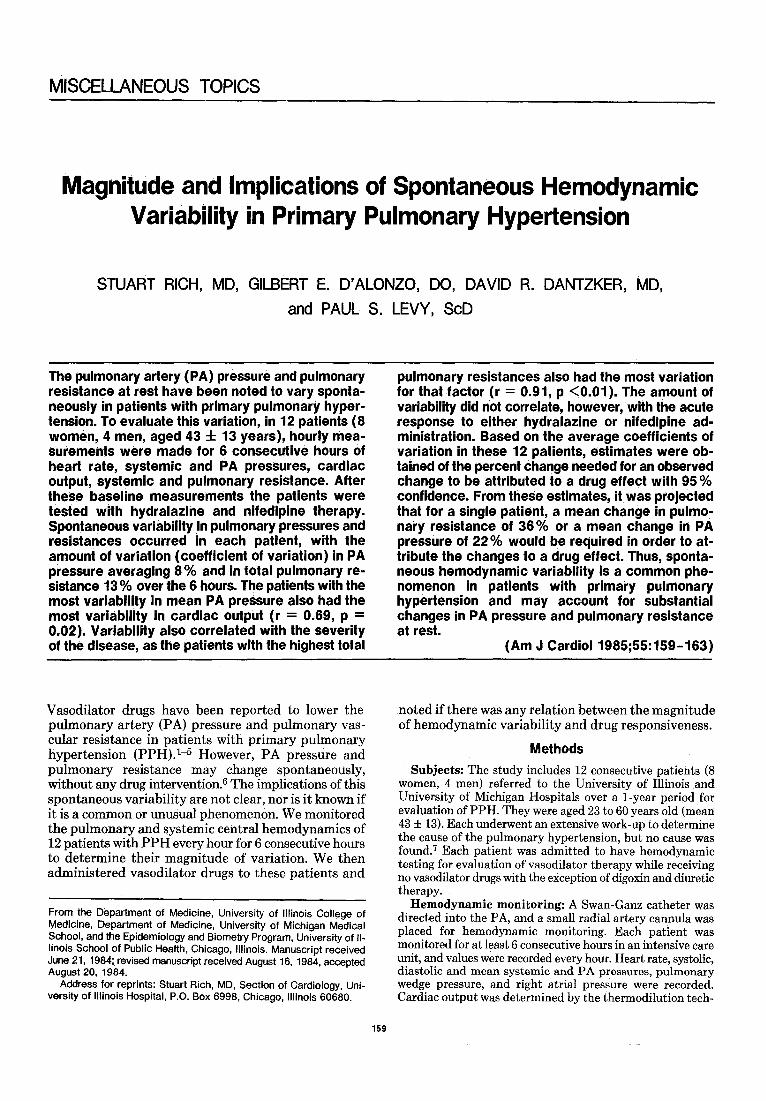
Patient # 6 FIGURE 1. The hoyr-to-hour changes in pulmonary artery (PA) pressure and total pulmonary resistance in patient 8 (A) and in PA pressure and cardiac output in patient 6 (B). In patient 8, PA pressure increased with essentially no change in pulmonary resistance for the first 4 hours, at which time PA pressure decreased and pulmonary resistance increased dramatically. In the last hour both PA pressure and pulmonary re- sistance increased together. Patient 6 showed marked variation in PA pres- sure from hour to hour, without parallel changes in cardiac output. The cardiac output increased substantially betlween hours 2 and 3 while the PA pressure remained essentially unchanged.
January 1, 1985 THE AMERICAN JOURNAL OF CARDIOLOGY Volume 55 161
probability using the average coefficient of variation over the 12 subjects as a global estimate of the coefficient of variation.
(Note: In some patients the pulmonary capillary wedge pressure could not always be obtained in consecutive hours. Consequently, total systemic resistance and total pulmonary resistance are being used for statistical analysis in this study. In the cases where left and right ventricular filling pressures were available, we could not find a difference between the amount of variability noted in total systemic resistance and systemic vascular resistance, or total pulmonary resistance and pulmonary vascular resistance.)
Results
Hemodynamic characteristics (Table I): The subjects in the study had advanced PPH as evidenced by the elevated mean PA pressures (64 f 14 mm Hg) and mean total pulmonary resistance (23 f 14 units), and reduced cardiac outputs (3.3 f 1.0 liters/min). The lowest mean PA pressure of any patient in the study was 48 mm Hg, and the lowest total pulmonary resistance was 13 Wood units.
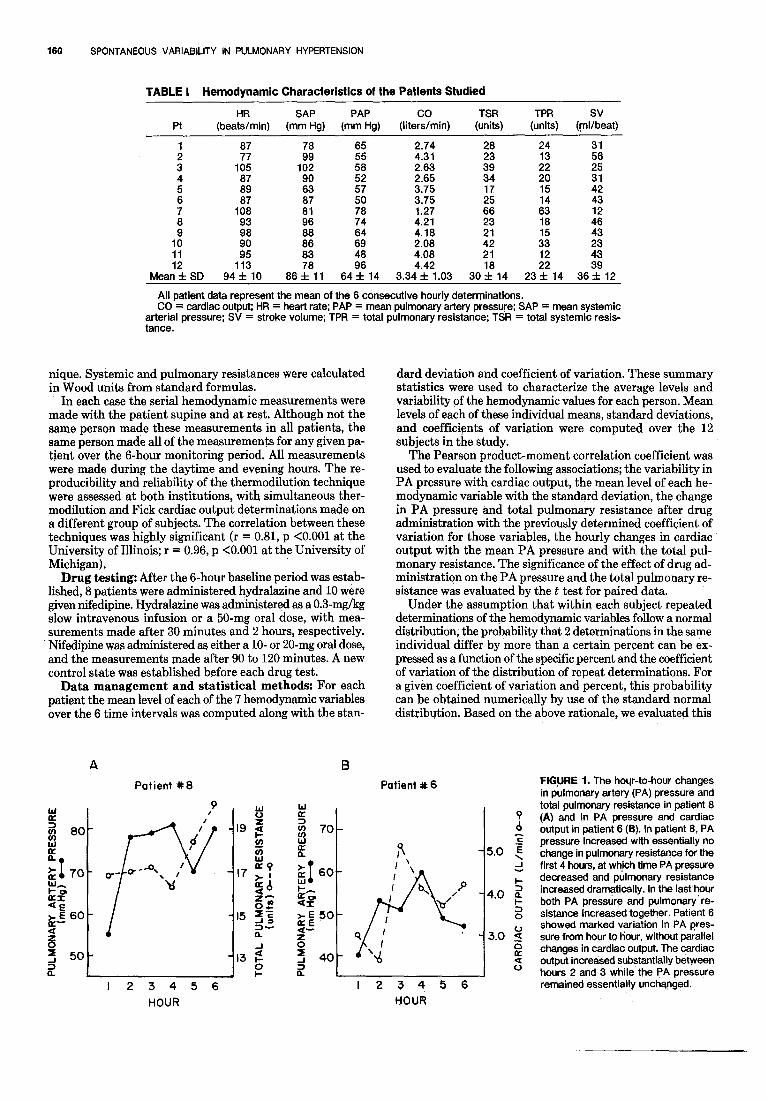
Magnitude of spontaneous variability: Hour-to- hour changes in the hemodynamic values were recorded. The mean levels with the corresponding mean coeffi- cients of variation over the 12 subjects are shown in Table II. In most cases there were unpredictable swings from hour to hour, rather than gradual changes over the 6-hour period. For example, patient 8 had a mean PA pressure rise from 55 to 78 mm Hg, a 42% increase in 1 hour, and patient 6 had a change in cardiac output from 2.4 to 5.1 L/min, a 111% increase in 1 hour, without apparent cause (Fig. 1). Although the changes in pres- sures seen were not necessarily directly proportional to, or inversely related to the changes in flow in each case, those patients with the greatest variability in their PA pressures also had the most variability in their cardiac outputs (r = 0.685, p = 0.02) (Fig. 2).
The distribution of the variability in the patients studied was examined to see if it was random. Values of
28-
2 n =
-
&-
24- 5:
F= up 20- -I-
sa 16-
$4 p 25 12-
12 0.69 . 0.02
. .
. . . l .
. l *
.
COEFFICIENT OF VARIATION (%I FOR PULMONARY ARTERY PRESSURE
FIGURE 2. Relation between the amount of variability (coefficient of variation) in cardiac output and pulmonary artery pressure. The patients with the greatest amount of variability in pulmonary artery pressure also manifest the greatest amount of variability in cardiac output as deter- mined by hourly measurements.
TABLE II Hemodynamic Variability Observed over 6 Consecutive Hours and 95 % Confidence Limits for Drug Effect in 1 Patient
Mean Level
(n = 12) Mean CV (n = 12)
% Change for
95% CL
Heart rate (beats/min)
Systemic arterial pressure (mm Hg)
Pulmonary artery pressure (mm Hg)
Cardiac output (liters/min)
Total svstemic
94f 10 6.7 f 2.4 17
66f 11 6.6 f 3.1 17
64% 14 6.4 f 3.6 22
3.3 f 1.0 10.7 f 5.7 29
30 f 14 13.9 f 7.6 39 resiitance (units)
Total pulmonary resistance (units)
Stroke volume (ml/beat)
23 f 14 12.9 f 6.9 36
366 12 12.6 f 6.4 35
CL = confidence limits; CV = coefficient of variation.
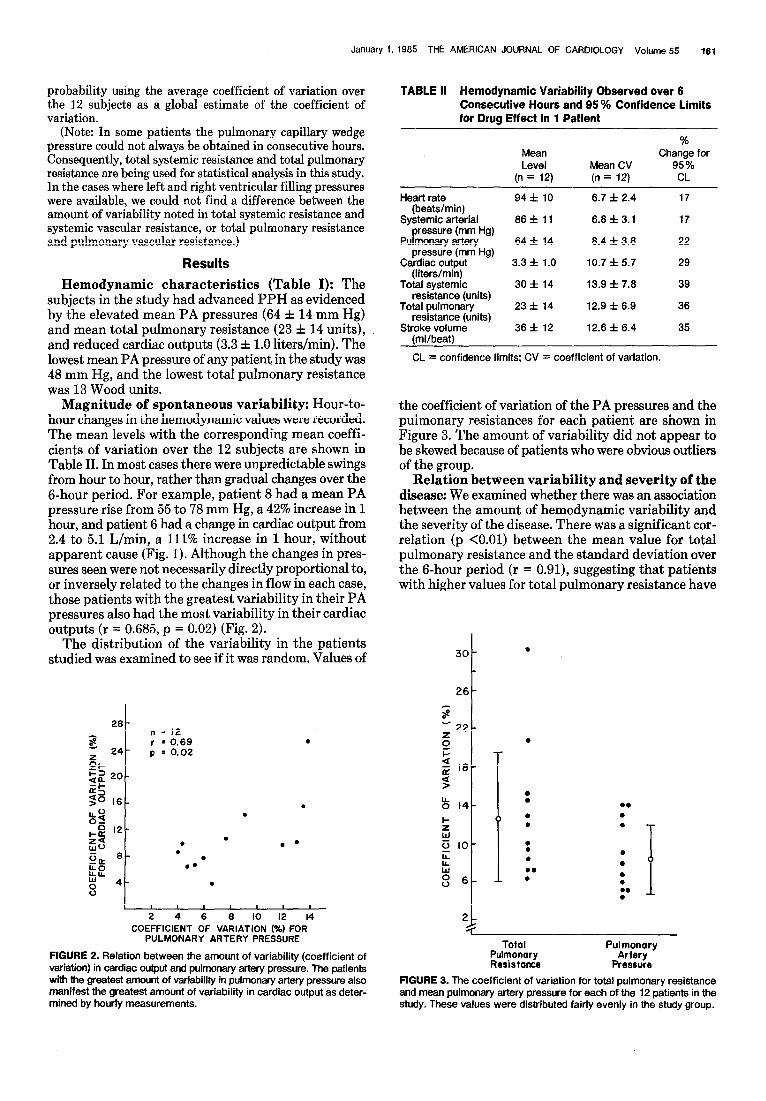
the coefficient of variation of the PA pressures and the pulmonary resistances for each patient are shown in Figure 3. The amount. of variability did not appear to be skewed because of patients who were obvious outliers of the group.
Relation between variability and severity of the disease: We examined whether there was an association between the amount of hemodynamic variability and the severity of the disease. There was a significant cor- relation (p <O.Ol) between the mean value for total pulmonary resistance and the standard deviation over the g-hour period (r = 0.91), suggesting that patients with higher values for total pulmonary resistance have
30 -
26-
7 a -22- :
2-
.
.
b .
l .
. .
.
. .
.
. .
.
.
.
.
.
.
. . . i
Total Pulmonary Resistance
Pulmonary Artery
Pressure
FIGURE 3. The coefficient of variation for total pulmonary resistance and mean pulmonary artery pressure for each of the 12 patients in the study. These values were distributed fairly evenly in the study group.
162 SPONTANEOUS VARIABILITY IN PULMONARY HYPERTENSION
TABLE III Relation Between the Hourly Measurements in Pulmonary Artery Pressure and Pulmonary Resistance with the Corresponding Cardiac Outout
Correlation Coefficient (r)
PI PAP vs CO TPR vs CO
t 0.33 0.45 -0.44 -0.85”
: -0.63 0.36 -0.94’ -0.63 5 0.84 -0.92* 6 0.23 -0.83”
i 0.76 0.84” -0.93” -0.38 9 0.27 -0.38
:: -0.56 -0.70 -0.91’ -0.92” 12 0.02 -0.76
l p <0.05. CO, = cardiac outout; PAP = mean pulmonary artery pressure; TPR
= total pulmonary resistance.
the most spontaneous hemodynamic variability. This was true for the total systemic resistance (r = 0.78) as well, but not for any of the other measured variables.
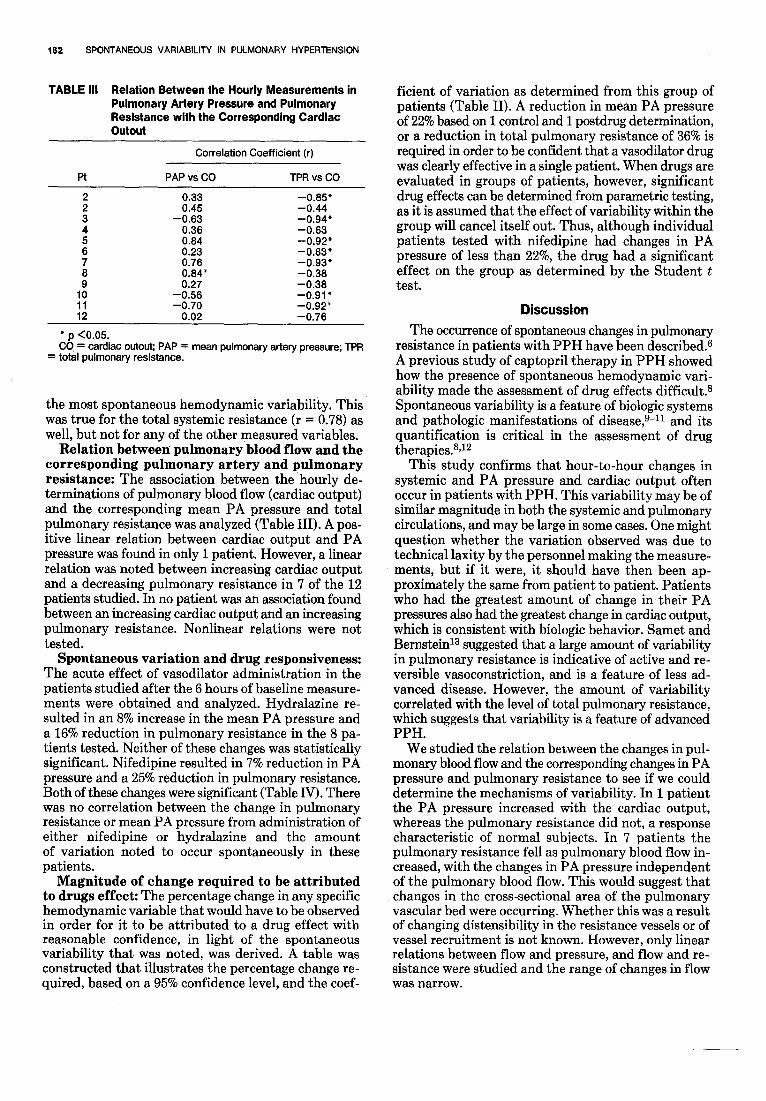
Relation between: pulmonary blood flow and the corresponding pulmonary artery and pulmonary resistance: The association between the hourly de- terminations of pulmonary blood flow (cardiac output) and the corresponding mean PA pressure and total pulmonary resistance was analyzed (Table III). A pos- itive linear relation between cardiac output and PA pressure was found in only 1 patient. However, a linear relation was noted between increasing cardiac output and a decreasing pulmonary resistance in 7 of the 12 patients studied. In no patient was an association found between an increasing cardiac output and an increasing pulmonary resistance. Nonlinear relations were not tested.
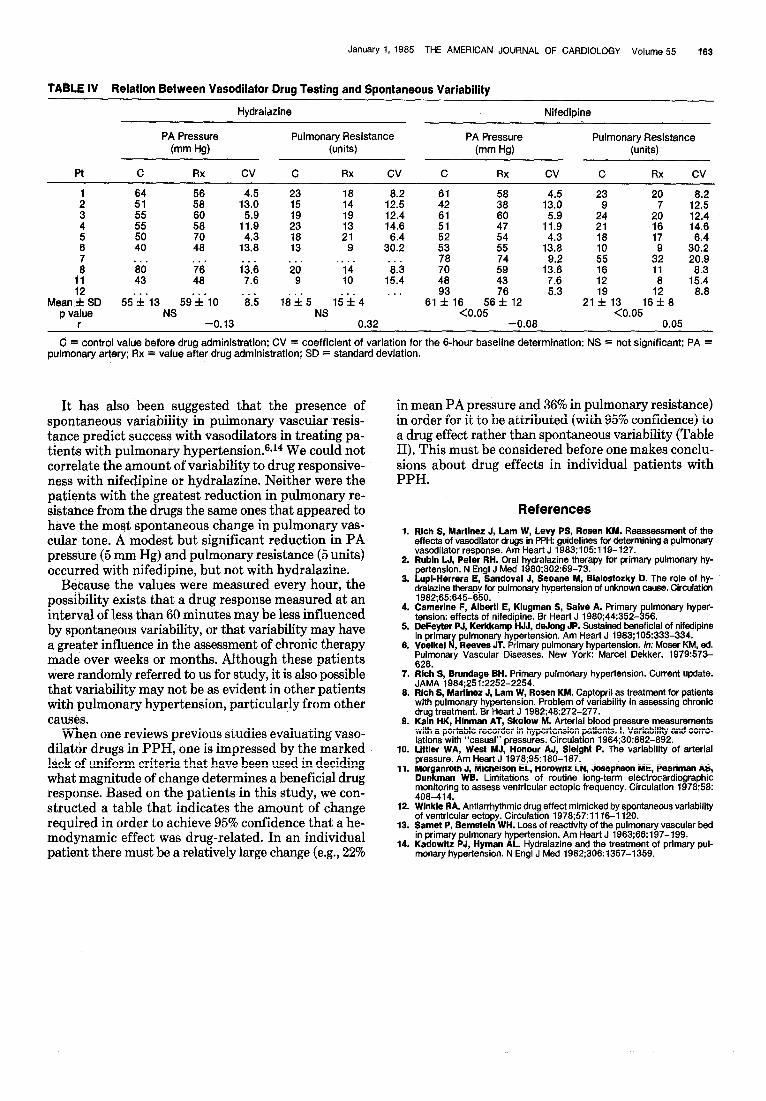
Spontaneous variation and drug responsiveness: The acute effect of vasodilator administration in the patients studied after the 6 hours of baseline measure- ments were obtained and analyzed. Hydralazine re- sulted in an 8% increase in the mean PA pressure and a 16% reduction in pulmonary resistance in the 8 pa- tients tested. Neither of these changes was statistically significant. Nifedipine resulted in 7% reduction in PA pressure and a 25% reduction in pulmonary resistance. Both of these changes were significant (Table IV). There was no correlation between the change in pulmonary resistance or mean PA pressure from administration of either nifedipine or hydralazine and the amount of variation noted to occur spontaneously in these patients.
Magnitude of change required to be attributed to drugs effect: The percentage change in any specific hemodynamic variable that would have to be observed in order for it to be attributed to a drug effect with reasonable confidence, in light of the spontaneous variability that was noted, was derived. A table was constructed that illustrates the percentage change re- quired, based on a 95% confidence level, and the coef-
ficient of variation as determined from this group of patients (Table II). A reduction in mean PA pressure of 22% based on 1 control and 1 postdrug determination, or a reduction in total pulmonary resistance of 36% is required in order to be confident that a vasodilator drug was clearly effective in a single patient. When drugs are evaluated in groups of patients, however, significant drug effects can be determined from parametric testing, as it is assumed that the effect of variability within the group will cancel itself out. Thus, although individual patients tested with nifedipine had changes in PA pressure of less than 22%, the drug had a significant effect on the group as determined by the Student t test.
Discussion The occurrence of spontaneous changes in pulmonary
resistance in patients with PPH have been described.6 A previous study of captopril therapy in PPH showed how the presence of spontaneous hemodynamic vari- ability made the assessment of drug effects difficult.8 Spontaneous variability is a feature of biologic systems and pathologic manifestations of disease,e-11 and its quantification is critical in the assessment of drug therapies.8J2
This study confirms that hour-to-hour changes in systemic and PA pressure and cardiac output often occur in patients with PPH. This variability may be of similar magnitude in both the systemic and pulmonary circulations, and may be large in some cases. One might question whether the variation observed was due to technical laxity by the personnel making the measure- ments, but if it were, it should have then been ap- proximately the same from patient to patient. Patients who had the greatest amount of change in their PA pressures also had the greatest change in cardiac output, which is consistent with biologic behavior. Samet and Bernstein13 suggested that a large amount of variability in pulmonary resistance is indicative of active and re- versible vasoconstriction, and is a feature of less ad- vanced disease. However, the amount of variability correlated with the level of total pulmonary resistance, which suggests that variability is a feature of advanced PPH.
We studied the relation between the changes in pul- monary blood flow and the corresponding changes in PA pressure and pulmonary resistance to see if we could determine the mechanisms of variability. In 1 patient the-PA pressure increased with the cardiac output, whereas the pulmonary resistance did not, a response characteristic of normal subjects. In 7 patients the pulmonary resistance fell as pulmonary blood flow in- creased, with the changes in PA pressure independent of the pulmonary blood flow. This would suggest that changes in the cross-sectional area of the pulmonary vascular bed were occurring. Whether this was a result of changing distensibility in the resistance vessels or of vessel recruitment is not known. However, only linear relations between flow and pressure, and flow and re- sistance were studied and the range of changes in flow was narrow.
January 1, 1985 THE AMERICAN JOURNAL OF CARDIOLOGY Volume 55 163
TABLE IV Relation Between Vasodilator Drug Testing and Spontaneous Variability
Hydraidzine Nifedipine
PA Pressure Pulmonary Resistance PA Pressure Pulmonary Resistance (mm Hg) (units) (mm W (units)
Pt C RX cv C RX cv C RX cv C Rx cv
1 2 3 4
z
B 11 ii
Mean f SD p value
r
i: ;8” 13.0 4.5
z5” 56: 11.9 5.9
ii ii 13.8 4.3
. . .
t: i’i i3.6 48 7.8
55’%‘13 59’&‘10 ‘8.5 NS
-0.13
23 15 :: 1Z 14.6 12:4
:; 3”: 134.: :: 19 13 k?; :P 11.9 5:9
:x 21 9 30.2 6.4 i: 25 13.8 4.3
ii ‘14 ‘8.3 78 70 59” 1%
-9 10 15.4 48 43 7.6
lirfr5 l$f4 ‘.. S%S 56C2 5.3
NS <0.05 0.32 -0.08
23 20 9
2: 16
128-E
2 12:4 14.6
:: 17 3z.z 55 3; 2019 :2” 11 8 15.4 8.3
21:913 16’: 8 8.8
<0.05 0.05
C = control value before drug administration; CV = coefficient of variation for the 6-hour baseline determination; NS = not significant; PA = pulmonary artery; Rx = value after drug administration; SD = standard deviation.
It has also been suggested that the presence of spontaneous variability in pulmonary vascular resis- tance predict success with vasodilators in treating pa- tients with pulmonary hypertension.sJ4 We could not correlate the amount of variability to drug responsive- nesswith nifedipine or hydralazine. Neither were the patients with the greatest reduction in pulmonary re- sistance from the drugs the same ones that appeared to have the most spontaneous change in pulmonary vas- cular tone. A modest but significant reduction in PA pressure (5 mm Hg) and pulmonary resistance (5 units) occurred with nifedipine, but not with hydralazine.
Bebause the values were measured every hour, the possibility exists that a drug response measured at an interval of less than 60 minutes may be less influenced by spontaneous variability, or that variability may have a greater influence in the assessment of chronic therapy made over weeks or months. Although these patients were randomly referred to us for study, it is also possible that variability may not be as evident in other patients with pulmonary hypertension, particularly from other causes.
When one reviews previous studies evaluating vaso- dilator drugs in PPH, one is impressed by the marked lack of uniform criteria that have been used in deciding what magnitude of change determines a beneficial drug response. Based on the patients in this study, we con- structed a table that indicates the amount of change required in order to achieve 95% confidence that a he- modynamic effect was drug-related. In an individual patient there must be a relatively large change (e.g., 2%
in mean PA pressure and 36% in pulmonary resistance) in order for it to be attributed (with 95% confidence) to a drug effect rather than spontaneous variability (Table II). This must be considered before one makes conclu- sions about drug effects in individual patients with PPH.
References 1. Rich S, Martinez J, Lam W, Levy PS, Rosen KM. Reassessment of the
effects of vasodilator drugs in PPH: guidelines for determining a pulmonary vasodilator response. Am Heart J 1983;105:119-127.
2. Rubin LJ, Peter RH. Oral hydralazine therapy for primary pulmonary hy- pertension. N Engl J Med 1980;302:69-73.
3. Lupi-Herrera E, Sandoval J, Seoane Y, Bialostozky D. The role of hy- dralazine therapy for pulmonary hypertension of unknown cause. Circulation 1982;65:645-650.
4. Came&e F, Alberti E, Klugman S, Salve A. Primary pulmonary hyper- tension: effects of nifedipine. Br Hear-f J 1980;44:352-356.
5. DeFeyter PJ, Kerkkamp HJJ, deJong JP. Sustained beneficial of nifedipine in primary pulmonary hypertension. Am Heart J 1963;105:333-334.
6. Voelkel N, Reeves JT. Primary pulmonary hypertension. In: Moser KM, ed. Pulmonary Vascular Diseases. New York: Marcel Dekker, 1979:573- 628.
7. Rich S, Brundage BH. Primary pulmonary hypertension. Current update. JAMA 1984;251:2252-2254.
6. Rich S, Martinez J, Lam W, Rosen KM. Captopril as treatment for patients with pulmonary hypertension. Problem of variability in assessing chronic drug treatment. Br Heart J 1982;48:272-277.
9. Kain HK, Hlnman AT, Skolow Y. Arterial blood pressure measurements with a portable recorder in hypertension patients. I. Variability and corre- lations with “casual” pressures. Circulation 1964;30:882-892.
10. Littler WA, West MJ, Honour AJ, Slelght P. The variability of arterial pressure. Am Heart J 1978;95:18d-187:
11. Morganroth J, Michelson EL, Horowitz LN, Josephson ME, Pearlman AS, Dunkman WB. Limitations of routine long-term electrocardiographic monitoring to assess ventricular ectopic frequency. Circulation 1978;58: 408-414.
12. Winkle RA. Antiarmythmic drug effect mimicked by spontaneous variability of ventricular ectopy. Circulation 1978;57:1116-1120.
13. Samet P, Bernstein WH. Loss of reactivity of the pulmonary vascular bed in primary pulmonary hypertension. Am Heat-f J 1963;66:197-199.
14. Kadowitz PJ, Hyman AL. Hydralazine and the treatment of primary pul- monary hypertension. N Engl J Med 1982;306:1357-1359.


![Instructions for use - 北海道大学 · Chronological Change in Pulmonary Vascular Response to Hypoxia in Hepatopulmonary Syndrome ... hypertension [9]. The hemodynamic features](https://img.pdfslide.us/doc/110x75/5e1e414662e9cf6a9e7ba9d3/instructions-for-use-oee-chronological-change-in-pulmonary-vascular.jpg)