Embed Size (px)
Citation preview
MAGNETO-OPTIC FLAW DETECTION OF SUBSURFACE LAYERS
OF FERROMAGNETIC PRODUCTS
TROITSKIY V.A., POSYPAIKO Iu.M., AGALIDI Yu.S., LEVYIJ S.V. The E.O.Paton Electric Welding Institute of NAS of Ukraine,
National Technical University of Ukraine “Kiev Polytechnic Institute” Kiev, Ukraine
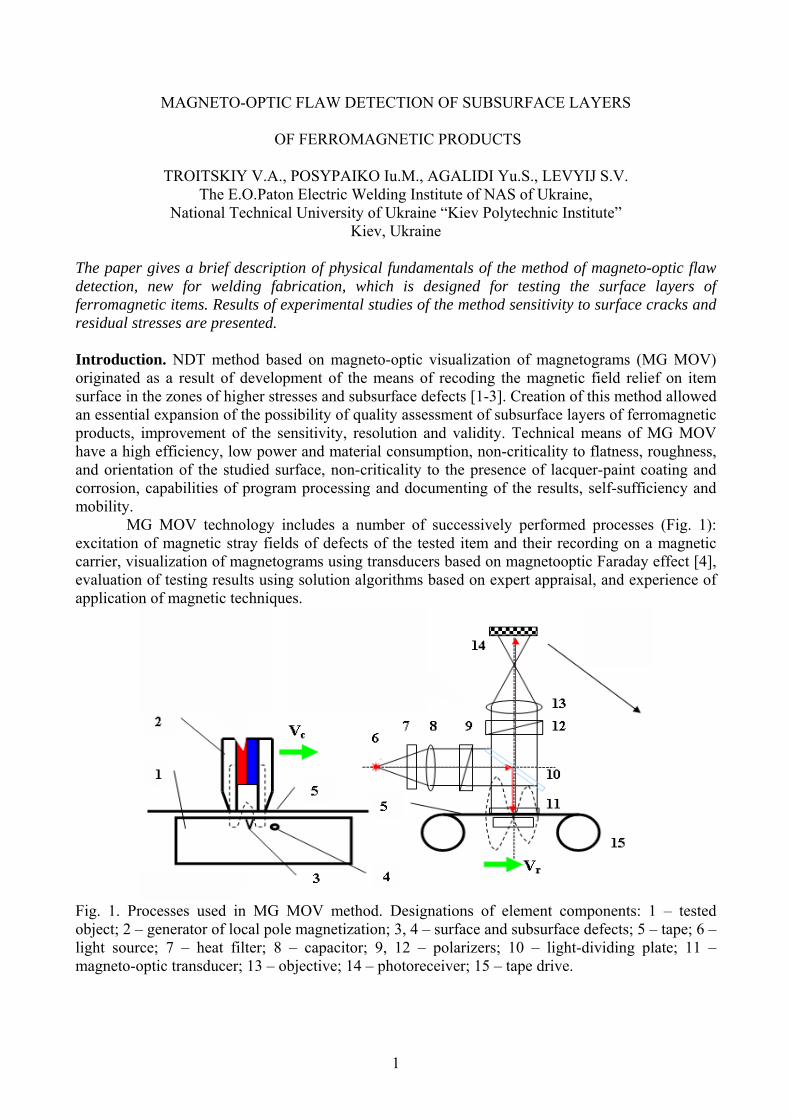
The paper gives a brief description of physical fundamentals of the method of magneto-optic flaw detection, new for welding fabrication, which is designed for testing the surface layers of ferromagnetic items. Results of experimental studies of the method sensitivity to surface cracks and residual stresses are presented. Introduction. NDT method based on magneto-optic visualization of magnetograms (MG MOV) originated as a result of development of the means of recoding the magnetic field relief on item surface in the zones of higher stresses and subsurface defects [1-3]. Creation of this method allowed an essential expansion of the possibility of quality assessment of subsurface layers of ferromagnetic products, improvement of the sensitivity, resolution and validity. Technical means of MG MOV have a high efficiency, low power and material consumption, non-criticality to flatness, roughness, and orientation of the studied surface, non-criticality to the presence of lacquer-paint coating and corrosion, capabilities of program processing and documenting of the results, self-sufficiency and mobility. MG MOV technology includes a number of successively performed processes (Fig. 1): excitation of magnetic stray fields of defects of the tested item and their recording on a magnetic carrier, visualization of magnetograms using transducers based on magnetooptic Faraday effect [4], evaluation of testing results using solution algorithms based on expert appraisal, and experience of application of magnetic techniques.
Fig. 1. Processes used in MG MOV method. Designations of element components: 1 – tested object; 2 – generator of local pole magnetization; 3, 4 – surface and subsurface defects; 5 – tape; 6 – light source; 7 – heat filter; 8 – capacitor; 9, 12 – polarizers; 10 – light-dividing plate; 11 – magneto-optic transducer; 13 – objective; 14 – photoreceiver; 15 – tape drive.
1
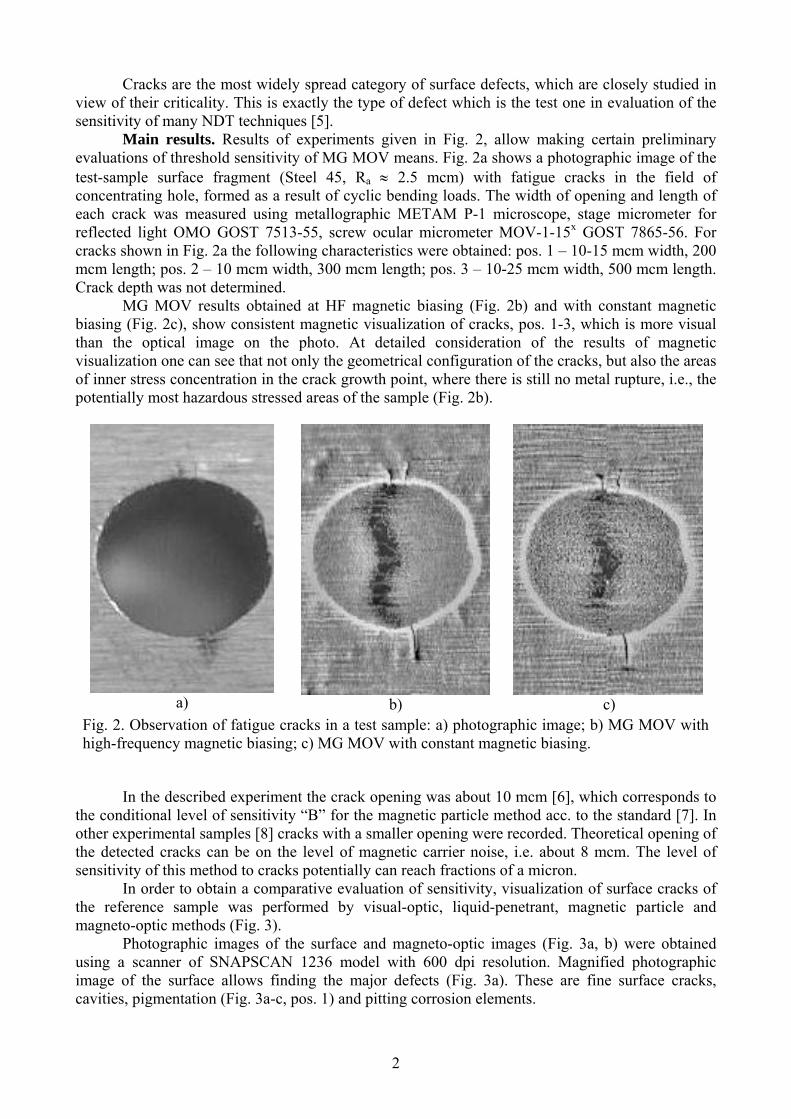
Cracks are the most widely spread category of surface defects, which are closely studied in view of their criticality. This is exactly the type of defect which is the test one in evaluation of the sensitivity of many NDT techniques [5]. Main results. Results of experiments given in Fig. 2, allow making certain preliminary evaluations of threshold sensitivity of MG MOV means. Fig. 2a shows a photographic image of the test-sample surface fragment (Steel 45, Ra ≈ 2.5 mcm) with fatigue cracks in the field of concentrating hole, formed as a result of cyclic bending loads. The width of opening and length of each crack was measured using metallographic METAM P-1 microscope, stage micrometer for reflected light OMO GOST 7513-55, screw ocular micrometer MOV-1-15x GOST 7865-56. For cracks shown in Fig. 2a the following characteristics were obtained: pos. 1 – 10-15 mcm width, 200 mcm length; pos. 2 – 10 mcm width, 300 mcm length; pos. 3 – 10-25 mcm width, 500 mcm length. Crack depth was not determined. MG MOV results obtained at HF magnetic biasing (Fig. 2b) and with constant magnetic biasing (Fig. 2c), show consistent magnetic visualization of cracks, pos. 1-3, which is more visual than the optical image on the photo. At detailed consideration of the results of magnetic visualization one can see that not only the geometrical configuration of the cracks, but also the areas of inner stress concentration in the crack growth point, where there is still no metal rupture, i.e., the potentially most hazardous stressed areas of the sample (Fig. 2b).
а)
b)
c)
Fig. 2. Observation of fatigue cracks in a test sample: a) photographic image; b) MG MOV with high-frequency magnetic biasing; c) MG MOV with constant magnetic biasing.
In the described experiment the crack opening was about 10 mcm [6], which corresponds to the conditional level of sensitivity “B” for the magnetic particle method acc. to the standard [7]. In other experimental samples [8] cracks with a smaller opening were recorded. Theoretical opening of the detected cracks can be on the level of magnetic carrier noise, i.e. about 8 mcm. The level of sensitivity of this method to cracks potentially can reach fractions of a micron. In order to obtain a comparative evaluation of sensitivity, visualization of surface cracks of the reference sample was performed by visual-optic, liquid-penetrant, magnetic particle and magneto-optic methods (Fig. 3). Photographic images of the surface and magneto-optic images (Fig. 3a, b) were obtained using a scanner of SNAPSCAN 1236 model with 600 dpi resolution. Magnified photographic image of the surface allows finding the major defects (Fig. 3a). These are fine surface cracks, cavities, pigmentation (Fig. 3a-c, pos. 1) and pitting corrosion elements.
2
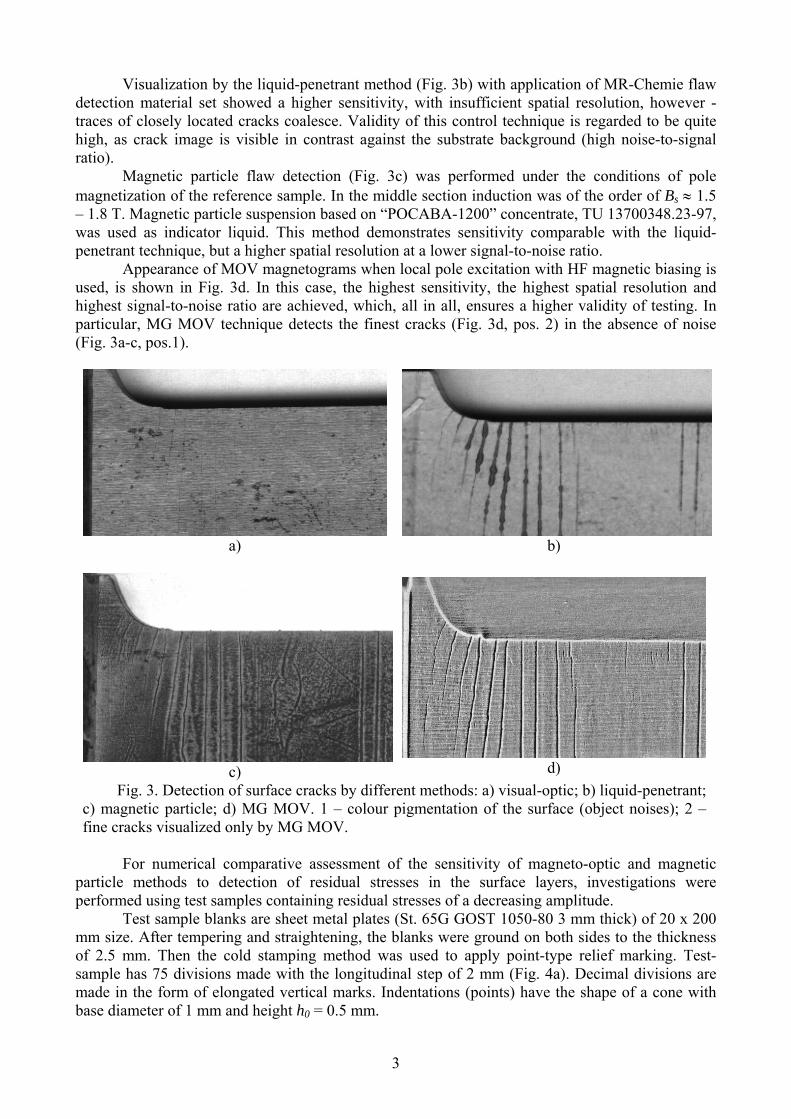
Visualization by the liquid-penetrant method (Fig. 3b) with application of MR-Chemie flaw detection material set showed a higher sensitivity, with insufficient spatial resolution, however - traces of closely located cracks coalesce. Validity of this control technique is regarded to be quite high, as crack image is visible in contrast against the substrate background (high noise-to-signal ratio). Magnetic particle flaw detection (Fig. 3c) was performed under the conditions of pole magnetization of the reference sample. In the middle section induction was of the order of Bs ≈ 1.5 – 1.8 T. Magnetic particle suspension based on “POCABA-1200” concentrate, TU 13700348.23-97, was used as indicator liquid. This method demonstrates sensitivity comparable with the liquid-penetrant technique, but a higher spatial resolution at a lower signal-to-noise ratio. Appearance of MOV magnetograms when local pole excitation with HF magnetic biasing is used, is shown in Fig. 3d. In this case, the highest sensitivity, the highest spatial resolution and highest signal-to-noise ratio are achieved, which, all in all, ensures a higher validity of testing. In particular, MG MOV technique detects the finest cracks (Fig. 3d, pos. 2) in the absence of noise (Fig. 3a-c, pos.1).
а) b)
c)
d) Fig. 3. Detection of surface cracks by different methods: a) visual-optic; b) liquid-penetrant;
c) magnetic particle; d) MG MOV. 1 – colour pigmentation of the surface (object noises); 2 – fine cracks visualized only by MG MOV.
For numerical comparative assessment of the sensitivity of magneto-optic and magnetic particle methods to detection of residual stresses in the surface layers, investigations were performed using test samples containing residual stresses of a decreasing amplitude. Test sample blanks are sheet metal plates (St. 65G GOST 1050-80 3 mm thick) of 20 x 200 mm size. After tempering and straightening, the blanks were ground on both sides to the thickness of 2.5 mm. Then the cold stamping method was used to apply point-type relief marking. Test-sample has 75 divisions made with the longitudinal step of 2 mm (Fig. 4a). Decimal divisions are made in the form of elongated vertical marks. Indentations (points) have the shape of a cone with base diameter of 1 mm and height h0 = 0.5 mm.
3
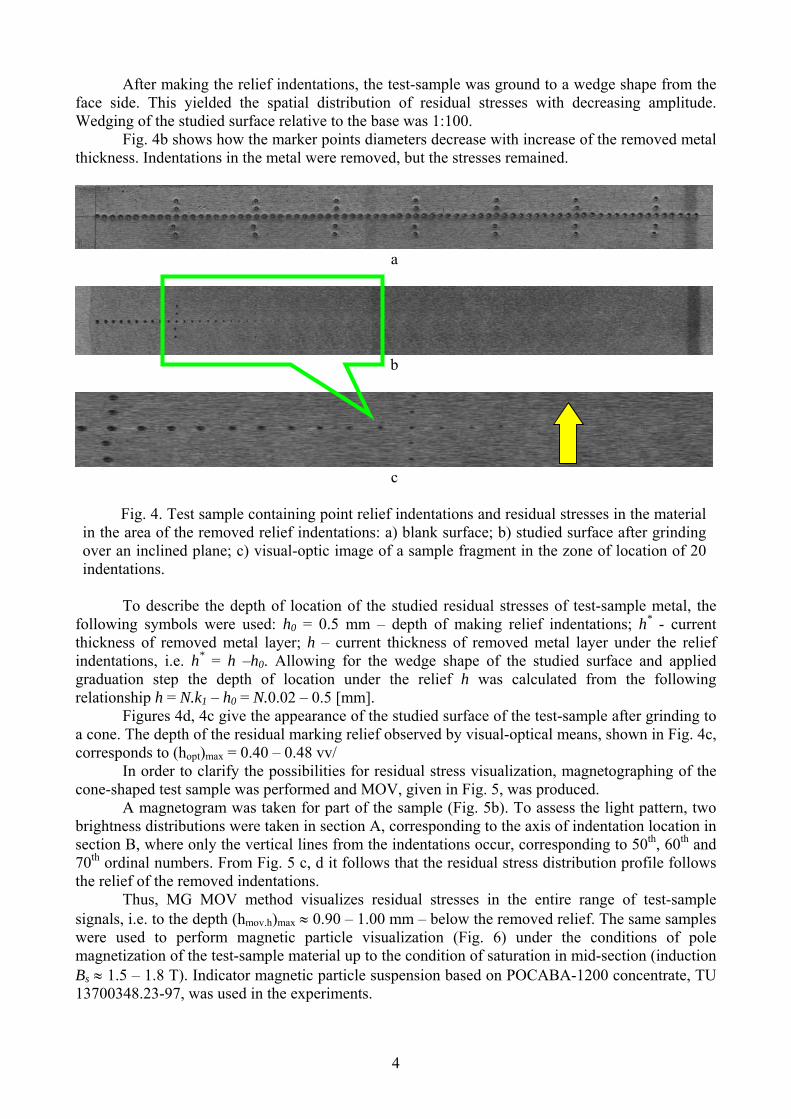
After making the relief indentations, the test-sample was ground to a wedge shape from the face side. This yielded the spatial distribution of residual stresses with decreasing amplitude. Wedging of the studied surface relative to the base was 1:100. Fig. 4b shows how the marker points diameters decrease with increase of the removed metal thickness. Indentations in the metal were removed, but the stresses remained.
a
b
c
Fig. 4. Test sample containing point relief indentations and residual stresses in the material in the area of the removed relief indentations: a) blank surface; b) studied surface after grinding over an inclined plane; c) visual-optic image of a sample fragment in the zone of location of 20 indentations.
To describe the depth of location of the studied residual stresses of test-sample metal, the following symbols were used: h0 = 0.5 mm – depth of making relief indentations; h* - current thickness of removed metal layer; h – current thickness of removed metal layer under the relief indentations, i.e. h* = h –h0. Allowing for the wedge shape of the studied surface and applied graduation step the depth of location under the relief h was calculated from the following relationship h = N.k1 – h0 = N.0.02 – 0.5 [mm]. Figures 4d, 4c give the appearance of the studied surface of the test-sample after grinding to a cone. The depth of the residual marking relief observed by visual-optical means, shown in Fig. 4c, corresponds to (hopt)max = 0.40 – 0.48 vv/
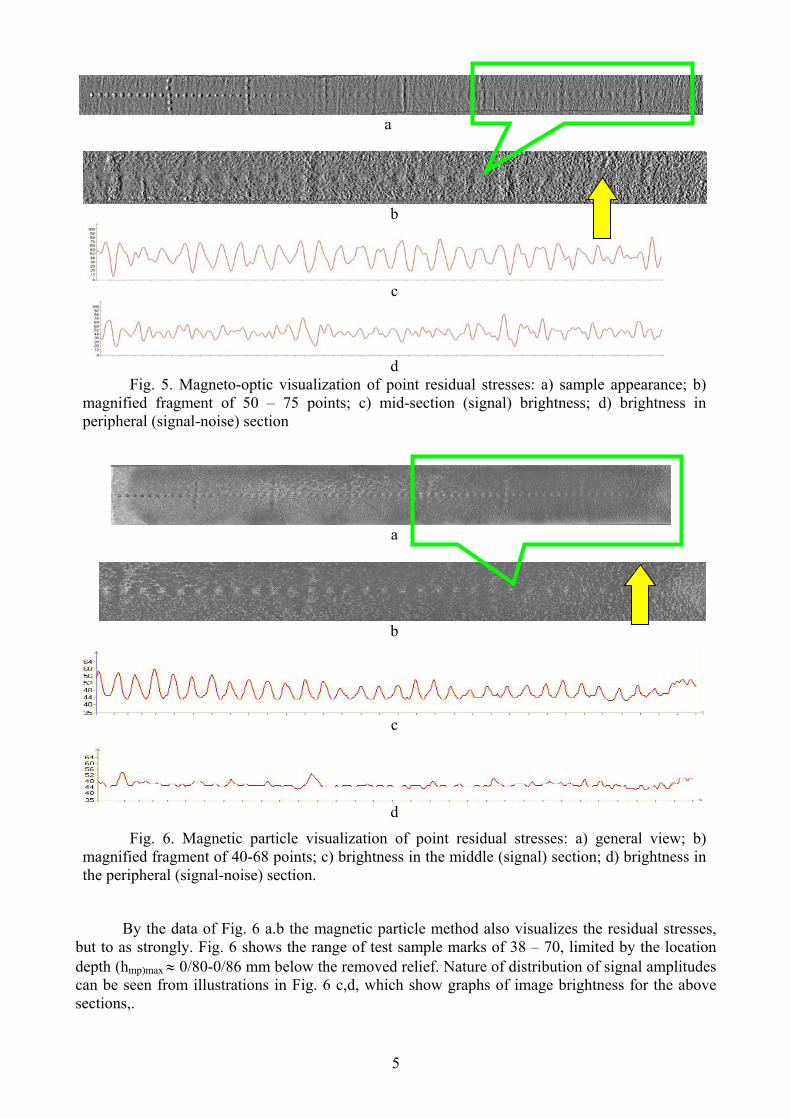
In order to clarify the possibilities for residual stress visualization, magnetographing of the cone-shaped test sample was performed and MOV, given in Fig. 5, was produced.
A magnetogram was taken for part of the sample (Fig. 5b). To assess the light pattern, two brightness distributions were taken in section A, corresponding to the axis of indentation location in section B, where only the vertical lines from the indentations occur, corresponding to 50th, 60th and 70th ordinal numbers. From Fig. 5 c, d it follows that the residual stress distribution profile follows the relief of the removed indentations.
Thus, MG MOV method visualizes residual stresses in the entire range of test-sample signals, i.e. to the depth (hmov.h)max ≈ 0.90 – 1.00 mm – below the removed relief. The same samples were used to perform magnetic particle visualization (Fig. 6) under the conditions of pole magnetization of the test-sample material up to the condition of saturation in mid-section (induction Bs ≈ 1.5 – 1.8 T). Indicator magnetic particle suspension based on POCABA-1200 concentrate, TU 13700348.23-97, was used in the experiments.
4
а
b
c
d
Fig. 5. Magneto-optic visualization of point residual stresses: a) sample appearance; b) magnified fragment of 50 – 75 points; c) mid-section (signal) brightness; d) brightness in peripheral (signal-noise) section
а
b
c
d
Fig. 6. Magnetic particle visualization of point residual stresses: a) general view; b) magnified fragment of 40-68 points; c) brightness in the middle (signal) section; d) brightness in the peripheral (signal-noise) section.
By the data of Fig. 6 a.b the magnetic particle method also visualizes the residual stresses,
but to as strongly. Fig. 6 shows the range of test sample marks of 38 – 70, limited by the location depth (hmp)max
≈ 0/80-0/86 mm below the removed relief. Nature of distribution of signal amplitudes can be seen from illustrations in Fig. 6 c,d, which show graphs of image brightness for the above sections,.
5
Analysis of the obtained experimental data shows that MG MOV method offers a wider range of visualized amplitudes of residual stresses, as it demonstrates sensitivity to defects induced by cold working at location depth (hmov.h)max ≈ 0.90-1.00 mm, whereas the sensitivity of magnetic particle method was limited to value (hmov.h)max ≈ 0.80-0.86 mm/ In addition, MG MOV method has a higher (by 2-8 dB) signal-to-noise ration relative to magnetic particle method, thus giving higher validity to its results.
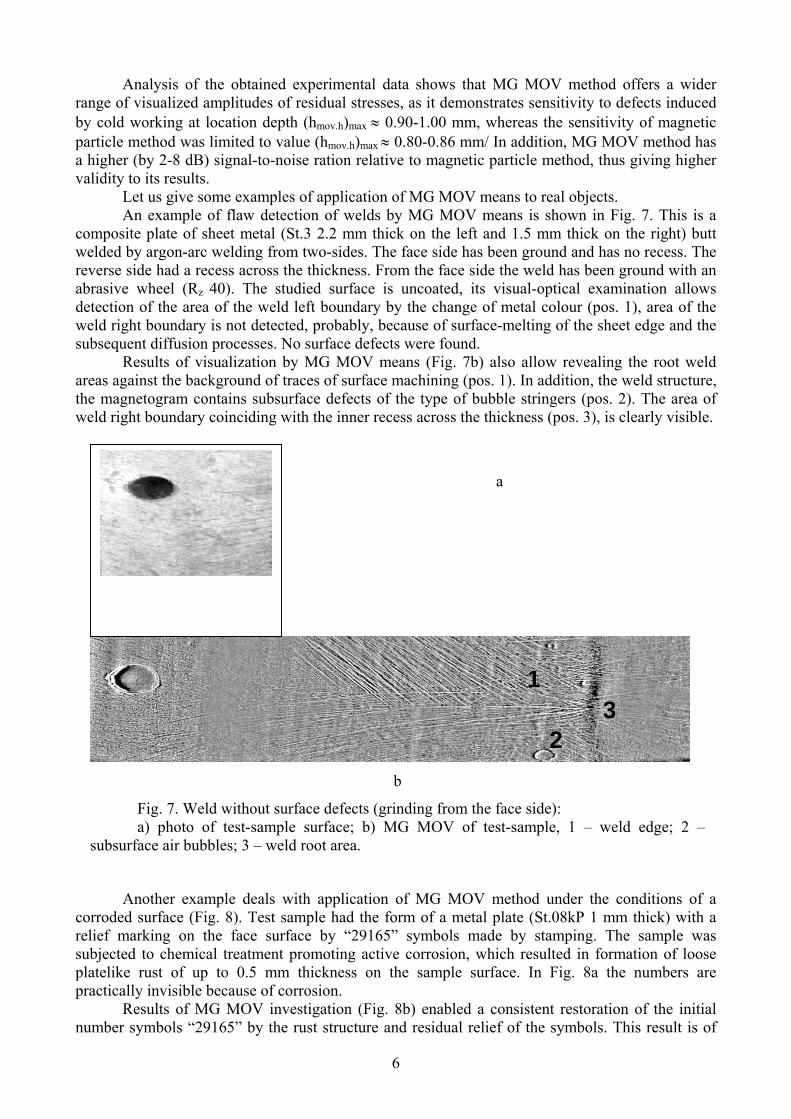
Let us give some examples of application of MG MOV means to real objects. An example of flaw detection of welds by MG MOV means is shown in Fig. 7. This is a
composite plate of sheet metal (St.3 2.2 mm thick on the left and 1.5 mm thick on the right) butt welded by argon-arc welding from two-sides. The face side has been ground and has no recess. The reverse side had a recess across the thickness. From the face side the weld has been ground with an abrasive wheel (Rz
40). The studied surface is uncoated, its visual-optical examination allows detection of the area of the weld left boundary by the change of metal colour (pos. 1), area of the weld right boundary is not detected, probably, because of surface-melting of the sheet edge and the subsequent diffusion processes. No surface defects were found.
Results of visualization by MG MOV means (Fig. 7b) also allow revealing the root weld areas against the background of traces of surface machining (pos. 1). In addition, the weld structure, the magnetogram contains subsurface defects of the type of bubble stringers (pos. 2). The area of weld right boundary coinciding with the inner recess across the thickness (pos. 3), is clearly visible.
а
b
Fig. 7. Weld without surface defects (grinding from the facea) photo of test-sample surface; b) MG MOV of test-sa
subsurface air bubbles; 3 – weld root area.
Another example deals with application of MG MOV meth
corroded surface (Fig. 8). Test sample had the form of a metal platerelief marking on the face surface by “29165” symbols made bysubjected to chemical treatment promoting active corrosion, which platelike rust of up to 0.5 mm thickness on the sample surface.practically invisible because of corrosion.
Results of MG MOV investigation (Fig. 8b) enabled a consnumber symbols “29165” by the rust structure and residual relief of
6
1
sidmp
2
od (S s
resu In
iste the
e): le, 1 –
under tht.08kP 1tamping.lted in
Fig. 8a
nt restor symbol
3
weld edge; 2 –
e conditions of a mm thick) with a The sample was formation of loose the numbers are
ation of the initial s. This result is of
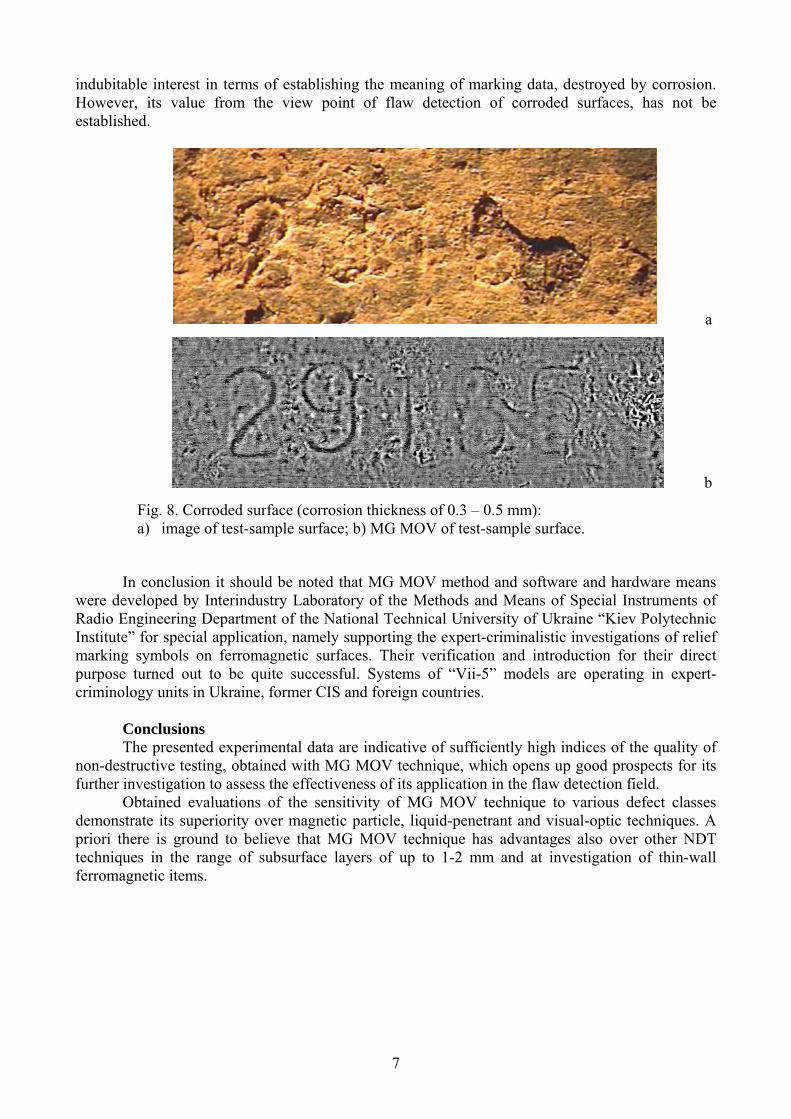
indubitable interest in terms of establishing the meaning of marking data, destroyed by corrosion. However, its value from the view point of flaw detection of corroded surfaces, has not be established.
а
b
Fig. 8. Corroded surface (corrosion thickness of 0.3 – 0.5 mm): a) image of test-sample surface; b) MG MOV of test-sample surface.
In conclusion it should be noted that MG MOV method and software and hardware means were developed by Interindustry Laboratory of the Methods and Means of Special Instruments of Radio Engineering Department of the National Technical University of Ukraine “Kiev Polytechnic Institute” for special application, namely supporting the expert-criminalistic investigations of relief marking symbols on ferromagnetic surfaces. Their verification and introduction for their direct purpose turned out to be quite successful. Systems of “Vii-5” models are operating in expert-criminology units in Ukraine, former CIS and foreign countries.
Conclusions
The presented experimental data are indicative of sufficiently high indices of the quality of non-destructive testing, obtained with MG MOV technique, which opens up good prospects for its further investigation to assess the effectiveness of its application in the flaw detection field. Obtained evaluations of the sensitivity of MG MOV technique to various defect classes demonstrate its superiority over magnetic particle, liquid-penetrant and visual-optic techniques. A priori there is ground to believe that MG MOV technique has advantages also over other NDT techniques in the range of subsurface layers of up to 1-2 mm and at investigation of thin-wall ferromagnetic items.
7
References 1. Troitskii V.A. Magnetic particle testing of welded joints and parts of machines. – Kiev:
Feniks, 2002. – 300 p. 2. Patent for an invention (Ukraine) # 42880 of 15.11.2001., Bul. #10, 7G 01N 27/82, 27/83;
Method of magneto-optic testing of an item. Patent applicants: Levy S.V., Agalidi Yu.S. Application #99074257, of 22.07.1999. Priority of 05.10.2001. Authors of invention: Levy S.V., Agalidi Yu.S.
3. Patent for an invention (Russian Federation) RU #2159426 C1, 7G 01N 27/82, 27/83. Method of magneto-optic testing of items. // Levy S.V., Agalidi Yu.S. - #99122303, Appl. 25.10.1999: Publ. 20.11.2000. – Bul. #32. – 6p.
4. Levy S.V., Ostrovsky A.S., Agalidi Yu.S. Magnetic field topographical survey by space-time light modulators. SPIE Proceedings Vol. 2108 (1993), с. 142-146.
5. DSTU 2865-94. Non-destructive testing. Terms and definitions. Appr. and intr. 08.12.1994 for the first time. – K.: Derzhstandart of Ukraine.1995 – 5 p.
6. Agalidi Yu.S., Levy S.V., Machnev A.M. Experimental estimate of sensitivity and validity of magneto-optic visualization of route reliefs // Visnyk NTUU “KPI”, series Priladobudivnyk. – 2006. - #32. – P.39-46.
7. GOST 21105-87. Non-destructive testing. Magnetic particle method; Introd. 01.01.1988 instead of GOST 21105-75; reedit. (April 1992) with modification #1, approved in September 1989 (IUS 1-90) – M.: Izd-vo standartov. 1992. – 17 p.
8. Levy S.V., Machnev A.M., Agalidi Yu.S., Magera V.N., Turbin D.A. Application of magneto-optic transducer for signal restoration by non-format records // Vestnik NTUU “KPI”. Series: Radioelectronika. – 2000. vol. 43. - #5. - P. …
9. Agalidi Yu.S., Levy S.V., Machnev A.M. Comparative analysis of magnetic particle and magneto-optic techniques of visualization of magnetic field spatial distribution when studying residual stresses // Visnyk NTUU “KPI”, series: Priladobuduvanya. – 2006. - #31. – p.18-24.
8