Embed Size (px)
Citation preview

BioMag Laboratory
Helsinki University Central Hospital
University of Helsinki
Magnetoencephalographic and electroencephalographic studies of
spontaneous activity and evoked responses in the sensorimotor system
Vadim V. Nikouline
Academic Dissertation
To be publicly discussed by permission of the Medical Faculty of the University of Helsinki,
in the Lecture Hall 2 of the Helsinki University Central Hospital, Haartmaninkatu 4,
on October 26, 2001, at 12 noon
Helsinki 2001
1
Supervisors Docent Risto J. Ilmoniemi, Ph.D.BioMag Laboratory, Engineering CentreHelsinki University Central HospitalHelsinki, Finland
Docent Juha Huttunen, M.D., Ph.D.Department of Clinical NeurophysiologyBioMag Laboratory, Engineering CentreHelsinki University Central HospitalHelsinki, Finland
Docent Synnöve Carlson, M.D., Ph.D.Biomedicum HelsinkiInstitute of Biomedicine/PhysiologyHelsinki, Finland
Reviewers Professor Hannu Eskola, Ph.D.Digital Media InstituteTampere University of TechnologyTampere, Finland
Docent Tapani Salmi, M.D., Ph.D.Department of Clinical NeurophysiologyHelsinki University Central HospitalHelsinki, Finland
Opponent Docent Gabriel Curio, M.D., Ph.D.Neurophysics GroupDepartment of NeurologyKlinikum Benjamin FranklinFreie Universität BerlinBerlin, Germany
ISBN 952-91-3922-5ISBN 952-10-0163-1 (pdf), http://ethesis.helsinki.fi
Limes 2001
2
Contents
Abbreviations ................................................................................................................ 4
List of original publications ..................................................................................... 5
Abstract ........................................................................................................................... 6
Introduction ................................................................................................................... 7
Review of literature ..................................................................................................... 8Oscillatory brain activity.................................................................................................. 8Alpha rhythm ...................................................................................................................... 8Mu and beta rhythms........................................................................................................... 9
Self-organized criticality (SOC)..................................................................................... 10
Synchrony in the brain ................................................................................................... 11
Somatosensory system and primary motor cortex....................................................... 11Receptors and spinal cord ................................................................................................. 11Brain stem and thalamus ................................................................................................... 12Primary somatosensory cortex (SI)................................................................................... 12Secondary somatosensory cortex (SII) ............................................................................. 13Posterior parietal cortex (PPC) ......................................................................................... 14Other areas related to somatosensory processing ............................................................. 14Primary motor cortex (MI)................................................................................................ 14
Somatosensory evoked responses .................................................................................. 15Somatosensory evoked potentials (SEP)........................................................................... 15Somatosensory evoked fields (SEF) ................................................................................. 16
Experimental techniques ................................................................................................ 17Magneto- and Electroencephalography (MEG, EEG) ...................................................... 17Transcranial magnetic stimulation (TMS) ........................................................................ 17
Aims of study ............................................................................................................... 19
Materials and methods............................................................................................. 20Stimulation........................................................................................................................ 20Recordings ........................................................................................................................ 20Data analysis ..................................................................................................................... 21
Results and discussion ............................................................................................. 22I. Suppression of mu rhythm by somatosensory stimulation.................................... 22Results............................................................................................................................... 22Discussion ......................................................................................................................... 23
3
II. Pre-stimulus mu rhythm and somatosensory evoked fields................................. 24Results............................................................................................................................... 24Discussion ......................................................................................................................... 25III. Somatosensory evoked potentials modulated by TMS ......................................... 26Results............................................................................................................................... 26Discussion ......................................................................................................................... 27IV. Long-range temporal correlations in spontaneous brain oscillations ................. 29Results............................................................................................................................... 29Discussion ......................................................................................................................... 30V. Phase synchronization and amplitude correlation of beta oscillations ................. 31Results............................................................................................................................... 31Discussion ......................................................................................................................... 32
Methodological remarks .......................................................................................... 34
Summary ....................................................................................................................... 35
Conclusions .................................................................................................................. 36
Acknowledgments ...................................................................................................... 37
References ..................................................................................................................... 38
4
Abbreviations
ACF Autocorrelation functionDFA Detrended fluctuation analysisEEG ElectroencephalographyEPSP Excitatory postsynaptic potentialER Evoked responseERD Event-related desynchronizationIPSP Inhibitory postsynaptic potentialISI Interstimulus intervalMEG MagnetoencephalographyMI Primary motor cortexMNS Median nerve stimulationPET Positron emission tomographyPPC Posterior parietal cortexSI Primary somatosensory areaSII Secondary somatosensory areaSEF Somatosensory evoked fieldSEM Standard error of meanSEP Somatosensory evoked potentialSQUID Superconducting quantum interference deviceTMS Transcranial magnetic stimulationVPL Ventroposterolateral nucleus of the thalamusVPM Ventroposteromedial nucleus of the thalamus
5
List of original publications
This thesis is based on five publications, which are referred to by their Roman numerals.
I. Nikouline VV, Linkenkaer-Hansen K, Wikström H, Kesäniemi M, Antonova EV,Ilmoniemi RJ, and Huttunen J. Dynamics of mu-rhythm suppression caused by mediannerve stimulation: a magnetoencephalographic study. Neurosci Lett 2001, 294: 163–166.
II. Nikouline VV, Wikström H, Linkenkaer-Hansen K, Kesäniemi M, Ilmoniemi RJ, andHuttunen J. Somatosensory evoked magnetic fields: relation to pre-stimulus mu rhythm.Clin Neurophysiol 2000, 111: 1227–1233.
III. Schürmann M, Nikouline VV, Soljanlahti S, Ollikainen M, Başar E, and Ilmoniemi RJ.EEG responses to combined somatosensory and transcranial magnetic stimulation. ClinNeurophysiol 2001, 112: 19–24.
IV. Linkenkaer-Hansen K, Nikouline VV, Palva JM, and Ilmoniemi RJ. Long range temporalcorrelations and scaling behavior in human brain oscillations. J Neurosci 2001, 21: 1370–1377.
V. Nikouline VV, Linkenkaer-Hansen K, Huttunen J, and Ilmoniemi RJ. Interhemisphericphase synchrony and amplitude correlation of spontaneous beta oscillations in humansubjects: a magnetoencephalographic study. NeuroReport 2001, 12: 2487–2491.
6
Abstract
Recent findings indicate that spontaneous cortical neuronal activity may have an impact ondifferent brain functions, including changes in the integrative properties of neurons, informationtransmission, and detection of stimuli. The character and biological significance of spontaneousactivity remains poorly understood, particularly in humans. The studies of the thesis aimed atcharacterization of spontaneous 10- and 20-Hz activity with magnetoencephalography (MEG) andelectroencephalography (EEG) in human subjects, with emphasis on the activity originating in thesensorimotor areas of the cortex.
A relationship between the spontaneous mu rhythm (rolandic 10-Hz oscillations) andsomatosensory processing was demonstrated. The results indicate that there is a slight positivecorrelation between the amplitude of the P35m component of somatosensory evoked fields and theamplitude of pre-stimulus mu rhythm. Albeit weak, this dependency can be interpreted as evidencefor regulation of somatosensory processing via changes in spontaneous activity. An enhancementof the P25 component of the somatosensory evoked potential was consistently observed fortranscranial magnetic stimulation (TMS) concurrent with somatosensory stimulus. Thisenhancement can be interpreted (1) as an indication of local interaction between the somatosensoryevoked cortical activity and TMS-evoked activity or (2) as supporting a relationship between thebackground EEG and the evoked potential, this relationship being disrupted by TMS. In turn,somatosensory stimuli have strong influence on spontaneous activity. Median nerve stimulationsuppressed mu rhythm at both contra- and ipsilateral somatosensory cortices, but the attenuationwas clearly lateralized, being at least 20% stronger contra- than ipsilaterally. Moreover, in thecourse of the experiment repeated stimulation significantly reduced suppression of mu rhythm inthe ipsilateral but not in the contralateral hemisphere. The strong ipsilateral suppression of murhythm in the beginning of the experiment may reflect the presence of nonspecific arousal-likeactivation. Amplitude fluctuations of 10- and 20-Hz oscillations were found to be correlated overthousands of oscillation cycles and to obey power-law scaling behaviour. A hypothesis isformulated that the long-range correlations, and the power-law scaling behavior of spontaneousoscillations find a unifying explanation within the theory of self-organized criticality. Spontaneousrolandic 20-Hz activity (beta oscillations) demonstrated also long-range interhemispheric phasesynchrony. Functionally, the phase synchrony can be interpreted on the basis of bilaterality ofmovement organization. A positive interhemispheric correlation was also found for the amplitudeof spontaneous beta oscillations over long time intervals (> 1 s). The low-frequency correlation ofspontaneous rhythmic activity may be the source of the low-frequency correlations of thehemodynamic responses in homologous areas, that have been reported previously and have beeninterpreted to reflect functional connectivity between these areas. Thus, taken together these resultsindicate that the spontaneous oscillatory activity of the brain can be highly organized in terms ofboth long-range temporal and spatial correlations.
7
Introduction
All movements, thoughts and perceptions are accompanied by specific brain activity. Infact, under normal circumstances, the brain is always active, generating enormously complexpatterns of neuronal firing. We understand fairly well the cellular mechanisms responsible for thegeneration of action potentials and postsynaptic potentials, we know micro- and macro-anatomy ofthe nervous system, but we are far away from the understanding of how thousands of neurons areworking as a whole, being involved in the organization of a particular event. It is generally believedthat reliable functioning of the nervous system is dependent on the cooperative activity of manyneurons in the network. The present thesis is about the neuronal oscillations in the human brain,particularly in the sensorimotor system, measured by magnetoencephalography (MEG) andelectroencephalography (EEG). These two methods give no information about single-unit activitybut are suitable for the description of the oscillations, created by synchronous performance of alarge number of neurons. The main emphasis in the thesis is on studying neuronal activity that isnot directly related to any clearly defined cognitive, motor or perceptional tasks. In the literature,this type of neuronal oscillations is often called spontaneous activity. I regard spontaneous activityas neuronal oscillations, which are present both within and outside the time-window of neuronalprocessing of sensory information. It is also important to note here, that spontaneous activity can bemodified by the sensory stimuli. This activity is surprisingly pronounced and may be orders ofmagnitude larger than the responses evoked by sensory stimuli, thus indicating a very high degreeof correlation between the neurons.
Although brain research using EEG and MEG techniques has over many years been mainlyfocused on evoked responses, recent years have witnessed a renaissance of research on spontaneouscerebral oscillations. This has been facilitated by the development of brain imaging techniques. Forexample, multi-channel MEG allows to differentiate parieto-occipital and rolandic 10-Hz rhythms,whereas these are not easy to separate in EEG recordings. Transcranial magnetic stimulation (TMS)might also prove to be useful as a tool to modify spontaneous activity or to emulate synchronoussynaptic bombardment of a target network, similar to the bombardment created by a large numberof neuronal action potentials coinciding in time.
Several recent experiments in cats show that the continuous spontaneous activity is ageneral basis for the proper functioning of the network, where a simple factor — the number ofsynaptic events — is a critical requirement (Paré et al., 1998; Destexhe and Paré, 1999).Spontaneous activity might even be beneficial for the robust detection of sensory information(Nuñez et al., 2000). Taken together, these facts suggest that spontaneous oscillations are importantfor proper brain functioning. At the same time, it is not rare to encounter in the literature statementsquestioning the significance of spontaneous oscillations. Clearly, our understanding of thespontaneous cerebral oscillations is still largely incomplete.
The present studies aimed at improving our understanding of cortical oscillations, especiallyin the sensorimotor system. Rolandic and occipital oscillations as well as somatosensory evokedresponses were studied with whole-scalp EEG and MEG techniques and with TMS.
8
Review of literature
Oscillatory brain activity
As a reaction to an external event, the brain generates evoked responses. However, aprominent oscillatory brain activity is evident even in the absence of any external stimuli. Althoughbeing spontaneously generated, this oscillatory activity may change as a result of experimentalmanipulations. Experiments in cats revealed a high degree of correlation between the activity of asingle neocortical neuron (measured extracellularly) and the spontaneous/evoked (measured withoptical imaging) dynamics of the whole network in which this neuron was embedded (Tsodyks etal., 1999). This correlation is a demonstration of synchronous activation of separate functionaldomains with similar properties over the extended cortical areas. Recent data have revealed anincrease of membrane conductance during epochs of intense synaptic bombardment compared tothe periods that were free of extensive synaptic events (Paré et al., 1998; Destexhe and Paré, 1999).It is also known that dendritic attenuation of synaptic potentials and currents depends on themembrane conductance. Therefore the change in the conductance imposes strict conditions on theconvergence or coincidence of many synaptic inputs required for the cell discharge. As a net effect,different levels of spontaneous activity might be a powerful mechanism affecting the susceptibilityof the network to incoming stimuli (Hô and Destexhe, 2000).
One should also take into account that background activity can be decomposed into twocomponents: a) tonically active conductance of the neuronal membrane and b) voltage fluctuationsof the neuronal membrane. It is exactly the tonically active membrane conductance that is related tothe aforementioned changes in cell responsiveness as a function of spontaneous synaptic events.Furthermore, the responsiveness of neurons can be enhanced in the presence of voltage fluctuationsas was shown in the experiments with modeling of the neuronal activity (Hô and Destexhe, 2000).A remarkable feature of this enhancement is that it was found for a level of background activitysimilar to the background activity recorded in vivo. This suggests that spontaneous oscillationsmight represent conditions close to optimal for enhancing the responsiveness of the neurons, thusfacilitating information transmission. Similar results were obtained for the somatosensory system ofrats (dorsal column nuclei), where the effectiveness of signal transmission was demonstrated to bedependent on pre-stimulus oscillatory activity (Nuñez et al., 2000). Taken together, these recentstudies imply a functional importance of spontaneous oscillations. The issue of pre-stimulusoscillatory activity and the characteristics of the sensory processing in human cortical activity wereaddressed in study II of the present thesis.
Brain oscillations in humans are often defined in terms of the frequency content andreactivity. The rhythms relevant for the present study are: occipital alpha and central mu rhythm(8–13 Hz) and central beta rhythm (~ 20 Hz). Terminologically speaking, one may refer to mu andbeta rhythms as 10-Hz and 20-Hz oscillations, respectively. In some cases both frequencies areregarded as the two components of mu rhythm (Hari and Salmelin, 1997). Unless mentionedotherwise, mu rhythm refers to 10-Hz oscillations in the present thesis.
All studies were performed with subjects being wakeful. However, the aforementionedbrain rhythms may also be present during some sleep stages (Yamada and Kooi, 1975; Duntley etal., 2001).
Alpha rhythm
Alpha rhythm is a prominent 8–13 Hz activity, which is visible in MEG and EEGrecordings above parietal and occipital regions of the head. This rhythm shows strong amplitudemodulation in the eyes open vs. eyes closed condition, being stronger in the latter. We used this
9
feature of the alpha oscillations in study IV as an approach allowing us to study dynamics of alphaactivity with quantitatively different levels of its mean amplitude.
The sources of alpha rhythm have been reported to be located in the calcarine fissure, theparieto-occipital sulcus and the surrounding occipital and parieto-occipital areas (Chapman et al.,1984; Williamson and Kaufman, 1989; Salmelin and Hari, 1994a). Lopes da Silva et al. (1973)showed in animal experiments a high coherence between the cortical alpha rhythm and alpharhythm in the lateral geniculate body, thus suggesting the importance of the thalamo-corticalconnections for the generation of this activity. Alpha oscillations are known also to propagateacross the cortex (Lopes da Silva et al., 1980).
Alpha oscillations are most clearly affected by changes in the visual environment. Vanni etal. (1997) demonstrated with MEG that the amplitude of alpha rhythm is inversely related tosaliency or familiarity of the presented visually objects. An increase of alpha rhythm amplitude wasshown in the occipital areas, which are related to the ignoring of visual information (Worden et al.,2000).
Although alpha rhythm is most directly related to visual processing, its reactivity withrespect to different cognitive tasks is well recognized (Ray and Cole, 1985). Klimesch et al. (1999)in EEG experiments demonstrated an increase in the amplitude of alpha rhythm only for its upperfrequency range (10–12 Hz) during mental activity, but not for the 8–10 Hz oscillations. Aninteresting positive correlation was reported in combined positron emission tomography (PET) andEEG measurements between the power of alpha activity and the regional cerebral blood flow inamygdala and hypothalamus, thus possibly reflecting a link between emotional states and alphaoscillations (Sadato et al., 1998).
The dynamic of alpha rhythm is also affected by sleep-wakefulness cycles. It was suggestedthat the enhancement of theta/low-frequency alpha activity in the waking electroencephalogram inthe short sleepers may be the result of long-term adaptation to chronically short sleep (Aeschbachet al., 2001).
Mu and beta rhythms
The features of EEG mu rhythm were originally described by Gastaut (1952). It iscomposed of 10- and 20- Hz components that are frequently phase-locked, creating the well-known"comb-like" pattern. In EEG recordings, mu and beta rhythms have maximum amplitude above thecentral head regions, corresponding approximately to C3 and C4 locations according to theinternational 10–20 system (Pfurtscheller, 1986). MEG studies show that the mu rhythm isgenerated near the primary somatosensory cortex in the vicinity of N20m sources and the betarhythm is generated more anteriorly, presumably in the motor cortex (Tiihonen et al., 1989;Salmelin and Hari, 1994b). Electrocorticographic recordings have revealed sources of mu and betarhythms in both pre- and postcentral gyrus (Arroyo et al., 1993; Crone et al., 1998).
Electroencephalographic experiments in humans revealed lack of mu-rhythm coherencebetween the right and left hemispheres, thus probably indicating at least partially independentsources (Leeuwen et al., 1978). The phase synchrony between the beta rhythms in the twohemispheres is addressed in study V. The issue of interhemispheric phase-locking may beimportant for the understanding of the mechanisms responsible for the organization of bilaterallydistributed brain functions.
The mu rhythm is a prominent feature of both the wake and sleep humanelectroencephalogram. However, during the sleep it occurs only during the rapid eye movementstage (Duntley et al., 2001).
The reactivity of mu and beta rhythms is for the most part related to sensorimotor tasks. Themu rhythm has been shown to be suppressed after somatosensory stimulation, the attenuation being
10
stronger in the contralateral than in the ipsilateral hemisphere (Gastaut, 1952; Pfurtscheller, 1989).More recent MEG experiments (Salenius et al., 1997b) have revealed stronger contralateralattenuation of the 20-Hz rhythm after the median nerve stimulation, but bilaterally equalattenuation of the 10-Hz rhythm. The reactivity of mu rhythm to somatosensory stimulation isinvestigated in study I. An initial decrease in the amplitude of mu and beta rhythms aftersomatosensory stimulation is followed by their increase, which occurs 100–300 ms earlier for betathan for mu rhythm (Salenius et al., 1997b). An attenuation of mu and beta rhythms during thepreparation and execution of movement (e.g. thumb twitch, index finger abduction) has been shownin both EEG and MEG studies (Derambure et al., 1993; Salmelin and Hari, 1994b; Leocani et al.,1997; Crone et al., 1998). The post-movement period is characterized by an increase in amplitudeof both mu and beta rhythms (Salmelin and Hari, 1994b; Pfurtscheller et al., 1998; Taniguchi et al.,2000). Both rhythms are also modulated by visual perception (Vanni et al., 1999).
A coherence was observed recently between the electroencephalographic beta rhythm andmuscle activity during maintained voluntary contractions (Conway et al., 1995; Salenius et al.,1997a; Mima and Hallett, 1999), suggesting involvement of cortical neurons in the generation ofmotor-unit synchronization.
Self-Organized Criticality
The traditional way to model the complexity of EEG and MEG activity is to treat theseoscillations on the basis of low-dimensional chaotic systems (Babloyantz and Destexhe, 1986).Using this framework, the EEG complexity is usually indexed by the correlation dimensions(Grassberger and Procaccia, 1983). The results of this approach in general indicate that EEG doesnot represent low-dimensional chaos (Pritchard and Duke, 1995; Paluš, 1996; Cerf et al., 1997;Stam et al., 1999), except in rare and very transient segments of the signals (~ 1–10 s).
An alternative framework for conceptualizing apparently complex systems and foranalyzing their dynamics is the theory of self-organized criticality (SOC; Bak et al., 1987, 1988),which we applied in study IV for the analysis of spontaneous oscillations in 10- and 20-Hzfrequency ranges. In physics, a critical point is reached when a set of parameter values is chosen sothat a system balances at the state of a phase transition. Self-organized critical phenomena, incontrast, emerge naturally in nonlinear multi-unit systems, which reach a critical state unavoidablybecause of their intrinsic dynamics, i.e., without external tuning. Once a complex system hasevolved to the critical state, several parameters that characterize the system’s spatio-temporalbehaviour obey a power-law distribution. This indicates that there is no characteristic scale for theunderlying process. Systems evolve by themselves and the interactions between local elements of agiven system keep the dynamics in the critical state. This intrinsic dynamic is the basis for themanifestation of long-range correlations, which can be revealed using scaling analysis (Peng et al.,1994; Bak, 1997).
A sand-pile model is considered to be the archetype of a self-organized critical system (Bak,1997). Sand is slowly dropped onto a surface, forming a pile. As the pile grows, avalanches ofdifferent sizes occur. The frequency-area distribution of this system was found to satisfy a power-law distribution, showing no typical size of the avalanches. Power-law scaling behaviour has beenrevealed for complex systems such as forest fires (Malamud et al., 1998), earthquakes (Bak 1997),financial markets (Mantegna and Stanley, 1995), and heartbeats (Peng et al., 1995).
Some authors have hypothesized that the principle of SOC would be beneficial for the brainmechanisms to process information optimally (Stassinopoulos and Bak, 1995). They argue that thesystem at a critical state has a very high susceptibility, allowing even very small inputs (e.g.,sensory stimuli) to propagate through the entire system, changing its behaviour radically.
11
Synchrony in the brain
Activity in the brain is characterized by the synchronous activation of many neurons. This istrue both for the neurons belonging to a local network and for those located in areas remote fromeach other (long-range synchrony). The use of MEG and EEG techniques allows one to study onlythe long-range synchrony, because of the spatial resolution of these methods. Long-rangesynchrony on the level of the cortex can be created by subcortical structures, e.g., mesencephalicreticular formation (Munk et al., 1996) or mediated by cortico-cortical connections (Engel et al.,1991; Singer 1999). Recently, the idea of synchronized activity was advocated as being importantfor the facilitation of information transmission between the neuronal networks (Hô and Destexhe,2000). In a model, these authors demonstrated that coinciding (synchronized) activity of manyneurons is needed for reliable detectability of the events in a target cell on the basis of spatialaveraging, which is an alternative to the averaging of events in time.
Originally, the synchronization of neuronal activity was proposed as a way to solve thebinding problem, i.e., the integration of many simultaneous processes (Singer, 1999). Synchronizedactivity is linked to the required operation and only those activities evoked by common tasks arebound together in a dynamically formed ensemble. Spontaneous synchrony in turn is thought torepresent a relatedness or preparation of a given coupled neuronal population for a further jointinvolvement in a particular task (Singer, 1999; Fries et al., 2001). Although the binding hypothesisis popular among neuroscientists, some data appear to be controversial to this point of view. Themain argument of these researchers was a demonstration of the cortical oscillations which were notrelated to the stimulus parameters and psychophysical measures of the animals' performance(Young et al., 1992; Bair et al., 1994).
Proposed originally for sensory processing, the importance of synchrony has been alsodemonstrated for sensorimotor coordination (Roelfsema et al., 1997). In this study, the authors haveshown an increase of synchrony between the neuronal action potentials in sensory and motor areasof cat brain during the preparation and execution of a task. Another example of synchrony in themotor system is a demonstration of coupling between electroencephalographic 20-Hz oscillationsin the human motor cortices and the muscle activity (Conway et al., 1995; Mima and Hallett, 1999).
Human EEG and MEG studies demonstrated recently a variety of findings related to long-range synchrony (Varela et al., 2001). In EEG experiments related to face perception, Rodriguez etal. (1999) showed synchronization between occipital, parietal and frontal areas when subjects wereable to identify a face pattern in ambiguous visual stimuli. Another study demonstrated anincreased inter- and intrahemispheric coherence of EEG signals in the case of conscious perceptionof a visual stimulus in a binocular rivalry task (Srinivasan et al., 1999). Using EEG technique,Miltner et al. (1999) have shown an increased coherence between the visual and parietal corticalareas in a paradigm based on visuotactile association. One should mention, however, that studiesrelated to the synchronization issue are for the most part based on correlative approaches. Animportant part here would be a demonstration of brain mechanisms that are not only correlated withsynchronization patterns but are critically dependent on them.
Somatosensory system and primary motor cortex
Receptors and spinal cord
The processing of stimuli in the somatosensory system starts from the receptor level. Theparceling of the information begins already on this level, where different modalities are representedby different receptors. Basically, four modalities constitute the whole spectrum of sensations in thesomatosensory system: mechanoreception (sense of touch), thermoception, nociception, and
12
proprioception (Gardner et al., 2000). Mechanoreception is based on the slowly adapting Merkeldisks and Ruffini corpuscles, and the rapidly adapting Meissner and Pacianin corpuscles.Thermoception and nociception are represented by bare nerve endings. Proprioception isrepresented by the ruffini-like and pacianiform-like endings, bare nerve endings, and Golgiendings. Each of these receptor types belongs to a dendrite of a neuron, whose soma is locatedeither in the dorsal root ganglion or in the trigeminal ganglion. Medium and large diameter axonsthat carry tactile and proprioceptive information enter the dorsal column and either terminate inlayers IIb and III or turn to ascend in the gracial and cuneate fasciculi to the medulla. Thisascending pathway is located in the dorsal column. The dorsal-column part of the somatosensorysystem conveys tactile and proprioceptive information. Small-diameter fibers that carry informationabout temperature and pain terminate in layers I, IIa, V, VI, and X of the spinal cord. Axons fromthese layers give rise to the anterolateral pathway, which conveys information about thermal andnociceptive stimuli.
Brain stem and thalamus
The dorsal column pathway consists of axons that terminate in the gracile (information fromthe lower parts of the body) and cuneate (information from the upper parts of the body) nuclei inthe caudal medulla. These nuclei give rise to axons that decussate and go to the ventroposterolateralnucleus (VPL) of the dorsal thalamus. VPL contains modality-specific neurons with small receptivefields (Somjen, 1972). Neurons of the anterolateral system project to reticular formation, superiorcolliculus, periaqueductal gray region, and to the dorsal thalamus (Somjen, 1972). Neurons of thesestructures have wide receptive fields and can respond to stimulation of the different modalities(Whitlock and Perl, 1959).
Somatosensory afferentation from head largely belongs to the trigeminal nerve system andreaches ventroposterormedial nucleus (VPM) of the thalamus. The representation of somatosensoryfeatures in the trigeminal system may arise from the interactions of neurons within and between theprimary somatosensory cortex and VPM nucleus, so that multiple coding strategies may be usedsimultaneously to represent the location of tactile stimuli (Ghazanfar et al., 2000).
Primary somatosensory cortex (SI)
SI includes Brodman areas 3a, 3b, 1 and 2 and has a clear somatotopic organization,representing contralateral parts of the body (Kaas, 1991).
The majority of projections to SI arise from the ipsilateral VPL and VPM nuclei of thethalamus. Thalamic projections have higher density in areas 3a and 3b than in the areas 1 and 2(Jones and Powell, 1970; Jones, 1975). The thalamocortical fibers terminate mainly on the neuronsof layers IIIb and IV (Jones, 1975; Shanks and Powell, 1981). Groups of thalamo-cortical fiberswith similar properties of place and modality terminate in patches of 400–500 µm (Mountcastle,1998). Each fiber divides to form a bundle of terminal axon segments and synaptic buttons thatdistribute throughout its particular patch (Jones, 1995). Divergence and convergence occur in SI forcoding of place but not of modality (Alloway and Burton, 1991; Mountcastle 1998).
Neurons in areas 3b and 1 mainly respond to cutaneous stimulation; areas 3a and 2predominantly respond to deep stimuli, both cutaneous and proprioceptive (Somjen, 1972). Itseems that area 1 is the only one primarily responsible for the analysis of moving stimuli (Bodegardet al., 2000). Area 3b has the largest cortical surface related to digit representation (Sur et al., 1980)and cells with the smallest receptive fields (Paul et al., 1972).
Areas 1, 2, and 3 are tightly interconnected. Area 3b sends fibers to area 1 and to a smallerextent to area 2 (Vogt and Pandya, 1978; Shanks et al., 1985). An ablation of area 3b abolishes the
13
cutaneous response in area 1, suggesting that information is processed in sequence from area 3b toarea 1 (Garraghty et al., 1990). Area 1 in turn sends fibers to area 2. Area 3a projects to areas 1 and2 (Jones et al., 1978). Interconnections between these areas suggest an increase in the number ofneuronal networks involved in the processing of somatosensory information as time goes by afterthe stimulus presentation. This in turn implies that the later stages of somatosensory processingmight be in statistical sense more susceptible to the changes in the internal state of these networks.
The area SI is primarily responsible for the sensory coding of somatosensory stimuli.Almost any damage within this area produces severe deficits that are related to the discriminationof topical, amplitude and texture-like features of the somatosensory stimuli (Gardner and Kandel,2000). Stimulation of this area evokes sensations similar to numbness and tingling (Penfield andJasper, 1954). These sensations were dependent on the site of the stimulation, revealingsomatotopic organization of the somatosensory cortex. Being somatotopically organized, SI areacan undergo significant plastic changes, e.g., in case of amputation (Ramachandran, 1998).Surprisingly, however, these changes do not have an effect on the conscious perception ofstimulation of neighboring undamaged nerves (Moore and Schady, 2000). Recently it was shownalso that not only the somatotopical organization of SI matters when deciding about the spatiallocation of the stimuli, but also the temporal structure of the neuronal response is of a greatimportance (Panzeri et al., 2001).
SI areas of the two hemispheres are interconnected via the corpus callosum showing bothmatched and mismatched projections for similar body parts (Zhang and Deschenes, 1997;Krubitzer et al., 1998). It was reported also that a complete callosotomy might abolish anyresponses to tactile stimulation in the ipsilateral somatosensory cortex (Fabri et al., 1999). Theseresults are important for the interpretation of the results related to bilateral activation of bothhemispheres after the unilateral somatosensory stimulation (study I).
As a trend in the current neurophysiological studies of sensory systems, evidence hasaccumulated about the unimodal sensory areas being involved in the processing of more than onemodality. The somatosensory system is not an exception. Results indicate that SI neurons can beinvolved in the retaining of visual information that has been associated with the touch of an object(Zhou and Fuster, 2000). The presence of such cells suggests that nontactile stimuli, associatedwith touch, have access to cortical neuronal networks engaged in the haptic sense.
Secondary somatosensory cortex (SII)
SII is located within and along the upper bank of the Sylvian fissure. Animal experimentshave shown that neurons in SII have large, often bilateral, poorly demarcated and extensivelyoverlapping receptive fields (Whitsel et al., 1969).
Thalamic inputs to SII originate mostly from VPL projections (Jones and Powel, 1970). SIIalso has reciprocal intra-hemispheric connections with areas 1, 2 and 3b of SI (Jones et al., 1979).In addition to the fibers from SI cortex, the neurons of SII cortex receive input from thecontralateral SII cortex (Burton and Robinson, 1987). Serial processing after the somatosensorystimulation in humans was suggested in electro- and magnetoencephalographic experimentsshowing initial activation of SI, with the following activation of SII (Allison et al., 1989b; Forss etal., 1994a; Wikström et al., 1996).
Recent MEG experiments showed that there could be parallel processing of somatosensoryinformation in the human contralateral SI and ipsilateral SII cortices (Forss et al., 1999). Theseresults are at variance with the data showing that ipsilateral SII activation is rather mediated via thecorpus callosum (Fabri et al., 1999).
SII area is generally believed to be responsible for the processing of somatosensoryinformation that is more complex than just a mere coding of stimuli. It was shown that lesions ofSII seriously affect learning of manual skills (Ridley and Ettlinger, 1976).
14
Magnetoencephalographic study of SII area revealed an important role of this area in theintegration of sensory information into motor programs (Huttunen et al., 1996) and for processeswhere attention is required (Steinmetz et al., 2000). SII area is also a strong candidate for theprocessing of nociceptive information (Valeriani et al., 2000).
Posterior Parietal Cortex (PPC)
PPC also receives quite a substantial amount of somatosensory information. The mostextensively studied parts of the PPC are Brodmann's areas 5 and 7. Area 7 receives somatosensoryprojections mainly from the areas SI and SII. An important finding is that the neurons in this areacan be activated both by cutaneous, kinaesthetic and visual stimuli (Hyvärinen and Poranen, 1974),thus revealing truly multimodal nature of this area. A visuotactile interaction was shown also in astudy where tactile stimulation enhanced activity in the visual cortex, most likely via the back-projections from multimodal parietal areas (Macaluso et al., 2000). Neurons in PPC often requirevery complex pattern of stimulation. Sakata et al. (1973) showed that neurons in area 5 mightrespond only when there is an activation of several joints and sometimes even bilateral stimulationis required. Activation of posterior parietal cortex in humans in response to simple somatosensorystimulation was suggested in MEG studies (Forss et al., 1994a).
Others areas related to somatosensory processing
Richer et al. (1993) found that stimulation of the posterior cingulate gyrus in humans leadsto contralateral tactile sensations, whereas ipsilateral sensations were evoked by stimulation in thevicinity of the cingulate sulcus. PET experiments demonstrated that temperature sensationsactivated the insular cortex (Craig et al., 2000). Hemodynamic studies (PET and functionalmagnetic resonance imaging experiments in humans) revealed also activation of the supplementarymotor area by somatosensory stimuli (Fox et al., 1987; Korvenoja et al., 1999). Cerebellar cortexwas proposed to have an inhibitory effect on the SI responses in cats (Kolodziejak et al., 2000).
Primary motor cortex (MI)
MI corresponds to Brodmann's area 4, being located in the precentral gyrus. This areacontains large efferent pyramidal neurons (Betz cells) from which the corticospinal projectionsoriginate. Similar to primary somatosensory cortex, MI is topographically organized with specificregions representing each part of the body on the contralateral side. However, myotopy in MI holdsonly for the large body divisions, such as the leg, face, and arm. When assembled into acomprehensive map, sites for any particular body part appear widely distributed, multiple, andoverlapping (Donoghue et al., 1992; Nudo et al., 1992). In humans area 4 was subdivided into areas'4 anterior' and '4 posterior' on the basis of cytoarchitecture and quantitative distributions oftransmitter-binding sites (Geyer et al., 1996). Moreover, the topography may be changed,demonstrating remarkable plasticity. Transection of a given motor nerve can lead to a substitutionof a corresponding area in MI by the representation of adjacent body parts (Donoghue et al., 1990).Although MI is characterized by the predominant representation of the contralateral parts of thebody, imaging studies often reveal a bilateral activation of MI cortices during the preparation andexecution of unilateral movements (Cramer et al., 1999; Kinoshita et al., 2000). Simultaneousactivation of the two MI areas might reflect tight functional coupling of these areas. This couplingin turn was shown to be beneficial for the organization of highly skilled bilateral movements(Andres et al., 1999). The probable consequences of this bilateral activation are also discussed instudy V.
15
There is also a tight relationship between somatosensory processing and movementorganization. Rosén and Asanuma (1972) discovered in monkeys that information generated insensory receptors (in muscles, skin, and joints) during movement are sent back to the same neuronsin the motor cortex that generated the movement. Neurons in the area MI are primarily responsible for controlling movement kinematics anddynamics. Evarts (1968) demonstrated that MI pyramidal tract neurons change their dischargefrequency according to the force exerted. Activity of MI neurons is also correlated with thedirection and the velocity of the movement, and also with the position of the joints (Thach, 1978;Ashe et al., 1994).
Somatosensory evoked responses
Different types of electric and mechanical somatosensory stimuli can be used to evokecerebral responses in human subjects. Electric stimuli are most commonly used for the stimulationof the major nerve trunks (e.g., median, tibial, peroneal nerves). Electric stimulation directlyactivates nerve fibers evoking a synchronous afferent volley, which produces well-defined andeasily recordable responses in the cortex. The disadvantage of electrical stimulation is unspecificstimulation of afferent fibers that are related to different somatosensory modalities. Alternatives toelectric stimulation include air-puffs or mechanical vibrations (Forss et al., 1994b; Jousmäki andHari, 1999).
When applying electric stimulation, it is preferable to have current-output stimulators, sincethe strength of the current will not be affected by changes in the impedance.
Somatosensory evoked potentials (SEP)
The sensitivity of EEG recordings to both tangential and radial sources as well as relativelylow spatial resolution can make interpretations of the SEP components difficult and ambiguous.However, matching of EEG responses with intracortical and MEG recordings allows one to clarifySEP component genesis.
Because of the complex anatomy of the somatosensory cortical networks, it is quite clearthat somatosensory stimuli should evoke multiple sources in the cortex. In recent years, thegeneration of the cortical short-latency responses (< 40 ms) have been clarified. The currentgenerator of N20/P20 (parietal/frontal) to upper extremity stimulation most likely arises at thepostcentral bank of the central sulcus, corresponding to area 3b (Broughton et al., 1981; Allison etal., 1989a). There is also evidence suggesting that the P22 component is generated in the crown ofthe postcentral gyrus in area 1 (Allison et al., 1991). However, location of N30 generators remainsunclear. Some authors have suggested that the potential distribution of this component implies thepresence of radially oriented components in the precentral gyrus (Papakostopoulus and Crow,1980; Desmedt and Cheron, 1981). Another explanation for the N30 component is related to theexistence of a tangential source in area 3b (Broughton et al., 1981; Allison et al., 1989a). A recentsource modeling study provides evidence for a pre-central N30 generator, predominantlytangentially oriented and located within the motor cortex (Waberski et al., 1999).
P27 has a maximum of its potential distribution above the contralateral parietal area(Desmedt and Cheron, 1980; Yamada et al., 1984; Deiber et al., 1986). In fact, some authors referto this peak as P25 because of its latency being often around 25 ms (Abbruzzese et al., 1990;Gandevia and Ammon, 1992; Ugawa et al., 1996). This peak is most likely generated in thepostcentral cortex, possibly in area 1 (Allison et al., 1991). Area 1 is largely situated on the surfaceof the postcentral gyrus. Superficial location makes neurons in this area especially susceptible to
16
transcranial magnetic stimulation. This observation is especially relevant for the interpretation ofthe modulation of P27(P25) amplitude by TMS pulses (study III).
The interpretation of the generation of the long-latency (>40 ms) components is somewhatproblematic, as 1) the potentials of these components show considerable interindividual variation(Goff et al., 1977; Desmedt and Tomberg, 1989; Srisa-an et al., 1996) and 2) the amplitude andlatency of these components are very susceptible to experimental conditions. EEG dipole fittingsuggests that N60 is located in the posterior bank of the central sulcus contralateral to thestimulated hand (Srisa-an et al., 1996). However, a somatotopic organization for N60 has not beenrevealed (Karhu et al., 1992; Srisa-an et al., 1996).
Proprioceptive stimulation of human upper limb evokes a double positive peak atcontralateral central locations (P70, P190) and a single negative frontal N70 component (Arnfred etal., 2000). Very late SEP components with latencies of about 300 ms (P300) are most likely relatedto the conscious detection of stimuli (Hashimoto et al., 2000).
Fast EEG oscillations (~ 600 Hz) were found as being superimposed on the N20 component(Curio, 2000). Sources of these oscillations were located both in the thalamus and primarysomatosensory cortex (Gobbelé et al., 1998).
SEPs are widely used in the clinic. SEP abnormalities, reflecting pathology in the brain orspinal cord, are present in up to 90% of patients with definite multiple sclerosis (Chiappa, 1990).SEPs are useful in classifying the type of origin of myoclonus (Hallet et al., 1979). IntraoperativeSEPs are recorded routinely using electrode strips or grids of electrodes applied directly to theexposed cortex during neurosurgical procedures in and around the somatosensory cortex (Kraft etal., 1998). The N20 response is used to identify the primary somatosensory cortex in the postcentralgyrus. By inference, the motor cortex in the precentral gyrus can be localized as well, and thisinformation is used to guide the surgical procedure.
Somatosensory evoked fields (SEF)
The study of somatosensory evoked fields began with the work of Brenner et al. (1978) onthe steady-state somatosensory responses. This work was followed by many other SEF studies(Hari et al., 1984, Huttunen et al., 1987; Ishibashi et al., 2000). The SEF response after upper limbstimulation starts with deflection peaking at 20 ms (N20m). The N20m deflection has a dipolarfield pattern and the N20m dipole points anteriorly, being situated in SI cortex. This dipoleorientation corresponds to a tangential model with the source in area 3b (Allison et al., 1989a). Fast(600 Hz) MEG oscillations were shown to be superimposed on the N20m component (Curio et al.,1997). A corresponding source for these oscillations was located at the primary somatosensorycortex near the hand area.
The next deflection peaks at about 30–35 ms (P35m). The dipole of P35m also appeared tobe located in SI area and points posteriorly (Tiihonen et al., 1989).
P35m is followed by N45m and P60m components, also generated in area SI (Huttunen etal., 1987; Wikström et al., 1996). In the latter study, the authors suggested a scheme where P35m isgenerated by an early inhibitory response, N45m is produced by secondary EPSPs and P60mcomponent reflects late IPSPs in pyramidal neurons of area 3b. Though SEFs vary across subjectsin the 100-ms post-stimulus interval, there is remarkable similarity of SEFs within an individualbetween left and right hemispheres as well as across successive experimental sessions (Tecchio etal., 2000). SEFs are known to be somatotopically organized (Nakamura et al., 1998). Ishibashi et al.(2000) suggested also that somatotopic organization is more pronounced for N20m and P60m thanfor P35m.
Since both the mu rhythm and the aforementioned SEF components are generated in thearea SI, it is reasonable to assume that the mu rhythm and the processing of somatosensoryinformation may be interrelated. Therefore, we examined the relationship between the amplitude
17
and latency of the SEF components and the amplitude of the pre-stimulus mu rhythm (study II). Wealso investigated the influence of somatosensory stimulation on the dynamics of the spontaneousmu rhythm (study I).
Initial activation in SI area is followed by activity in SII and PPC. It has been shown thatarea SII is bilaterally activated after unilateral stimulation, with pronounced activity around 100 ms(Hari et al., 1984; 1993; Simões and Hari, 1999). However, an early activation of area SII (20–30ms) was also proposed recently on the basis of a MEG study, which used the signal-spaceprojection method (Karhu and Tesche, 1999).
When a train of stimuli is used, area SII produces a sustained field, while SI activationfollows stimuli with sharp transient responses up to 12 Hz, thus possibly suggesting weakerinhibitory processes in SII than in SI (Forss et al., 2001).
Activity in the posterior parietal cortex peaks at around 70–110 ms (Forss et al., 1994a).Hoshiyama et al. (1997) showed that PPC has some somatotopic organization in parallel with the'homunculus' in SI, with the hand area being much wider than the foot area.
Experimental techniques
Magneto- and Electroencephalography (MEG, EEG)
When a neuron is active, small currents flow in the intra- and extracellular space.Synchronous activation of many neurons can be measured as a difference of potentials between twopoints on the scalp (EEG). Alternatively, the magnetic field produced by the cellular currents canbe measured with SQUID sensors (Superconducting Quantum Interference Device; Hämäläinen etal., 1993). MEG and EEG detect mostly currents associated with dendritic excitatory and inhibitorypostsynaptic potentials (EPSP and IPSP, respectively; Lewine and Orrison, 1995). Postsynapticactivity from different types of neurons, however, has a very distinct impact on MEG and EEG.Stellate neurons have symmetric dendritic organization. When symmetrically activated, theseneurons would produce no potential variation or magnetic field at a distance. Pyramidal cells,however, have a very strong asymmetric dendritic tree, which consists of an apical dendrite and anumber of basilar dendrites. Activation of these neurons can cause a strong measurable EEG andMEG signal at a distance (Lewine and Orrison, 1995).
The unique feature of the MEG technique is the transparency of the skull, scalp and braintissue to the magnetic fields. An EEG signal, however, is strongly influenced by the head properties(like cerebrospinal fluid, skull and fontanelles, Hämäläinen et al., 1993).
Another difference between EEG and MEG is that the latter measures mostly primarycurrents oriented tangentially with respect to the surface of the head (e.g., sulcus dipoles)(Hämäläinen et al., 1993). EEG is sensitive both to radial and tangential sources.
Transcranial Magnetic Stimulation (TMS)
TMS can be used to activate neurons in different cortical regions. Magnetic pulses induce inthe brain electric currents, which lead to changes in the membrane potential (Barker et al., 1985).Both brain and peripheral nerves can be stimulated using rapidly changing magnetic fields of about2–3 Tesla. Two types of coils are used in TMS: circular and figure-of-eight coils. In circular coils,the current flow in the brain will be strongest under the circumference of the coil, being virtuallyabsent near the center of the coil. Figure-of-eight coils produce the maximal current at theintersection of the two wings, thus producing a more focal stimulation.
TMS induces currents in the brain, thus in principle evoking both depolarization andhyperpolarization of the neuronal membrane. The electric field in the brain should be about 100
18
mV/mm in order to produce a neuronal activation (Ilmoniemi et al., 1999). Both longitudinal andtransverse electric field components cause the activation of axons (Ruohonen et al., 1996). Anexcitation at bends of axons or at synaptic terminals are the most probable when stimulating thebrain (Roth, 1994). It was shown also that the corticospinal axons can be directly activated atdeep locations using anodal transcranial electrical stimulation (Suihko, 1998).
TMS is most widely used in studies of the motor cortex, especially the hand representationarea. Stimulation of distinct parts of motor cortex produces a response in a particular hand musclewith a latency of about 20 ms. Lateral-to-medial currents in the brain activate corticospinal neuronsboth directly and transsynaptically, while anterior-to-posterior currents activate these neuronspredominantly transsynaptically (Di Lazzaro et al., 1998).
Another interesting application of TMS is the possibility to produce so-called reversible"functional lesions" in the brain. For example, one may produce a transient scotoma whilestimulating the visual cortex (Amassian et al., 1989; Corthout et al., 1999; Kamitani and Shimojo,1999) or disrupt memory processes, especially when stimulating prefrontal and parietal cortices(Jahanshahi et al., 1998; Pascual-Leone et al., 1999; Kessels et al., 2000).
A promising application of TMS is its combination with different imaging techniques. TMShas been used simultaneously with EEG (Ilmoniemi et al., 1997), positron-emission tomography(Paus et al., 1997) and functional magnetic resonance imaging (Josephs et al., 1999), providinginformation on the reactivity and connectivity of the stimulated cortical areas.
TMS is also used in clinical practice. Single pulse TMS can be used to assess theexcitability thresholds of the motor cortex and the central conduction time of the corticospinalimpulses, in combination with the surface electromyography measurement. E.g., in amyotrophiclateral sclerosis central conduction time may be mildly delayed or desynchronized, which wasdemonstrated with TMS (Martínez and Trejo, 1999). Rapid-rate TMS was found to be useful intreatment of psychiatric disorders. Stimulation of dorsolateral prefrontal cortex has been shown tohave an antidepressant effect (George et al., 1995). Stimulation of left temporoparietal cortex leadsto a reduction of auditory hallucinations in schizophrenia patients (Hoffman et al., 2000).Stimulation of motor cortex has been reported to improve motor performance in Parkinson’sdisease (Pascual-Leone et al., 1994).
19
Aims of Study
The main emphasis in the present thesis is put on the understanding of spontaneous activity,particularly in the sensorimotor system. The goal was to explore these oscillations in a context ofperipheral stimulation, evoked responses and internal dynamics. Figure 1 shows schematicallyessential links related to the studied issues. The particular aims of the studies were:
To study the reactivity of spontaneous sensorimotor oscillations to the somatosensorystimulation; and to find a basis for high susceptibility of these oscillations to the stimuli (study Iand IV).
To analyze the influence of the spontaneous activity on the processing of somatosensoryinformation (study II and III).
To characterize the temporal and spatial (interhemispheric) structure of spontaneous activityin the sensorimotor system (study IV and V).
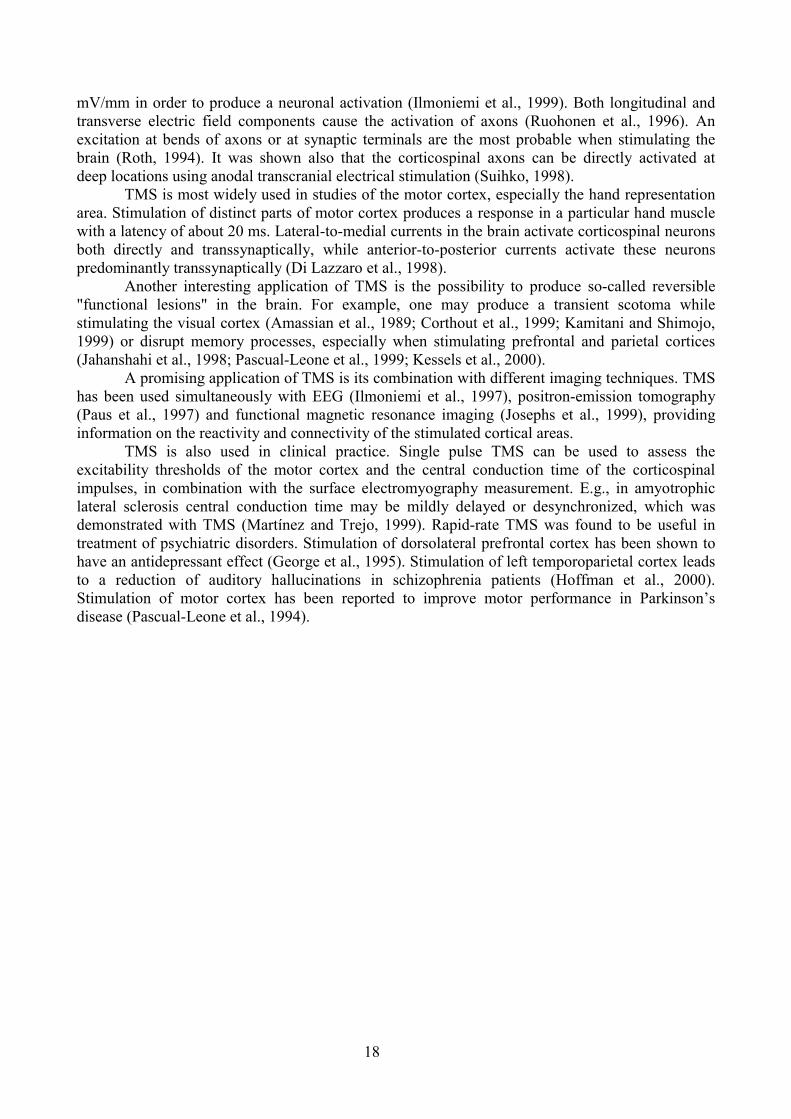
Figure 1. Conceptual scheme showing studied issues in the present thesis. The arrows indicate a linkbetween the elements of the scheme. The Roman numerals on the arrows correspond to a particular study.Central stimulation is defined as an event, which leads to the changes in the neuronal activity, but this eventis not related to the peripheral stimulation. Examples of the central stimulation might be TMS or mentaloperations. The reactivity of spontaneous oscillations was explored in studies I and IV; the relationshipbetween spontaneous activity and evoked responses was addressed in studies II and III; temporal and spatialdynamics of spontaneous oscillations were examined in study IV and V.
Central Stimulation
Peripheral Stimulation
Spontaneous Activity
Evoked Activity
III, IV
I, II, I
II, IV
I, II, III
IIIII, IIII
IV, V
20
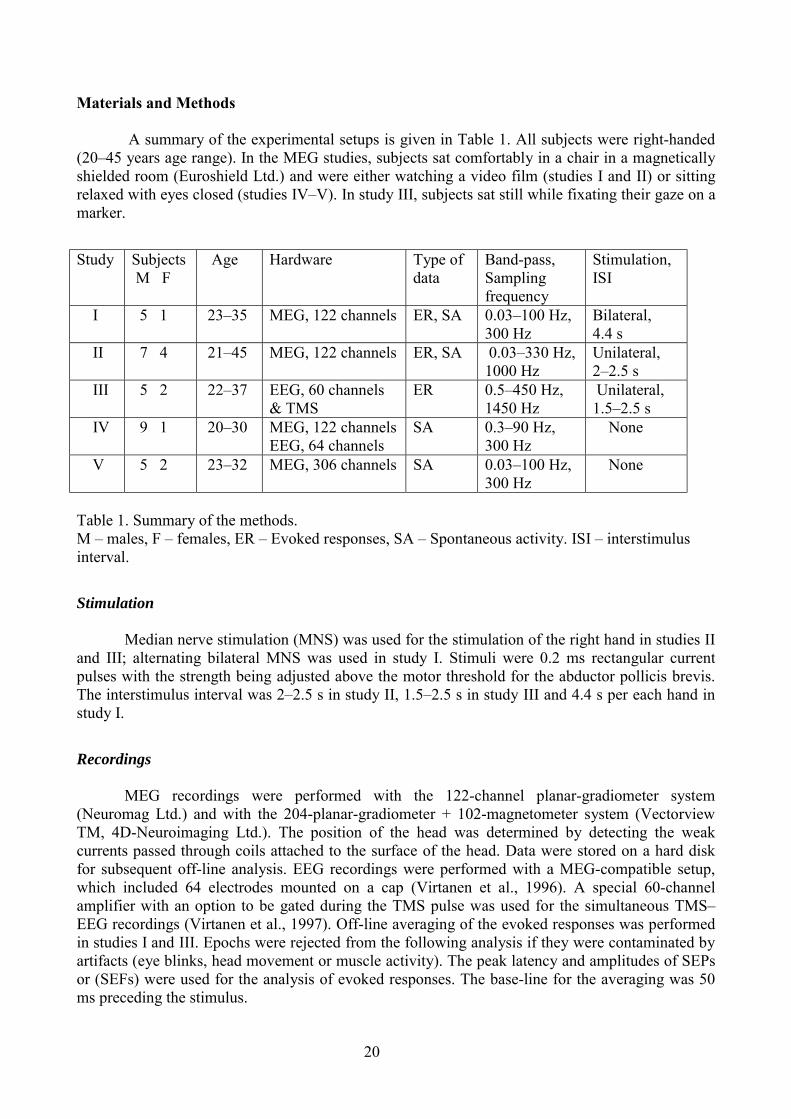
Materials and Methods
A summary of the experimental setups is given in Table 1. All subjects were right-handed(20–45 years age range). In the MEG studies, subjects sat comfortably in a chair in a magneticallyshielded room (Euroshield Ltd.) and were either watching a video film (studies I and II) or sittingrelaxed with eyes closed (studies IV–V). In study III, subjects sat still while fixating their gaze on amarker.
Study Subjects M F
Age Hardware Type ofdata
Band-pass,Samplingfrequency
Stimulation,ISI
I 5 1 23–35 MEG, 122 channels ER, SA 0.03–100 Hz,300 Hz
Bilateral,4.4 s
II 7 4 21–45 MEG, 122 channels ER, SA 0.03–330 Hz,1000 Hz
Unilateral,2–2.5 s
III 5 2 22–37 EEG, 60 channels& TMS
ER 0.5–450 Hz,1450 Hz
Unilateral,1.5–2.5 s
IV 9 1 20–30 MEG, 122 channelsEEG, 64 channels
SA 0.3–90 Hz,300 Hz
None
V 5 2 23–32 MEG, 306 channels SA 0.03–100 Hz,300 Hz
None
Table 1. Summary of the methods.M – males, F – females, ER – Evoked responses, SA – Spontaneous activity. ISI – interstimulusinterval.
Stimulation
Median nerve stimulation (MNS) was used for the stimulation of the right hand in studies IIand III; alternating bilateral MNS was used in study I. Stimuli were 0.2 ms rectangular currentpulses with the strength being adjusted above the motor threshold for the abductor pollicis brevis.The interstimulus interval was 2–2.5 s in study II, 1.5–2.5 s in study III and 4.4 s per each hand instudy I.
Recordings
MEG recordings were performed with the 122-channel planar-gradiometer system(Neuromag Ltd.) and with the 204-planar-gradiometer + 102-magnetometer system (VectorviewTM, 4D-Neuroimaging Ltd.). The position of the head was determined by detecting the weakcurrents passed through coils attached to the surface of the head. Data were stored on a hard diskfor subsequent off-line analysis. EEG recordings were performed with a MEG-compatible setup,which included 64 electrodes mounted on a cap (Virtanen et al., 1996). A special 60-channelamplifier with an option to be gated during the TMS pulse was used for the simultaneous TMS–EEG recordings (Virtanen et al., 1997). Off-line averaging of the evoked responses was performedin studies I and III. Epochs were rejected from the following analysis if they were contaminated byartifacts (eye blinks, head movement or muscle activity). The peak latency and amplitudes of SEPsor (SEFs) were used for the analysis of evoked responses. The base-line for the averaging was 50ms preceding the stimulus.
21
Data analysis
The outlines of data analysis are presented below:Study I. Event-related desynchronization was induced by the alternating stimulation of the left andright median nerves. Single-trial display and consecutive sub-averaging were utilized in order toreveal the dynamics of mu-rhythm suppression.
Study II. The amplitude of the pre-stimulus mu rhythm was evaluated in three pre-stimulus timeintervals (380, 480, and 980 ms). The pre-stimulus amplitudes of mu rhythm were sorted accordingto magnitude with 20-percentile steps, producing 5 groups of epochs in each subject.Somatosensory evoked fields were then averaged selectively according to these groups. These arereferred to as groups 1 (weak mu rhythm) to 5 (strong mu rhythm) in the following text.
Study III. TMS was applied to centro-parietal region either simultaneously with the MNS or 10 msafter it. Block-design was used in order to present MNS, TMS or MNS+TMS conditions. Animportant issue here was to differentiate between the responses which are obtained by concurrentTMS+MNS stimulation and the responses obtained via the arithmetical summation of TMSresponses and MNS responses (synthTMS+MNS). Special shamTMS condition was alsointroduced as an additional control for the acoustical stimulation, which is produced by the TMScoil discharge.
Study IV. Spectra, autocorrelation function, and DFA were used in order to reveal long-rangecorrelations. As reference data we used broadband environmental noise of the empty magnetically-shielded room and surrogate signals. The latter were obtained by first calculating the Fouriertransform of the original EEG recording, randomizing the Fourier phases, and then performing theinverse Fourier transform.
Study V. We calculated synchronization index for intra- and interhemispheric pairs of signals. Thisindex was evaluated for different levels of beta rhythm amplitude. The interhemispheric correlationof the oscillation amplitudes was calculated using the Pearson's coefficient.
A substantial part of the analysis was based on the application of wavelet transformation tothe raw data. Wavelet analysis decomposes a time series into time-frequency space (Torrence andCompo, 1998). One of the most common wavelets is the Morlet wavelet, which consists of a planewave modulated by a Gaussian. The modulus of the complex-output W(t,f) represents the amplitudeof the signal at time t and at frequency f. This approach therefore allows one to study amplitudedynamics of a particular rhythmic brain activity (e.g., alpha, mu, and beta rhythms).
On the basis of W(t,f), long-range correlations in MEG and EEG signal were calculated instudy IV using detrended fluctuation analysis (DFA, Peng et al., 1994, 1995). In DFA, the modulusof the wavelet-transformed signal at a center frequency f is first integrated over time to produce avector y of the cumulative sum of the signal amplitude around its average value, where N is thenumber of samples in the signal. The integrated signal is then divided into time windows of size τ.For each window, the least-squares fitted line (the local trend) is computed; the y-coordinate of thisline is denoted yτ(t). The integrated signal, y(t), is detrended by subtracting the local trend, yτ(t), ineach window. The average root-mean-square fluctuation, <F(τ)>, of this integrated and detrendedtime series is computed as:
[ ] )2()()(1)(1
2� =
−>=< N
ttyty
NF ττ
22
This procedure is repeated for all time window sizes. The scaling is often of a power-law form:
The scaling exponent α is extracted with linear regression in double-logarithmic coordinates usinga least-squares algorithm. A self-similarity parameter of α = 0.5 characterizes the ideal case of anuncorrelated signal, whereas 0.5 < α < 1.0 indicates power-law scaling behaviour and the presenceof temporal correlations over the range of τ.
In study V, phase information from the wavelet-transformed data was used in order tocalculate phase synchronization within one hemisphere and between the two hemispheres. Giventwo time series X and Y, with the corresponding wavelet transforms WX(t,f) and WY(t,f), the cross-wavelet spectrum is defined as WXY(t,f)= WX(t,f) WY
*(t,f), where WY*(t,f) is the complex conjugate of
WY(t,f). The phase θ between the two signals is defined then as the four-quadrant inverse tangent ofIm(WXY(t,f))/Re(WXY(t,f)), where Im and Re are the imaginary and real parts of WXY(t,f),respectively.
The synchronization index (S) is a measure of the strength of the synchrony between thetwo signals and is defined as:
where N is the total number of time samples and j is the imaginary unit. S varies between 0 and 1(Lachaux et al., 1999).
Statistical analysis was performed with Fisher’s test, ANOVA, non-parametric Friedman’sANOVA, and Wilcoxon matched-pairs test.
Results and Discussion
Study I. Suppression of mu rhythm by somatosensory stimulation
Results
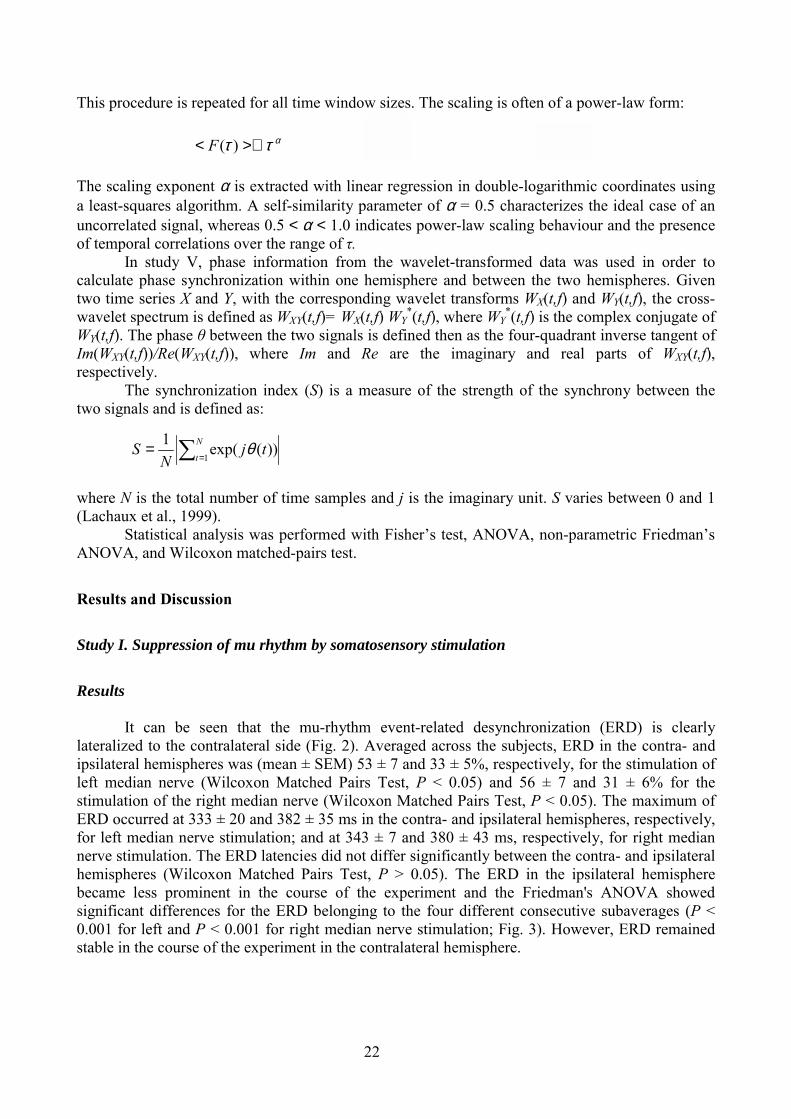
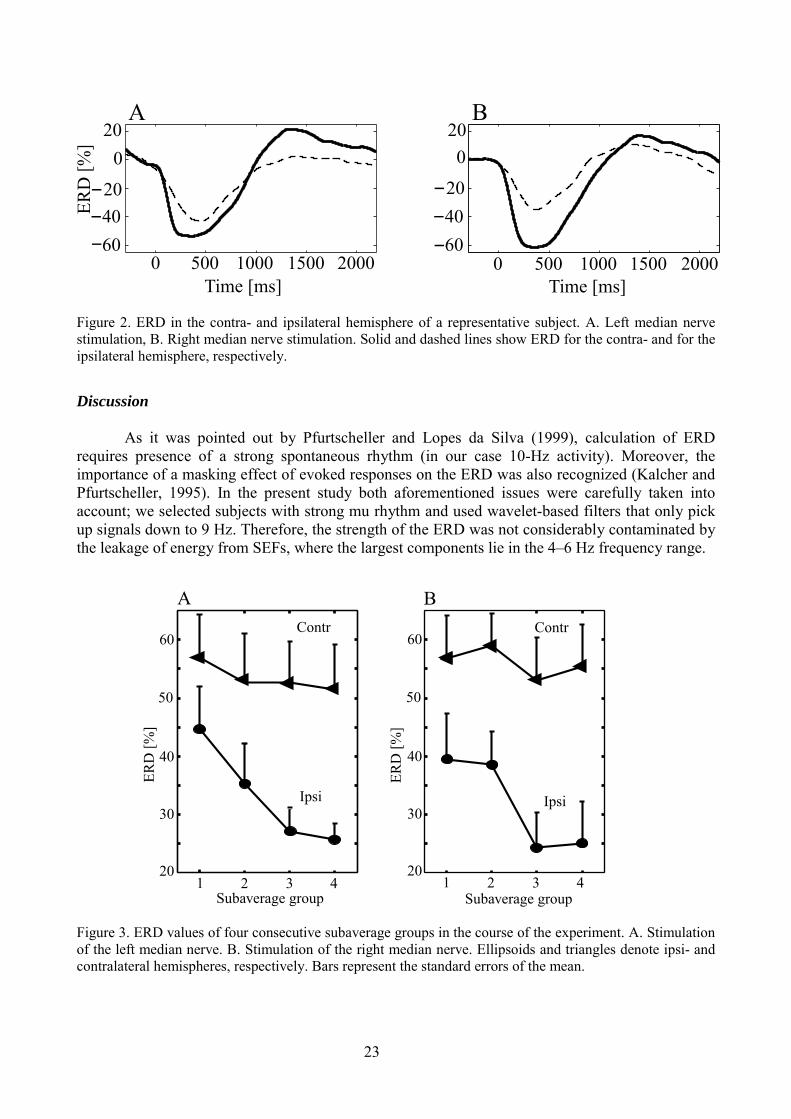
It can be seen that the mu-rhythm event-related desynchronization (ERD) is clearlylateralized to the contralateral side (Fig. 2). Averaged across the subjects, ERD in the contra- andipsilateral hemispheres was (mean ± SEM) 53 ± 7 and 33 ± 5%, respectively, for the stimulation ofleft median nerve (Wilcoxon Matched Pairs Test, P < 0.05) and 56 ± 7 and 31 ± 6% for thestimulation of the right median nerve (Wilcoxon Matched Pairs Test, P < 0.05). The maximum ofERD occurred at 333 ± 20 and 382 ± 35 ms in the contra- and ipsilateral hemispheres, respectively,for left median nerve stimulation; and at 343 ± 7 and 380 ± 43 ms, respectively, for right mediannerve stimulation. The ERD latencies did not differ significantly between the contra- and ipsilateralhemispheres (Wilcoxon Matched Pairs Test, P > 0.05). The ERD in the ipsilateral hemispherebecame less prominent in the course of the experiment and the Friedman's ANOVA showedsignificant differences for the ERD belonging to the four different consecutive subaverages (P <0.001 for left and P < 0.001 for right median nerve stimulation; Fig. 3). However, ERD remainedstable in the course of the experiment in the contralateral hemisphere.
)3()( αττ >∝< F
� == N
ttj
NS
1))(exp(1 θ
23
Figure 2. ERD in the contra- and ipsilateral hemisphere of a representative subject. A. Left median nervestimulation, B. Right median nerve stimulation. Solid and dashed lines show ERD for the contra- and for theipsilateral hemisphere, respectively.
Discussion
As it was pointed out by Pfurtscheller and Lopes da Silva (1999), calculation of ERDrequires presence of a strong spontaneous rhythm (in our case 10-Hz activity). Moreover, theimportance of a masking effect of evoked responses on the ERD was also recognized (Kalcher andPfurtscheller, 1995). In the present study both aforementioned issues were carefully taken intoaccount; we selected subjects with strong mu rhythm and used wavelet-based filters that only pickup signals down to 9 Hz. Therefore, the strength of the ERD was not considerably contaminated bythe leakage of energy from SEFs, where the largest components lie in the 4–6 Hz frequency range.
Figure 3. ERD values of four consecutive subaverage groups in the course of the experiment. A. Stimulationof the left median nerve. B. Stimulation of the right median nerve. Ellipsoids and triangles denote ipsi- andcontralateral hemispheres, respectively. Bars represent the standard errors of the mean.
0 500 1000 1500 2000604020
020
020
A B
0 500 1000 1500 2000
ERD
[%]
Time [ms] Time [ms]
--- 60
4020-
--
1 2 3 4 1 2 3 420
30
40
50
60
20
30
40
50
60
ERD
[%]
ERD
[%]
Subaverage group Subaverage group
A BContr Contr
Ipsi Ipsi
24
The contralateral predominance of mu-rhythm ERD to somatosensory stimulation agreeswith previous EEG study (Pfurtscheller, 1989), but differs from a recent MEG study, where nointer-hemispheric asymmetry in the level of 7–15 Hz rhythm suppression was shown (Salenius etal., 1997b). The differences between the results of the latter and the present study may be related tothe different parameters for band-pass filtering (7- and 9-Hz lower cut-off frequencies,respectively), which is critical in order to avoid the masking effect from SEFs.
ERD in the contra- and ipsilateral hemisphere behaved differently in the course of theexperiment. It was significantly attenuated towards the end of the experiment in the ipsi-, but not inthe contralateral hemisphere. It is interesting to note here that contralateral P35m and P60m SEFcomponents show an attenuation and N20m remains stable in the course of the experiment (seestudy II). This fact and the stability of the contralateral ERD suggest that ERD in the contralateralhemisphere is rather triggered by the initial thalamic afferent volley than by the subsequentsomatosensory processing.
Different behaviour of ERD in the two hemispheres may reflect a combination of specificand nonspecific activation during somatosensory stimulation. Nonspecific ERD can be related tothe so-called arousal activation, known to be most pronounced for the first repetitions of the stimuli(Graham, 1997; Siddle and Lipp, 1997). The specific ERD is more directly related to the arrival ofthe somatosensory afferent volley and therefore would be stronger in the contra- than in theipsilateral hemisphere. Therefore, both the strength and dynamics of the non-specific ERD shouldbe more visible in the ipsilateral hemisphere, where it is not masked largely by the specific ERD.
Study II. Pre-stimulus mu rhythm and somatosensory evoked fields
Results
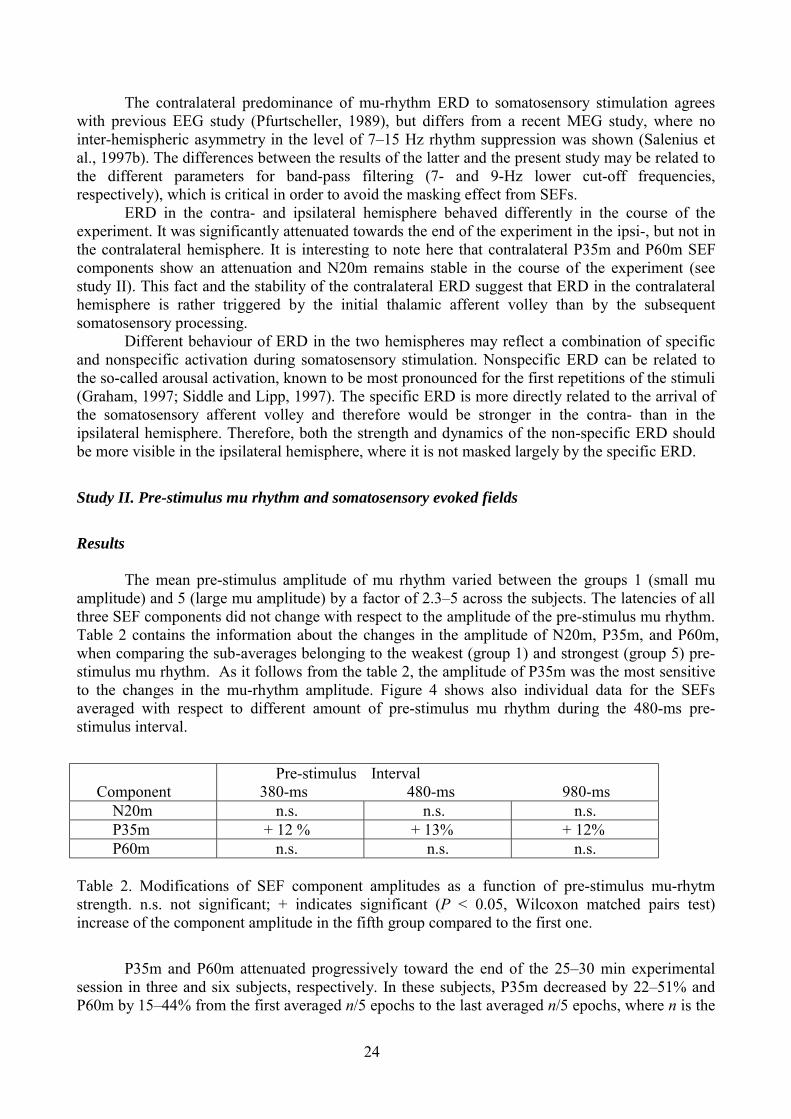
The mean pre-stimulus amplitude of mu rhythm varied between the groups 1 (small muamplitude) and 5 (large mu amplitude) by a factor of 2.3–5 across the subjects. The latencies of allthree SEF components did not change with respect to the amplitude of the pre-stimulus mu rhythm.Table 2 contains the information about the changes in the amplitude of N20m, P35m, and P60m,when comparing the sub-averages belonging to the weakest (group 1) and strongest (group 5) pre-stimulus mu rhythm. As it follows from the table 2, the amplitude of P35m was the most sensitiveto the changes in the mu-rhythm amplitude. Figure 4 shows also individual data for the SEFsaveraged with respect to different amount of pre-stimulus mu rhythm during the 480-ms pre-stimulus interval.
Component Pre-stimulus 380-ms
Interval 480-ms 980-ms
N20m n.s. n.s. n.s. P35m + 12 % + 13% + 12% P60m n.s. n.s. n.s.
Table 2. Modifications of SEF component amplitudes as a function of pre-stimulus mu-rhytmstrength. n.s. not significant; + indicates significant (P < 0.05, Wilcoxon matched pairs test)increase of the component amplitude in the fifth group compared to the first one.
P35m and P60m attenuated progressively toward the end of the 25–30 min experimentalsession in three and six subjects, respectively. In these subjects, P35m decreased by 22–51% andP60m by 15–44% from the first averaged n/5 epochs to the last averaged n/5 epochs, where n is the
25
total number of epochs. However, mu-rhythm amplitude did not show any systematic changes inthe course of the experiment.
Discussion
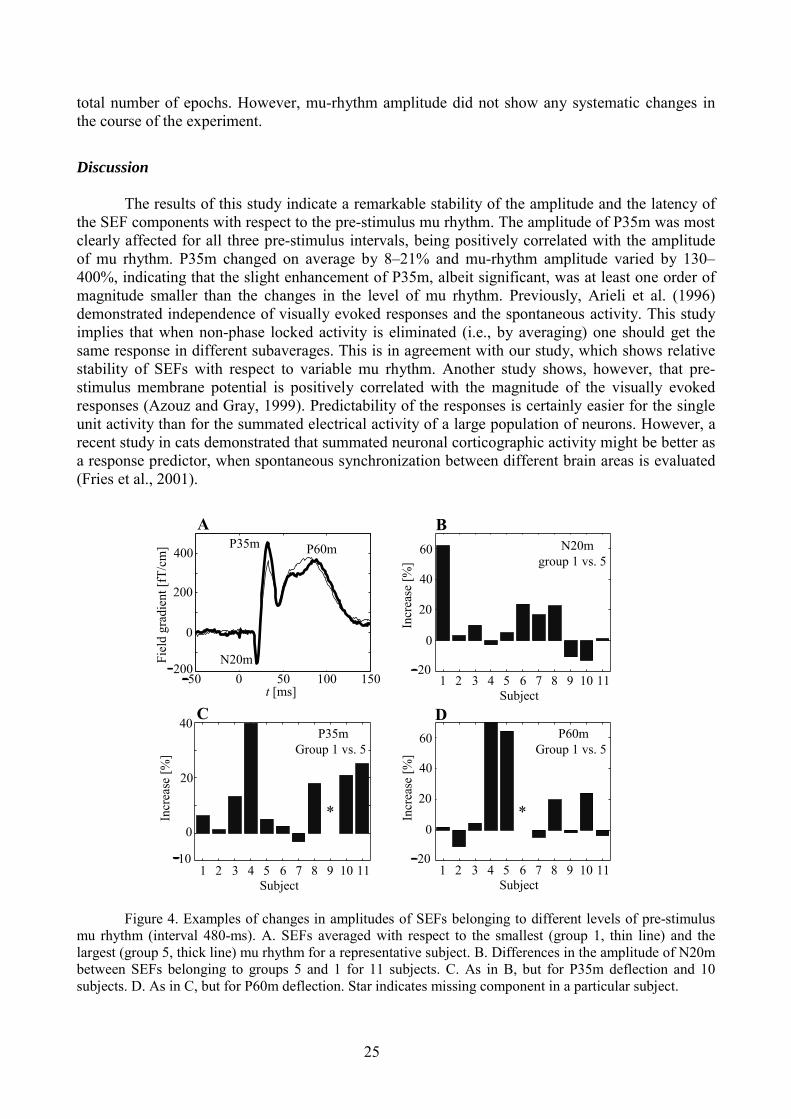
The results of this study indicate a remarkable stability of the amplitude and the latency ofthe SEF components with respect to the pre-stimulus mu rhythm. The amplitude of P35m was mostclearly affected for all three pre-stimulus intervals, being positively correlated with the amplitudeof mu rhythm. P35m changed on average by 8–21% and mu-rhythm amplitude varied by 130–400%, indicating that the slight enhancement of P35m, albeit significant, was at least one order ofmagnitude smaller than the changes in the level of mu rhythm. Previously, Arieli et al. (1996)demonstrated independence of visually evoked responses and the spontaneous activity. This studyimplies that when non-phase locked activity is eliminated (i.e., by averaging) one should get thesame response in different subaverages. This is in agreement with our study, which shows relativestability of SEFs with respect to variable mu rhythm. Another study shows, however, that pre-stimulus membrane potential is positively correlated with the magnitude of the visually evokedresponses (Azouz and Gray, 1999). Predictability of the responses is certainly easier for the singleunit activity than for the summated electrical activity of a large population of neurons. However, arecent study in cats demonstrated that summated neuronal corticographic activity might be better asa response predictor, when spontaneous synchronization between different brain areas is evaluated(Fries et al., 2001).
Figure 4. Examples of changes in amplitudes of SEFs belonging to different levels of pre-stimulusmu rhythm (interval 480-ms). A. SEFs averaged with respect to the smallest (group 1, thin line) and thelargest (group 5, thick line) mu rhythm for a representative subject. B. Differences in the amplitude of N20mbetween SEFs belonging to groups 5 and 1 for 11 subjects. C. As in B, but for P35m deflection and 10subjects. D. As in C, but for P60m deflection. Star indicates missing component in a particular subject.
50 0 50 100 150 200
0
200
400
t [ms]
Fiel
d gr
adie
nt [f
T/cm
]
1 2 3 4 5 6 7 8 9 10Subject
11
1 2 3 4 5 6 7 8 9 10Subject
111 2 3 4 5 6 7 8 9 10Subject
11
20
0
20
40
60
Incr
ease
[%]
10
0
20
40
Incr
ease
[%]
20
0
20
40
60
Incr
ease
[%]
A B
C D
* *
N20mgroup 1 vs. 5
P35mGroup 1 vs. 5
P60mGroup 1 vs. 5
N20m
P35m P60m
26
There was no systematic trend across the subjects for the amplitude of pre-stimulus murhythm to be changed during the experiment. This fact suggests an absence of unspecific factorsrelated to the duration of the experiment, which would affect in a similar way spontaneous activityand the evoked responses. It was reported that the high level of vigilance might increaseelectroencephalographic 10-Hz activity in central area, where mu rhythm is generated (Higuchi etal., 2001). These results would indicate that the amplitude of SEF components can be higher in caseof increased vigilance.
Changes in SEFs with respect to pre-stimulus activity are surprisingly small compared tothose reported for the visual and auditory modalities. Rahn et al. (1993) reported a 40% increase ofthe N1-P2 auditory complex when stimuli were applied during weak alpha activity compared withaveraging performed without any evaluation of pre-stimulus activity. Romani et al. (1988) reporteda two-fold decrease of the auditory N1-P2 when the stimulus was preceded by strong vs. weak deltaand theta activity. Increased amplitude of delta activity in EEG is known to be associated with thedrowsiness (Chapotot et al., 2000), thus suggesting that decrease in vigilance is associated with thedecrease in N1-P2 complex. Brandt et al. (1991) showed a five-fold increase in the N1-P2 visualcomplex from weak to strong levels of pre-stimulus alpha activity. Pronounced modulation ofauditory and visual responses with respect to pre-stimulus oscillatory activity can be explained byhigh susceptibility of these components to the functional state of the underlying them network.
Mu rhythm is known to be attenuated during the preparation to movement (Pfurtscheller,1989) and by somatosensory stimulation (Salenius et al., 1997b). An attenuation of short- andmiddle-latency SEPs was also reported in tasks related to planning and execution of movement(Cohen and Starr, 1985; Huttunen and Homberg, 1991). The aforementioned studies indicate thatduring movement and tactile stimulation, somatosensory evoked responses and mu rhythm arepositively correlated. This correlation suggests an existence of mechanisms which may equallyaffect both spontaneous activity and somatosensory responses. These same mechanisms mayprobably also explain our findings concerning the weak enhancements of P35m and P60m in thecase of large amplitude mu rhythm.
Study III. Somatosensory evoked potentials modulated by TMS
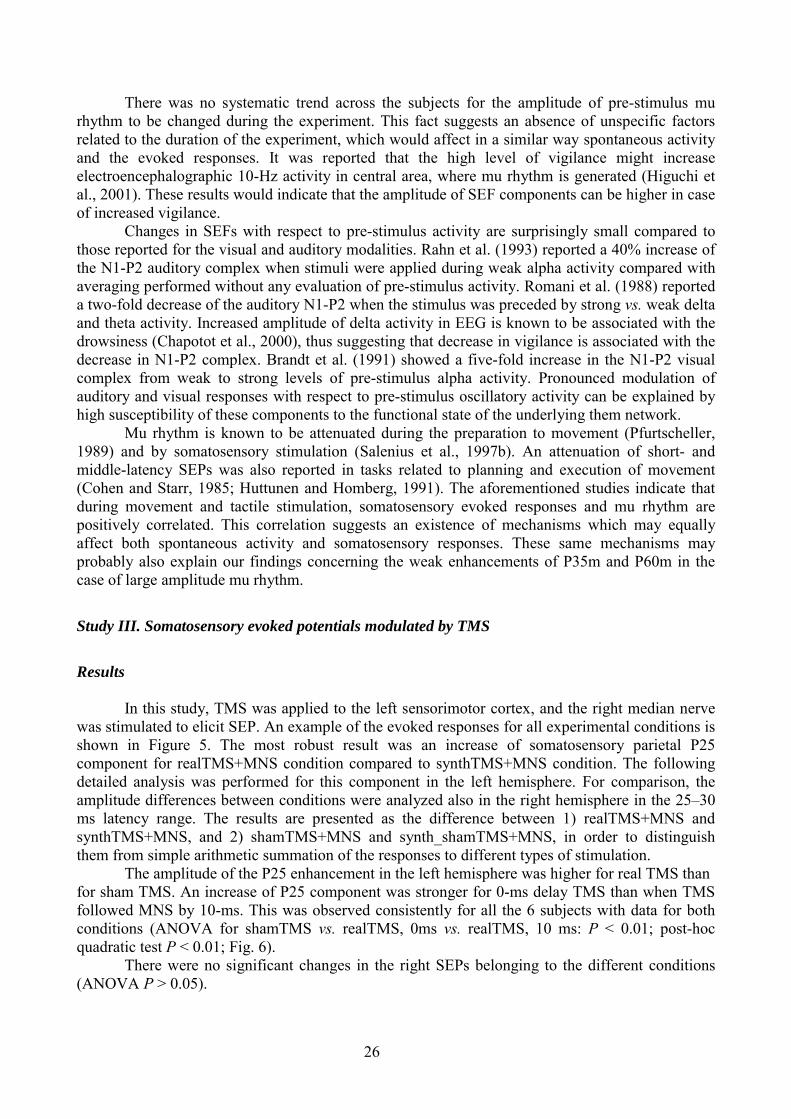
Results
In this study, TMS was applied to the left sensorimotor cortex, and the right median nervewas stimulated to elicit SEP. An example of the evoked responses for all experimental conditions isshown in Figure 5. The most robust result was an increase of somatosensory parietal P25component for realTMS+MNS condition compared to synthTMS+MNS condition. The followingdetailed analysis was performed for this component in the left hemisphere. For comparison, theamplitude differences between conditions were analyzed also in the right hemisphere in the 25–30ms latency range. The results are presented as the difference between 1) realTMS+MNS andsynthTMS+MNS, and 2) shamTMS+MNS and synth_shamTMS+MNS, in order to distinguishthem from simple arithmetic summation of the responses to different types of stimulation.
The amplitude of the P25 enhancement in the left hemisphere was higher for real TMS thanfor sham TMS. An increase of P25 component was stronger for 0-ms delay TMS than when TMSfollowed MNS by 10-ms. This was observed consistently for all the 6 subjects with data for bothconditions (ANOVA for shamTMS vs. realTMS, 0ms vs. realTMS, 10 ms: P < 0.01; post-hocquadratic test P < 0.01; Fig. 6).
There were no significant changes in the right SEPs belonging to the different conditions(ANOVA P > 0.05).
27
The P25 enhancement measured as the difference between "TMS+SEP" and"synthTMS+SEP" had a spatial distribution with the maximum in close proximity to the stimulatedpoint.
Figure 5. "TMS", "SEP", and "TMS&SEP" waveforms (for P25 component) recorded in typical subject;positivity upwards. The shaded area shows the P25 enhancement. The stimuli were delivered at 0 ms.Somatosensory stimuli caused an artifact in the recordings (0–2 ms in condition SEP). In conditionSEP&TMS, the artifact was prolonged (0–10 ms). This was due to the sample-and-hold circuitry underlyingthe amplifier’s gating feature, which served to exclude TMS-related artifacts.
Discussion
The results of the present study show that TMS modulates SEP when being appliedsimultaneously with the median nerve stimulation. The increase of P25 was topographicallyorganized with the maximum above the centro-parietal area of the contralateral hemisphere. Theseresults are congruent with the earlier studies by Kujirai et al. (1993a) and Seyal et al. (1993)revealing similar enhancement of P25 induced by TMS. While these studies dealt with the TMSbefore (10–150 ms) and simultaneously with the MNS, our experimental setup permitted acomparison between TMS applied simultaneously with and 10 ms after the somatosensorystimulus. When delayed by 10 ms, TMS did not have any significant effect on the amplitude of P25component. Additional control experiments with "sham TMS" showed that the acoustical clickassociated with the TMS is not the reason for the changes in SEP.
The data analysis was not performed on the responses later than P25 because of theirpossible contamination by a re-afferent response from the muscular twitches caused by TMS.
The authors of both previous studies (Kujirai et al., 1993a; Seyal et al., 1993) argued thatmost likely the increase of P25 is caused by the inhibitory process, which takes place fewmillisecond after the stimulation of the cortex. The main point of Seyal et al. (1993) was to explainP25 (as part of N1-P1 complex) enhancement as a result of synchrony, which followshyperpolarization. Synchronization of neuronal activity through the preceding hyperpolarization
SEP alone
TMS&SEPSynthTMS+SEP
TMS alone
-50
0
-10
10
20
Time [ms]
Am
plitu
de [µ
V]
0 50 100
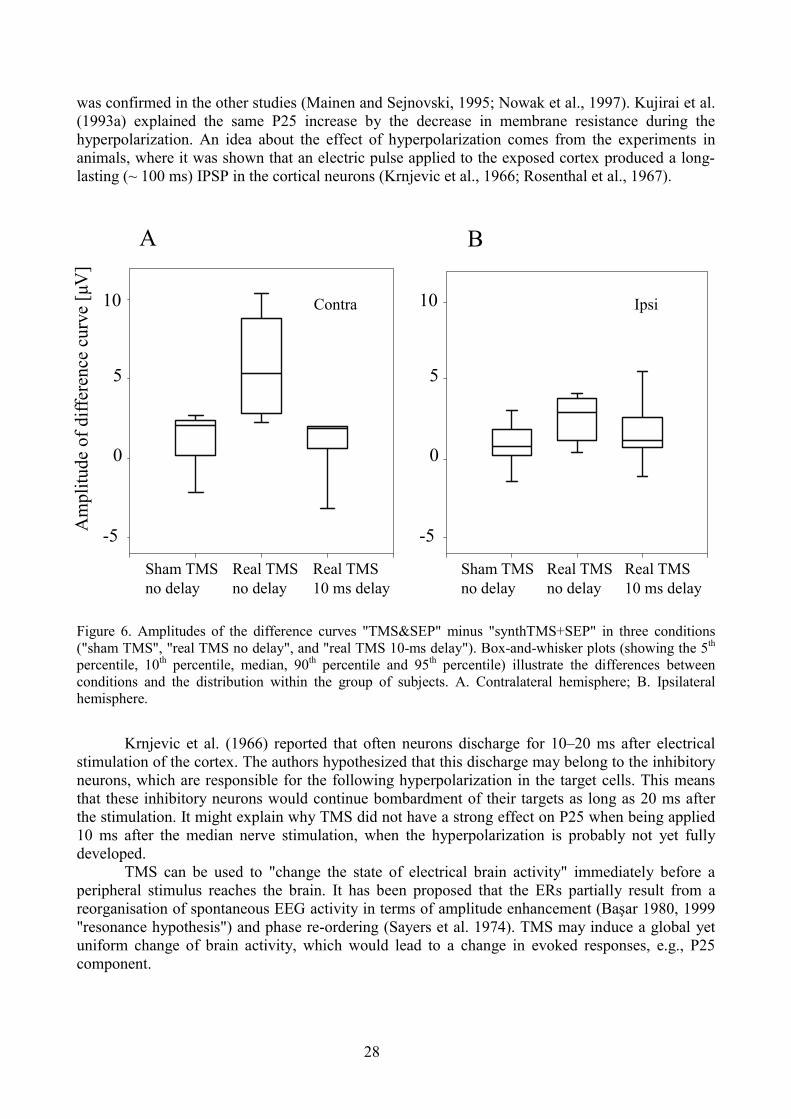
28
was confirmed in the other studies (Mainen and Sejnovski, 1995; Nowak et al., 1997). Kujirai et al.(1993a) explained the same P25 increase by the decrease in membrane resistance during thehyperpolarization. An idea about the effect of hyperpolarization comes from the experiments inanimals, where it was shown that an electric pulse applied to the exposed cortex produced a long-lasting (~ 100 ms) IPSP in the cortical neurons (Krnjevic et al., 1966; Rosenthal et al., 1967).
Figure 6. Amplitudes of the difference curves "TMS&SEP" minus "synthTMS+SEP" in three conditions("sham TMS", "real TMS no delay", and "real TMS 10-ms delay"). Box-and-whisker plots (showing the 5th
percentile, 10th percentile, median, 90th percentile and 95th percentile) illustrate the differences betweenconditions and the distribution within the group of subjects. A. Contralateral hemisphere; B. Ipsilateralhemisphere.
Krnjevic et al. (1966) reported that often neurons discharge for 10–20 ms after electricalstimulation of the cortex. The authors hypothesized that this discharge may belong to the inhibitoryneurons, which are responsible for the following hyperpolarization in the target cells. This meansthat these inhibitory neurons would continue bombardment of their targets as long as 20 ms afterthe stimulation. It might explain why TMS did not have a strong effect on P25 when being applied10 ms after the median nerve stimulation, when the hyperpolarization is probably not yet fullydeveloped.
TMS can be used to "change the state of electrical brain activity" immediately before aperipheral stimulus reaches the brain. It has been proposed that the ERs partially result from areorganisation of spontaneous EEG activity in terms of amplitude enhancement (Başar 1980, 1999"resonance hypothesis") and phase re-ordering (Sayers et al. 1974). TMS may induce a global yetuniform change of brain activity, which would lead to a change in evoked responses, e.g., P25component.
Contra Ipsi
Sham TMSno delay
Real TMSno delay
Real TMS10 ms delay
Sham TMSno delay
Real TMSno delay
Real TMS10 ms delay
0 0
5
10
-5 -5
5
10
Am
plitu
de o
f diff
eren
ce c
urve
[µV
]
A B

29
Study IV. Long-range temporal correlations in spontaneous brain oscillations
Results
An example of alpha activity is presented in Fig. 7. The main results are shown in Table 3.Power spectrum of wavelet-transformed data at 10-Hz frequency (occipito-parietal and centralareas) and at 20-Hz (central areas) revealed no characteristic peaks. Moreover, we found a lineardecay of power spectral density with increasing frequencies in double-logarithmic coordinates inthe range of 0.005–0.5 Hz; i.e., a 1/fβ type of a power spectrum: P(f) ≈ f−β. This type of 1/fβspectrum was observed for both MEG and EEG data.
The autocorrelation analysis of the wavelet transformed data revealed significant correlationwith the time lag of > 100 s. The decay of this function for both MEG and EEG data wascharacterized by a power law: ACF(t) ≈ t−γ (see Table 3). Neither reference recordings (MEG) nor surrogate data (EEG) demonstrated a 1/fβ type of apower spectrum or gradually decaying autocorrelation function.
As a next step we calculated the self-similarity parameter α of the DFA. Uncorrelatedsignals yield α = 0.5, which was demonstrated for both wavelet transformed reference recordingsand surrogate data. For all data sets (10-Hz and 20-Hz oscillations) we found α significantly largerthan 0.5 (see details in Table 3, Fig. 8), indicating the presence of long-range correlations in brainoscillations. We did not find significant differences for the parameter α between the eyes-closedand eyes-open condition for alpha oscillations. The only significant differences were found for theparameter α being larger for central 10-Hz than 20-Hz activity (P < 0.005).
Figure 7. Alpha oscillations, dominating the spontaneous activity, fluctuate in amplitude on a wide range oftime scales. A. MEG signal from the occipital region and the eyes-open condition. The 4-s epoch ofbroadband MEG (0.3–90 Hz, upper curve) displays a typical transition from low alpha activity to large-amplitude 10-Hz oscillations (lower curve). The thick line of the lower curve indicates the amplitudeenvelope of the bandpass-filtered signal (8.7–11.3 Hz) obtained with the wavelet filter. B. Continuous andpronounced fluctuations in the alpha-oscillation amplitude are seen in 150-s epochs from conditions eyes-open (upper curve) and eyes-closed (lower curve).
BA
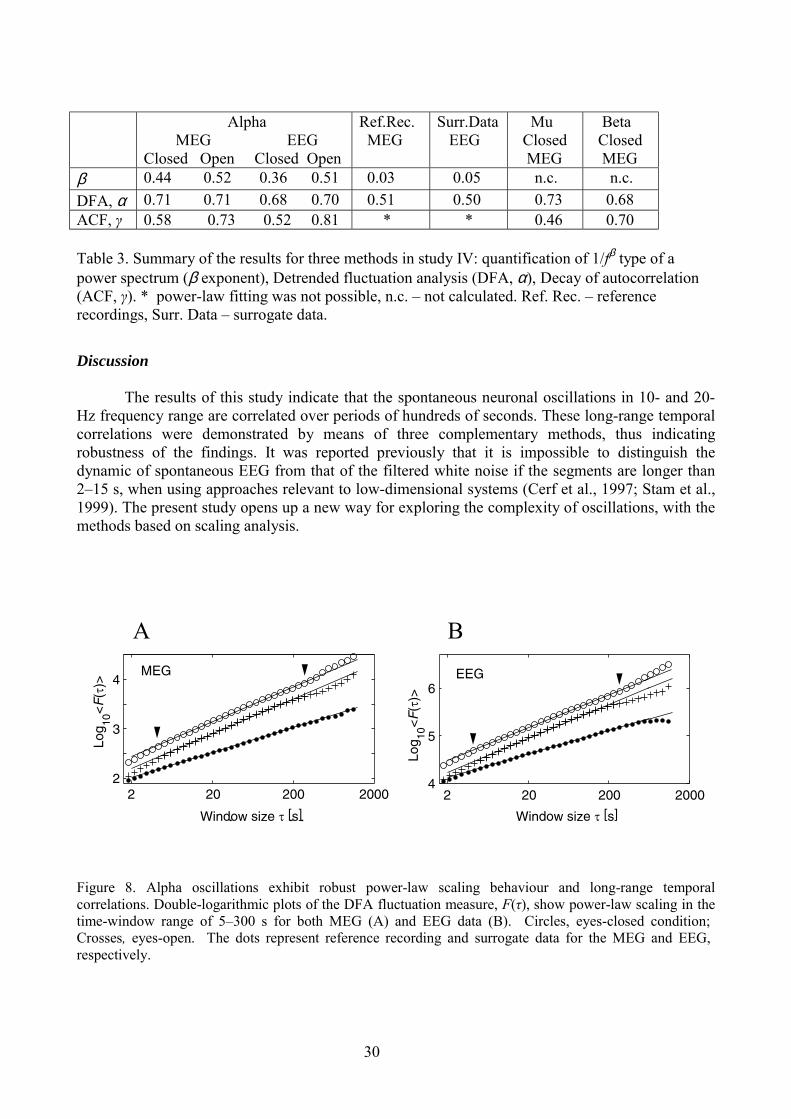
30
Alpha MEG EEGClosed Open Closed Open
Ref.Rec. MEG
Surr.Data EEG
Mu Closed MEG
Beta Closed MEG
β 0.44 0.52 0.36 0.51 0.03 0.05 n.c. n.c.DFA, α 0.71 0.71 0.68 0.70 0.51 0.50 0.73 0.68ACF, γ 0.58 0.73 0.52 0.81 * * 0.46 0.70
Table 3. Summary of the results for three methods in study IV: quantification of 1/fβ type of apower spectrum (β exponent), Detrended fluctuation analysis (DFA, α), Decay of autocorrelation(ACF, γ). * power-law fitting was not possible, n.c. – not calculated. Ref. Rec. – referencerecordings, Surr. Data – surrogate data.
Discussion
The results of this study indicate that the spontaneous neuronal oscillations in 10- and 20-Hz frequency range are correlated over periods of hundreds of seconds. These long-range temporalcorrelations were demonstrated by means of three complementary methods, thus indicatingrobustness of the findings. It was reported previously that it is impossible to distinguish thedynamic of spontaneous EEG from that of the filtered white noise if the segments are longer than2–15 s, when using approaches relevant to low-dimensional systems (Cerf et al., 1997; Stam et al.,1999). The present study opens up a new way for exploring the complexity of oscillations, with themethods based on scaling analysis.
Figure 8. Alpha oscillations exhibit robust power-law scaling behaviour and long-range temporalcorrelations. Double-logarithmic plots of the DFA fluctuation measure, F(τ), show power-law scaling in thetime-window range of 5–300 s for both MEG (A) and EEG data (B). Circles, eyes-closed condition;Crosses, eyes-open. The dots represent reference recording and surrogate data for the MEG and EEG,respectively.
A B
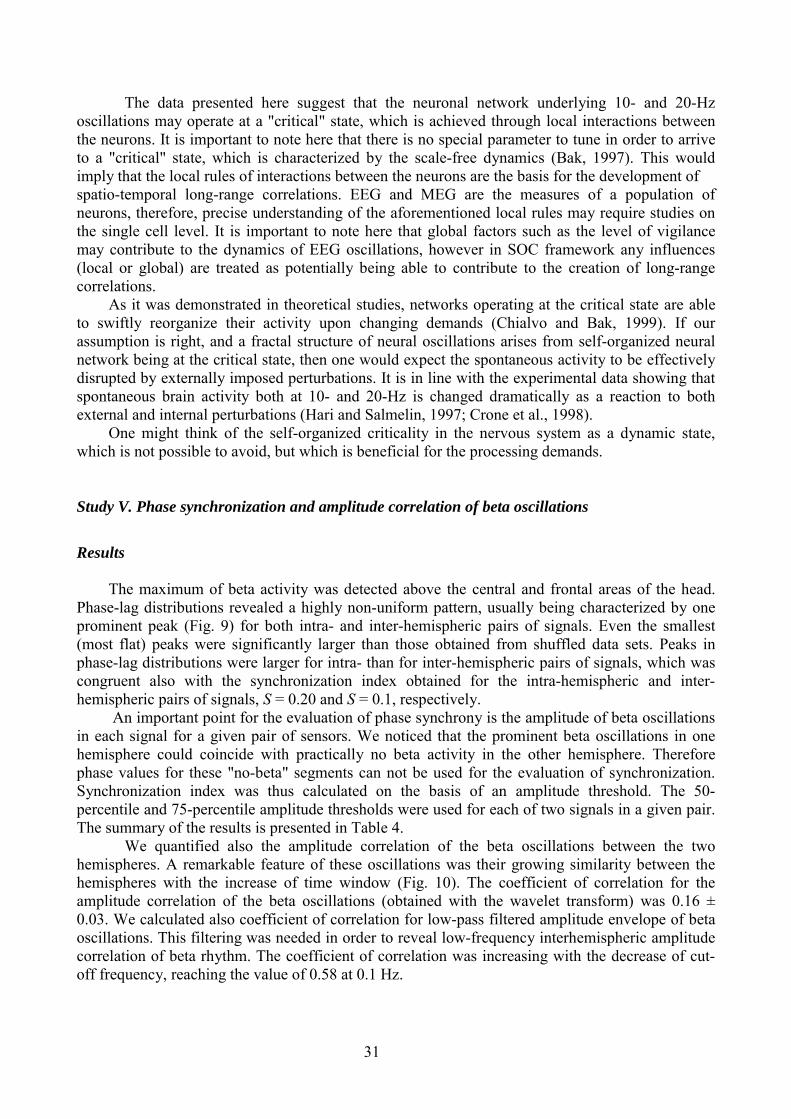
31
The data presented here suggest that the neuronal network underlying 10- and 20-Hzoscillations may operate at a "critical" state, which is achieved through local interactions betweenthe neurons. It is important to note here that there is no special parameter to tune in order to arriveto a "critical" state, which is characterized by the scale-free dynamics (Bak, 1997). This wouldimply that the local rules of interactions between the neurons are the basis for the development ofspatio-temporal long-range correlations. EEG and MEG are the measures of a population ofneurons, therefore, precise understanding of the aforementioned local rules may require studies onthe single cell level. It is important to note here that global factors such as the level of vigilancemay contribute to the dynamics of EEG oscillations, however in SOC framework any influences(local or global) are treated as potentially being able to contribute to the creation of long-rangecorrelations. As it was demonstrated in theoretical studies, networks operating at the critical state are ableto swiftly reorganize their activity upon changing demands (Chialvo and Bak, 1999). If ourassumption is right, and a fractal structure of neural oscillations arises from self-organized neuralnetwork being at the critical state, then one would expect the spontaneous activity to be effectivelydisrupted by externally imposed perturbations. It is in line with the experimental data showing thatspontaneous brain activity both at 10- and 20-Hz is changed dramatically as a reaction to bothexternal and internal perturbations (Hari and Salmelin, 1997; Crone et al., 1998). One might think of the self-organized criticality in the nervous system as a dynamic state,which is not possible to avoid, but which is beneficial for the processing demands.
Study V. Phase synchronization and amplitude correlation of beta oscillations
Results
The maximum of beta activity was detected above the central and frontal areas of the head.Phase-lag distributions revealed a highly non-uniform pattern, usually being characterized by oneprominent peak (Fig. 9) for both intra- and inter-hemispheric pairs of signals. Even the smallest(most flat) peaks were significantly larger than those obtained from shuffled data sets. Peaks inphase-lag distributions were larger for intra- than for inter-hemispheric pairs of signals, which wascongruent also with the synchronization index obtained for the intra-hemispheric and inter-hemispheric pairs of signals, S = 0.20 and S = 0.1, respectively. An important point for the evaluation of phase synchrony is the amplitude of beta oscillationsin each signal for a given pair of sensors. We noticed that the prominent beta oscillations in onehemisphere could coincide with practically no beta activity in the other hemisphere. Thereforephase values for these "no-beta" segments can not be used for the evaluation of synchronization.Synchronization index was thus calculated on the basis of an amplitude threshold. The 50-percentile and 75-percentile amplitude thresholds were used for each of two signals in a given pair.The summary of the results is presented in Table 4.
We quantified also the amplitude correlation of the beta oscillations between the twohemispheres. A remarkable feature of these oscillations was their growing similarity between thehemispheres with the increase of time window (Fig. 10). The coefficient of correlation for theamplitude correlation of the beta oscillations (obtained with the wavelet transform) was 0.16 ±0.03. We calculated also coefficient of correlation for low-pass filtered amplitude envelope of betaoscillations. This filtering was needed in order to reveal low-frequency interhemispheric amplitudecorrelation of beta rhythm. The coefficient of correlation was increasing with the decrease of cut-off frequency, reaching the value of 0.58 at 0.1 Hz.
32
Figure 9. Phase synchrony between beta oscillations in the two hemispheres (for one subject). Phase-lagdistribution for: no amplitude-threshold (thin line) calculations, 50 percentile amplitude threshold (middlethick line) and 75 percentile amplitude threshold (thick line) calculations. The solid horizontal line and thedashed lines represent mean and three standard deviations of 1000 simulations, respectively.
Discussion
This study clearly shows that beta oscillations in the left and right motor cortices are phase-locked and correlated in amplitude. We used a new approach in order to quantify phase-relationshipof the two processes. This approach is quite different from the coherence function, which istraditionally used in neuroscience. The coherence function is not a unique measure of phase-synchrony, it measures also amplitude correlation, being therefore a biased measure (Tass, 1999).The phase-lag distributions presented in our study show that one can always find a preferential lagvalue. The typical phase-lag in our study was around 0 degrees, however lags of 10–90 degreeswere observed.
The inter- and intrahemispheric synchronization increased with the increase of betaoscillation amplitude. The S-index was 170% larger for 75-percentile threshold approach then forno-threshold calculations.
Left hemisphere Right hemisphere Inter-hemispheric S (no threshold) 0.21 ± 0.05 0.20 ± 0.02 0.10 ± 0.01 S (50 percentile) 0.41 ± 0.07 0.40 ± 0.04 0.19 ± 0.01 S (75 percentile) 0.55 ± 0.07 0.55 ± 0.04 0.27 ± 0.20
Table 4. Synchronization index for different amplitude of beta oscillations.The values are given as mean ± SEM.
It was proposed that spontaneous (internal) synchronization serves as a mechanism forbinding of anatomically separate but functionally related areas (Singer, 1999; Fries et al., 2001).Beta oscillations seen in MEG under physiological conditions are known to be generated in themotor cortex (Salmelin and Hari, 1994b) and they are tightly related to the preparation andexecution of a movement (Pfurtscheller and Lopes da Silva, 1999; Crone et al., 1998; Conway etal., 1995). The synchronization of beta oscillations between the two hemispheres may thus beregarded as being beneficial for the organization of bilateral movements (Andres et al., 1999). Thesynchronization also implies that structures, when being synchronized, should behave as a wholeand this can be not desirable when only a given area is involved in a particular activity. For themotor system an example of such a problem can be the organization of unilateral movements. So, it
0.01
0.02
0.03
0.04
90 0 90-
Phase-lag [degrees]Pr
obab
ility
den
sity
180- 180
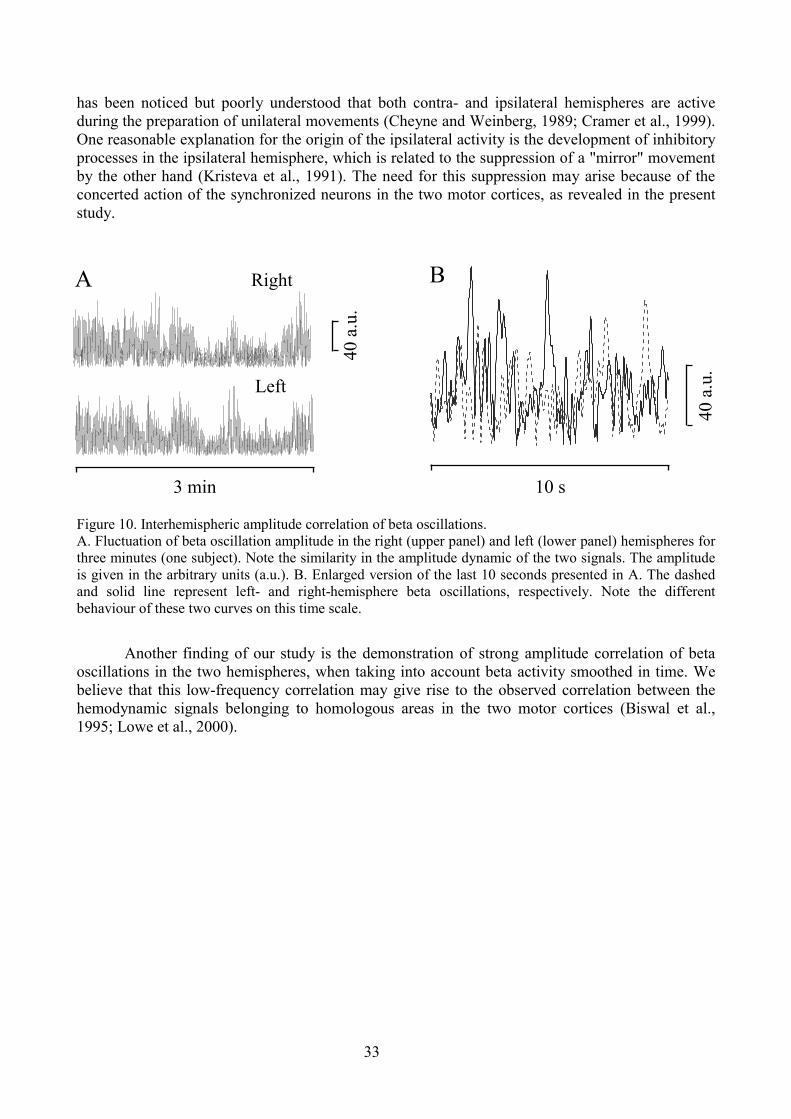
33
has been noticed but poorly understood that both contra- and ipsilateral hemispheres are activeduring the preparation of unilateral movements (Cheyne and Weinberg, 1989; Cramer et al., 1999).One reasonable explanation for the origin of the ipsilateral activity is the development of inhibitoryprocesses in the ipsilateral hemisphere, which is related to the suppression of a "mirror" movementby the other hand (Kristeva et al., 1991). The need for this suppression may arise because of theconcerted action of the synchronized neurons in the two motor cortices, as revealed in the presentstudy.
Figure 10. Interhemispheric amplitude correlation of beta oscillations.A. Fluctuation of beta oscillation amplitude in the right (upper panel) and left (lower panel) hemispheres forthree minutes (one subject). Note the similarity in the amplitude dynamic of the two signals. The amplitudeis given in the arbitrary units (a.u.). B. Enlarged version of the last 10 seconds presented in A. The dashedand solid line represent left- and right-hemisphere beta oscillations, respectively. Note the differentbehaviour of these two curves on this time scale.
Another finding of our study is the demonstration of strong amplitude correlation of betaoscillations in the two hemispheres, when taking into account beta activity smoothed in time. Webelieve that this low-frequency correlation may give rise to the observed correlation between thehemodynamic signals belonging to homologous areas in the two motor cortices (Biswal et al.,1995; Lowe et al., 2000).
A B
3 min
40 a
.u.
40 a
.u.
Right
Left
10 s
34
Methodological remarks
The results of the present thesis were obtained with MEG and EEG techniques. Three majorfactors should be considered when using these methods. The first factor is related to the fact thatMEG and EEG are the measures of activity of many neurons. In the classical theory, neuronaloscillations are thought to reflect the quasi-synchronous local postsynaptic responses of a set ofgeometrically ordered cells distributed in a layer array. The main elements in this array arepyramidal cells in the cortex. Relations of post-synaptic potentials and EEG oscillations may showtight correlation for evoked responses but not for spontaneous EEG potentials (Creutzfeld, 1995).The second factor is related to the inverse problem, meaning that there are infinite number ofsource configurations that produce exactly the same measured data. The third factor is about thetrue nature of spontaneous oscillations. Leaving aside their obvious usefulness for the clinic, itremains uncertain whether these oscillations are more than epiphenomenal signs of the activity ofmany neurons, or are active agents, or function as signal carriers, or serve as a mechanism forbinding together actions of different neuronal populations (Mountcastle, 1998).
Another critical issue is related to the proper representation of the signals and particularlyneuronal oscillations in time-frequency domain. This problem was formulated by Shannon (1948)as the uncertainty principle, implying that it is not possible precisely to represent signal in bothfrequency and time space. Two extremes of the signal representation are 1) the signal itself, when itis fully defined in time domain, but frequency information might be not easy to extract and 2) theFourier transform of the signal, when the frequency spectrum is defined, but the temporalinformation is lost. The wavelet transform, used in the present study, is a way to represent signalsimultaneously in both frequency and time domain. However, a compromise between the twodomains unavoidably implies that accuracy in frequency and in time will be smeared to a certainextent.
An important issue is also the averaging procedure, which is normally applied in order toachieve a better signal-to-noise ratio of the analyzed processes. The main assumption for theaveraging is the stability of the response from one epoch to another. Unfortunately this assumptionis not always met, which produces errors in the interpretation of the obtained results. The mosttypical example is the habituation of the responses in the course of the experiment. Therefore,habituation would lead to quantitatively different responses in the beginning and the end of theexperiment. Another reason for trial-to-trial variability in the evoked responses was recently shownin studies of synchronous activity (Fries et al., 2001). The authors demonstrated that the neuronalresponse depends critically on the synchronization of given areas in the gamma frequency rangebefore the presentation of the stimulus.
35
Summary
An understanding of the spontaneous neuronal activity is one of the intriguing topics inneuroscience. The present results are related for the most part to the 10- and 20-Hz sensorimotorrhythms. The traditional way to study cortical oscillations is to correlate their dynamics withdifferent tasks. The emphasis of the present thesis was on characterizing sensorimotor activitywhen there is no particular cognitive or motor task.
The relationship between the characteristics of SEF and spontaneous mu rhythm wasexplored. Stability of N20m was shown with respect to the highly variable amplitude of 10-Hzoscillations. P35m and to a much lesser extent P60m exhibited small positive correlation with theamplitude of the pre-stimulus mu rhythm. The variability in the amplitude of SEF components wasvery small (not more than 21%) compared to the changes in the amplitude of mu rhythm. Thelatencies of N20m, P35m, and P60m were unchanged with respect to the pre-stimulus 10-Hzoscillations. We conclude that the characteristics of SEF components are relatively stable comparedto the large variations in mu rhythm amplitude. SEFs demonstrate much weaker variability than thelong-latency components of auditory and visual responses, which are heavily dependent on the pre-stimulus spontaneous activity.
Suppression of mu rhythm was investigated both in contra- and ipsilateral hemispheresfollowing unilateral somatosensory stimulation. The strength of this suppression was morepronounced in the contra- than in the ipsilateral hemisphere, thus demonstrating clear lateralizationof the mu-rhythm reactivity to median nerve stimulation. The difference between the suppression inthe contra- and ipsilateral hemisphere depended on whether it was measured in the beginning or inthe end of the experiment. This is because the repeated stimulation significantly reduced mu-rhythm suppression in the ipsilateral, but not in the contralateral hemisphere in the course of theexperiment. We believe that the reactivity of mu rhythm is in part based on a nonspecific, arousal-like component, which is attenuated toward the end of the experiment, being most clearly evidentin the ipsilateral hemisphere.
In agreement with previous studies, we show that TMS, when being applied simultaneouslywith the median nerve stimulation, leads to an enhancement of the P25 SEP component. No suchincrease was found for TMS delayed by 10 ms with respect to median nerve stimulation. Controlexperiments show that the obtained increase of P25 can not be explained by the side effects ofTMS, such as acoustical click and vibration sensations. The increase was topographicallyorganized, being maximally pronounced in the vicinity of center of stimulation. We believe that theobserved effect most likely can be explained by the hyperpolarization of the cortical neuronscaused by the TMS pulse. An alternative explanation may be related to the uniform resetting of thespontaneous pre-stimulus activity in terms of the resonance hypothesis of the evoked responsegeneration.
Using detrended fluctuation analysis, power spectrum and autocorrelation function weshowed that the amplitude of spontaneous oscillations exhibit long-range temporal correlations of apower-law form. This correlation may extend up to more than hundred seconds. The scalingexponents of neuronal oscillations were invariant across subjects, thus suggesting similargeneration mechanisms. No difference was found for the scaling exponents between eyes-open andeyes-closed conditions. However, we found different scaling exponents for the 10- and 20-Hzrolandic components, indicating that distinct neuronal populations and/or mechanisms may underliethese oscillations. The power-law scaling behaviour in neuronal oscillations may be explained interms of the theory of self-organized criticality, which offers a general mechanism for theemergence of correlations in a stochastic multiunit system. In line with the theoretical studies, weproposed that the neuronal system in a critical state is able to adapt swiftly to new situations.
Synchronization in the nervous system is important for our understanding of how the brainoperates as a whole. This issue was addressed in the study where spatial long-range phase
36
synchrony of the beta oscillations was investigated. We demonstrated intra- and interhemisphericphase coupling, especially for the high-amplitude beta rhythm. We believe that this spontaneoussynchrony between two hemispheres may be utilized for the organization of bilateral movements.However, operating as a whole, simultaneous activity of this distributed network may beundesirable for the unilateral movements. We show also a positive correlation for the amplitude ofspontaneous beta oscillations between the two hemispheres. Remarkably, this correlation wasstrongest for the low-frequency components of amplitude modulation. This beta-amplitudecorrelation may give rise to the correlation of hemodynamic signals (< 0.8 Hz), that was reportedfor the homologous areas of motor cortices.
Conclusions
Slight positive correlation was demonstrated for the amplitude of somatosensory evoked fields andthe amplitude of pre-stimulus mu rhythm, thus suggesting relative independence of evoked andspontaneous activity.Somatosensory stimulation suppresses mu-rhythm amplitude predominantly in the contralateralhemisphere. In the ipsilateral hemisphere this suppression is attenuating in the course ofexperiment, which most likely reflects the presence of non-specific activation. An enhancement of the P25 component of the somatosensory evoked potentials was consistentlyobserved for TMS concurrent with somatosensory stimulation. This enhancement can be explainedthrough inhibitory processes caused by TMS.Amplitude fluctuations of 10- and 20-Hz oscillations are correlated over hundreds of seconds.Observed power-law scaling behavior of spontaneous oscillations may find unifying explanationwithin the theory of self-organized criticality.Interhemispheric phase synchrony and amplitude correlation are revealed for beta oscillations.Functionally, these findings can be related to the organizations of bilateral movements.
37
Acknowledgments
The present study was carried out in the BioMag Laboratory, Helsinki University CentralHospital. Financial support from the Academy of Finland, the Graduate School “FunctionalResearch in Medicine”, Centre for International Mobility, and Helsinki University Central Hospitalis gratefully acknowledged.
I would like to express sincere gratitude to my supervisors Doc. Risto J. Ilmoniemi, Doc.Juha Huttunen and Doc. Synnöve Carlson for efficient guidance and insightful comments.
My warmest thanks are due to my coathors Mrs. Irina Anourova, Mrs. Elena Antonova,Doc. Jari Karhu, Mr. Martti Kesäniemi, Mrs. Soile Komssi, Dr. Seppo Kähkönen, Mr. KlausLinkenkaer-Hansen, Mr. Marko Ollikainen, Mr. Matias Palva, Dr. Elina Pihko, Dr. JarmoRuohonen, Dr. Martin Schürmann, Mr. Sami Soljanlahti, and Dr. Heidi Wikström for agreeablecooperation in research.
I am obliged to Dr. Denis Artchakov, Mr. Tobias Andersen, Mr. Christopher Bailey, Dr.Vasiliy Klucharev, Mr. Antti Korvenoja, Dr. Leena Lauronen, Mrs. Anna Mari Mäkelä, Mr. VilleMäkinen, Ms. Karen Johanne Pallesen, Doc. Eero Pekkonen, Ms. Anna Shestakova, Dr. YuryShtyrov, Mr. Janne Sinkkonen, and Mr. Oguz Tanzer for creative discussions. I would like to thankProf. Alexandr S. Batuev, Prof. Toivo Katila, Prof. Gennadiy A. Kulikov, and Prof. RistoNäätänen, without whom this thesis would not be possible. I want also to thank Mrs. Suvi Heikkiläfor excellent technical assistance.
Special thanks go to our secretary Mrs. Maritta Maltio-Laine for support.I am grateful to Neuromag Ltd. for the excellent equipment and for continuous on-site
support.I wish to express my gratitude to Prof. Hannu Eskola and Doc. Tapani Salmi, the official
reviewers, who helped me to improve my dissertation.I am deeply grateful to my friends and relatives for unconditional support at all times.My warmest thanks, finally, go to my wife Anna and my son Daniil for their patience
during all these years.
38
References
Abbruzzese G, Dall’Agata D, Morena M, Reni L, Trivelli G, and Favale E. Selective effects of repetitionrate on frontal and parietal somatosensory evoked potentials (SEPs). Electroenceph ClinNeurophysiol Suppl 1990, 41: 145–148.
Aeschbach D, Postolache TT, Sher L, Matthews JR, Jackson MA, and Wehr TA. Evidence from the wakingelectroencephalogram that short sleepers live under higher homeostatic sleep pressure than longsleepers. Neuroscience 2001, 102: 493–502.
Allison T, McCarthy G, Wood CC, Darcey TM, Spencer DD, and Williamson PD. Human cortical potentialsevoked by stimulation of the median nerve. I. Cytoarchitectonic areas generating short-latencyactivity. J Neurophysiol 1989a, 62: 694–710.
Allison T, McCarthy G, Wood CC, Williamson PD, and Spencer DD. Human cortical potentials evoked bystimulation of the median nerve. II. Cytoarchitectonic areas generating long-latency activity. JNeurophysiol 1989b, 62: 711–722.
Allison T, McCarthy G, Wood CC, and Jones SJ. Potentials evoked in human and monkey cerebral cortexby stimulation of the median nerve. A review of scalp and intracranial recordings. Brain 1991, 114:2465–2503.
Alloway KD, and Burton H. Differential effects of GABA and bicuculline on rapidly- and slowly-adaptingneurons in primary somatosensory cortex of primates. Exp Brain Res 1991, 85: 598–610.
Amassian VE, Cracco RQ, Maccabee PJ, Cracco JB, Rudell A, and Eberle L. Suppression of visualperception by magnetic coil stimulation of human occipital cortex. Electroenceph Clin Neurophysiol1989, 74: 458–462.
Andres FG, Mima T, Schulman AE, Dichgans J, Hallett M, and Gerloff C. Functional coupling of humancortical sensorimotor areas during bimanual skill acquisition. Brain 1999, 122: 855–870
Arieli A, Sterkin A, Grinvald A, and Aertsen A. Dynamics of ongoing activity: explanation of the largevariability in evoked cortical responses. Science 1996, 273: 1868–1871.
Arnfred S, Chen AC, Eder D, Glenthoj B, and Hemmingsen R. Proprioceptive evoked potentials in man:cerebral responses to changing weight loads on the hand. Neurosci Lett 2000, 288:111–114.
Arroyo S, Lesser RP, Gordon B, Uematsu S, Jackson D, and Webber R. Functional significance of the murhythm of human cortex: an electrophysiologic study with subdural electrodes. Electroenceph ClinNeurophysiol 1993, 87: 76–87.
Ashe J, and Georgopoulos AP. Movement parameters and neural activity in motor cortex and area 5. CerebCortex 1994, 4: 590–600.
Azouz R, and Gray CM. Cellular mechanisms contributing to response variability of cortical neurons invivo. J Neurosci 1999, 19: 2209–2223.
Babloyantz A, and Destexhe A. Low-dimensional chaos in an instance of epilepsy. Proc Natl Acad Sci USA1986, 83: 3513–3517.
Bair W, Koch C, Newsome W, and Britten K. Power spectrum analysis of bursting cells in area MT in thebehaving monkey. J Neurosci 1994, 14: 2870–2892.
Bak P, Tang C, and Wiesenfeld K. Self-organized criticality: An explanation of 1/f noise. Phys Rev Lett1987, 59: 381–384.
Bak P, Tang C, and Wiesenfeld K. Self-organized criticality. Phys Rev A 1988, 38: 364–374.Bak P. How nature works. Oxford, Oxford University Press 1997.Barker AT, Jalinous R, and Freeston IL. Non-invasive magnetic stimulation of human motor cortex. Lancet
1985, 1: 1106–1107.Başar E. EEG-brain dynamics: Relation between EEG and brain evoked potentials. Amsterdam, Elsevier
1980.Başar E. Brain Function and Oscillations. II. Integrative Brain Function: Neurophysiology and Cognitive
Processes. Berlin, Springer 1999.Biswal B, Yetkin FZ, Haughton VM, and Hyde JS. Functional connectivity in the motor cortex of resting
human brain using echo-planar MRI. Magn Reson Med 1995, 34: 537–541.Bodegard A, Geyer S, Naito E, Zilles K, and Roland PE. Somatosensory areas in man activated by moving
stimuli: cytoarchitectonic mapping and PET. NeuroReport 2000, 11: 187–191.Brandt ME, Jansen BH, and Carbonari JP. Pre-stimulus spectral EEG patterns and the visual evoked
response. Electroenceph Clin Neurophysiol 1991, 80: 16–20.
39
Brenner D, Lipton J., Kaufman L., and Williamson SJ. Somatically evoked magnetic fields of the humanbrain. Science 1978, 199: 81–81.
Broughton R, Rasmussen T, and Branch C. Scalp and direct cortical recordings of somatosensory evokedpotentials in man (circa 1967). Can J Psychol 1981, 35: 136–158.
Burton H, and Robinson CJ. Responses in the first or second somatosensory cortical area in cats duringtransient inactivation of the other ipsilateral area with lidocaine hydrochloride. Somatosens Res1987, 4: 215–236.
Cerf R, Daoudi A, Ould Hénoune M, and El Ouasdad EH. Episodes of low-dimensional self-organizeddynamics from electroencephalographic α-signals. Biol Cybern 1997, 77: 235–245.
Chapman RM, Ilmoniemi RJ, Barbanera S, and Romani GL. Selective localization of alpha brain activitywith neuromagnetic measurements. Electroenceph Clin Neurophysiol 1984, 58: 569–572.
Chapotot F, Jouny C, Muzet A, Buguet A, and Brandenberger G. High frequency waking EEG: reflection ofa slow ultradian rhythm in daytime arousal. NeuroReport 2000, 11: 2223–2227.
Cheyne D, and Weinberg H. Neuromagnetic fields accompanying unilateral finger movements: pre-movement and movement-evoked fields. Exp Brain Res 1989, 78: 604–612
Chiappa K. Short-latency somatosensory evoked potentials: Interpretations. In: Evoked potentials in clinicalmedicine. (K Chiappa, ed), New York, Raven Press 1990, pp. 400–407.
Cohen LG, and Starr A. Vibration and muscle contraction affect somatosensory evoked potentials.Neurology 1985, 35: 691–698.
Chialvo DR, and Bak P. Learning from mistakes. Neuroscience 1999, 90: 1137–1148.Conway BA, Halliday DM, Farmer SF, Shahani U, Maas P, Weir AI, and Rosenberg JR. Synchronization
between motor cortex and spinal motoneuronal pool during the performance of a maintained motortask in man. J Physiol 1995, 489: 917–924.
Corthout E, Uttl B, Ziemann U, Cowey A, and Hallett M. Two periods of processing in the striate visualcortex as revealed by transcranial magnetic stimulation. Neuropsychologia 1999, 37: 137–145.
Craig AD, Chen K, Bandy D, and Reiman EM. Thermosensory activation of insular cortex. Nat Neurosci2000, 3: 184–190.
Cramer SC, Finklestein SP, Schaechter JD, Bush G, and Rosen BR. Activation of distinct motor cortexregions during ipsilateral and contralateral finger movements. J Neurophysiol 1999, 81: 383–387.
Creutzfeldt OD. Cortex Cerebri. New York, Oxford University Press 1995.Crone NE, Miglioretti DL, Gordon B, Sieracki JM, Wilson MT, Uematsu S, and Lesser RP. Functional
mapping of human sensorimotor cortex with electrocorticographic spectral analysis. I. Alpha andbeta event-related desynchronization. Brain 1998, 121: 2271–2299.
Curio G, Mackert BM, Burghoff M, Neumann J, Nolte G, Scherg M, and Marx P. Somatotopic sourcearrangement of 600 Hz oscillatory magnetic fields at the human primary somatosensory hand cortex.Neurosci Lett 1997, 234: 131–134.
Curio G. Linking 600-Hz "spikelike" EEG/MEG wavelets ("sigma-bursts") to cellular substrates: conceptsand caveats. J Clin Neurophysiol 2000, 17: 377–396.
Deiber MP, Giard MH, and Mauguiere F. Separate generators with distinct orientations for N20 and P22somatosensory evoked potentials to finger stimulation? Electroenceph Clin Neurophysiol 1986, 65:321–334.
Derambure P, Defebvre L, Dujardin K, Bourriez JL, Jacquesson JM, Destee A, and Guieu JD. Effect ofaging on the spatio-temporal pattern of event-related desynchronization during a voluntarymovement. Electroenceph Clin Neurophysiol 1993, 89: 197–203.
Desmedt JE, and Cheron G. Somatosensory evoked potentials to finger stimulation in healthy octogenariansand in young adults: wave forms, scalp topography and transit times of parietal and frontalcomponents. Electroenceph Clin Neurophysiol 1980 50: 404–425.
Desmedt JE, and Cheron G. Non-cephalic reference recording of early somatosensory potentials to fingerstimulation in adult or aging normal man: differentiation of widespread N18 and contralateral N20from the prerolandic P22 and N30 components. Electroenceph Clin Neurophysiol 1981, 52: 553–570.
Desmedt JE, and Tomberg C. Mapping early somatosensory evoked potentials in selective attention: criticalevaluation of control conditions used for titrating by difference the cognitive P30, P40, P100 andN140. Electroenceph Clin Neurophysiol 1989, 74: 321–346.
40
Destexhe A. Oscillations, complex spatiotemporal behavior and information transport in networks ofexcitatory and inhibitory neurons. Phys Rev E 1994, 50: 1594–1606.
Destexhe A, Contreras D, Sejnowski TJ, and Steriade M. A model of spindle rhythmicity in the isolatedthalamic reticular nucleus. J Neurophysiol 1994, 72: 803–818.
Destexhe A, and Paré D. Impact of network activity on the integrative properties of neocortical pyramidalneurons in vivo. J Neurophysiol 1999, 81: 1531–1547.
Di Lazzaro V, Oliviero A, Profice P, Saturno E, Pilato F, Insola A, Mazzone P, Tonali P, and Rothwell JC.Comparison of descending volleys evoked by transcranial magnetic and electric stimulation inconscious humans. Electroenceph Clin Neurophysiol 1998, 109: 397–401.
Donoghue JP, Suner S, and Sanes JN. Dynamic organization of primary motor cortex output to targetmuscles in adult rats. II. Rapid reorganization following motor nerve lesions. Exp Brain Res 1990,79: 492–503.
Donoghue JP, Leibovic S, and Sanes JN. Organization of the forelimb area in squirrel monkey motor cortex:representation of digit, wrist, and elbow muscles. Exp Brain Res 1992, 89: 1–19.
Duntley SP, Kim AH, Silbergeld DL, and Miller JW. Characterization of the mu rhythm during rapid eyemovement sleep. Clin Neurophysiol 2001, 112: 528–531.
Engel AK, Konig P, Kreiter AK, and Singer W. Interhemispheric synchronization of oscillatory neuronalresponses in cat visual cortex. Science 1991, 252: 1177–1179.
Evarts EV. Relation of pyramidal tract activity to force exerted during voluntary movement. J Neurophysiol1968, 31: 14–27.
Fabri M, Polonara G, Quattrini A, Salvolini U, Del Pesce M, and Manzoni T. Role of the corpus callosum inthe somatosensory activation of the ipsilateral cerebral cortex: an fMRI study of callosotomizedpatients. Eur J Neurosci 1999, 11: 3983–3994.
Forss N, Hari R, Salmelin R, Ahonen A, Hämäläinen M, Kajola M, Knuutila J, and Simola J. Activation ofthe human posterior parietal cortex by median nerve stimulation. Exp Brain Res 1994a, 99: 309–315.
Forss N, Salmelin R, and Hari R. Comparison of somatosensory evoked fields to airpuff and electric stimuli.Electroenceph Clin Neurophysiol 1994b, 92: 510–517.
Forss N, Hietanen M, Salonen O, and Hari R. Modified activation of somatosensory cortical network inpatients with right-hemisphere stroke. Brain 1999, 122: 1889–1899.
Forss N, Narici L, and Hari R. Sustained activation of the human SII cortices by stimulus trains.NeuroImage 2001, 13:497–501
Fox PT, Burton H, and Raichle ME. Mapping human somatosensory cortex with positron emissiontomography. J Neurosurg 1987, 67: 34–43.
Fries P, Neuenschwander S, Engel AK, Goebel R, and Singer W. Rapid feature selective neuronalsynchronization through correlated latency shifting. Nat Neurosci 2001, 4: 194–200.
Gandevia SC, and Ammon K. Selective temporal shift in the somatosensory evoked potential produced bychronic stimulation of the human index finger. Exp Brain Res 1992, 88: 219–223.
Gardner EP, Martin JH, and Jessel TM. The bodily senses. In: Principles of Neural Science. (ER Kandel, JHSchwartz, and TM Jessel, eds), New York, The McGraw-Hill Companies Inc. 2000, pp. 430–450.
Gardner EP, and Kandel ER. Touch. In: Principles of Neural Science (ER Kandel, JH Schwartz, and TMJessel, eds), New York, The McGraw-Hill Companies Inc. 2000, pp. 451–470.
Garraghty PE, Florence SL, and Kaas JH. Ablations of areas 3a and 3b of monkey somatosensory cortexabolish cutaneous responsivity in area 1. Brain Res 1990, 528: 165–169.
Gastaut H. Etude electrocorticographique de la reactivite des rythmes rolandiques, Rev Neurol 1952, 87:176–182.
Geyer S, Ledberg A, Schleicher A, Kinomura S, Schormann T, Borgel U, Klingberg T, Larsson J, Zilles K,and Roland PE. Two different areas within the primary motor cortex of man. Nature 1996, 382:805–807.
George MS, Wassermann EM, Williams WA, Callahan A, Ketter TA, Basser P, Hallett M, and Post RM.Daily repetitive transcranial magnetic stimulation (rTMS) improves mood in depression.NeuroReport 1995, 6: 1853–1856.
Ghazanfar AA, Stambaugh CR, and Nicolelis MAL. Encoding of tactile stimulus location by somatosensorythalamocortical ensembles. J Neurosci 2000, 20: 3761–3775
41
Gobbelé R, Buchner H, and Curio G. High-frequency (600 Hz) SEP activities originating in the subcorticaland cortical human somatosensory system. Electroenceph Clin Neurophysiol 1998, 108: 182–189.
Goff GD, Matsumiya Y, Allison T, and Goff WR. The scalp topography of human somatosensory andauditory evoked potentials. Electroenceph Clin Neurophysiol 1977, 42: 57–76.
Graham FK. Afterword: Pre-Attentive Processing and Passive and Active Attention. In: Attention andOrienting: Sensory and Motivational Processes (PJ Lang, RF Simons, and MT Balaban, eds),Mahwah, Lawrence Erlbaum Associates 1997, pp. 417–452.
Grassberger P, and Procaccia. Measuring the strangeness of strange attractors. Physica D 1983, 9: 189–208.Hallett M, Chadwick D, and Marsden CD. Cortical reflex myoclonus. Neurology 1979, 29: 1107–1125.Hari R, Reinikainen K, Kaukoranta E, Hämäläinen M, Ilmoniemi R, Penttinen A, Salminen J, and Teszner
D. Somatosensory evoked cerebral magnetic fields from SI and SII in man. Electroenceph ClinNeurophysiol 1984, 57: 254–263.
Hari R, Karhu J, Hämäläinen M, Knuutila J, Salonen O, Sams M, and Vilkman V. Functional organizationof the human first and second somatosensory cortices: a neuromagnetic study. Eur J Neurosci 1993,5: 724–734.
Hari R, and Salmelin R. Human cortical oscillations: a neuromagnetic view through the skull. TrendsNeurosci 1997, 20: 44–49.
Hashimoto I, Yoshikawa K, and Kimura T. Somatosensory evoked potentials to a threshold air-puff canpredict stimulus detection in human subjects. Neurosci Lett 2000, 282: 181–184.
Higuchi S, Liu Y, Yuasa T, Maeda A, and Motohashi Y. Diurnal variations in alpha power density andsubjective sleepiness while performing repeated vigilance tasks. Clin Neurophysiol 2001, 112: 997–1000.
Hoffman RE, Boutros NN, Hu S, Berman RM, Krystal JH, and Charney DS. Transcranial magneticstimulation and auditory hallucinations in schizophrenia. Lancet 2000, 355: 1073–1075.
Hoshiyama M, Kakigi R, Koyama S, Watanabe S, and Shimojo M. Activity in posterior parietal cortexfollowing somatosensory stimulation in man: magnetoencephalographic study using spatio-temporalsource analysis. Brain Topogr 1997, 10: 23–30.
Hô N, and Destexhe A. Synaptic background activity enhances the responsiveness of neocortical pyramidalneurons. J Neurophysiol 2000, 84: 1488–1496.
Huttunen J, Hari R, and Leinonen L. Cerebral magnetic responses to stimulation of ulnar and median nerves.Electroenceph. Clin Neurophysiol 1987, 66: 391–400.
Huttunen J, and Hömberg V. Modification of cortical somatosensory evoked potentials during tactileexploration and simple active and passive movements. Electroenceph Clin Neurophysiol 1991, 81:216–223.
Huttunen J, Wikström H, Korvenoja A, Seppalainen AM, Aronen H, and Ilmoniemi RJ. Significance of thesecond somatosensory cortex in sensorimotor integration: enhancement of sensory responses duringfinger movements. NeuroReport 1996, 7: 1009–1012.
Hyvärinen J, and Poranen A. Function of the parietal associative area 7 as revealed from cellular dischargesin alert monkeys. Brain 1974, 97: 673–692.
Hämäläinen M, Hari R, Ilmoniemi RJ, Knuutila J, and Lounasmaa OV. Magnetoencephalography–theory,instrumentation, and applications to noninvasive studies of the working human brain. Rev Mod Phys1993, 65: 413–497.
Ilmoniemi RJ, Virtanen J, Ruohonen J, Karhu J, Aronen HJ, Näätänen R, and Katila T. Neuronal responsesto magnetic stimulation reveal cortical reactivity and connectivity. NeuroReport 1997, 7: 3537–3540.
Ilmoniemi RJ, Ruohonen J, and Karhu J. Transcranial magnetic stimulation--a new tool for functionalimaging of the brain. Crit Rev Biomed Eng 1999, 27: 241–284.
Ishibashi H, Tobimatsu S, Shigeto H, Morioka T, Yamamoto T, and Fukui M. Differential interaction ofsomatosensory inputs in the human primary sensory cortex: a magnetoencephalographic study. ClinNeurophysiol 2000, 111: 1095–1102.
Jahanshahi M, Profice P, Brown RG, Ridding MC, Dirnberger G, and Rothwell JC. The effects oftranscranial magnetic stimulation over the dorsolateral prefrontal cortex on suppression of habitualcounting during random number generation. Brain 1998, 121: 1533–1544.
Jones EG, and Powell TP. An anatomical study of converging sensory pathways within the cerebral cortexof the monkey. Brain 1970, 93: 793–820.
42
Jones EG. Lamination and differential distribution of thalamic afferents within the sensory-motor cortex ofthe squirrel monkey. J Comp Neurol 1975, 160: 167–203.
Jones EG, Coulter JD, and Hendry SH. Intracortical connectivity of architectonic fields in the somaticsensory, motor and parietal cortex of monkeys. J Comp Neurol 1978, 181: 291–347.
Jones EG, Wise SP, and Coulter JD. Differential thalamic relationships of sensory-motor and parietalcortical fields in monkeys. J Comp Neurol 1979, 183: 833–881.
Jones EG. Extent of intracortical arborizations of thalamocortical axons as a determinant of representationalplasticity in the monkey somatic sensory cortex. J Neurosci 1995, 15: 4270–4288.
Josephs O, Athwal BS, Mackinnon C, Rothwell J, Frackowiak RS, and Turner R. Transcranial magneticstimulation with simultaneous undistorted functional magnetic resonance imaging. NeuroImage1999, 9: S124.
Jousmäki V, and Hari R. Somatosensory evoked fields to large-area vibrotactile stimuli. Clin Neurophysiol1999, 110: 905–909.
Kaas JH. The parcellations of somatosensory cortex: Modules, columns, and somatotopic segregates. In:Information Processing in the Somatosensory Cortex (O Franzen, and J Westman, eds), London,Macmillan 1991, pp. 211–218.
Kalcher J, and Pfurtscheller G. Discrimination between phase-locked and non-phase-locked event-relatedEEG activity. Electroenceph Clin Neurophysiol 1995, 94: 381–384.
Kamitani Y, and Shimojo S. Manifestation of scotomas created by transcranial magnetic stimulation ofhuman visual cortex. Nat Neurosci 1999, 2: 767–771.
Karhu J, Hari R, Mäkelä JP, Huttunen J, and Knuutila J. Cortical somatosensory magnetic responses inmultiple sclerosis. Electroenceph Clin Neurophysiol 1992, 83: 192–200.
Karhu J, and Tesche CD. Simultaneous early processing of sensory input in human primary (SI) andsecondary (SII) somatosensory cortices. J Neurophysiol 1999, 81: 2017–2025.
Kessels RP, d'Alfonso AA, Postma A, and de Haan EH. Spatial working memory performance after high-frequency repetitive transcranial magnetic stimulation of the left and right posterior parietal cortexin humans. Neurosci Lett 2000, 287: 68–70.
Kinoshita H, Oku N, Hashikawa K, and Nishimura T. Functional brain areas used for the lifting of objectsusing a precision grip: a PET study. Brain Res 2000, 857: 119–130.
Klimesch W, Doppelmayr M, Schwaiger J, Auinger P, and Winkler T. 'Paradoxical' alpha synchronization ina memory task. Brain Res Cogn Brain Res 1999, 7: 493–501.
Kolodziejak A, Dziduszko J, Niechaj A, and Tarnecki R. Influence of acute cerebellar lesions onsomatosensory evoked potentials (SEPs) in cats. J Physiol Pharmacol 2000, 51: 41–55.
Korvenoja A, Huttunen J, Salli E, Pohjonen H, Martinkauppi S, Palva JM, Lauronen L, Virtanen J,Ilmoniemi RJ, and Aronen HJ. Activation of multiple cortical areas in response to somatosensorystimulation: combined magnetoencephalographic and functional magnetic resonance imaging. HumBrain Mapp 1999, 8: 13–27.
Kraft GH, Aminoff MJ, Baran EM, Litchy WJ, and Stolov WC. Somatosensory evoked potentials: clinicaluses. AAEM Somatosensory Evoked Potentials Subcommittee. American Association ofElectrodiagnostic Medicine. Muscle Nerve 1998, 21: 252–258.
Kristeva R, Cheyne D, and Deecke L. Neuromagnetic fields accompanying unilateral and bilateral voluntarymovements: topography and analysis of cortical sources. Electroenceph Clin Neurophysiol 1991, 81:284–298.
Krnjevic K, Randic M, and Straughan DW. Nature of a cortical inhibitory process. J Physiol 1966, 184: 49–77.
Krubitzer L, Clarey JC, Tweedale R, and Calford MB. Interhemispheric connections of somatosensorycortex in the flying fox. J Comp Neurol 1998, 402: 538–559.
Kujirai T, Sato M, Rothwell JC, and Cohen LG. The effect of transcranial magnetic stimulation on mediannerve somatosensory evoked potentials. Electroenceph Clin Neurophysiol 1993, 89: 227–234.
Lachaux JP, Rodriguez E, Martinerie J, and Varela FJ. Measuring phase synchrony in brain signals. HumBrain Mapp 1999, 8: 194–208.
Leeuwen WS, Wieneke G, Spoelstra P, and Versteeg H. Lack of bilateral coherence of mu rhythm.Electroenceph Clin Neurophysiol 1978, 44: 140–146.
43
Leocani L, Toro C, Manganotti P, Zhuang P, and Hallett M. Event-related coherence and event-relateddesynchronization/synchronization in the 10 Hz and 20 Hz EEG during self-paced movements.Electroenceph Clin Neurophysiol 1997, 104: 199–206.
Lewine JD, and Orrison WW. Magnetoencephalography and Magnetic Source Imaging. In: Functional BrainImaging (WW Orrison, JD Lewine, JA Sanders, and MF Hartshorne, eds), St. Louis, Mosby 1995,pp. 369–418.
Lopes da Silva FH, Lierop TH van, Schrijer CF, and Leeuwen WS van. Organization of thalamic andcortical alpha rhythms: spectra and coherences. Electroenceph Clin Neurophysiol 1973, 35: 627–639.
Lopes da Silva FH, Vos JE, Mooibroek J, and Van Rotterdam A. Relative contributions of intracortical andthalamo-cortical processes in the generation of alpha rhythms, revealed by partial coherenceanalysis. Electroenceph Clin Neurophysiol 1980, 50: 449–456.
Lowe MJ, Dzemidzic M, Lurito JT, Mathews VP, and Phillips MD. Correlations in low-frequency BOLDfluctuations reflect cortico-cortical connections. NeuroImage 2000, 12: 582–587.
Macaluso E, Frith CD, and Driver J. Modulation of human visual cortex by crossmodal spatial attention.Science 2000, 289: 1206–1208.
Mainen ZF, and Sejnowski TJ. Reliability of spike timing in neocortical neurons. Science 1995, 268: 1503–1506.
Malamud BD, Morein G, and Turcotte DL. Forest fires: an example of self-organized critical behavior.Science 1998, 281: 1840–1842.
Mantegna RN, and Stanley HE. Scaling behaviour in the dynamics of an economic index. Nature 1995, 376:46–49.
Martínez A, Trejo JM. Transcranial magnetic stimulation in amyotrophic and primary lateral sclerosis.Electromyogr Clin Neurophysiol 1999, 39: 285–288.
Merton PA, and Morton HB. Stimulation of the cerebral cortex in the intact human subject. Nature 1980,285: 227.
Miltner WH, Braun C, Arnold M, Witte H, and Taub E. Coherence of gamma-band EEG activity as a basisfor associative learning. Nature 1999, 397: 434–436.
Mima T, and Hallett M. Electroencephalographic analysis of cortico-muscular coherence: reference effect,volume conduction and generator mechanism. Clin Neurophysiol, 1999, 110: 1892–1899.
Moore CE, and Schady W. Investigation of the functional correlates of reorganization within the humansomatosensory cortex. Brain 2000, 123: 1883–1895.
Mountcastle VB. Perceptual Neuroscience. The cerebral cortex. Cambridge, Harvard University Press 1998.Munk MH, Roelfsema PR, Konig P, Engel AK, and Singer W. Role of reticular activation in the modulation
of intracortical synchronization. Science 1996, 272: 271–274.Nakamura A, Yamada T, Goto A, Kato T, Ito K, Abe Y, Kachi T, and Kakigi R. Somatosensory
homunculus as drawn by MEG. NeuroImage 1998, 7: 1377–1386.Nowak LG, Sanchez-Vives MV, and McCormick DA. Influence of low and high frequency inputs on spike
timing in visual cortical neurons. Cereb Cortex 1997, 7: 487–501.Nudo RJ, Jenkins WM, Merzenich MM, Prejean T, and Grenda R. Neurophysiological correlates of hand
preference in primary motor cortex of adult squirrel monkeys. J Neurosci 1992, 12: 2918–2947.Nuñez A, Panetsos F, and Avendaño C. Rhythmic neuronal interactions and synchronization in the rat dorsal
column nuclei. Neuroscience 2000, 100: 599–609.Paluš M. Nonlinearity in normal human EEG: cycles, temporal asymmetry, nonstationarity and randomness,
not chaos. Biol Cybern 1996, 75: 389–396.Panzeri S, Petersen RS, Schultz SR, Lebedev M, and Diamond ME. The role of spike timing in the coding of
stimulus location in rat somatosensory cortex. Neuron 2001, 29: 769–777.Papakostopoulos D, and Crow HJ. Direct recording of the somatosensory evoked potentials from the
cerebral cortex of man and the difference between precentral and postcentral potentials. In: ClinicalUses of Cerebral Brainstem and Spinal Somatosensory Evoked Potentials (JE Desmedt, ed), Progclin Neurophysiol, vol 7. Basel, Karger 1980, pp. 15–26.
Paré D, Shink E, Gaudreau H, Destexhe A, and Lang EJ. Impact of spontaneous synaptic activity on theresting properties of cat neocortical pyramidal neurons in vivo. J Neurophysiol 1998, 79: 1450–1460.
44
Pascual-Leone A, Valls-Sole J, Brasil-Neto JP, Cohen LG, and Hallett M. Akinesia in Parkinson's disease. I.Shortening of simple reaction time with focal, single-pulse transcranial magnetic stimulation.Neurology 1994, 44: 884–891.
Pascual-Leone A, Bartres-Faz D, and Keenan JP. Transcranial magnetic stimulation: studying the brain-behaviour relationship by induction of 'virtual lesions'. Philos Trans R Soc Lond B Biol Sci 1999,354: 1229–1238.
Paul RL, Merzenich MM, and Goodman H. Representation of slowly and rapidly adapting cutaneousmechanoreceptors of the hand in Brodmann's areas 3 and 1 of Macaca mulatta. Brain Res 1972, 36:229–249.
Paus T, Jech R, Thompson CJ, Comeau R, Peters T, and Evans AC. Transcranial magnetic stimulationduring positron emission tomography: a new method for studying connectivity of the humancerebral cortex. J Neurosci 1997, 17: 3178–3184.
Penfield W, and Jasper H. Epilepsy and the functional anatomy of the human Brain. Boston. Little, Brownand Company, 1954.
Peng CK, Buldrev SV, Havlin S, Simons M, Stanley HE, and Goldberger AL. Mosaic organization of DNAnucleotides. Phys Rev E 1994, 49: 1685–1689.
Peng CK, Havlin S, Stanley HE, and Goldberger AL. Quantification of scaling exponents and crossoverphenomena in nonstationary heartbeat time series. Chaos 1995, 5: 82–87.
Pfurtscheller G. Rolandic mu rhythms and assessments of cerebral functions. Am J EEG Technol 1986, 26:19–32.
Pfurtscheller G. Functional topography during sensorimotor activation studied with event-relateddesynchronization mapping. J Clin Neurophysiol 1989, 6: 75–84.
Pfurtscheller G, Zalaudek K, and Neuper C. Event-related beta synchronization after wrist, finger and thumbmovement. Electroenceph Clin Neurophysiol 1998, 109: 154–160.
Pfurtscheller G, and Lopes da Silva FH. Event-related EEG/EMG synchronization and desynchronization:basic principles. Electroenceph Clin Neurophysiol 1999, 110: 1842–1857.
Pritchard WS, and Duke DW. Measuring "chaos" in the brain: a tutorial review of EEGdimension estimation. Brain Cogn 1995, 27: 353–397.
Rahn E, and Başar E. Pre-stimulus EEG-activity strongly influences the auditory evoked vertex response: anew method for selective averaging. Int J Neurosci 1993, 69: 207–220.
Ramachandran VS, and Hirstein W. The perception of phantom limbs. The D. O. Hebb lecture. Brain 1998,121: 1603–1630.
Ray WJ, and Cole HW. EEG alpha activity reflects attentional demands, and beta activity reflects emotionaland cognitive processes. Science 1985, 228: 750–752.
Richer F, Martinez M, Robert M, Bouvier G, and Saint-Hilaire JM. Stimulation of human somatosensorycortex: tactile and body displacement perceptions in medial regions. Exp Brain Res 1993, 93: 173–176.
Ridley RM, and Ettlinger G. Impaired tactile learning and retention after removals of the second somaticsensory projection cortex (SII) in the monkey. Brain Res 1976, 109: 656–660.
Rodriguez E, George N, Lachaux JP, Martinerie J, Renault B, and Varela FJ. Perception's shadow: long-distance synchronization of human brain activity. Nature 1999, 397: 430–433.
Roelfsema PR, Engel AK, Konig P, and Singer W. Visuomotor integration is associated with zero time-lagsynchronization among cortical areas. Nature 1997, 385: 157–161.
Romani A, Callieco R, and Cosi V. Pre-stimulus spectral EEG patterns and the evoked auditory vertexresponse. Electroenceph Clin Neurophysiol 1988, 70: 270–272.
Rosenthal J, Waller HJ, and Amassian VE. An analysis of the activation of motor cortical neurons bysurface stimulation. J Neurophysiol 1967, 30: 844–858.
Rosén I, and Asanuma H. Peripheral afferent inputs to the forelimb area of the monkey motor cortex: input-output relations. Exp Brain Res 1972, 14: 257–273.
Roth BJ. Mechanisms for electrical stimulation of excitable tissue. Crit Rev Biomed Eng 1994, 22: 253–305.Ruohonen J, Panizza M, Nilsson J, Ravazzani P, Grandori F, and Tognola G. Transverse-field activation
mechanism in magnetic stimulation of peripheral nerves. Electroenceph Clin Neurophysiol 1996,101: 167–174.
Sadato N, Nakamura S, Oohashi T, Nishina E, Fuwamoto Y, Waki A, and Yonekura Y. Neural networks forgeneration and suppression of alpha rhythm: a PET study. NeuroReport 1998, 9: 893–897.
45
Sakata H, Takaoka Y, Kawarasaki A, and Shibutani H. Somatosensory properties of neurons in the superiorparietal cortex (area 5) of the rhesus monkey. Brain Res 1973, 64: 85–102.
Salenius S, Portin K, Kajola M, Salmelin R, and Hari R. Cortical control of human motoneuron firing duringisometric contraction. J Neurophysiol 1997a, 77: 3401–3405.
Salenius S, Schnitzler A, Salmelin R, Jousmäki V, and Hari R. Modulation of human cortical rolandicrhythms during natural sensorimotor tasks. NeuroImage 1997b, 5: 221–228.
Salmelin R, and Hari R. Characterization of spontaneous MEG rhythms in healthy adults. ElectroencephClin Neurophysiol 1994a, 91: 237–248.
Salmelin R, and Hari R. Spatiotemporal characteristics of sensorimotor neuromagnetic rhythms related tothumb movement. Neuroscience 1994b, 60: 537–550.
Sayers BMcA, Beagley HA, and Henshall WR. The mechanism of auditory evoked EEG responses. Nature1974, 247: 481–483.
Seyal M, Browne JK, Masuoka LK, and Gabor AJ. Enhancement of the amplitude of somatosensory evokedpotentials following magnetic pulse stimulation of the human brain. Electroenceph ClinNeurophysiol 1993, 88: 20–27.
Shanks MF, and Powell TPS. An electron microscopic study of the termination of thlamocortical fibers inareas 3b, 1 and 2 of the somatic sensory cortex in the monkey. Brain Res 1981, 218: 35–47.
Shanks MF, Pearson RC, and Powell TP. The ipsilateral cortico-cortical connections between thecytoarchitectonic subdivisions of the primary somatic sensory cortex in the monkey. Brain Res1985, 356: 67–88.
Shannon CE. A mathematical theory of communication. Bell Systems Tech J 1948, 27: 379–423.Siddle DAT, and Lipp OV. Orienting, habituation, and information processing: The effects of omission, the
role of expectancy, and the problem of dishabituation. In: Attention and orienting: sensory andmotivational processes (PJ Lang, RF Simons, and MT Balaban, eds), Mahwah, Lawrence ErlbaumAssociates 1997, pp. 23–40.
Simões C, and Hari R. Relationship between responses to contra- and ipsilateral stimuli in the human secondsomatosensory cortex SII. NeuroImage 1999, 10: 408–416.
Singer W. Neuronal synchrony: a versatile code for the definition of relations? Neuron 1999, 24: 49–65.Somjen G. Sensory coding in the mammalian nervous system. New York, Appleton-Centure-Crofts 1972.Srinivasan R, Russell DP, Edelman GM, and Tononi G. Increased synchronization of neuromagnetic
responses during conscious perception. J Neurosci 1999, 19: 5435–5448.Srisa-an P, Lei L, and Tarkka IM. Middle latency somatosensory evoked potentials: noninvasive source
analysis. J Clin Neurophysiol 1996, 13: 156–163.Stam CJ, Pijn JP, Suffczynski P, and Lopes da Silva FH. Dynamics of the human alpha rhythm: evidence for
non-linearity? Clin Neurophysiol 1999, 110: 1801–1813.Stassinopoulos D, and Bak P. Democratic reinforcement: A principle for brain function. Phys Rev E 1995,
51: 5033–5039.Steinmetz PN, Roy A, Fitzgerald PJ, Hsiao SS, Johnson KO, and Niebur E. Attention modulates
synchronized neuronal firing in primate somatosensory cortex. Nature 2000, 404: 187–190.Suihko V. Modeling direct activation of corticospinal axons using transcranial electrical stimulation.
Electroenceph. Clin Neurophysiol 1998, 109: 238–244.Sur M, Merzenich MM, and Kaas JH. Magnification, receptive-field area, and ''hypercolumn'' size in areas
3b and 1 of somatosensory cortex in owl monkeys. J Neurophysiol 1980, 44: 295–311.Taniguchi M, Kato A, Fujita N, Hirata M, Tanaka H, Kihara T, Ninomiya H, Hirabuki N, Nakamura H,
Robinson SE, Cheyne D, and Yoshimine T. Movement-related desynchronization of the cerebralcortex studied with spatially filtered magnetoencephalography. NeuroImage 2000, 12: 298–306.
Tass PA. Phase resetting in medicine and biology. Berlin, Springer-Verlag 1999, pp. 247–248.Tecchio F, Pasqualetti P, Pizzella V, Romani G, and Rossini PM. Morphology of somatosensory evoked
fields: inter-hemispheric similarity as a parameter for physiological and pathological neuralconnectivity. Neurosci Lett 2000, 287: 203–206.
Thach WT. Correlation of neural discharge with pattern and force of muscular activity, joint position, anddirection of intended next movement in motor cortex and cerebellum. J Neurophysiol 1978, 41:654–676.
Tiihonen J, Kajola M, and Hari R. Magnetic mu rhythm in man. Neuroscience 1989, 32: 793–800.
46
Torrence C, and Compo GP. A practical guide to wavelet analysis. Bull Amer Meteorol Soc 1998, 79: 61–78.
Tsodyks M, Kenet T, Grinvald A, and Arieli A. Linking spontaneous activity of single cortical neurons andthe underlying functional architecture. Science 1999, 286:1943–1946.
Ugawa Y, Genba-Shimizu K, and Kanazawa I. Somatosensory evoked potential recovery (SEP-R) in variousneurological disorders. Electroenceph Clin Neurophysiol 1996, 100: 62–67.
Valeriani M, Le Pera D, Niddam D, Arendt-Nielsen L, and Chen AC. Dipolar source modeling ofsomatosensory evoked potentials to painful and nonpainful median nerve stimulation. Muscle Nerve2000, 23: 1194–1203.
Vanni S, Revonsuo A, and Hari R. Modulation of the parieto-occipital alpha rhythm during object detection.J Neurosci 1997, 17: 7141–7147.
Vanni S, Portin K, Virsu V, and Hari R. Mu rhythm modulation during changes of visual percepts.Neuroscience 1999, 91: 21–31.
Varela F, Lachaux JP, Rodriguez E, and Martinerie J. The brainweb: phase synchronization and large-scaleintegration. Nat Rev Neurosci 2001, 2: 229–239.
Virtanen J, Rinne T, Ilmoniemi RJ, and Näätänen R. MEG-compatible multichannel EEG electrode array.Electroenceph Clin Neurophysiol 1996, 99: 568–570.
Virtanen J, Ruohonen J, Näätänen R, and Ilmoniemi RJ. Instrumentation for the measurement of electricbrain responses to transcranial magnetic stimulation. Med Biol Eng Comput 1999, 37: 322–326.
Vogt BA, and Pandya DN. Cortico-cortical connections of somatic sensory cortex (areas 3, 1 and 2) in therhesus monkey. J Comp Neurol 1978, 177:179–192.
Waberski TD, Buchner H, Perkuhn M, Gobbel R, Wagner M, Knocker W, and Silny J. N30 and the effect ofexplorative finger movements: a model of the contribution of the motor cortex to earlysomatosensory potentials. Clin Neurophysiol 1999, 110: 1589–1600.
Whitlock DG, and Perl ER. Afferent projections through ventrolateral funiculi to thalamus of cat. JNeurophysiol 1959, 22: 133–148.
Whitsel BL, Petrucelli LM, and Werner G. Symmetry and connectivity in the map of the body surface insomatosensory area II of primates. J Neurophysiol 1969, 32: 170–183.
Wikström H, Huttunen J, Korvenoja A, Virtanen J, Salonen O, Aronen H, and Ilmoniemi RJ. Effects ofinterstimulus interval on somatosensory evoked magneti fields (SEFs): a hypothesis concerning SEFgeneration at the primary sensorimotor cortex. Eletroenceph Clin Neurophysiol 1996, 100: 479–487.
Williamson SJ, and Kaufman L. Advances in neuromagnetic instrumentation and studies of spontaneousbrain activity. Brain Topogr 1989, 2: 129–139.
Worden MS, Foxe JJ, Wang N, and Simpson GV. Anticipatory Biasing of visuospatial attention indexedby retinotopically specific alpha-band electroencephalography increases over occipital cortex JNeurosci 2000, 20: RC63.
Yamada T, and Kooi KA. Level of consciousness and the mu rhythm. Clin Electroenceph 1975, 6: 80–88.Yamada T, Kayamori R, Kimura J, and Beck DO. Topography of somatosensory evoked potentials after
stimulation of the median nerve. Electroenceph Clin Neurophysiol 1984, 59: 29–43.Young MP, Tanaka K, and Yamane S. On oscillating neuronal responses in the visual cortex of the monkey.
J Neurophysiol 1992, 67: 1464–1474.Zhang ZW, and Deschenes M. Intracortical axonal projections of lamina VI cells of the primary
somatosensory cortex in the rat: a single-cell labeling study. J Neurosci 1997, 17: 6365–6379.Zhou YD, and Fuster JM. Visuo-tactile cross-modal associations in cortical somatosensory cells. Proc Natl
Acad Sci USA 2000, 97: 9777–9782.