Embed Size (px)
Citation preview
arX
iv:1
710.
0817
9v1
[as
tro-
ph.S
R]
23
Oct
201
7
Mon. Not. R. Astron. Soc. 000, 1–13 (2017) Printed 24 October 2017 (MN LaTEX style file v2.2)
Magnetic swirls and associated fast magnetoacoustic kink
waves in a solar chromospheric flux tube
K. Murawski1, P. Kayshap1, A. K. Srivastava3, D. J. Pascoe2, P. Jelınek4, B. Kuzma1
and V. Fedun51Maria Curie-Sk lodowska University, Institute of Physics, Group of Astrophysics, Radziszewskiego 10, PL–20 031 Lublin, Poland2Centre for Fusion, Space and Astrophysics, Department of Physics, University of Warwick, CV4 7AL, UK3Department of Physics, Indian Institute of Technology (Banaras Hindu University), Varanasi-221005, India4University of South Bohemia, Faculty of Science, Institute of Physics and Biophysics, Branisovska 1760, CZ – 370 05Ceske Budejovice, Czech Republic5Space Systems Laboratory, Department of Automatic Control and Systems Engineering, University of Sheffield, Sheffield, S1 3JD, UK
Released 2017 Xxxxx XX
ABSTRACT
We perform numerical simulations of impulsively generated magnetic swirls in an iso-lated flux tube which is rooted in the solar photosphere. These swirls are triggered byan initial pulse in a horizontal component of the velocity. The initial pulse is launchedeither: (a) centrally, within the localized magnetic flux tube; or (b) off-central, inthe ambient medium. The evolution and dynamics of the flux tube is described bythree-dimensional, ideal magnetohydrodynamic equations. These equations are nu-merically solved to reveal that in case (a) dipole-like swirls associated with the fastmagnetoacoustic kink and m = 1 Alfven waves are generated. In case (b), the fastmagnetoacoustic kink and m = 0 Alfven modes are excited. In both these cases, theexcited fast magnetoacoustic kink and Alfven waves consist of similar flow patternand magnetic shells are also generated with clockwise and counter-clockwise rotatingplasma within them, which can be the proxy of dipole-shaped chromospheric swirls.The complex dynamics of vortices and wave perturbations reveals the channelling ofsufficient amount of energy to fulfill energy losses in the chromosphere (∼ 104 W m−1)and in the corona (∼ 102 W m−1). Some of these numerical findings are reminiscentof signatures in recent observational data.
Key words: Sun: atmosphere – Sun: oscillations – waves – methods: numerical –magnetohydrodynamics (MHD).
1 INTRODUCTION
The solar atmosphere consists of three main layers with thechromosphere being sandwiched between the photosphereand the solar corona. This magnetically structured layerplays an important role in transporting energy and massfrom the photosphere to the corona. The localized magneticfields and their complex structuring support the formationof various plasma jets (e.g. spicules, anemone jets, swirls),and also result in excitation, trapping, and conversion of var-ious magnetohydrodynamic (MHD) waves (e.g. Bonet et al.2008; De Pontieu et al. 2004, 2014; Harrison et al. 1995;Shibata et al. 2007; Srivastava et al. 2008; Vecchio et al.2007; Jelınek & Murawski 2013; Pascoe 2014; Tian et al.2014; Jelınek et al. 2015; Srivastava et al. 2017, and refer-ences therein).
The chromospheric mass supply and heating de-pend upon many localized and dynamical plasma pro-
cesses which include small-scale jets, swirls, and net-work jets (e.g. Wedemeyer-Bohm & Rouppe van der Voort2009; Murawski et al. 2011; Wedemeyer-Bohm et al. 2012;Tian et al. 2014; Rao et al. 2017; Giagkiozis et al. 2017,and references therein). Chromospheric swirls were con-sidered as potential heating and mass supply candidatesby Wedemeyer-Bohm et al. (2012) and their classificationand various morphologies (e.g. ring- and spiral-shapedswirls) was later established in the solar chromosphereby Wedemeyer et al. (2013). These swirls were found tobe driven by solar convective motions (e.g. Steiner et al.2010; Shelyag et al. 2011; Wedemeyer-Bohm et al. 2012).Murawski et al. (2014) proposed a new physical mechanismfor the generation of such chromospheric swirls. They re-ported that these ejecta are associated with the propagationof torsional Alfven waves which result in concentric magneticshells and vertical plasma flows in the non-linear regime.
These swirls and vortices are mostly associated with
c© 2017 RAS
2 K. Murawski et al.
the quiet Sun (QS), which is filled by granules at the photo-sphere and in magnetic networks. Central regions of granulesshow upflows while their edges (i.e. near the intergranularlanes) exhibit downflows, and the intermediate region expe-riences horizontal flows (e.g. Svanda et al. 2006; Zhao et al.2007; Verma & Denker 2011; Roudier et al. 2012, 2013;Svanda et al. 2013). Rieutord et al. (2001) found that hori-zontal plasma flows and granular/supergranular motions arehighly correlated at scales greater than 2.5 Mm. Eddies (i.e.vortex flows) in the intergranular lanes in the QS were re-ported by Brandt et al. (1988), which form due to convec-tive flows in the presence of magnetic flux tubes (i.e. mag-netic bright points; MBPs). It is well-established that thesevortex-like motions form due to the granular/supergranularhorizontal flows (e.g. Wang et al. 1995; Duvall & Gizon2000; Gizon & Duvall 2003; Bonet et al. 2008; Attie et al.2009, and references therein). Innes et al. (2009) detectedvortices in the inflow regions (i.e. intergranular lanes) by cal-culating horizontal plasma flows, which are plasma motionsfrom the centres of granules towards their edges. Similarly,Attie et al. (2009) detected vortex flow at the supergranularjunctions due to the horizontal plasma flow.
Interaction between vortex flow and magneticflux tubes may lead to the formation of chromo-spheric swirls as well as magnetic tornadoes (e.g.Wedemeyer-Bohm & Rouppe van der Voort 2009;Wedemeyer-Bohm et al. 2012; Wedemeyer et al. 2013).The formation of vortex flows and their role in triggeringvarious kind of MHD waves are fundamental questionsof solar physics. However, despite the availability ofhigh resolution observations in addition to advancednumerical simulations, the formation of these vortexflows and associated wave dynamics is not well under-stood up to now. Convective flow is the most widelyused mechanism to account for the vortex flow in thesolar photosphere (e.g. Brandt et al. 1988; Bonet et al.2008; Wedemeyer-Bohm & Rouppe van der Voort 2009;Wedemeyer-Bohm et al. 2012; Wedemeyer et al. 2013;Kitiashvili et al. 2013). Recently, Murawski et al. (2013)reported the formation of vortex flows which can betriggered by horizontal velocity flows. Buffeting of a fluxtube (i.e. interaction between a horizontal velocity pulse,mimicking the horizontal flow, and an isolated magneticflux tube, imitating an MBP in intergranular lanes) can leadto the formation of unique dipole-shaped swirls alongsidethe natural generation of kink and Alfven waves in thesimulations.
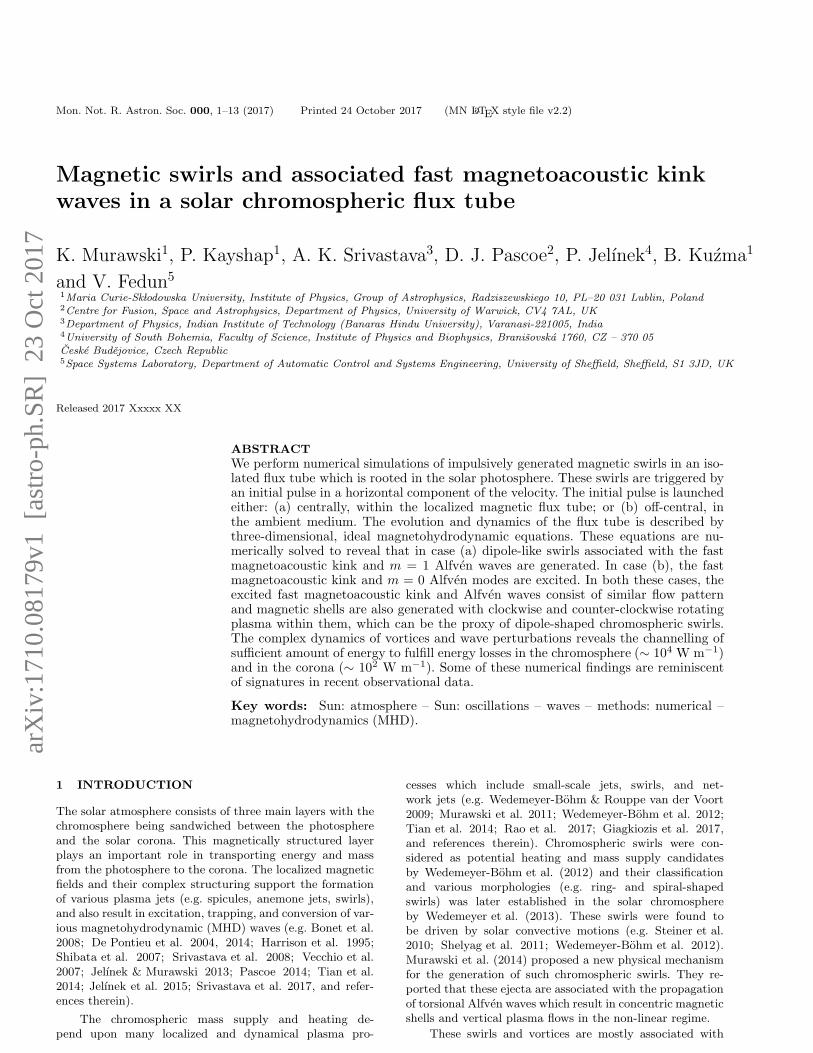
In this paper we investigate how changes in the hor-izontal flows (i.e. variations in strength, alterations of theinteraction region) can affect the behaviour of vortex mo-tions. To address this question, we consider the physicalimplications of the generation of double quadrupole chro-mospheric swirls in an isolated solar flux tube and theirassociation with kink and Alfven waves. This type of mo-tion was recently detected by Giagkiozis et al. (2017). Wefocus on two different locations for the horizontal velocitypulse with respect to the magnetic flux tube, as shown inFig. 1 which depicts a typical scenario in the QS solar pho-tosphere. Granules and intergranular lanes are representedby green and gray color patches, respectively. Plasma flowsfrom the central area of granules towards their edges (blackarrows). Red lines illustrate the isolated magnetic flux tube
Intergranular Lanes
Figure 1. Schematic of the general structure of granules (green)and intergranular lanes (gray) in a quiet Sun region of the so-lar photosphere. Black arrows show the plasma flows towards theedges of the granules. Red lines indicate a magnetic flux tube,which is located in the intergranular lane. To understand the for-mation of vortex motions we consider the two cases of buffeting byhorizontal flows in the central part of the flux tube (blue arrow),and at one edge of the flux tube (yellow arrow).
in an intergranular lane. In the first case, we simulate theinteraction between the flux tube and a centrally launchedhorizontal pulse at the top of the photosphere (blue arrow).In the second case, we use an off-center horizontal velocitypulse (yellow arrow). This paper is arranged as follows; wepresent our three-dimensional (3D) numerical model of thesolar atmosphere in Sect. 2 and describe the plasma dynam-ics resulting from the applied pulses in Sect. 3. A summaryand further discussion are presented in Sect. 4.
2 NUMERICAL MODEL
We consider a gravitationally-stratified solar atmospherewith an isolated magnetic flux tube that is described by theset of ideal, adiabatic, three-dimensional magnetohydrody-namic (MHD) equations in the Cartesian coordinate system.The set of governing equations are given as
∂
∂t+ ∇ · (V) = 0 , (1)
∂V
∂t+ (V · ∇)V = −∇p +
1
µ0
(∇×B) ×B + g , (2)
∂B
∂t= ∇× (V ×B) , ∇ ·B = 0 , (3)
∂p
∂t+ ∇ · (pV) = (1 − γ)p∇ ·V , p =
kBm
T . (4)
Here denotes the mass density, while V = (Vx, Vy, Vz) isthe velocity vector, and B = (Bx, By, Bz) is the magneticfield. The state of the plasma is also described by the gaspressure p and temperature T , while γ = 1.4 is the adiabaticindex, g = (0,−g⊙, 0) as the gravitational acceleration withmagnitude g⊙ = 274 ms−2, µ0 = 1.26 × 10⁻⁶ Hm−1 is themagnetic permeability of free space, and kB is the Boltz-mann constant. The symbol m represents the mean particle
c© 2017 RAS, MNRAS 000, 1–13
Magnetic swirls in a solar flux tube 3
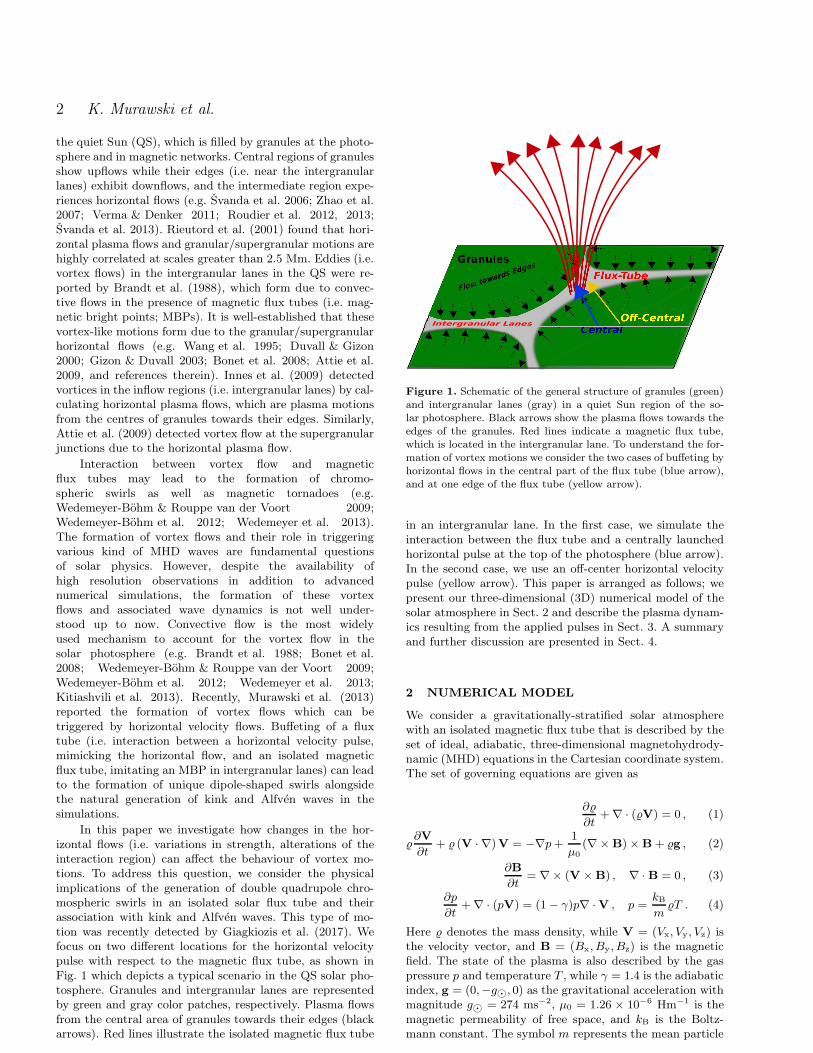
Figure 2. Equilibrium magnetic field lines. Red, green, and bluearrows correspond to the x-, y-, and z-axes, respectively. The sizeof the box shown is (−0.75, 0.75)×(0, 2.5)×(−0.75, 0.75) Mm andrepresents only part of the simulated region. The color map corre-sponds to the magnitude of the magnetic field which is expressedin units of By0 ≈ 11.4 G.
mass which is specified as the product of the mean molec-ular weight of 1.24 (Oskar Steiner; private communication)and the proton mass.
2.1 Initial equilibrium
We consider an axisymmetric magnetic flux tube which isdescribed in detail by Murawski et al. (2015a) who imple-mented the analytical theory developed by Solov’ev (2010)and Solov’ev & Kirichek (2015). The tube is initially non-twisted and the non-force-free magnetic field is representedby the azimuthal component of the magnetic flux function(A θ) as
B = ∇× (A θ) , (5)
where θ is a unit vector in the azimuthal direction. In theaxisymmetric case, we consider ∂/∂θ = 0. After this consid-eration, it follows from Eq. (5) that
Br = −∂A
∂y, Bθ = 0 , By =
1
r
∂(rA)
∂r, (6)
where r =√x2 + z2 is the radial coordinate in the horizontal
xz-plane. For our flux tube, we specify A(r, y) as
A(r, y) = B0 exp(
−k2yy
2) r
1 + k4r r4
+1
2By0r , (7)
where By0 is the magnitude of the ambient, vertical mag-netic field while kr and ky are the inverse length scales alongthe radial and vertical directions, respectively. We choose
and hold fixed kr = ky = 4 Mm−1 and the magnitude of themagnetic field B0 such that the magnetic field within the fluxtube, at r = 0 and y = 0, is ≈ 137 G, and By0 ≈ 11.4 G.The magnetic field lines corresponding to an isolated, non-twisted, axisymmetric magnetic flux tube are displayed inFig. 2.
The equilibrium mass density and plasma gas pressureare specified in Appendix and they are estimated using thetemperature profile given by Avrett & Loeser (2008). Thisprofile is smoothly extended above the transition region andinto the corona (see Murawski et al. 2015b for details).
2.2 Perturbations to the flux tube
Based on observations, it is natural to assume that the fluxtube is continuously buffeted by a number of perturbations.In our study we consider a simple case in which the pertur-bation to the magnetic field is modelled by a Gaussian pulsein the horizontal component of the velocity, Vx,
Vx(x, y, z, t = 0) = Av exp
[
− r2vw2
]
, (8)
where r2v = (x−x0)2 +(y−y0)2 +(z−z0)2, Av is the ampli-tude of the pulse, and (x0, y0, z0) and w are its initial posi-tion and width, respectively. We set and fix Av = 2 km s−1,w = 0.125 Mm, and y0 = 0.5 Mm. The value of y0 cor-responds to the top of the photosphere in our model solaratmosphere. The impulsive generation of fast MHD waves ina 2D magnetic funnel was modelled by Pascoe et al. (2013,2014). Earlier investigations, demonstrate that a pulse invelocity triggers waves and vortices (e.g. Murawski et al.2013). The impulsive perturbation given by Eq. (8) excitesMHD-gravity waves propagating in the solar atmosphere.
3 RESULTS
Equations (1)–(4) are solved numerically, using the FLASH
code (Lee and Deane 2009; Lee 2013) to investigate the ex-citation and the behaviour of double swirls in an isolatedmagnetic flux tube. For all our simulations we use a numer-ical domain of size (−1.25, 1.25) × (−1.25, 1.25) Mm in hor-izontal directions and (0, 20) Mm in vertical direction. Weimpose the chosen boundary conditions by fixing in timeall the plasma parameters to their equilibrium values. Thecoarse numerical grid used near the top of the domain actsas a sponge, diffusing incoming waves. The finest grids areused below the altitude y = 4 Mm, where the effective finestspatial resolution is ≈ 0.0195 Mm.
We consider two particular cases of Eq. (8) in this paper;a centrally-launched initial pulse which corresponds to x0 =z0 = 0 Mm, generating double swirls and associated waves,and an off-center initial pulse with x0 = 0 Mm and z0 =0.3 Mm, generating swirls and associated waves.
3.1 Perturbation by a centrally-launched pulse
Figure 3 shows snapshots of the velocity vectors at severaltimes after the initial pulse. They are taken at the chro-mospheric altitude i.e. y = 1.5 Mm. The chromosphereis an ideal location to investigate the swirl structures in
c© 2017 RAS, MNRAS 000, 1–13
4 K. Murawski et al.
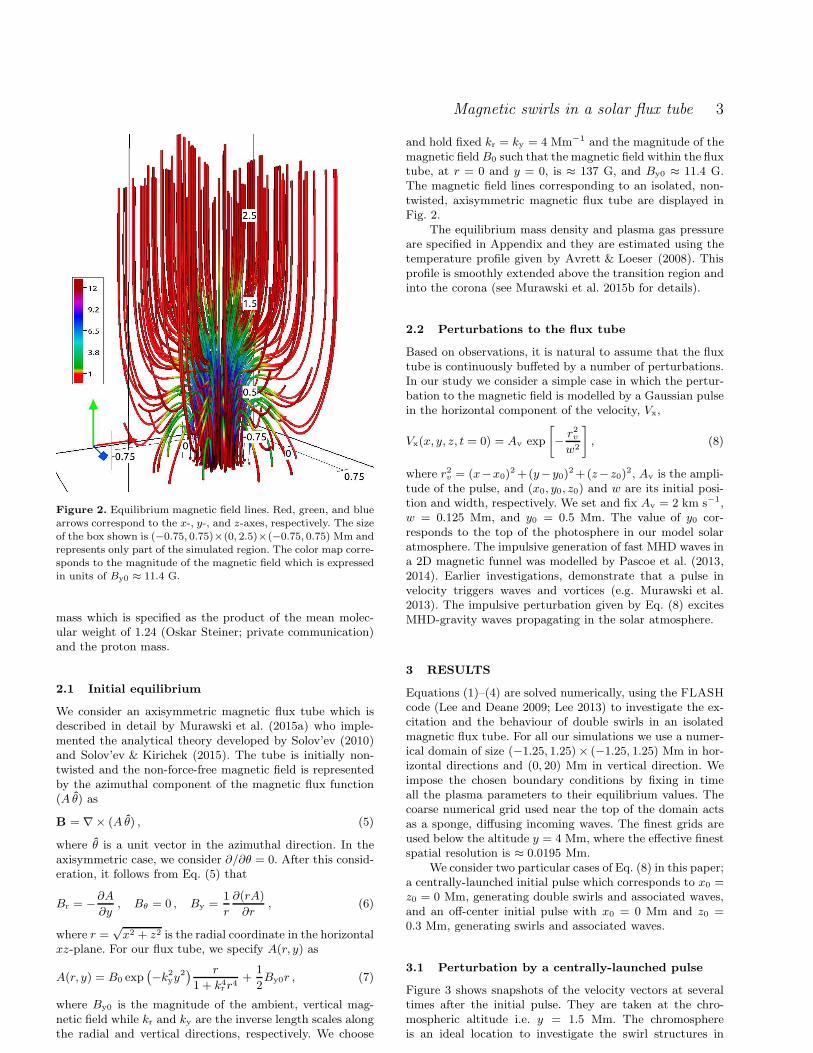
Figure 3. Snapshots of velocity vectors (in arbitrary units) shown at y = 1.5 Mm at times t = 125 s (top left), 200 s (top right), 300 s(bottom left), and 550 s (bottom right) for the case of the centrally-launched initial pulse.
the solar atmosphere (e.g. Wedemeyer-Bohm et al. 2012;Wedemeyer et al. 2013). Two confined vortices (i.e. swirl-like structures) are generated by the initial pulse. The topswirl rotates anti-clockwise while the bottom swirl rotatesclockwise, and the plasma flows reside within the area of theflux tube.
At t = 125 s (top left panel of Fig. 3) the swirls aremainly located at the center of the tube. The dipolar flowpattern corresponds to a transverse motion of the centralregion as produced by a m = 1 kink mode (e.g. Fig. 3of Pascoe et al. 2010). At t = 300 s (bottom left panel),four swirls (quadrupole type) are seen with the bottom leftone rotating clockwise and the bottom right one rotatingcounter-clockwise, suggesting that the m = 2 mode appears.The right pair of swirls result from the plasma reflectionfrom the right side of the flux tube after the horizontally
moving signal hits from the left side of the flux tube, andthese reflected swirls have the opposite rotation to thosewhich hit the right boundary. At the same time, uprisingswirling plasma motions are present at the left side. Finallyat t = 550 s (bottom right panel), two well developed swirlswith opposite rotating motions (top-swirl rotating clockwiseand bottom-swirl rotating anti-clockwise) are seen. It shouldbe noted that these two swirls are settled on the outer edgeof the flux tube, and the m = 1 mode reappears. So, thenumber of modes varies in time from m = 1 (Fig. 3, toppanels) to m = 2 (bottom-left) and back to m = 1 (bottom-right).
Figure 4 shows the spatial profiles of the transversalcomponent of velocity, Vz, which are displayed in the verti-cal plane, at z = 0.2 Mm. The center of the flux tube (i.e.z = 0.0 Mm) has not been chosen due to the presence of
c© 2017 RAS, MNRAS 000, 1–13
Magnetic swirls in a solar flux tube 5
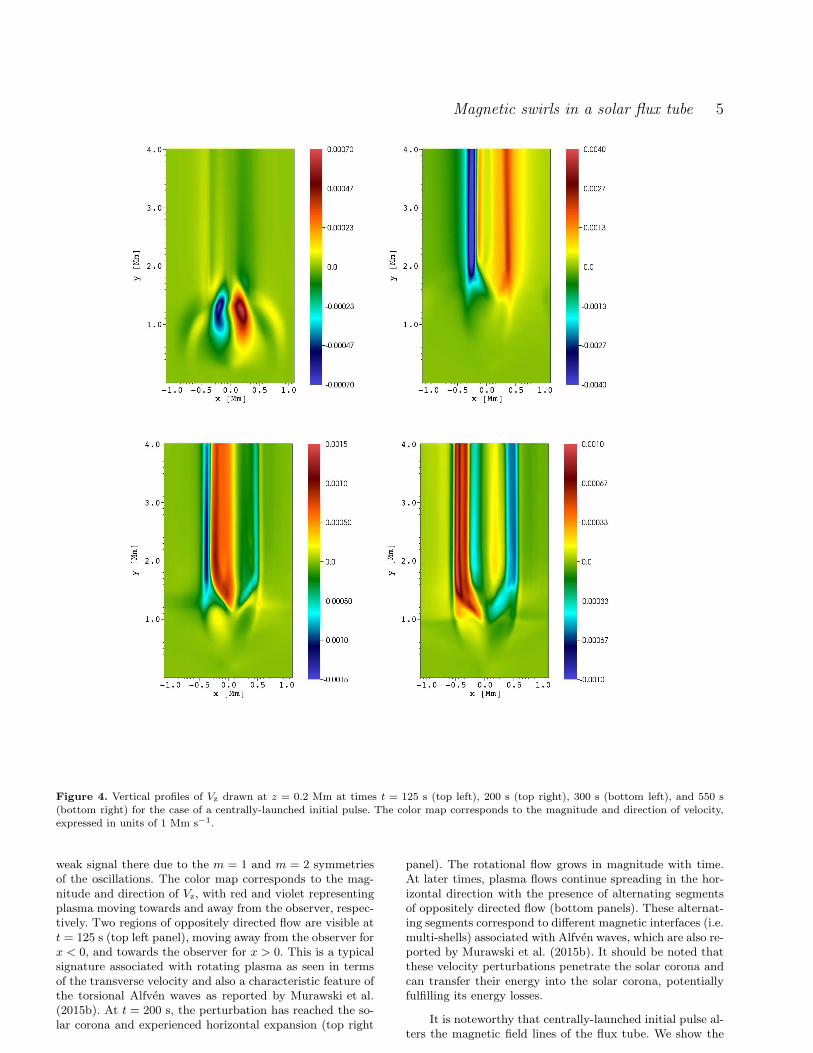
Figure 4. Vertical profiles of Vz drawn at z = 0.2 Mm at times t = 125 s (top left), 200 s (top right), 300 s (bottom left), and 550 s(bottom right) for the case of a centrally-launched initial pulse. The color map corresponds to the magnitude and direction of velocity,expressed in units of 1 Mm s−1.
weak signal there due to the m = 1 and m = 2 symmetriesof the oscillations. The color map corresponds to the mag-nitude and direction of Vz, with red and violet representingplasma moving towards and away from the observer, respec-tively. Two regions of oppositely directed flow are visible att = 125 s (top left panel), moving away from the observer forx < 0, and towards the observer for x > 0. This is a typicalsignature associated with rotating plasma as seen in termsof the transverse velocity and also a characteristic feature ofthe torsional Alfven waves as reported by Murawski et al.(2015b). At t = 200 s, the perturbation has reached the so-lar corona and experienced horizontal expansion (top right
panel). The rotational flow grows in magnitude with time.At later times, plasma flows continue spreading in the hor-izontal direction with the presence of alternating segmentsof oppositely directed flow (bottom panels). These alternat-ing segments correspond to different magnetic interfaces (i.e.multi-shells) associated with Alfven waves, which are also re-ported by Murawski et al. (2015b). It should be noted thatthese velocity perturbations penetrate the solar corona andcan transfer their energy into the solar corona, potentiallyfulfilling its energy losses.
It is noteworthy that centrally-launched initial pulse al-ters the magnetic field lines of the flux tube. We show the
c© 2017 RAS, MNRAS 000, 1–13
6 K. Murawski et al.
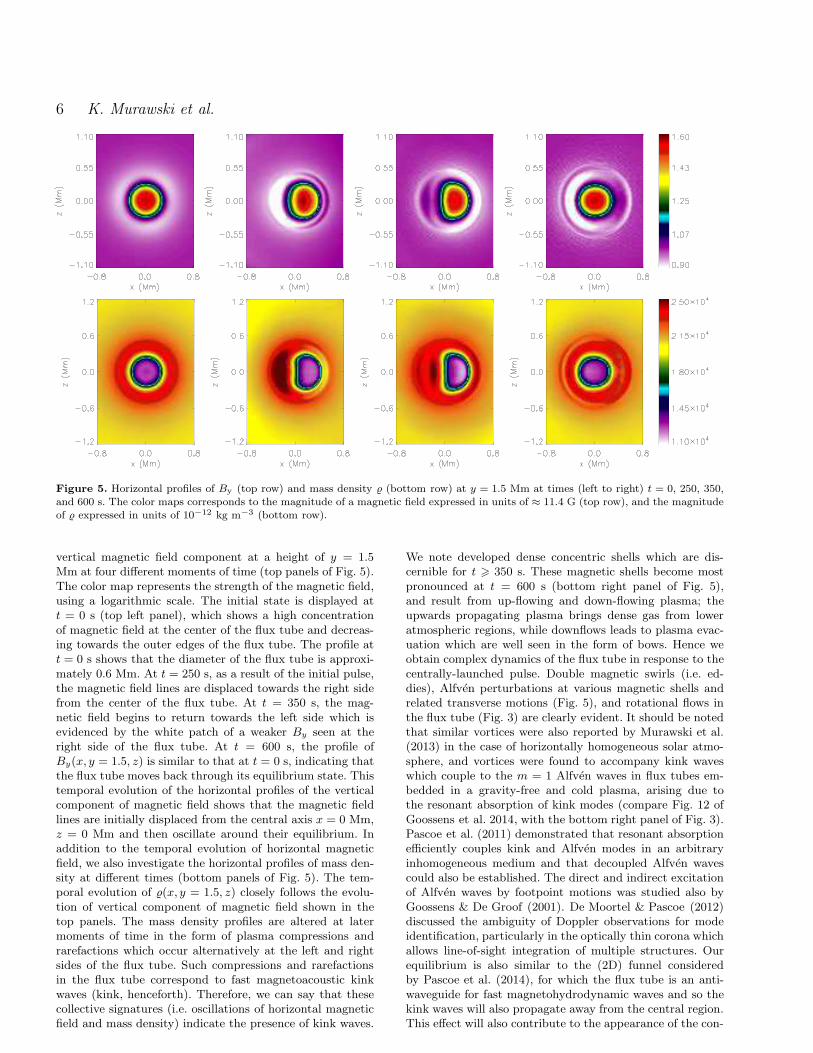
Figure 5. Horizontal profiles of By (top row) and mass density (bottom row) at y = 1.5 Mm at times (left to right) t = 0, 250, 350,and 600 s. The color maps corresponds to the magnitude of a magnetic field expressed in units of ≈ 11.4 G (top row), and the magnitudeof expressed in units of 10−12 kg m−3 (bottom row).
vertical magnetic field component at a height of y = 1.5Mm at four different moments of time (top panels of Fig. 5).The color map represents the strength of the magnetic field,using a logarithmic scale. The initial state is displayed att = 0 s (top left panel), which shows a high concentrationof magnetic field at the center of the flux tube and decreas-ing towards the outer edges of the flux tube. The profile att = 0 s shows that the diameter of the flux tube is approxi-mately 0.6 Mm. At t = 250 s, as a result of the initial pulse,the magnetic field lines are displaced towards the right sidefrom the center of the flux tube. At t = 350 s, the mag-netic field begins to return towards the left side which isevidenced by the white patch of a weaker By seen at theright side of the flux tube. At t = 600 s, the profile ofBy(x, y = 1.5, z) is similar to that at t = 0 s, indicating thatthe flux tube moves back through its equilibrium state. Thistemporal evolution of the horizontal profiles of the verticalcomponent of magnetic field shows that the magnetic fieldlines are initially displaced from the central axis x = 0 Mm,z = 0 Mm and then oscillate around their equilibrium. Inaddition to the temporal evolution of horizontal magneticfield, we also investigate the horizontal profiles of mass den-sity at different times (bottom panels of Fig. 5). The tem-poral evolution of (x, y = 1.5, z) closely follows the evolu-tion of vertical component of magnetic field shown in thetop panels. The mass density profiles are altered at latermoments of time in the form of plasma compressions andrarefactions which occur alternatively at the left and rightsides of the flux tube. Such compressions and rarefactionsin the flux tube correspond to fast magnetoacoustic kinkwaves (kink, henceforth). Therefore, we can say that thesecollective signatures (i.e. oscillations of horizontal magneticfield and mass density) indicate the presence of kink waves.
We note developed dense concentric shells which are dis-cernible for t > 350 s. These magnetic shells become mostpronounced at t = 600 s (bottom right panel of Fig. 5),and result from up-flowing and down-flowing plasma; theupwards propagating plasma brings dense gas from loweratmospheric regions, while downflows leads to plasma evac-uation which are well seen in the form of bows. Hence weobtain complex dynamics of the flux tube in response to thecentrally-launched pulse. Double magnetic swirls (i.e. ed-dies), Alfven perturbations at various magnetic shells andrelated transverse motions (Fig. 5), and rotational flows inthe flux tube (Fig. 3) are clearly evident. It should be notedthat similar vortices were also reported by Murawski et al.(2013) in the case of horizontally homogeneous solar atmo-sphere, and vortices were found to accompany kink waveswhich couple to the m = 1 Alfven waves in flux tubes em-bedded in a gravity-free and cold plasma, arising due tothe resonant absorption of kink modes (compare Fig. 12 ofGoossens et al. 2014, with the bottom right panel of Fig. 3).Pascoe et al. (2011) demonstrated that resonant absorptionefficiently couples kink and Alfven modes in an arbitraryinhomogeneous medium and that decoupled Alfven wavescould also be established. The direct and indirect excitationof Alfven waves by footpoint motions was studied also byGoossens & De Groof (2001). De Moortel & Pascoe (2012)discussed the ambiguity of Doppler observations for modeidentification, particularly in the optically thin corona whichallows line-of-sight integration of multiple structures. Ourequilibrium is also similar to the (2D) funnel consideredby Pascoe et al. (2014), for which the flux tube is an anti-waveguide for fast magnetohydrodynamic waves and so thekink waves will also propagate away from the central region.This effect will also contribute to the appearance of the con-
c© 2017 RAS, MNRAS 000, 1–13
Magnetic swirls in a solar flux tube 7
centric shells and the Alfven waves becoming stronger atlater times.
Figure 6 shows time signatures of Vx and Vz measuredat different detection points (left and middle panels). Thesesignatures reveal perturbations in which Vx dominates overVz at the flux tube center (left panel), but on the side of thetube, Vz is of a comparable magnitude to Vx (middle panel).The right panel illustrates (solid line) and Vy (dotted line),measured at (x = 0, y = 1.5, z = 0) Mm. We note that andVy are essentially correlated, being a sign of slow magnetoa-coustic waves and showing that upflow brings dense plasmafrom lower layers, while downwardly propagating plasma re-duces the mass density.
Hence we have shown the presence of Alfven and kinkwaves as well as slow magnetoacoustic waves in the flux tube.Alfven waves propagate into the solar corona (see Fig. 4).The flux tube used in our simulations consists a region ofenhanced Alfven speed and therefore it is an anti-waveguidefor kink waves, which are attenuated by leaking their energyto the ambient medium. However, the kink waves still playa significant role in distribution of energy into the upperatmosphere.
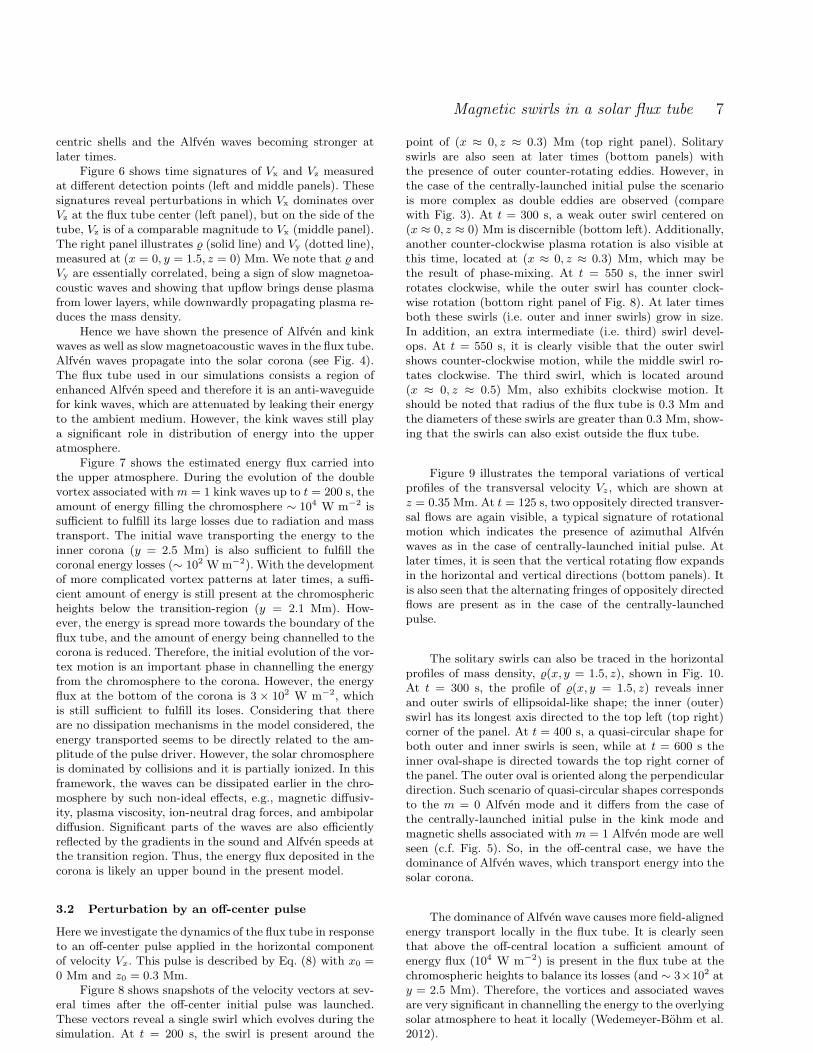
Figure 7 shows the estimated energy flux carried intothe upper atmosphere. During the evolution of the doublevortex associated with m = 1 kink waves up to t = 200 s, theamount of energy filling the chromosphere ∼ 104 W m−2 issufficient to fulfill its large losses due to radiation and masstransport. The initial wave transporting the energy to theinner corona (y = 2.5 Mm) is also sufficient to fulfill thecoronal energy losses (∼ 102 W m−2). With the developmentof more complicated vortex patterns at later times, a suffi-cient amount of energy is still present at the chromosphericheights below the transition-region (y = 2.1 Mm). How-ever, the energy is spread more towards the boundary of theflux tube, and the amount of energy being channelled to thecorona is reduced. Therefore, the initial evolution of the vor-tex motion is an important phase in channelling the energyfrom the chromosphere to the corona. However, the energyflux at the bottom of the corona is 3 × 10² W m−2, whichis still sufficient to fulfill its loses. Considering that thereare no dissipation mechanisms in the model considered, theenergy transported seems to be directly related to the am-plitude of the pulse driver. However, the solar chromosphereis dominated by collisions and it is partially ionized. In thisframework, the waves can be dissipated earlier in the chro-mosphere by such non-ideal effects, e.g., magnetic diffusiv-ity, plasma viscosity, ion-neutral drag forces, and ambipolardiffusion. Significant parts of the waves are also efficientlyreflected by the gradients in the sound and Alfven speeds atthe transition region. Thus, the energy flux deposited in thecorona is likely an upper bound in the present model.
3.2 Perturbation by an off-center pulse
Here we investigate the dynamics of the flux tube in responseto an off-center pulse applied in the horizontal componentof velocity Vx. This pulse is described by Eq. (8) with x0 =0 Mm and z0 = 0.3 Mm.
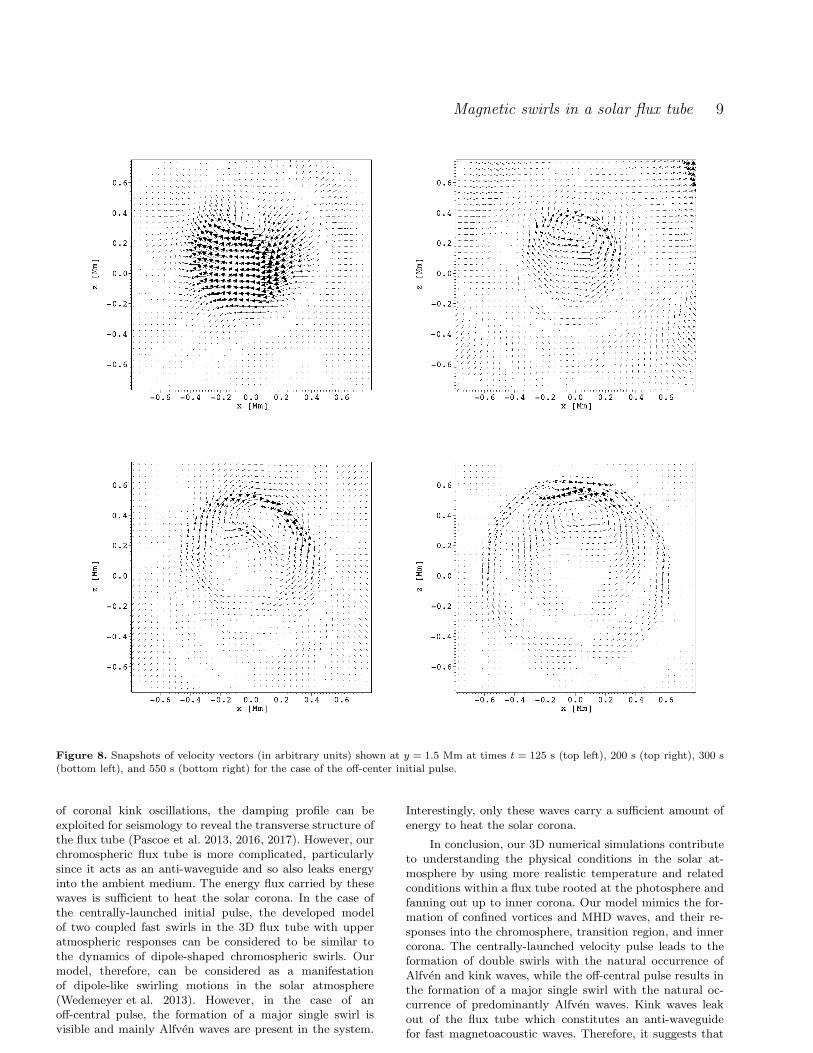
Figure 8 shows snapshots of the velocity vectors at sev-eral times after the off-center initial pulse was launched.These vectors reveal a single swirl which evolves during thesimulation. At t = 200 s, the swirl is present around the
point of (x ≈ 0, z ≈ 0.3) Mm (top right panel). Solitaryswirls are also seen at later times (bottom panels) withthe presence of outer counter-rotating eddies. However, inthe case of the centrally-launched initial pulse the scenariois more complex as double eddies are observed (comparewith Fig. 3). At t = 300 s, a weak outer swirl centered on(x ≈ 0, z ≈ 0) Mm is discernible (bottom left). Additionally,another counter-clockwise plasma rotation is also visible atthis time, located at (x ≈ 0, z ≈ 0.3) Mm, which may bethe result of phase-mixing. At t = 550 s, the inner swirlrotates clockwise, while the outer swirl has counter clock-wise rotation (bottom right panel of Fig. 8). At later timesboth these swirls (i.e. outer and inner swirls) grow in size.In addition, an extra intermediate (i.e. third) swirl devel-ops. At t = 550 s, it is clearly visible that the outer swirlshows counter-clockwise motion, while the middle swirl ro-tates clockwise. The third swirl, which is located around(x ≈ 0, z ≈ 0.5) Mm, also exhibits clockwise motion. Itshould be noted that radius of the flux tube is 0.3 Mm andthe diameters of these swirls are greater than 0.3 Mm, show-ing that the swirls can also exist outside the flux tube.
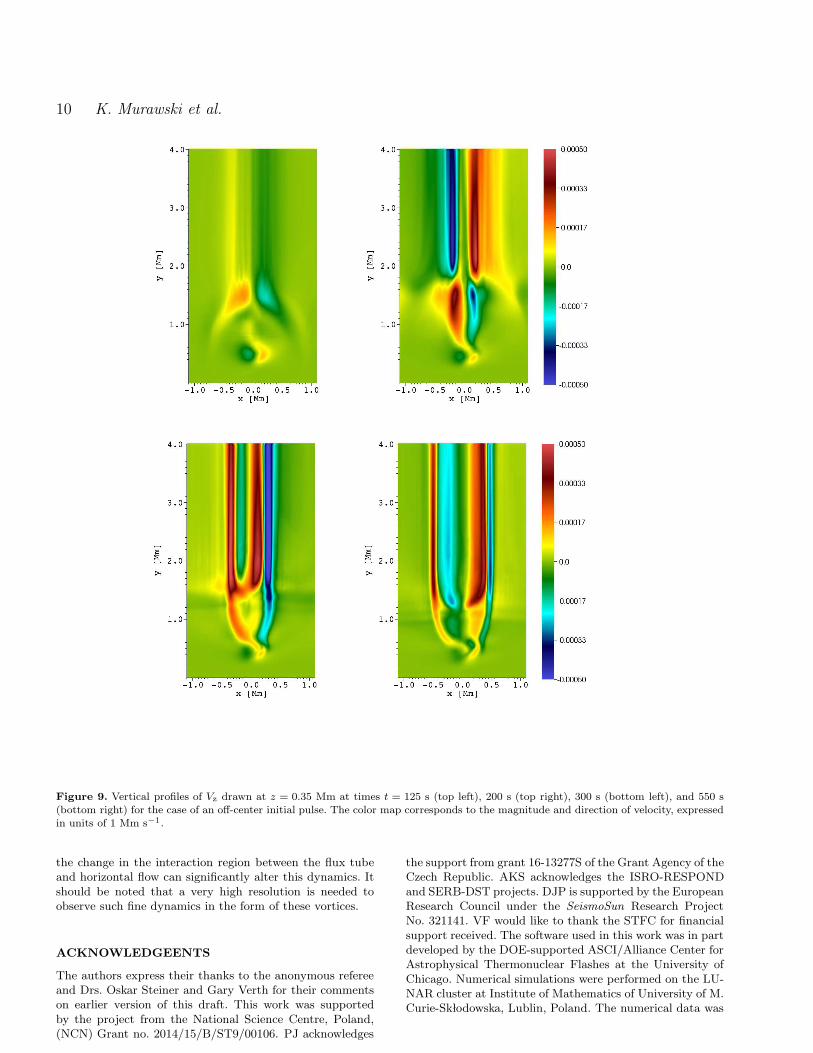
Figure 9 illustrates the temporal variations of verticalprofiles of the transversal velocity Vz, which are shown atz = 0.35 Mm. At t = 125 s, two oppositely directed transver-sal flows are again visible, a typical signature of rotationalmotion which indicates the presence of azimuthal Alfvenwaves as in the case of centrally-launched initial pulse. Atlater times, it is seen that the vertical rotating flow expandsin the horizontal and vertical directions (bottom panels). Itis also seen that the alternating fringes of oppositely directedflows are present as in the case of the centrally-launchedpulse.
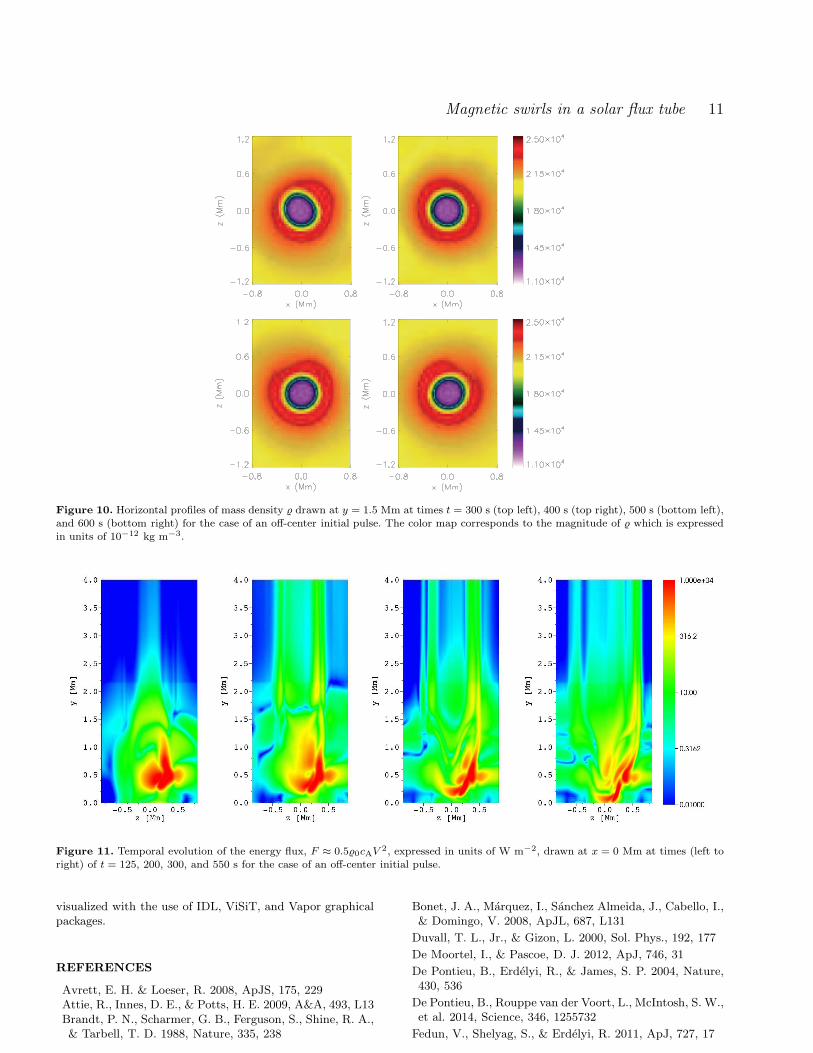
The solitary swirls can also be traced in the horizontalprofiles of mass density, (x, y = 1.5, z), shown in Fig. 10.At t = 300 s, the profile of (x, y = 1.5, z) reveals innerand outer swirls of ellipsoidal-like shape; the inner (outer)swirl has its longest axis directed to the top left (top right)corner of the panel. At t = 400 s, a quasi-circular shape forboth outer and inner swirls is seen, while at t = 600 s theinner oval-shape is directed towards the top right corner ofthe panel. The outer oval is oriented along the perpendiculardirection. Such scenario of quasi-circular shapes correspondsto the m = 0 Alfven mode and it differs from the case ofthe centrally-launched initial pulse in the kink mode andmagnetic shells associated with m = 1 Alfven mode are wellseen (c.f. Fig. 5). So, in the off-central case, we have thedominance of Alfven waves, which transport energy into thesolar corona.
The dominance of Alfven wave causes more field-alignedenergy transport locally in the flux tube. It is clearly seenthat above the off-central location a sufficient amount ofenergy flux (104 W m−2) is present in the flux tube at thechromospheric heights to balance its losses (and ∼ 3×10² aty = 2.5 Mm). Therefore, the vortices and associated wavesare very significant in channelling the energy to the overlyingsolar atmosphere to heat it locally (Wedemeyer-Bohm et al.2012).
c© 2017 RAS, MNRAS 000, 1–13
8 K. Murawski et al.
Figure 6. Time signatures created by a centrally-launched pulse for: (a) left panel: Vx (solid line) and Vz (dotted line) measured at thedetection point (x = 0, y = 1.5, z = 0) Mm; (b) middle panel: Vx (solid line) and Vz (dotted line) measured at (x = 0.2, y = 1.5, z =0.2) Mm (middle); (c) right panel: (solid line) and Vy (dotted line) measured at (x = 0, y = 1.5, z = 0) Mm.
Figure 7. Temporal evolution of the energy flux, F ≈ 0.50cAV 2, expressed in units of W m−2, drawn at x = 0 Mm at times (left toright) of t = 125, 200, 300, and 550 s for the case of a centrally launched initial pulse.
4 SUMMARY
This paper presents the stringent 3D numerical modeling ofa solar flux tube with an adaptation of the FLASH code,which in the case of centrally-launched initial pulse in thehorizontal component of velocity, demonstrates the genera-tion of two coupled fast magnetic swirls which are associatedwith coupled kink, m = 1 or m = 2 Alfven waves in the so-lar flux tube. In the case of the off-centrally-launched initialpulse the m = 0 Alfven mode and kink waves are triggered.
As a result of the presence of various magneticstructures, the solar photosphere is a very complex dy-namic region. Horizontal plasma flows are an integralpart of the solar photosphere and they are responsible forvarious kind of dynamics there (e.g. Svanda et al. 2006;Zhao et al. 2007; Verma & Denker 2011; Roudier et al.2012, 2013; Svanda et al. 2013). Vortex structures arecomplex phenomena and have attracted significantattention in this high resolution era of observations(e.g. Wedemeyer-Bohm & Rouppe van der Voort 2009;Wedemeyer-Bohm et al. 2012; Wedemeyer et al. 2013, andreferences therein). In the context of the formation ofthese vortex structures, which is crucial to reveal their
nature and associated dynamics in the solar atmosphere,convective flow is the most promising mechanism to accountfor their generation (e.g. Brandt et al. 1988; Bonet et al.2008; Wedemeyer-Bohm & Rouppe van der Voort 2009;Wedemeyer-Bohm et al. 2012; Wedemeyer et al. 2013). Itis also reported that these vortex structures can efficientlygenerate MHD waves (e.g. Erdelyi & Fedun 2007; Jess et al.2009; Fedun et al. 2011). However, Murawski et al. (2013)proposed a unified model based on the interaction of a fluxtube with a horizontal flow that can produce vortex struc-tures as well as MHD waves. Here, we have explored thisunified model of vortex formation in two different scenarios.In the case of the centrally-launched initial velocity pulse,the double swirls along with some intermediate complexmotions (i.e. formation of four swirls) result from a meretransversal perturbation. These double swirls are to somedegree similar to the velocity field structure detected bySteiner & Rezaei (2012). Alfven as well as kink waves arealso triggered along with the formation of double swirlsdue to the interaction between the flux tube and horizontalflows. The Alfven waves reach the solar corona, while thekink waves are attenuated as they propagate. In the case
c© 2017 RAS, MNRAS 000, 1–13
Magnetic swirls in a solar flux tube 9
Figure 8. Snapshots of velocity vectors (in arbitrary units) shown at y = 1.5 Mm at times t = 125 s (top left), 200 s (top right), 300 s(bottom left), and 550 s (bottom right) for the case of the off-center initial pulse.
of coronal kink oscillations, the damping profile can beexploited for seismology to reveal the transverse structure ofthe flux tube (Pascoe et al. 2013, 2016, 2017). However, ourchromospheric flux tube is more complicated, particularlysince it acts as an anti-waveguide and so also leaks energyinto the ambient medium. The energy flux carried by thesewaves is sufficient to heat the solar corona. In the case ofthe centrally-launched initial pulse, the developed modelof two coupled fast swirls in the 3D flux tube with upperatmospheric responses can be considered to be similar tothe dynamics of dipole-shaped chromospheric swirls. Ourmodel, therefore, can be considered as a manifestationof dipole-like swirling motions in the solar atmosphere(Wedemeyer et al. 2013). However, in the case of anoff-central pulse, the formation of a major single swirl isvisible and mainly Alfven waves are present in the system.
Interestingly, only these waves carry a sufficient amount ofenergy to heat the solar corona.
In conclusion, our 3D numerical simulations contributeto understanding the physical conditions in the solar at-mosphere by using more realistic temperature and relatedconditions within a flux tube rooted at the photosphere andfanning out up to inner corona. Our model mimics the for-mation of confined vortices and MHD waves, and their re-sponses into the chromosphere, transition region, and innercorona. The centrally-launched velocity pulse leads to theformation of double swirls with the natural occurrence ofAlfven and kink waves, while the off-central pulse results inthe formation of a major single swirl with the natural oc-currence of predominantly Alfven waves. Kink waves leakout of the flux tube which constitutes an anti-waveguidefor fast magnetoacoustic waves. Therefore, it suggests that
c© 2017 RAS, MNRAS 000, 1–13
10 K. Murawski et al.
Figure 9. Vertical profiles of Vz drawn at z = 0.35 Mm at times t = 125 s (top left), 200 s (top right), 300 s (bottom left), and 550 s(bottom right) for the case of an off-center initial pulse. The color map corresponds to the magnitude and direction of velocity, expressedin units of 1 Mm s−1.
the change in the interaction region between the flux tubeand horizontal flow can significantly alter this dynamics. Itshould be noted that a very high resolution is needed toobserve such fine dynamics in the form of these vortices.
ACKNOWLEDGEENTS
The authors express their thanks to the anonymous refereeand Drs. Oskar Steiner and Gary Verth for their commentson earlier version of this draft. This work was supportedby the project from the National Science Centre, Poland,(NCN) Grant no. 2014/15/B/ST9/00106. PJ acknowledges
the support from grant 16-13277S of the Grant Agency of theCzech Republic. AKS acknowledges the ISRO-RESPONDand SERB-DST projects. DJP is supported by the EuropeanResearch Council under the SeismoSun Research ProjectNo. 321141. VF would like to thank the STFC for financialsupport received. The software used in this work was in partdeveloped by the DOE-supported ASCI/Alliance Center forAstrophysical Thermonuclear Flashes at the University ofChicago. Numerical simulations were performed on the LU-NAR cluster at Institute of Mathematics of University of M.Curie-Sk lodowska, Lublin, Poland. The numerical data was
c© 2017 RAS, MNRAS 000, 1–13
Magnetic swirls in a solar flux tube 11
Figure 10. Horizontal profiles of mass density drawn at y = 1.5 Mm at times t = 300 s (top left), 400 s (top right), 500 s (bottom left),and 600 s (bottom right) for the case of an off-center initial pulse. The color map corresponds to the magnitude of which is expressedin units of 10−12 kg m−3.
Figure 11. Temporal evolution of the energy flux, F ≈ 0.50cAV 2, expressed in units of W m−2, drawn at x = 0 Mm at times (left toright) of t = 125, 200, 300, and 550 s for the case of an off-center initial pulse.
visualized with the use of IDL, ViSiT, and Vapor graphicalpackages.
REFERENCES
Avrett, E. H. & Loeser, R. 2008, ApJS, 175, 229Attie, R., Innes, D. E., & Potts, H. E. 2009, A&A, 493, L13Brandt, P. N., Scharmer, G. B., Ferguson, S., Shine, R. A.,& Tarbell, T. D. 1988, Nature, 335, 238
Bonet, J. A., Marquez, I., Sanchez Almeida, J., Cabello, I.,& Domingo, V. 2008, ApJL, 687, L131
Duvall, T. L., Jr., & Gizon, L. 2000, Sol. Phys., 192, 177
De Moortel, I., & Pascoe, D. J. 2012, ApJ, 746, 31
De Pontieu, B., Erdelyi, R., & James, S. P. 2004, Nature,430, 536
De Pontieu, B., Rouppe van der Voort, L., McIntosh, S. W.,et al. 2014, Science, 346, 1255732
Fedun, V., Shelyag, S., & Erdelyi, R. 2011, ApJ, 727, 17
c© 2017 RAS, MNRAS 000, 1–13
12 K. Murawski et al.
Erdelyi, R., & Fedun, V. 2007, Science, 318, 1572Giagkiozis, I., Fedun, V., Scullion, E.,Verth, G. 2017, A&A, submitted,http://adsabs.harvard.edu/abs/2017arXiv170605428G
Gizon, L., & Duvall, T. L., Jr. 2003, GONG+ 2002. Localand Global Helioseismology: the Present and Future, 517,43
Goossens, M., & De Groof, A. 2001, Physics of Plasmas, 8,2371
Goossens, M., Soler, R., Terradas, J., Van Doorsselaere, T.,& Verth, G. 2014, ApJ, 788, 9
Harrison, R. A., Sawyer, E. C., Carter, M. K., et al. 1995,Sol. Phys., 162, 233
Innes, D. E., Genetelli, A., Attie, R., & Potts, H. E. 2009,A&A, 495, 319
Jelınek, P. & Murawski, K. 2013, MNRAS, 434, 2347Jelınek, P., Srivastava, A. K., Murawski, K., Kayshap, P.,& Dwivedi, B. N. 2015, A&A, 581, A131
Jess, D. B., Mathioudakis, M., Erdelyi, R., et al. 2009, Sci-ence, 323, 1582
Kitiashvili, I. N., Kosovichev, A. G., Lele, S. K., Mansour,N. N., Wray, A. A. 2013, ApJ, 770, 37K
Murawski, K., Srivastava, A. K., & Zaqarashvili, T. V.2011, A&A, 535, A58
Murawski, K., Ballai, I., Srivastava, A. K., & Lee, D. 2013,MNRAS, 436, 1268
Murawski, K., Srivastava, A. K., & Musielak, Z. E. 2014,ApJ, 788, 8
Murawski, K., Solov’ev, A., Musielak, Z. E., Srivastava,A. K., & Kraskiewicz, J. 2015a, A&A, 577, A126
Murawski, K., Srivastava, A. K., Musielak, Z. E., &Dwivedi, B. N. 2015b, ApJ, 808, 5
Pascoe, D. J. 2014, Research in Astronomy and Astro-physics, 14, 805-830
Pascoe, D. J., Wright, A. N., & De Moortel, I. 2010, ApJ,711, 990
Pascoe, D. J., Wright, A. N. & De Moortel, I. 2011, ApJ,731, 73
Pascoe, D. J., Hood, A. W., De Moortel, I., & Wright, A. N.2013, A&A, 551, A40
Pascoe, D. J., Nakariakov, V. M., & Kupriyanova, E. G.2013, A&A, 560, A97
Pascoe, D. J., Nakariakov, V. M., & Kupriyanova, E. G.2014, A&A, 568, A20
Pascoe, D. J., Goddard, C. R., Nistico, G., Anfinogentov,S., & Nakariakov, V. M. 2016, A&A, 589, A136
Pascoe, D. J., Anfinogentov, S., Nistico, G., Goddard,C. R., & Nakariakov, V. M. 2017, A&A, 600, A78
Rieutord, M., Roudier, T., Ludwig, H.-G., Nordlund, A.,& Stein, R. 2001, A&A, 377, L14
Rao, Y.K., Srivastava, A.K., Doyle, J.G., Dwivedi, B.N.2017, MNRAS, in press
Roudier, T., Rieutord, M., Malherbe, J. M., et al. 2012,A&A, 540, A88
Roudier, T., Rieutord, M., Prat, V., et al. 2013, A&A, 552,A113
Shelyag, S., Keys, P., Mathioudakis, M., & Keenan, F. P.2011, A&A, 526, A5
Shibata, K., Nakamura, T., Matsumoto, T., et al. 2007,Science, 318, 1591
Solov’ev, A. A. 2010, Astronomy Reports, 54, 86Solov’ev, A. A. & Kirichek, E. A. 2015, Astronomy Letters,
41, 211Srivastava, A. K., Kuridze, D., Zaqarashvili, T. V., &Dwivedi, B. N. 2008, A&A, 481, L95
Srivastava, A. K., Shetye, J., Murawski, K., et al. 2017,Scientific Reports, 7, 43147
Steiner, O., Franz, M., Bello Gonzalez, N., et al. 2010,ApJL, 723, L180
Steiner, O. & Rezaei, R. 2012, in Astronomical Society ofthe Pacific Conference Series, Vol. 456, Fifth Hinode Sci-ence Meeting, ed. L. Golub, I. De Moortel, & T. Shimizu,3
Svanda, M., Klvana, M., & Sobotka, M. 2006, A&A, 458,301
Svanda, M., Roudier, T., Rieutord, M., Burston, R., & Gi-zon, L. 2013, ApJ, 771, 32
Tian, H., DeLuca, E. E., Cranmer, S. R., et al. 2014, Sci-ence, 346, 1255711
Vecchio, A., Cauzzi, G., Reardon, K. P., Janssen, K., &Rimmele, T. 2007, A&A, 461, L1
Verma, M., & Denker, C. 2011, A&A, 529, A153Wang, Y., Noyes, R. W., Tarbell, T. D., & Title, A. M.1995, ApJ, 447, 419
Wedemeyer, S., Scullion, E., Steiner, O., de la Cruz Ro-driguez, J., & Rouppe van der Voort, L. H. M. 2013, Jour-nal of Physics Conference Series, 440, 012005
Wedemeyer-Bohm, S. & Rouppe van der Voort, L. 2009,A&A, 503, 225
Wedemeyer-Bohm, S., Scullion, E., Steiner, O., et al. 2012,Nature, 486, 505
Zhao, J., Georgobiani, D., Kosovichev, A. G., et al. 2007,ApJ, 659, 848
APPENDIX A: EQUILIBRIUM PLASMA
PRESSURE AND MASS DENSITY
The equilibrium plasma pressure and mass density are de-scribed by the following formulas (Solov’ev 2010; Solov’ev& Kirichek 2015; Murawski et al. 2015a):
p(r, y) = ph(y) − 1
µ
[
1
2r2
(
∂Ψ
∂r
)2
+
∫ r
∞
∂2Ψ
∂y2
∂Ψ
∂r
dr
r2
]
, (A1)
(r, y) = h(y)
+1
µg
∂
∂y
[
1
2r2
(
(
∂Ψ
∂r
)2
−(
∂Ψ
∂y
)2)
+
∫ r
∞
∂2Ψ
∂y2
∂Ψ
∂r
dr
r2
]
(A2)
− 1
µgr
∂Ψ
∂y
∂
∂r
(
1
r
∂Ψ
∂r
)
,
where
Ψ(r, y) =
∫ r
0
Byr′dr′ , (A3)
is the normalized (by 2π) magnetic flux function, and hy-drostatic gas pressure ph and mass density h are given by
ph(y) = p0 exp
[
−∫ y
yr
dy′
Λ(y′)
]
, h(y) =ph(y)
gΛ(y)(A4)
with
Λ(y) =kBTh(y)
mg(A5)
c© 2017 RAS, MNRAS 000, 1–13

Magnetic swirls in a solar flux tube 13
being the pressure scale-height that we specify by adoptingthe semi-empirical model of plasma temperature brought byAvrett and Loeser (2008).
This paper has been typeset from a TEX/ LaTEX file preparedby the author.
c© 2017 RAS, MNRAS 000, 1–13


![APPLIED PHYSICS Copyright © 2020 High-frequency ......This strain-spin coupling leads to a magnetoacoustic resonance in perpendicular magnetic [Co/Pd] n multilayers, reaching frequencies](https://img.pdfslide.us/doc/110x75/60ed464074e5d96f4d36b22e/applied-physics-copyright-2020-high-frequency-this-strain-spin-coupling.jpg)