Embed Size (px)
Citation preview
http://aja.sagepub.com/Other Dementias
American Journal of Alzheimer's Disease and
http://aja.sagepub.com/content/early/2013/07/02/1533317513495106The online version of this article can be found at:
DOI: 10.1177/1533317513495106
published online 2 July 2013AM J ALZHEIMERS DIS OTHER DEMENWu
Yan-Yan Liu, Zhong-Xian Yang, Zhi-Wei Shen, Ye-Yu Xiao, Xiao-Fang Cheng, Wei Chen, Yao-Wen Chen and Ren-HuaCognitive Impairment With No Dementia
Magnetic Resonance Spectroscopy Study of Amnestic Mild Cognitive Impairment and Vascular
Published by:
http://www.sagepublications.com
can be found at:American Journal of Alzheimer's Disease and Other DementiasAdditional services and information for
http://aja.sagepub.com/cgi/alertsEmail Alerts:
http://aja.sagepub.com/subscriptionsSubscriptions:
http://www.sagepub.com/journalsReprints.navReprints:
http://www.sagepub.com/journalsPermissions.navPermissions:
What is This?
- Jul 2, 2013OnlineFirst Version of Record >>
at UNIV ARIZONA LIBRARY on July 5, 2014aja.sagepub.comDownloaded from at UNIV ARIZONA LIBRARY on July 5, 2014aja.sagepub.comDownloaded from
Current Topics in Research
Magnetic Resonance Spectroscopy Studyof Amnestic Mild Cognitive Impairmentand Vascular Cognitive Impairment WithNo Dementia
Yan-Yan Liu, MD1, Zhong-Xian Yang, MD1, Zhi-Wei Shen, PhD1,Ye-Yu Xiao, MD1, Xiao-Fang Cheng, MD1, Wei Chen, MD2,Yao-Wen Chen, PhD1, and Ren-Hua Wu, PhD1,3
AbstractAmnestic mild cognitive impairment (aMCI) and vascular cognitive impairment with no dementia (VCIND) are highly predictive ofAlzheimer’s disease and vascular dementia. In this study, a 2-dimensional magnetic resonance spectroscopy was performed in 25patients with aMCI, 28 patients with VCIND, and 32 normal controls (NCs). The concentrations of N-acetyl aspartate (NAA),choline (Cho), myoinositol (MI), and creatine (Cr) were measured, and their ratios were calculated. The patients with aMCI dis-played significantly lower NAA/MI bilaterally in the posterior cingulate gyrus (PCG) and white matter of occipital lobe (OLWM)than NC participants or patients with VCIND , whereas patients with VCIND displayed markedly lower NAA/Cho bilaterally inthe white matter of frontal lobe (FLWM) and left OLWM, and right dorsal thalamus (DT) than patients with NC or aMCI. Com-pared with the controls, patients with aMCI displayed lower NAA and NAA/Cr in bilateral PCG, left precuneus, and DT, whereaspatients with VCIND displayed lower NAA/Cr in bilateral DT and FLWM. In addition, increased MI in right PCG of patients withaMCI and increased Cho in left FLWM of patients with VCIND were also observed. The results might help guide a clinical differ-entiation between the 2 disorders.
KeywordsMR spectroscopy, amnesic mild cognitive impairment, vascular cognitive impairment with no dementia
Introduction
Amnestic mild cognitive impairment (aMCI) refers to nonde-
mented individuals with memory complaints and objective
memory impairment, and has been shown consistently to have
a higher risk for developing Alzheimer’s disease (AD),1 with
almost 50% of these patients progressing to AD after 3 years.2
It is well known that AD is the most common cause of dem-
entia, with vascular dementia (VaD) being the second leading
cause.3 Vascular cognitive impairment with no dementia
(VCIND) describes those individuals whose symptoms are
associated with substantial functional impairment, but do not
meet the dementia criteria, and include a high proportion of
individuals with subcortical ischemia with cognitive impair-
ment of presumed cerebral vascular disease.4 Patients with
VCIND have a high risk of progression to dementia, mixed pri-
mary neurodegenerative dementia with vascular dementia, or
vascular dementia, particularly if they have recurrent stroke.5
Magnetic resonance (MR) spectroscopy (MRS) concurrently
measures brain metabolites, such as N-acetylaspartate (NAA),
myoinositol (MI), choline-containing compounds (Cho), and
total creatine. Previous studies performed with single-voxel
proton MRS on patients with mild cognitive impairment (MCI)
have demonstrated increases in the concentration of MI or the
MI/Cr ratio and decreases of NAA or the NAA/Cr ratio in the
hippocampus, posterior cingulate, occipital lobe white matter,
and parietotemporal cortex.6-8 Compared to patients with MCI
or AD, patients with VaD exhibit global reductions in NAA/Cr
ratio in the parietal gray and white matter, frontal white matter,
and the temporal lobe.9 Despite the etiologies of aMCI and
VCIND are different and a significant number of patients with
1 Department of Medical Imaging Center, the Second Affiliated Hospital,
Medical College of Shantou University, Shantou, China2 Department of Neurology, the Second Affiliated Hospital, Medical College of
Shantou University, Shantou, China3 Provincial Key Laboratory of Medical Molecular Imaging, Guangdong,
Shantou, China
Corresponding Author:
Ren-Hua Wu, PhD, Department of Medical Imaging Center, The Second
Affiliated Hospital, Medical College of Shantou University, Shantou 515041,
People’s Republic of China.
Email: [email protected]
American Journal of Alzheimer’sDisease & Other Dementias®
00(0) 1-8ª The Author(s) 2013Reprints and permission:sagepub.com/journalsPermissions.navDOI: 10.1177/1533317513495106aja.sagepub.com
at UNIV ARIZONA LIBRARY on July 5, 2014aja.sagepub.comDownloaded from
dementia may be with both etiologies, it is also important to
differentiate between aMCI and VCIND, because it could limit
the possible accuracy of research in prevention, risk factors,
and treatment of dementia.
The present study aimed to evaluate and characterize the
metabolic markers in patients with aMCI and VCIND compared
to normal control (NC) participants using 2-dimensional (2D)
chemical shift imaging proton MRS, and to assess proton MRS
(1H-MRS) alterations by positioning 10 volumes of interest in
the brain to study the metabolic changes.
Methods
Participants
We recruited 85 elderly individuals comprised of 25 patients
with aMCI, 28 patients with VCIND, and 32 NC participants
through the Department of Neurological Clinic Service and
Medical Examination Center in our hospital. All participants
were right-handed, and demographic information for those
completing the study is shown in Table 1. This study was per-
formed with institutional review board approval. All partici-
pants and caregivers of the patients with aMCI, patients with
VCIND, and NC provided written informed consent prior to
MRS examination.
Criteria for aMCI, VCIND, and NC
Patients diagnosed with aMCI met the operational criteria pro-
posed by Petersen et al,10 which included: memory complaint,
confirmed by an informant; abnormal memory function, docu-
mented by extensive neuropsychological evaluation; normal
general cognitive function, as determined by both the clinical
dementia rating scale (CDR with at least 0.5 in the memory
domain) and mini-mental state examination (MMSE greater
than or equal to 24); no impairment in functional activities of
daily living, as determined by a clinical interview with the
patient and informant; insufficient impairment, cognitively and
functionally, to meet National Institute of Neurological and
Communicative Diseases and Stroke-Alzheimer’s Disease
and Related Disorders Association criteria for AD. Neuropsy-
chological testing included a Hachinski ischemic (HIS) score
(HIS score less than or equal to 4) and Montreal cognitive
assessment score (MoCA, Beijing Version, greater than or
equal to 24).
Diagnosis of VCIND depended on the following cri-
teria11,12: insufficient cognitive impairment to meet the Diag-
nostic and Statistical Manual of Mental Disorders (Fourth
Edition, Text Revision) criteria for dementia; vascular etiology
as follows: (a) cognitive impairment caused by cardiovascular
risk factors, (b) cognitive impairment caused by strategic
infarct or multiple infarcts indicated by a sudden onset or step-
wise progression and responsible lesions on MR imaging
(MRI) or computed tomography scans, and (c) cognitive
impairment due to subcortical small vessel disease suggested
by minor neurological signs (such as hemiparesis, lower facial
weakness, Babinski sign, sensory deficit, dysarthria, gait disor-
der, urine urgency, or motor slowness), moderate white matter
changes (at least 1 region score <2 according to the Wahlund
rating scale), and/or multiple lacunar infarcts (<2) on brain
imaging. Neuropsychological testings for aMCI, the MoCA
scoring, and HIS determination (HIS greater than 7) were also
performed.
The criteria for the selection of NC were no history of either
cognitive decline, neurological or psychiatric disorders, uncon-
trolled systemic medical disorders, or abnormal findings in
conventional brain MRI.
MR Spectroscopy
The 2D-CSI 1H-MRS studies were performed in all partici-
pants. All data were acquired on a standard 1.5 T GE scanner
(Signa; General Electric Medical Systems, HDx Twinspeed,
Wisconsin) using a standard eight-channel head coil. Axial fast
FSE T2-weighted images (slice thickness: 5 mm, field of view
[FOV]: 16 cm � 16 cm) were then acquired prior to spectro-
scopic acquisition at the basal ganglia level for MRS acquisi-
tion. The total regions of interest (ROIs) of the multivoxel
section were about 192 cm3 (12 cm � 8 cm � 2 cm: anterior
to posterior, left to right, thickness). A 2D-CSI 1H-MRS point
resolved spectroscopy (PRESS) pulse sequence (echo time ¼35 ms, repetition time ¼ 1500 ms, number of excitations ¼1, phase � frequency ¼ 18 � 18) was used for acquiring the
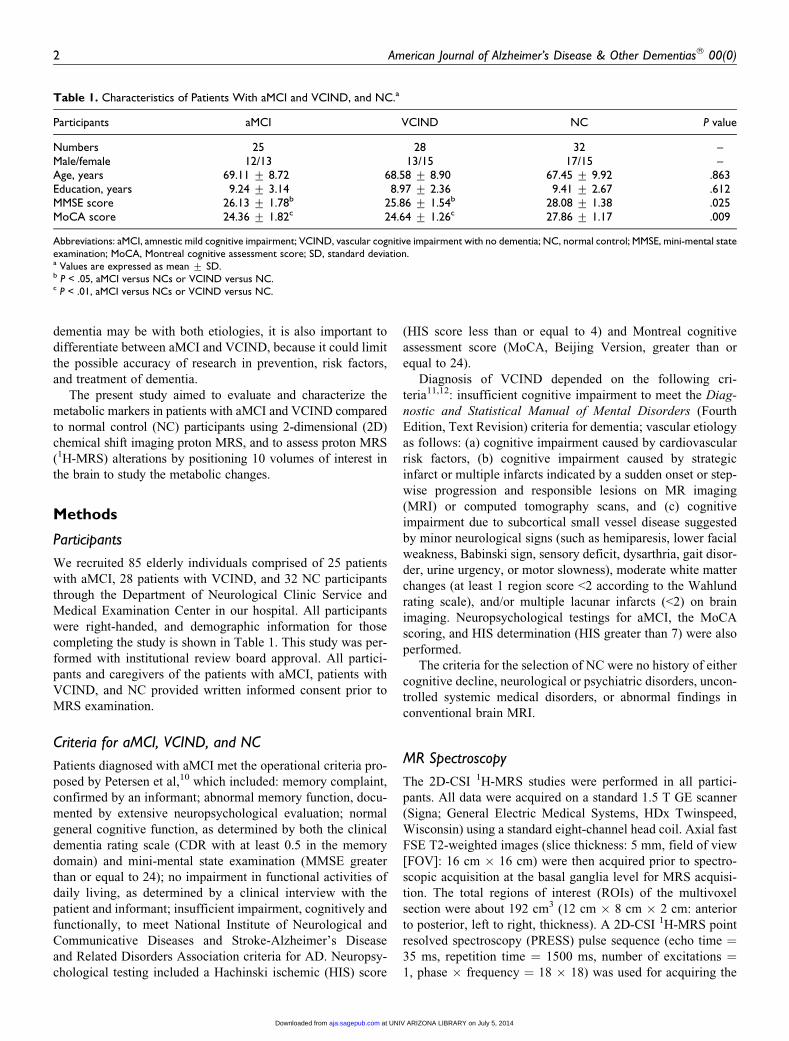
Table 1. Characteristics of Patients With aMCI and VCIND, and NC.a
Participants aMCI VCIND NC P value
Numbers 25 28 32 –Male/female 12/13 13/15 17/15 –Age, years 69.11 + 8.72 68.58 + 8.90 67.45 + 9.92 .863Education, years 9.24 + 3.14 8.97 + 2.36 9.41 + 2.67 .612MMSE score 26.13 + 1.78b 25.86 + 1.54b 28.08 + 1.38 .025MoCA score 24.36 + 1.82c 24.64 + 1.26c 27.86 + 1.17 .009
Abbreviations: aMCI, amnestic mild cognitive impairment; VCIND, vascular cognitive impairment with no dementia; NC, normal control; MMSE, mini-mental stateexamination; MoCA, Montreal cognitive assessment score; SD, standard deviation.a Values are expressed as mean + SD.b P < .05, aMCI versus NCs or VCIND versus NC.c P < .01, aMCI versus NCs or VCIND versus NC.
2 American Journal of Alzheimer’s Disease & Other Dementias® 00(0)
at UNIV ARIZONA LIBRARY on July 5, 2014aja.sagepub.comDownloaded from
spectroscopy data. Automatic prescanning was performed in all
participants until all spectra had good quality (<10 Hz of full
width at half height of the unsuppressed water peak and percen-
tages of water suppression �98%). The ROIs for 2D-CSI1H-MRS were then classified according to their location
assigned to 10 regions: bilateral posterior cingulate gyrus
(PCG), white matter of the occipital lobe (OLWM), inferior
precuneus (Pr), dorsal thalamus (DT), and white matter of the
frontal lobe (FLWM). These regions are at particular risk for
MCI or VCIND. The MRS acquisition scan time was 8 minutes
and 12 seconds.
Postprocessing and metabolite quantification
Postprocessing was performed as follows: all subject initial
data (P file) would be created by the host machine and acquired
from the ADW4.5 workstation. All P files were then transferred
to a dedicated UNIX system and processed using spectroscopy
analysis by general electric software. Thus, every single vol-
ume of voxels was (FOV: 16.0 cm� 16.0 cm/phase, frequency:
18� 18)� 2.0 cm¼ 1.58 cm3. A standard phantom containing
detectable compounds was used as an external standard to
calibrate the metabolite concentrations. Absolute metabolite
concentrations with %standard deviation (SD; Cramer–Rao
lower bounds) of metabolite peaks of interest >20% were
excluded, thus indicating that these metabolites could be reli-
ably estimated. Absolute concentrations were then calculated
using a linear combination of model.13,14 Metabolite concen-
trations (mmol/L) of NAA, Cr, Cho, and MI were quantified,
and metabolite ratios (NAA/Cr, Cho/Cr, MI/Cr, NAA/MI, and
NAA/Cho) were calculated.
Data Analysis
Statistical analysis and graphics were performed with SPSS Ver-
sion 18.0 for Windows (SPSS, Chicago, Illinois). Group differ-
ences for age, education, MMSE and MoCA scores were
compared among the 3 groups using a 1-way analysis of var-
iance. As for absolute metabolite concentrations and metabolite
ratios, we used a nonparametric statistical analysis of covariance
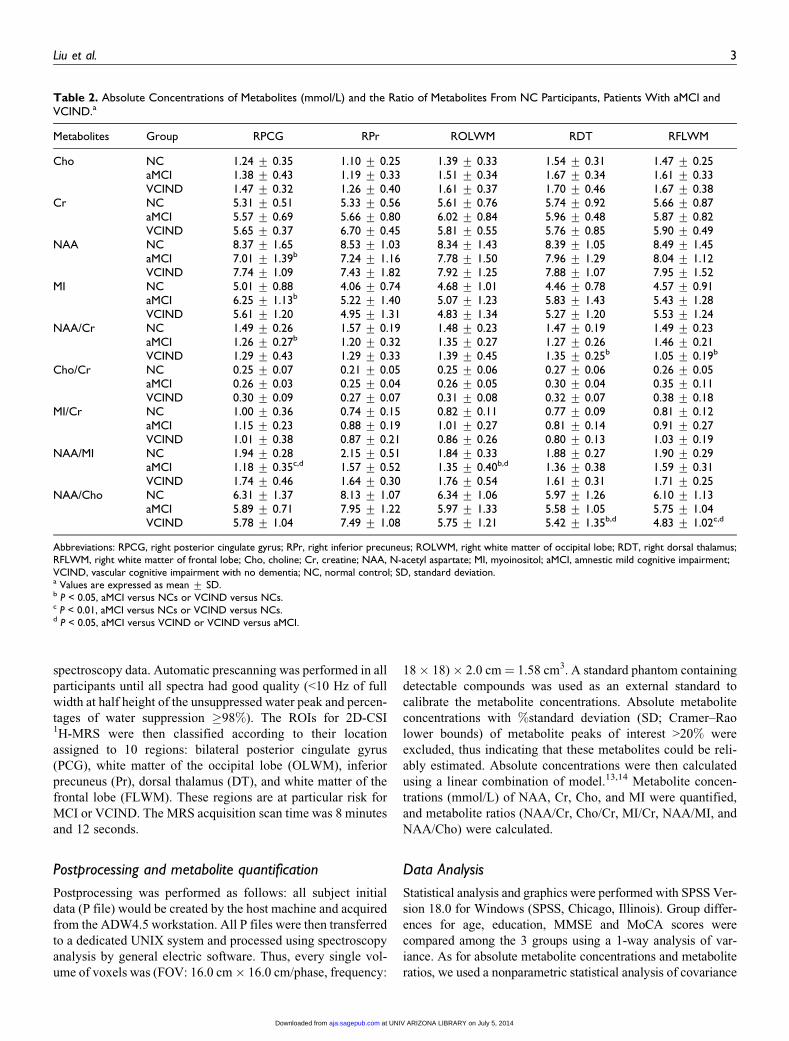
Table 2. Absolute Concentrations of Metabolites (mmol/L) and the Ratio of Metabolites From NC Participants, Patients With aMCI andVCIND.a
Metabolites Group RPCG RPr ROLWM RDT RFLWM
Cho NC 1.24 + 0.35 1.10 + 0.25 1.39 + 0.33 1.54 + 0.31 1.47 + 0.25aMCI 1.38 + 0.43 1.19 + 0.33 1.51 + 0.34 1.67 + 0.34 1.61 + 0.33VCIND 1.47 + 0.32 1.26 + 0.40 1.61 + 0.37 1.70 + 0.46 1.67 + 0.38
Cr NC 5.31 + 0.51 5.33 + 0.56 5.61 + 0.76 5.74 + 0.92 5.66 + 0.87aMCI 5.57 + 0.69 5.66 + 0.80 6.02 + 0.84 5.96 + 0.48 5.87 + 0.82VCIND 5.65 + 0.37 6.70 + 0.45 5.81 + 0.55 5.76 + 0.85 5.90 + 0.49
NAA NC 8.37 + 1.65 8.53 + 1.03 8.34 + 1.43 8.39 + 1.05 8.49 + 1.45aMCI 7.01 + 1.39b 7.24 + 1.16 7.78 + 1.50 7.96 + 1.29 8.04 + 1.12VCIND 7.74 + 1.09 7.43 + 1.82 7.92 + 1.25 7.88 + 1.07 7.95 + 1.52
MI NC 5.01 + 0.88 4.06 + 0.74 4.68 + 1.01 4.46 + 0.78 4.57 + 0.91aMCI 6.25 + 1.13b 5.22 + 1.40 5.07 + 1.23 5.83 + 1.43 5.43 + 1.28VCIND 5.61 + 1.20 4.95 + 1.31 4.83 + 1.34 5.27 + 1.20 5.53 + 1.24
NAA/Cr NC 1.49 + 0.26 1.57 + 0.19 1.48 + 0.23 1.47 + 0.19 1.49 + 0.23aMCI 1.26 + 0.27b 1.20 + 0.32 1.35 + 0.27 1.27 + 0.26 1.46 + 0.21VCIND 1.29 + 0.43 1.29 + 0.33 1.39 + 0.45 1.35 + 0.25b 1.05 + 0.19b
Cho/Cr NC 0.25 + 0.07 0.21 + 0.05 0.25 + 0.06 0.27 + 0.06 0.26 + 0.05aMCI 0.26 + 0.03 0.25 + 0.04 0.26 + 0.05 0.30 + 0.04 0.35 + 0.11VCIND 0.30 + 0.09 0.27 + 0.07 0.31 + 0.08 0.32 + 0.07 0.38 + 0.18
MI/Cr NC 1.00 + 0.36 0.74 + 0.15 0.82 + 0.11 0.77 + 0.09 0.81 + 0.12aMCI 1.15 + 0.23 0.88 + 0.19 1.01 + 0.27 0.81 + 0.14 0.91 + 0.27VCIND 1.01 + 0.38 0.87 + 0.21 0.86 + 0.26 0.80 + 0.13 1.03 + 0.19
NAA/MI NC 1.94 + 0.28 2.15 + 0.51 1.84 + 0.33 1.88 + 0.27 1.90 + 0.29aMCI 1.18 + 0.35c,d 1.57 + 0.52 1.35 + 0.40b,d 1.36 + 0.38 1.59 + 0.31VCIND 1.74 + 0.46 1.64 + 0.30 1.76 + 0.54 1.61 + 0.31 1.71 + 0.25
NAA/Cho NC 6.31 + 1.37 8.13 + 1.07 6.34 + 1.06 5.97 + 1.26 6.10 + 1.13aMCI 5.89 + 0.71 7.95 + 1.22 5.97 + 1.33 5.58 + 1.05 5.75 + 1.04VCIND 5.78 + 1.04 7.49 + 1.08 5.75 + 1.21 5.42 + 1.35b,d 4.83 + 1.02c,d
Abbreviations: RPCG, right posterior cingulate gyrus; RPr, right inferior precuneus; ROLWM, right white matter of occipital lobe; RDT, right dorsal thalamus;RFLWM, right white matter of frontal lobe; Cho, choline; Cr, creatine; NAA, N-acetyl aspartate; MI, myoinositol; aMCI, amnestic mild cognitive impairment;VCIND, vascular cognitive impairment with no dementia; NC, normal control; SD, standard deviation.a Values are expressed as mean + SD.b P < 0.05, aMCI versus NCs or VCIND versus NCs.c P < 0.01, aMCI versus NCs or VCIND versus NCs.d P < 0.05, aMCI versus VCIND or VCIND versus aMCI.
Liu et al. 3
at UNIV ARIZONA LIBRARY on July 5, 2014aja.sagepub.comDownloaded from
as covariates (influencing factors such as age, education, or men-
tal status scores) with a correction (Benjamin Hochberg) to do
multiple pairwise comparisons between these 3 groups. A P
value < .05 was considered to be statistically significant and the
values were presented as mean + SD.
Results
Table 1 describes the demographic characteristics and neurop-
sychological scores of the participants. Compared with NC par-
ticipants, the baseline MMSE scores (P < .05) and MoCA
scores (P < .01) were lower in patients with aMCI and VCIND,
No significant differences were found among the 3 groups in
regard to age and level of education (P > .05).
The absolute concentrations of NAA, MI, Cho, Cr, and the
metabolite ratios of NAA/Cr, Cho/Cr, MI/Cr, NAA/MI, and
NAA/Cho were obtained and we checked these metabolite con-
centrations, and metabolite ratios were examined for a normal
distribution. Concerning gender and education, there were no
differences among 3 groups for each metabolite concentration
and metabolite ratio in any ROIs. Table 2 shows the averaged
values of brain metabolites measured in the right side volumes
of interest (PCG, Pr, OLWM, DT, and FLWM) among the 3
groups. Decreased NAA/MI ratios in the right PCG (P < .01
vs NC or P < .05 vs VCIND group) and in the right OLWM
(P < .05 vs NC or vs VCIND group) along with decreases of
NAA concentration (P < .05) and NAA/Cr ratio (P < .05),
which were consistent with the elevation in the MI level (P <
.05), were observed in the right PCG in the patients with aMCI
(Figure 1: 1-4). Significantly decreased NAA/Cho ratios (P <
.05) in the right FLWM (P < .01 vs NC or P < .05 vs VCIND
group) and in the right DT (P < .05 vs NC or vs VCIND group),
along with a consistently decreased NAA/Cr ratio (P < .05) in
the left DT and FLWM were observed in the patients with
VCIND. However, we did not find any metabolic changes in
the right Pr in the 3 groups.
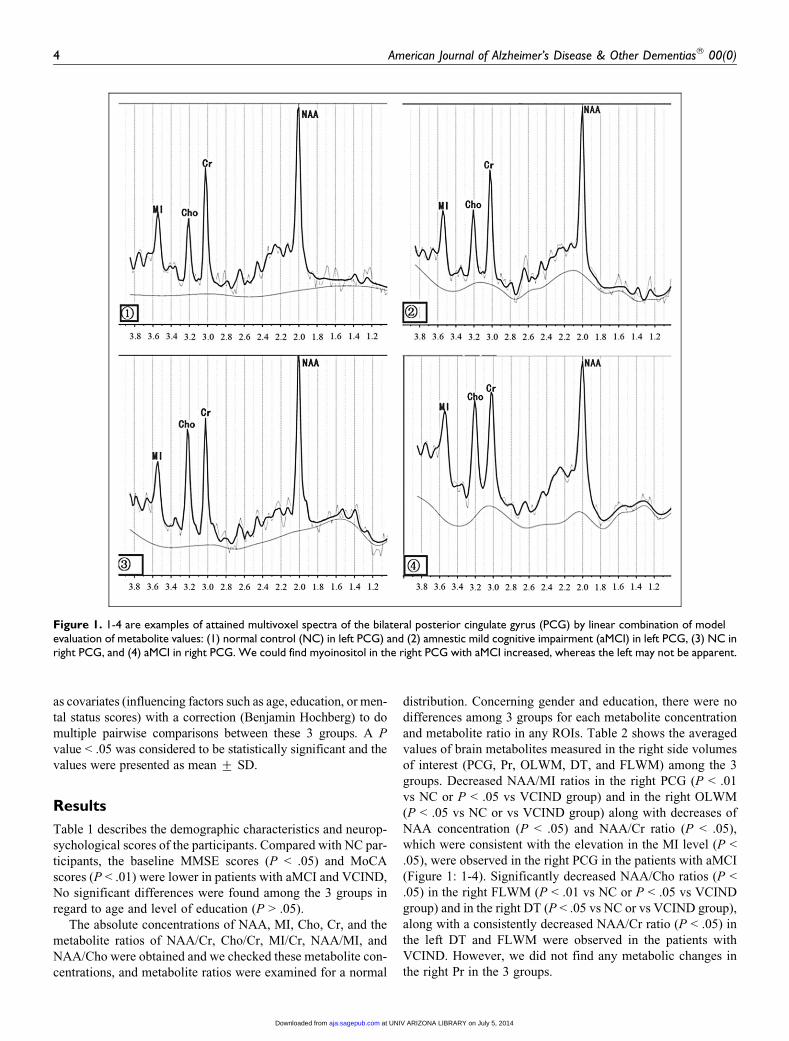
Figure 1. 1-4 are examples of attained multivoxel spectra of the bilateral posterior cingulate gyrus (PCG) by linear combination of modelevaluation of metabolite values: (1) normal control (NC) in left PCG) and (2) amnestic mild cognitive impairment (aMCI) in left PCG, (3) NC inright PCG, and (4) aMCI in right PCG. We could find myoinositol in the right PCG with aMCI increased, whereas the left may not be apparent.
4 American Journal of Alzheimer’s Disease & Other Dementias® 00(0)
at UNIV ARIZONA LIBRARY on July 5, 2014aja.sagepub.comDownloaded from
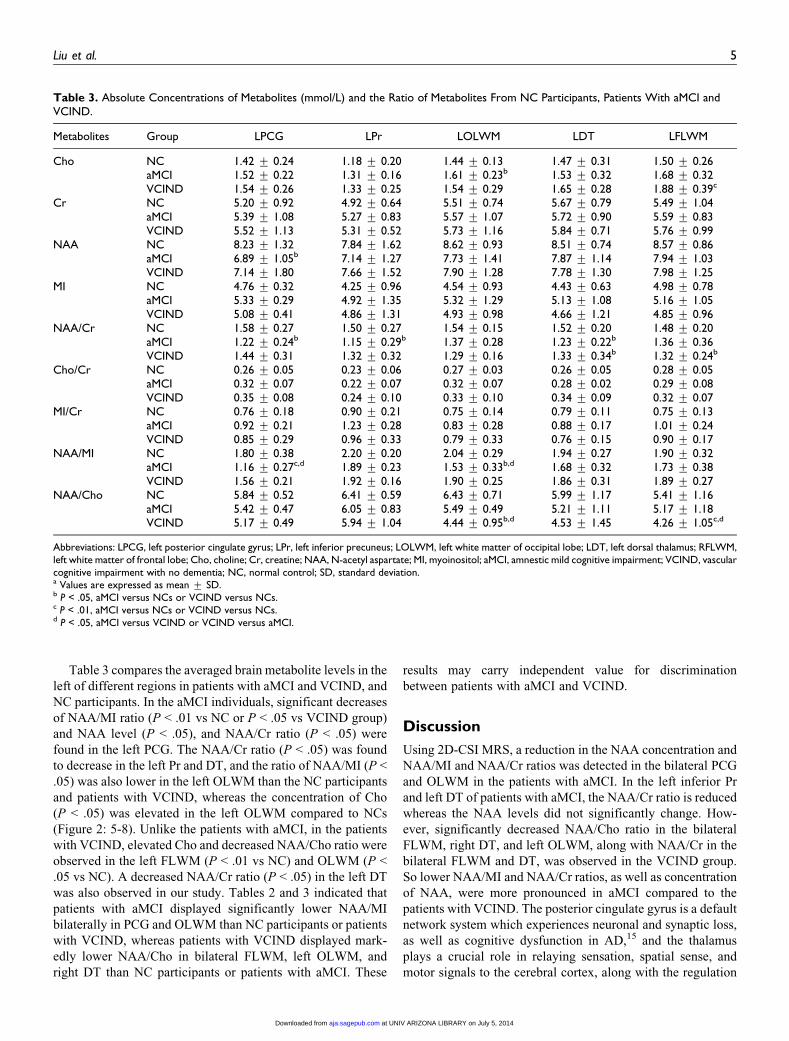
Table 3 compares the averaged brain metabolite levels in the
left of different regions in patients with aMCI and VCIND, and
NC participants. In the aMCI individuals, significant decreases
of NAA/MI ratio (P < .01 vs NC or P < .05 vs VCIND group)
and NAA level (P < .05), and NAA/Cr ratio (P < .05) were
found in the left PCG. The NAA/Cr ratio (P < .05) was found
to decrease in the left Pr and DT, and the ratio of NAA/MI (P <
.05) was also lower in the left OLWM than the NC participants
and patients with VCIND, whereas the concentration of Cho
(P < .05) was elevated in the left OLWM compared to NCs
(Figure 2: 5-8). Unlike the patients with aMCI, in the patients
with VCIND, elevated Cho and decreased NAA/Cho ratio were
observed in the left FLWM (P < .01 vs NC) and OLWM (P <
.05 vs NC). A decreased NAA/Cr ratio (P < .05) in the left DT
was also observed in our study. Tables 2 and 3 indicated that
patients with aMCI displayed significantly lower NAA/MI
bilaterally in PCG and OLWM than NC participants or patients
with VCIND, whereas patients with VCIND displayed mark-
edly lower NAA/Cho in bilateral FLWM, left OLWM, and
right DT than NC participants or patients with aMCI. These
results may carry independent value for discrimination
between patients with aMCI and VCIND.
Discussion
Using 2D-CSI MRS, a reduction in the NAA concentration and
NAA/MI and NAA/Cr ratios was detected in the bilateral PCG
and OLWM in the patients with aMCI. In the left inferior Pr
and left DT of patients with aMCI, the NAA/Cr ratio is reduced
whereas the NAA levels did not significantly change. How-
ever, significantly decreased NAA/Cho ratio in the bilateral
FLWM, right DT, and left OLWM, along with NAA/Cr in the
bilateral FLWM and DT, was observed in the VCIND group.
So lower NAA/MI and NAA/Cr ratios, as well as concentration
of NAA, were more pronounced in aMCI compared to the
patients with VCIND. The posterior cingulate gyrus is a default
network system which experiences neuronal and synaptic loss,
as well as cognitive dysfunction in AD,15 and the thalamus
plays a crucial role in relaying sensation, spatial sense, and
motor signals to the cerebral cortex, along with the regulation
Table 3. Absolute Concentrations of Metabolites (mmol/L) and the Ratio of Metabolites From NC Participants, Patients With aMCI andVCIND.
Metabolites Group LPCG LPr LOLWM LDT LFLWM
Cho NC 1.42 + 0.24 1.18 + 0.20 1.44 + 0.13 1.47 + 0.31 1.50 + 0.26aMCI 1.52 + 0.22 1.31 + 0.16 1.61 + 0.23b 1.53 + 0.32 1.68 + 0.32VCIND 1.54 + 0.26 1.33 + 0.25 1.54 + 0.29 1.65 + 0.28 1.88 + 0.39c
Cr NC 5.20 + 0.92 4.92 + 0.64 5.51 + 0.74 5.67 + 0.79 5.49 + 1.04aMCI 5.39 + 1.08 5.27 + 0.83 5.57 + 1.07 5.72 + 0.90 5.59 + 0.83VCIND 5.52 + 1.13 5.31 + 0.52 5.73 + 1.16 5.84 + 0.71 5.76 + 0.99
NAA NC 8.23 + 1.32 7.84 + 1.62 8.62 + 0.93 8.51 + 0.74 8.57 + 0.86aMCI 6.89 + 1.05b 7.14 + 1.27 7.73 + 1.41 7.87 + 1.14 7.94 + 1.03VCIND 7.14 + 1.80 7.66 + 1.52 7.90 + 1.28 7.78 + 1.30 7.98 + 1.25
MI NC 4.76 + 0.32 4.25 + 0.96 4.54 + 0.93 4.43 + 0.63 4.98 + 0.78aMCI 5.33 + 0.29 4.92 + 1.35 5.32 + 1.29 5.13 + 1.08 5.16 + 1.05VCIND 5.08 + 0.41 4.86 + 1.31 4.93 + 0.98 4.66 + 1.21 4.85 + 0.96
NAA/Cr NC 1.58 + 0.27 1.50 + 0.27 1.54 + 0.15 1.52 + 0.20 1.48 + 0.20aMCI 1.22 + 0.24b 1.15 + 0.29b 1.37 + 0.28 1.23 + 0.22b 1.36 + 0.36VCIND 1.44 + 0.31 1.32 + 0.32 1.29 + 0.16 1.33 + 0.34b 1.32 + 0.24b
Cho/Cr NC 0.26 + 0.05 0.23 + 0.06 0.27 + 0.03 0.26 + 0.05 0.28 + 0.05aMCI 0.32 + 0.07 0.22 + 0.07 0.32 + 0.07 0.28 + 0.02 0.29 + 0.08VCIND 0.35 + 0.08 0.24 + 0.10 0.33 + 0.10 0.34 + 0.09 0.32 + 0.07
MI/Cr NC 0.76 + 0.18 0.90 + 0.21 0.75 + 0.14 0.79 + 0.11 0.75 + 0.13aMCI 0.92 + 0.21 1.23 + 0.28 0.83 + 0.28 0.88 + 0.17 1.01 + 0.24VCIND 0.85 + 0.29 0.96 + 0.33 0.79 + 0.33 0.76 + 0.15 0.90 + 0.17
NAA/MI NC 1.80 + 0.38 2.20 + 0.20 2.04 + 0.29 1.94 + 0.27 1.90 + 0.32aMCI 1.16 + 0.27c,d 1.89 + 0.23 1.53 + 0.33b,d 1.68 + 0.32 1.73 + 0.38VCIND 1.56 + 0.21 1.92 + 0.16 1.90 + 0.25 1.86 + 0.31 1.89 + 0.27
NAA/Cho NC 5.84 + 0.52 6.41 + 0.59 6.43 + 0.71 5.99 + 1.17 5.41 + 1.16aMCI 5.42 + 0.47 6.05 + 0.83 5.49 + 0.49 5.21 + 1.11 5.17 + 1.18VCIND 5.17 + 0.49 5.94 + 1.04 4.44 + 0.95b,d 4.53 + 1.45 4.26 + 1.05c,d
Abbreviations: LPCG, left posterior cingulate gyrus; LPr, left inferior precuneus; LOLWM, left white matter of occipital lobe; LDT, left dorsal thalamus; RFLWM,left white matter of frontal lobe; Cho, choline; Cr, creatine; NAA, N-acetyl aspartate; MI, myoinositol; aMCI, amnestic mild cognitive impairment; VCIND, vascularcognitive impairment with no dementia; NC, normal control; SD, standard deviation.a Values are expressed as mean + SD.b P < .05, aMCI versus NCs or VCIND versus NCs.c P < .01, aMCI versus NCs or VCIND versus NCs.d P < .05, aMCI versus VCIND or VCIND versus aMCI.
Liu et al. 5
at UNIV ARIZONA LIBRARY on July 5, 2014aja.sagepub.comDownloaded from
of consciousness, sleep, and alertness. People have paid atten-
tion to the role of thalamus injury in cognitive impairment gra-
dually, and relationship between lower NAA/Cr ratio and DT
has been demonstrated in several studies.16,17 In agreement
with these studies, patients with VCIND displaying thalamo-
cortical dysfunction are associated with neuronal and axonal
injury. The NAA is not only used as a measure of neuronal den-
sities but of neuronal function, and our findings of decreased
NAA levels may be related to lower brain glucose metabolism
in the PCG and has been proposed as a marker of the early
reflection of an impaired energetic metabolism.18 In our study,
the finding that patients with aMCI exhibit decreases in NAA/
MI and NAA/Cr ratios in the bilateral PCG and OLWM was
consistent with previous reports.7,19 In the left inferior Pr, the
decrease in NAA was found in patients with aMCI, which had
also been measured by fluid-registered serial MRI to have the
highest rates of atrophy.20 Likewise, the reduction in NAA/Cr
ratio in the left FLWM is also indicative of an energy deficit
that might result from a defect in oxidative metabolism in neu-
ronal mitochondria in patients with the VCIND group.21-23
Elevated MI/Cr in the PCG and OLWM of patients with
MCI has been previously reported.24 Instead of observing ele-
vated MI/Cr, we found that the MI level was higher in the PCG
and in the left OLWM in patients with aMCI when compared to
the patients with VCIND and NC participants. Increased MI
might indicate elevated neuroglial concentration.25 Even
though there have been some reports to suggest that the MI/
Cr ratio was significant in different brain regions,26 we did not
find evidence for alterations in the MI level, or MI/Cr or NAA/
MI ratios in patients with VCIND. According to Tables 2 and 3,
the reduction of NAA/MI in the PCG and OLWM was more
significant than other areas in the aMCI group. Our findings
and previous studies might provide an effective criterion in evi-
dence of MCI pathological progression.27,28 It is more mean-
ingful to find that NAA/MI ratios have a higher sensitivity
than NAA/Cr ratios or NAA concentrations in the bilateral
PCG and OLWM in patients with aMCI (Table 2 and Table
3). So, the decreased NAA/MI bilaterally in the PCG and
OLWM might be a valuable marker to distinguish patients with
aMCI from patients with VCIND or NCparticipants.
The Cho represents a constituent of cell membranes of choli-
nergic neurons to maintain their function and integrity, so
increased Cho levels might be related to increased cell mem-
brane phospholipid turnover.29 The paratrigonal white matter
areas, included in the OLWM and FLWM, are rich in choliner-
gic fibres deriving from the nucleus basalis of Meynert, which
innervates large areas of the frontal and parietal neocortex,30 and
we showed increases in Cho in the left OLWM of patients with
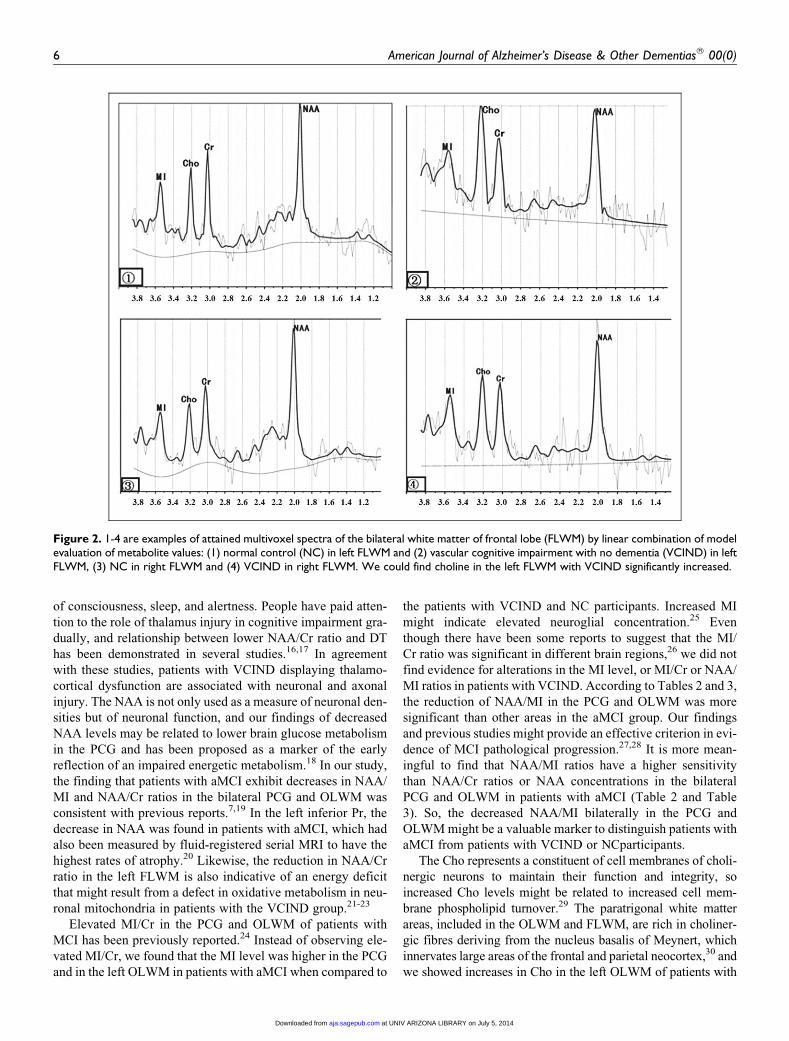
Figure 2. 1-4 are examples of attained multivoxel spectra of the bilateral white matter of frontal lobe (FLWM) by linear combination of modelevaluation of metabolite values: (1) normal control (NC) in left FLWM and (2) vascular cognitive impairment with no dementia (VCIND) in leftFLWM, (3) NC in right FLWM and (4) VCIND in right FLWM. We could find choline in the left FLWM with VCIND significantly increased.
6 American Journal of Alzheimer’s Disease & Other Dementias® 00(0)
at UNIV ARIZONA LIBRARY on July 5, 2014aja.sagepub.comDownloaded from
aMCI and left FLWM in the VCIND group compared to other
regions. Hence, increased Cho may reflect damaged cholinergic
neurons and increased membrane synthesis or phospholipid turn-
over in neurological diseases.31 Thus a significant decrease in
NAA/Cho in the bilateral FLWM regions in this study is sugges-
tive of occurring a higher membrane turnover and decrease in
NAA in these regions. The results showed that an increased Cho
level is correlated with a decreased NAA/Cho ratio in the bilat-
eral FLWM and left OLWM in patients with VCIND. The MRS
data suggest that patients with VCIND probably have more
severe damage in the FLWM and OLWM than the aMCI group
and the NC group, and it also indicates that the NAA/Cho ratio
(as well as the NAA/MI ratio in patients with aMCI) measured
with MRS furnishes a means to quantify brain metabolic dam-
age, allowing for the possibility of an effective criterion and a
higher sensitivity than other metabolite markers. Thus, we
believe that future longitudinal studies aiming to determine
MR spectroscopic changes in absolute concentrations and rela-
tive concentrations will provide a more reliable and sensitive
indicator of metabolic abnormalities in patients with aMCI and
VCIND.
It is also worth noting that the prognostic value of VCIND as
a diagnostic entity has not been fully determined.32 In our study,
we examined the neuroimaging differences of individuals with
VCIND and aMCI by 2D-CSI 1H MRS. Our study found a dif-
ferent distribution of metabolite changes in different brain
regions between the 2 groups. To address this need, it would
be of interest to perform further studies with longer follow-up
of these individuals to establish the long-term rate of conver-
sion, which includes measures with MRS and structural MRI
studies.33
In this study, although the 2D-CSI MRS technique offers the
ability to provide extensive data from multiple contiguous vox-
els and enable us to detect the metabolic changes in different
brain regions at the same time, the study is limited by the fact
that the MRS technique was performed from a single slice
(from the frontal to occipital regions of the brain). The hippo-
campus, which is not covered in the ROI in this study, is
another important region that is known to be affected in
patients with aMCI. We must improve the level of MRS tech-
nique, especially 3D-CSI MRS. In conclusion, the present
study demonstrates MRS abnormalities in particular regions
of the brain of patients with aMCI and VCIND and provides
further evidence that the absolute and relative concentrations
is useful for detection of the characteristic patterns of metabolic
concentration in patients with dementia. Further research pro-
spectively in evaluating the effect of new drugs proposed for
the prevention and treatment of dementia is required.
Acknowledgments
We thank Dr Stanley Lin for helpful discussions and for checking the
language.
Authors Note
Yan-Yan Liu and Zhong-Xian Yang contributed equally to this manu-
script and should be considered as cofirst authors.
Declaration of Conflicting Interests
The authors declared no potential conflicts of interest with respect to
the research, authorship, and/or publication of this article.
Funding
The authors disclosed receipt of the following financial support for the
research, authorship and/or publication of this article: the National
Natural Science Foundation of China (key project No. 30930027) and
the National Natural Science Foundation of China (general project No.
60971075).
References
1. Gauthier S, Reisberg B, Zaudig M, et al. Mild cognitive impair-
ment. Lancet. 2006;367(9518):1262-1270.
2. Petersen RC, Doody R, Kurz A, et al. Current concepts in mild
cognitive impairment. Arch Neurol. 2001;58(12):1985-1992.
3. Neuropathology Group. Pathological correlates of late-onset
dementia in a multicentre, community-based population in Eng-
land and Wales. Neuropathology Group of the Medical Research
Council Cognitive Function and Ageing Study (MRCCFAS).
Lancet. 2001;357(9251):169-175.
4. Pantoni L, Gorelick P. Advances in vascular cognitive impair-
ment 2010. Stroke. 2011;42(2):291-293.
5. Narasimhalu K, Ang S, De Silva DA, et al. The prognostic effects
of poststroke cognitive impairment no dementia and domain-
specific cognitive impairments in nondisabled ischemic stroke
patients. Stroke. 2011;42(4):883-888.
6. Siger M, Schuff N, Zhu X, Miller BL, Weiner MW. Regional
myo-inositol concentration in mild cognitive impairment using
1H magnetic resonance spectroscopic imaging. Alzheimer Dis
Assoc Disord. 2009;23(1):57-62.
7. Fayed N, Modrego PJ, Rojas-salinas G, Aguilar K. Brain gluta-
mate leves are decreased in Alzheimer’s disease. A Magnetic
Resonance Spectroscopy study. Am J Alzheimers Dis Other
Demen. 2011;26(6):450-456.
8. Rami L, Gomez-Anson B, Bosch B, et al. Cortical brain metabo-
lism as measured by proton spectroscopy is related to memory
performance in patients with amnestic mild cognitive impairment
and Alzheimer’s disease. Dement Geriatr Cogn Disord. 2007;
24(4):274-279.
9. Herminghaus S, Frolich L, Gorriz C, et al. Brain metabolism in
Alzheimer disease and vascular dementia assessed by in vivo
proton magnetic resonance spectroscopy. Psychiatry Res. 2003;
123(3):183-190.
10. Petersen RC, Smith GE, Waring SC, Ivnik RJ, Tangalos EG, Kok-
men E. Mild cognitiveimpairment: clinical characterization and
outcome. Arch Neurol. 1999;56(3):303-308.
11. Ingles JL, Wentzel C, Fisk JD, Rockwood K. Neuropsychological
predictors of incident dementia in patients with vascular cognitive
impairment, without dementia. Stroke. 2002;33(8):1999-2002.
12. Garrett KD, Browndyke JN, Whelihan W, et al. The neuropsycho-
logical profile of vascular cognitive impairment-no dementia:
comparisons to patients at risk for cerebrovascular disease and
vascular dementia. Arch Clin Neuropsychol. 2004;19(6):745-757.
13. Yang ZX, Huo SS, Cheng XF, et al. Quantitative multivoxel pro-
ton MR spectroscopy study of brain metabolites in patients with
Liu et al. 7
at UNIV ARIZONA LIBRARY on July 5, 2014aja.sagepub.comDownloaded from
amnestic mild cognitive impairment: a pilot study. Neuroradiol-
ogy. 2012;54(5):451-458.
14. Fayed N, Modrego PJ, Medrano J. Comparative test-retest relia-
bility of metabolite values assessed with Magnetic Resonance
Spectroscopy of the brain. The LCModel versus the manufacturer
software. Neurol Res. 2009;31(5):472-477.
15. Huang C, Wahlund LO, Svensson L, Winblad B, Julin P. Cingu-
late cortex hypoperfusion predicts Alzheimer’s disease in mild
cognitive impairment. BMC Neurol. 2002;2:9.
16. Pattany PM, Yezierski RP, Widerstrom-Noga EG, et al. Proton
magnetic resonance spectroscopy of the thalamus in patients with
chronic neuropathic pain after spinal cord injury. AJNR Am J Neu-
roradiol. 2002;23(6):901-905.
17. Ben Salem D, Walker PM, Bejot Y, et al. N-acetylaspartate/crea-
tine and choline/creatine ratios in the thalami, insular cortex and
white matter as markers of hypertension and cognitive impair-
ment in the elderly. Hypertens Res. 2008;31(10):1851-1857.
18. Moffett JR, Ross B, Arun P, Madhavarao CN, Namboodiri AM.
N-Acetylaspartate in the CNS: from neurodiagnostics to neuro-
biology. Prog Neurobiol. 2007;81(2):89-131.
19. Modrego PJ, Fayed N, Pina MA. Conversion from mild cogni-
tive impairment to probable Alzheimer’s disease predicted
by brain magnetic resonance spectroscopy. Am J Psychiatry.
2005;162(4):667-675.
20. Scahill RI, Schott JM, Stevens JM, Rossor MN, Fox NC. Mapping
the evolution of regional atrophy in Alzheimer’s disease:
unbiased analysis of fluid-registered serial MRI. Proc Natl Acad
Sci U S A. 2002;99(7):4703-4707.
21. Gasparovic C, Prestopnik J, Thompson J, et al. 1H-MR spectro-
scopy metabolite levels correlate with executive function in vas-
cular cognitive impairment. J Neurol Neurosurg Psychiatry.
2013;84(7):715-721.
22. Black S, Gao F, Bilbao J. Understanding white matter disease:
imaging-pathological correlations in vascular cognitive impair-
ment. Stroke. 2009;40(suppl 3):S48-S52.
23. Nitkunan A, Charlton RA, Barrick TR, McIntyre DJ, Howe FA,
Markus HS. Reduced N-acetylaspartate is consistent with axonal
dysfunction in cerebral small vessel disease. NMR Biomed. 2009;
22(3):285-291.
24. Schott JM, Frost C, MacManus DG, Ibrahim F, Waldman AD,
Fox NC. Short echo time proton magnetic resonance spectroscopy
in Alzheimer’s disease: a longitudinal multiple time point study.
Brain. 2010;133(11):3315-3322.
25. Modrego PJ, Fayed N, Sarasa M. Magnetic resonance spectroscopy
in the prediction of early conversion from amnestic Mild Cognitive
Impairment to dementia. BMJ Open. 2011;1(1):e000007.
26. Watanabe T, Shiino A, Akiguchi I. Absolute quantification in pro-
ton magnetic resonance spectroscopy is useful to differentiate
amnesic mild cognitive impairment from Alzheimer’s disease and
healthy aging. Dement Geriatr Cogn Disord. 2010;30(1):71-77.
27. Fayed N, Davila J, Oliveros A, Castillo J, Medrano JJ. Utility of
different MR modalities in mild cognitive impairment and its use
as a predictor of conversion to probable dementia. Acad Radiol.
2008;15(9):1089-1098.
28. Olson BL, Holshouser BA, Britt W3rd, et al. Longitudinal meta-
bolic and cognitive changes in mild cognitive impairment
patients. Alzheimer Dis Assoc Disord. 2008;22(3):269-277.
29. Subhawong TK, Wang X, Durand DJ, et al. Proton MR spectro-
scopy in metabolic assessment of musculoskeletal lesions. AJR
Am J Roentgenol. 2012;198(1):162-172.
30. Swartz RH, Sahlas DJ, Black SE. Strategic involvement of choli-
nergic pathways and executive dysfunction: does location of
white matter signal hyperintensities matter? J Stroke Cerebrovasc
Dis. 2003;12(1):29-36.
31. Alvarez-Sabın J, Roman GC. Citicoline in vascular cognitive
impairment and vascular dementia after stroke. Stroke. 2011;
42(suppl 1):S40-S43.
32. Stephan BC, Matthews FE, Khaw KT, Dufouil C, Brayne C.
Beyond mild cognitive impairment: vascular cognitive impair-
ment, no dementia (VCIND). Alzheimers Res Ther. 2009;1(1):4.
33. Modrego PJ, Fayed N. Longitudinal magnetic resonance spec-
troscopy as marker of cognitive deterioration in mild cognitive
impairment. Am J Alzheimers Dis Other Demen. 2011;26(8):
631-636.
8 American Journal of Alzheimer’s Disease & Other Dementias® 00(0)
at UNIV ARIZONA LIBRARY on July 5, 2014aja.sagepub.comDownloaded from