Embed Size (px)
Citation preview
PAPER www.rsc.org/dalton | Dalton Transactions
Magnetic anisotropy of two trinuclear and tetranuclear CrIIINiII
cyanide-bridged complexes with spin ground states S = 4 and 5†‡
Jean-Noel Rebilly,a Laure Catala,a Gaelle Charron,a Guillaume Rogez,a,b Eric Riviere,a Regis Guillot,a
Pierre Thuery,c Anne-Laure Barrad and Talal Mallah*a
Received 8th December 2005, Accepted 9th February 2006First published as an Advance Article on the web 11th May 2006DOI: 10.1039/b517417a
The trinuclear and the tetranuclear complexes [{iPrtacnCr(CN)3}2{Ni(cyclam)}](NO3)2·5H2O 1(cyclam = 1,4,8,11-tetraazacyclotetradecane, iPrtacn = 1,4,7-tris-isopropyl-1,4,7-triazacyclononane)and [{iPrtacnCr(CN)3Ni(Me2bpy)2}2](ClO4)4·2CH3CN 2 (Me2bpy = 4,4′-dimethyl-2,2′-bipyridine) weresynthesized by reacting (iPrtacn)Cr(CN)3 with [Ni(cyclam)](NO3)2 and [Ni(Me2bpy)2(H2O)2](ClO4)2,,respectively. The crystallographic structure of the two compounds was solved. The molecular structureof complex 1 consists of a linear Cr–Ni–Cr arrangement with a central Ni(cyclam) unit surrounded bytwo Cr(iPrtacn)(CN)3 molecules through bridging cyanides. Each peripheral chromium complex hastwo pending CN ligands. Complex 2 has a square planar arrangement with the metal ions occupyingthe vertices of the square. Each Cr(iPrtacn)(CN)3 molecule has two bridging and one non-bridgingcyanide ligands. The magnetic properties of the two complexes were investigated by susceptibility vs.temperature and magnetization vs. field studies. As expected from the orthogonality of the magneticorbitals between CrIII (t2g
3) and NiII (eg2) metal ions, a ferromagnetic exchange interaction occurs
leading to a spin ground states S = 4 and 5 for 1 and 2, respectively. The magnetization vs. field studiesat T = 2, 3 and 4 K showed the presence of a magnetic anisotropy within the ground spin states leadingto zero-field splitting parameters obtained by fitting the data D4 = 0.36 cm−1 and D5 = 0.19 cm−1 (theindices 4 and 5 refer to the ground states of complexes 1 and 2, respectively). In order to quantifyprecisely the magnitude of the axial (D) and the rhombic (E) anisotropy parameters, High-field highfrequency electron paramagnetic resonance (HF-HFEPR) experiments were carried out. The bestsimulation of the experimental spectra (at 190 and 285 GHz) gave the following parameters for 1: D4 =0.312 cm−1, E4/D4 = 0.01, g4x = 2.003, g4y = 2.017 and g4z = 2.015. For complex 2 two sets ofparameters could be extracted from the EPR spectra because a doubling of the resonances wereobserved and assigned to the presence of complexes with slightly different structures at low temperature:D5 = 0.154 (0.13) cm−1, E5/D5 = 0.31 (0.31) cm−1, g4x = 2.04 (2.05), g4y = 2.05 (2.05) and g4z = 2.03(2.02). The knowledge of the magnetic anisotropy parameters of the mononuclear Cr(iPrtacn)(CN)3,Ni(cyclam)(NCS)2 and Ni(bpy)2(NCS)2 complexes by combining HF-HFEPR studies and calculationusing a software based on the angular overlap model (AOM) allowed to determine the orientation ofthe local D tensors of the metal ions forming the polynuclear complexes. We, subsequently, show thatthe anisotropy parameters of the polynuclear complexes computed from the projection of the localtensors are in excellent agreement with the experimental ones extracted from the EPR experiments.
aICMMO-Equipe Chimie Inorganique, CNRS UMR 8182, Universite Paris-Sud, Bat 420, F-91405, Orsay, France. E-mail: [email protected];Fax: (+33) 1 69154754; Tel: (+33) 1 69 15 47 49bIPCMS-GMI, UMR CNRS 7504, 23, rue du Loess, B.P. 43, F-67034,Strasbourg Cedex 2, FrancecCEA/Saclay, SCM, Bat. 125, 91191, Gif-sur-Yvette, FrancedLaboratoire des Champs Magnetiques Intenses, UPR CNRS 5021, 25,avenue des Martyrs, B.P. 166, F-38042, Grenoble Cedex 9, France† Based on the presentation given at Dalton Discussion No. 9, 19–21stApril 2006, Hulme Hall, Manchester, UK.‡ Electronic supplementary information (ESI) available: Structural details,experimental and calculated HF-HFEPR spectra and AOM parametersfor Ni(cyclam)(NCS)2, Ni(bpy)(NCS)2 and Cr(iPrtacn)(CN)3]. See DOI:10.1039/b517417a
Introduction
The discovery of the blocking of the magnetisation of thenow famous Mn12ac complex has stimulated the research incoordination chemistry aiming to create new discrete objects(molecules) now called single molecule magnets (SMMs).1 A singlemolecule magnet may be simply defined as a complex that keeps itsmagnetization when the magnetic field is removed after saturationhas been achieved. In other words, a hysteresis loop vs. field isobserved for such complexes due to the long relaxation time ofthe magnetization below a given temperature. The origin of suchbehaviour is the presence of a relatively high spin ground state anda non-negligible magnetic anisotropy leading to a barrier for thereversal of the magnetisation responsible of the long relaxation
2818 | Dalton Trans., 2006, 2818–2828 This journal is © The Royal Society of Chemistry 2006
Publ
ishe
d on
11
May
200
6. D
ownl
oade
d by
Uni
vers
ity o
f H
ong
Kon
g L
ibra
ries
on
25/0
9/20
13 1
3:09
:56.
View Article Online / Journal Homepage / Table of Contents for this issue
time. The height of the barrier can be simply expressed for anIsing type anisotropy (easy axis of magnetization) as |D|S2 (forinteger spins) where D is the axial zero-field splitting parameterappearing in the spin Hamiltonian D[Sz
2 − S(S + 1)/3] and S thespin of the ground state. Mn12ac has a ground spin state equal to10 and a D parameter accurately determined from HF-HFEPRstudies equal to −0.5 cm−1 (the negative sign means that the MS =±10 sub levels have the lowest energy or that the anisotropy is ofthe Ising type) which leads to a barrier of 50 cm−1 and a blockingof the magnetization below T = 4 K.1a
Efforts in the last ten years to prepare polynuclear complexescontaining paramagnetic metal ions were rather rewarding if oneconsiders the nuclearity of the complexes obtained.2 Among thesecomplexes, the highest spin ground states found were 19 ± 1,25 and 51/2. Unfortunately, the D values associated to thesestates are very weak and only for two complexes the anisotropyis of the Ising type leading to a blocking of the magnetisationonly below 2 K. The complexes belonging to the Mn12 familystill hold the record for the blocking temperature. One of theobjectives is to be able to prepare polynuclear complexes with ahigh spin ground state and a relatively large magnetic anisotropyin order to enhance the anisotropy barrier so that bistability canbe present above liquid helium temperature. In order to obtaincomplexes with a relatively large magnetic anisotropy, one mustuse paramagnetic units with large anisotropy and insure theminimum of compensation between the single ion anisotropieswithin the cluster. Actually, in Mn12ac all the 8 Mn(III) ions havetheir anisotropy axes (collinear to the Jahn–Teller distortion axisof Mn(III)) parallel, so that a maximum anisotropy is obtained inthe ground S = 10 spin state. Also, it has been beautifully shownthat when the Jahn–Teller axis of one or two of the eight Mn(III) istilted, the D value of the complex decreases leading to a dramaticshift of the blocking temperature towards low temperatures.3
Unfortunately, even though the serendipitous assembly approachlead to a large number of clusters that present the SMM behaviour,it cannot predict the arrangement of the individual metal ionswithin a given cluster. Even with Mn(III) ions for which anisotropyis governed by the Jahn–Teller distortion, only in very few casesthe individual anisotropy axes rearrange in the right way withinthe clusters.
In order to be able to have a control on the magnitude of themagnetic anisotropy in polynuclear complexes, one is tempted touse a more rational approach by building the polynuclear clustersstep by step. The stepwise approach allows to predict (i) thenature of the spin ground state lying on the orthogonality/overlapprinciples and in some cases (ii) the architecture of the final cluster.These are the necessary requirements to be able to go forward andto try to predict the anisotropy parameters of the ground state ofpolynuclear complexes.
One of the advantages of the rational approach is the abilityfor the chemist to isolate the building blocks used to preparethe clusters and to determine their magnetic anisotropy precisely.Two important questions arise: once the magnetic anisotropy ofthe building blocks is fully known, is it possible to compute themagnetic anisotropy of the cluster? And particularly how reliablethe anisotropy parameters obtained from the calculations arewhen compared to the experimental values of the cluster? One ofthe objectives is to chemically tailor the building blocks in orderto obtain high spin clusters that have large magnetic anisotropy
of the Ising type, for example, if one is aiming to prepare SMMswith high blocking temperatures.
The aim of the present paper is to answer the former twoquestions by focusing on two simple polynuclear complexesprepared in our group namely the trinuclear [{iPrtacnCr(CN)3}2-{Ni(cyclam)}](NO3)2·5H2O 1 and the tetranuclear[{iPrtacnCr(CN)3Ni(Me2bpy)2}2](ClO4)4·2CH3CN 2 complexes.Complex 1 is prepared from the reaction of [Ni(cyclam)]2+ and(iPrtacn)Cr(CN)3.4 The chromium building block keeps almostthe same structure within the trinuclear complex 1. Thus, itsanisotropy properties may be perfectly studied and used whencalculating that of the complex 1. The [Ni(cyclam)]2+ is present incomplex 1 but surrounded with the two nitrogen atoms from thechromium unit. In order to have a good idea of the anisotropybehaviour of the trans-(cyclam)Ni(NC–)2 units present in complex1, we studied the anisotropy properties of a model complex i.e.trans-(cyclam)Ni(NCS)2 and used the experimental parametersof this compound in the calculation of that of complex 1. Thismethod is realiable since the local structure around Ni in themodel complex is mainly the same as in complex 1. The sameapproach was used in the case of the tetranuclear complex 2 byusing cis-Ni(bpy)2(NCS)2 as a model.
The anisotropy parameters D and E were determined using HF-HFEPR in most cases. In the following, the synthesis, the structure,the magnetic properties, the EPR studies and the calculation ofthe anisotropy parameters will be presented.
Experimental
Materials
The Ni and Cr salts were purchased from commercial sourcesand used as received. The iPrtacnCr(CN)3 complex was preparedfollowing the same procedure as for (Bztacn)Cr(CN)3 whereBztacn is 1,4,7-tris-benzyl-1,4,7-triazacyclononane.5
Physical techniques
Magnetisation studies were carried out on ground crystals using aQuantum Design SQUID magnetometer in the temperature range300–2 K within magnetic fields of 0.05 and 0.5 T. Magnetisationvs. field studies were performed in the field range 0–5.5 T. Diamag-netism was corrected using Pascal tables.
HF-HFEPR experiments were performed at the High Mag-netic Field Laboratory, Grenoble, France, using a previouslydescribed apparatus.6 We used ground crystals (about 100 mg)pressed to form a pellet in order to reduce torquing effectunder high magnetic fields. Simulation programme is availablefrom Dr H. Weihe; for more information see the www page:http://sophus.kiku.dk/software/epr/epr.html.7
Crystallographic data for complexes 1 and 2 are reported inTable 1.
CCDC reference numbers 292375 and 292376.For crystallographic data in CIF or other electronic format see
DOI: 10.1039/b517417a
Preparations
[{iPrtacnCr(CN)3}2{Ni(cyclam)}](NO3)2·5H2O 1. 100 mg(3.4 × 10⁻⁴ mol) of Ni(NO3)2·6H2O were dissolved in 20 ml of
This journal is © The Royal Society of Chemistry 2006 Dalton Trans., 2006, 2818–2828 | 2819
Publ
ishe
d on
11
May
200
6. D
ownl
oade
d by
Uni
vers
ity o
f H
ong
Kon
g L
ibra
ries
on
25/0
9/20
13 1
3:09
:56.
View Article Online
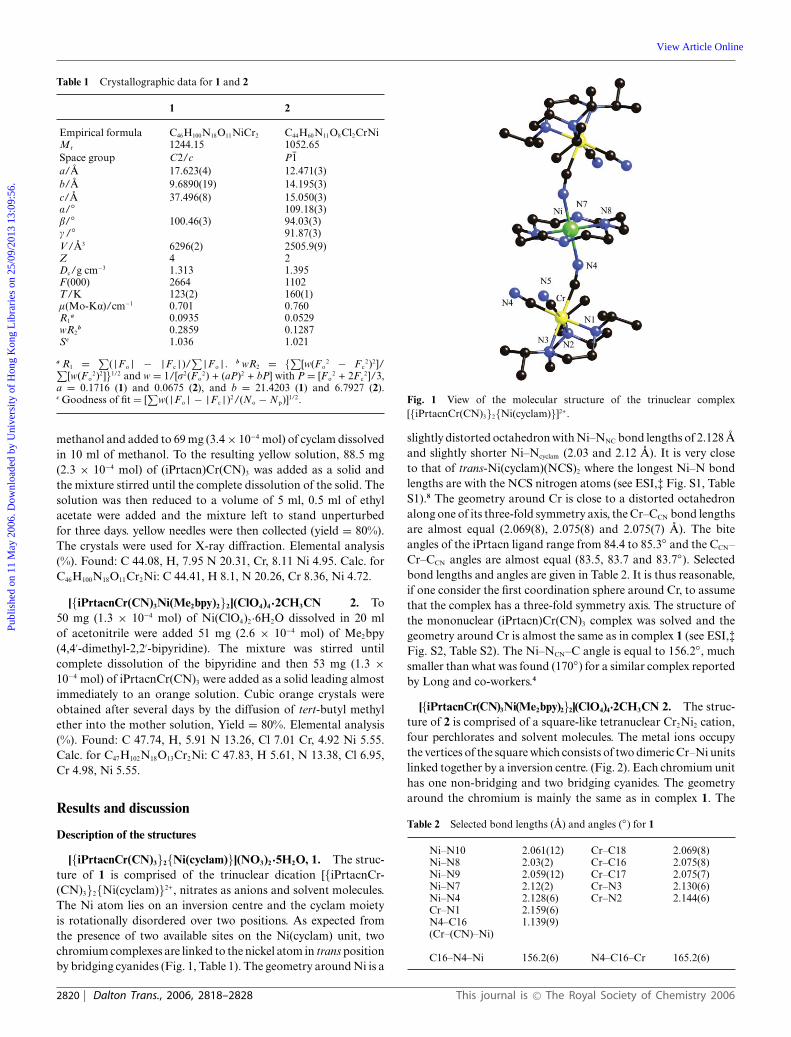
Table 1 Crystallographic data for 1 and 2
1 2
Empirical formula C46H100N18O11NiCr2 C44H60N11O8Cl2CrNiMr 1244.15 1052.65Space group C2/c P1a/A 17.623(4) 12.471(3)b/A 9.6890(19) 14.195(3)c/A 37.496(8) 15.050(3)a/◦ 109.18(3)b/◦ 100.46(3) 94.03(3)c /◦ 91.87(3)V/A3 6296(2) 2505.9(9)Z 4 2Dc/g cm−3 1.313 1.395F(000) 2664 1102T/K 123(2) 160(1)l(Mo-Ka)/cm−1 0.701 0.760R1
a 0.0935 0.0529wR2
b 0.2859 0.1287Sc 1.036 1.021
a R1 = ∑(|F o| − |F c|)/
∑|F o|. b wR2 = {
∑[w(F o
2 − F c2)2]/∑
[w(F o2)2]}1/2 and w = 1/[r2(F o
2) + (aP)2 + bP] with P = [F o2 + 2F c
2]/3,a = 0.1716 (1) and 0.0675 (2), and b = 21.4203 (1) and 6.7927 (2).c Goodness of fit = [
∑w(|F o| − |F c|)2/(No − Np)]1/2.
methanol and added to 69 mg (3.4 × 10⁻⁴ mol) of cyclam dissolvedin 10 ml of methanol. To the resulting yellow solution, 88.5 mg(2.3 × 10⁻⁴ mol) of (iPrtacn)Cr(CN)3 was added as a solid andthe mixture stirred until the complete dissolution of the solid. Thesolution was then reduced to a volume of 5 ml, 0.5 ml of ethylacetate were added and the mixture left to stand unperturbedfor three days. yellow needles were then collected (yield = 80%).The crystals were used for X-ray diffraction. Elemental analysis(%). Found: C 44.08, H, 7.95 N 20.31, Cr, 8.11 Ni 4.95. Calc. forC46H100N18O11Cr2Ni: C 44.41, H 8.1, N 20.26, Cr 8.36, Ni 4.72.
[{iPrtacnCr(CN)3Ni(Me2bpy)2}2](ClO4)4·2CH3CN 2. To50 mg (1.3 × 10⁻⁴ mol) of Ni(ClO4)2·6H2O dissolved in 20 mlof acetonitrile were added 51 mg (2.6 × 10⁻⁴ mol) of Me2bpy(4,4′-dimethyl-2,2′-bipyridine). The mixture was stirred untilcomplete dissolution of the bipyridine and then 53 mg (1.3 ×10⁻⁴ mol) of iPrtacnCr(CN)3 were added as a solid leading almostimmediately to an orange solution. Cubic orange crystals wereobtained after several days by the diffusion of tert-butyl methylether into the mother solution, Yield = 80%. Elemental analysis(%). Found: C 47.74, H, 5.91 N 13.26, Cl 7.01 Cr, 4.92 Ni 5.55.Calc. for C47H102N18O13Cr2Ni: C 47.83, H 5.61, N 13.38, Cl 6.95,Cr 4.98, Ni 5.55.
Results and discussion
Description of the structures
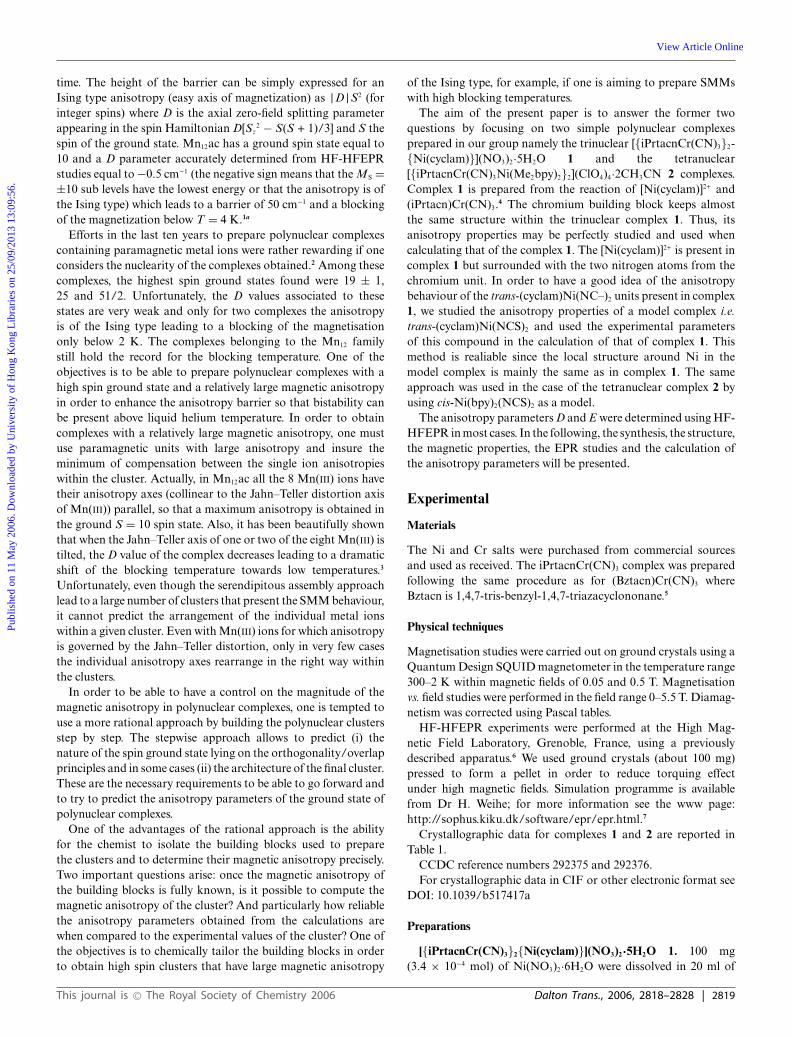
[{iPrtacnCr(CN)3}2{Ni(cyclam)}](NO3)2·5H2O, 1. The struc-ture of 1 is comprised of the trinuclear dication [{iPrtacnCr-(CN)3}2{Ni(cyclam)}2+, nitrates as anions and solvent molecules.The Ni atom lies on an inversion centre and the cyclam moietyis rotationally disordered over two positions. As expected fromthe presence of two available sites on the Ni(cyclam) unit, twochromium complexes are linked to the nickel atom in trans positionby bridging cyanides (Fig. 1, Table 1). The geometry around Ni is a
Fig. 1 View of the molecular structure of the trinuclear complex[{iPrtacnCr(CN)3}2{Ni(cyclam)}]2+.
slightly distorted octahedron with Ni–NNC bond lengths of 2.128 Aand slightly shorter Ni–Ncyclam (2.03 and 2.12 A). It is very closeto that of trans-Ni(cyclam)(NCS)2 where the longest Ni–N bondlengths are with the NCS nitrogen atoms (see ESI,‡ Fig. S1, TableS1).8 The geometry around Cr is close to a distorted octahedronalong one of its three-fold symmetry axis, the Cr–CCN bond lengthsare almost equal (2.069(8), 2.075(8) and 2.075(7) A). The biteangles of the iPrtacn ligand range from 84.4 to 85.3◦ and the CCN–Cr–CCN angles are almost equal (83.5, 83.7 and 83.7◦). Selectedbond lengths and angles are given in Table 2. It is thus reasonable,if one consider the first coordination sphere around Cr, to assumethat the complex has a three-fold symmetry axis. The structure ofthe mononuclear (iPrtacn)Cr(CN)3 complex was solved and thegeometry around Cr is almost the same as in complex 1 (see ESI,‡Fig. S2, Table S2). The Ni–NCN–C angle is equal to 156.2◦, muchsmaller than what was found (170◦) for a similar complex reportedby Long and co-workers.4
[{iPrtacnCr(CN)3Ni(Me2bpy)2}2](ClO4)4·2CH3CN 2. The struc-ture of 2 is comprised of a square-like tetranuclear Cr2Ni2 cation,four perchlorates and solvent molecules. The metal ions occupythe vertices of the square which consists of two dimeric Cr–Ni unitslinked together by a inversion centre. (Fig. 2). Each chromium unithas one non-bridging and two bridging cyanides. The geometryaround the chromium is mainly the same as in complex 1. The
Table 2 Selected bond lengths (A) and angles (◦) for 1
Ni–N10 2.061(12) Cr–C18 2.069(8)Ni–N8 2.03(2) Cr–C16 2.075(8)Ni–N9 2.059(12) Cr–C17 2.075(7)Ni–N7 2.12(2) Cr–N3 2.130(6)Ni–N4 2.128(6) Cr–N2 2.144(6)Cr–N1 2.159(6)N4–C16(Cr–(CN)–Ni)
1.139(9)
C16–N4–Ni 156.2(6) N4–C16–Cr 165.2(6)
2820 | Dalton Trans., 2006, 2818–2828 This journal is © The Royal Society of Chemistry 2006
Publ
ishe
d on
11
May
200
6. D
ownl
oade
d by
Uni
vers
ity o
f H
ong
Kon
g L
ibra
ries
on
25/0
9/20
13 1
3:09
:56.
View Article Online
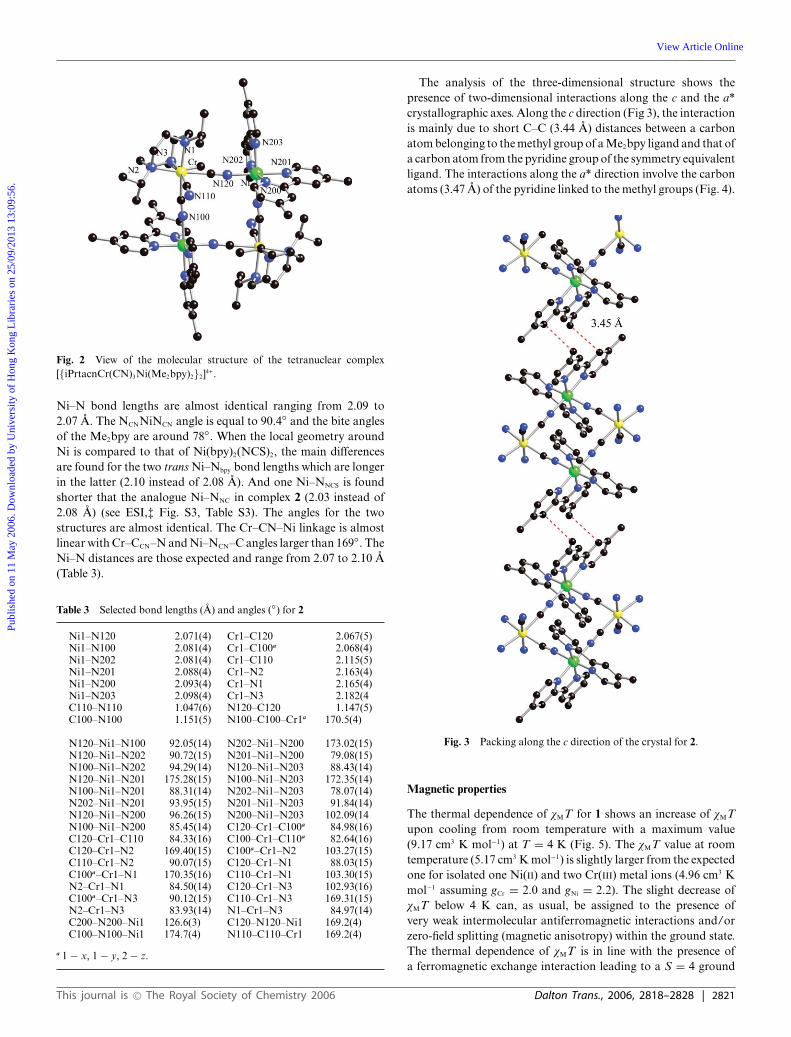
Fig. 2 View of the molecular structure of the tetranuclear complex[{iPrtacnCr(CN)3Ni(Me2bpy)2}2]4+.
Ni–N bond lengths are almost identical ranging from 2.09 to2.07 A. The NCNNiNCN angle is equal to 90.4◦ and the bite anglesof the Me2bpy are around 78◦. When the local geometry aroundNi is compared to that of Ni(bpy)2(NCS)2, the main differencesare found for the two trans Ni–Nbpy bond lengths which are longerin the latter (2.10 instead of 2.08 A). And one Ni–NNCS is foundshorter that the analogue Ni–NNC in complex 2 (2.03 instead of2.08 A) (see ESI,‡ Fig. S3, Table S3). The angles for the twostructures are almost identical. The Cr–CN–Ni linkage is almostlinear with Cr–CCN–N and Ni–NCN–C angles larger than 169◦. TheNi–N distances are those expected and range from 2.07 to 2.10 A(Table 3).
Table 3 Selected bond lengths (A) and angles (◦) for 2
Ni1–N120 2.071(4) Cr1–C120 2.067(5)Ni1–N100 2.081(4) Cr1–C100a 2.068(4)Ni1–N202 2.081(4) Cr1–C110 2.115(5)Ni1–N201 2.088(4) Cr1–N2 2.163(4)Ni1–N200 2.093(4) Cr1–N1 2.165(4)Ni1–N203 2.098(4) Cr1–N3 2.182(4C110–N110 1.047(6) N120–C120 1.147(5)C100–N100 1.151(5) N100–C100–Cr1a 170.5(4)
N120–Ni1–N100 92.05(14) N202–Ni1–N200 173.02(15)N120–Ni1–N202 90.72(15) N201–Ni1–N200 79.08(15)N100–Ni1–N202 94.29(14) N120–Ni1–N203 88.43(14)N120–Ni1–N201 175.28(15) N100–Ni1–N203 172.35(14)N100–Ni1–N201 88.31(14) N202–Ni1–N203 78.07(14)N202–Ni1–N201 93.95(15) N201–Ni1–N203 91.84(14)N120–Ni1–N200 96.26(15) N200–Ni1–N203 102.09(14N100–Ni1–N200 85.45(14) C120–Cr1–C100a 84.98(16)C120–Cr1–C110 84.33(16) C100–Cr1–C110a 82.64(16)C120–Cr1–N2 169.40(15) C100a–Cr1–N2 103.27(15)C110–Cr1–N2 90.07(15) C120–Cr1–N1 88.03(15)C100a–Cr1–N1 170.35(16) C110–Cr1–N1 103.30(15)N2–Cr1–N1 84.50(14) C120–Cr1–N3 102.93(16)C100a–Cr1–N3 90.12(15) C110–Cr1–N3 169.31(15)N2–Cr1–N3 83.93(14) N1–Cr1–N3 84.97(14)C200–N200–Ni1 126.6(3) C120–N120–Ni1 169.2(4)C100–N100–Ni1 174.7(4) N110–C110–Cr1 169.2(4)
a 1 − x, 1 − y, 2 − z.
The analysis of the three-dimensional structure shows thepresence of two-dimensional interactions along the c and the a*crystallographic axes. Along the c direction (Fig 3), the interactionis mainly due to short C–C (3.44 A) distances between a carbonatom belonging to the methyl group of a Me2bpy ligand and that ofa carbon atom from the pyridine group of the symmetry equivalentligand. The interactions along the a* direction involve the carbonatoms (3.47 A) of the pyridine linked to the methyl groups (Fig. 4).
Fig. 3 Packing along the c direction of the crystal for 2.
Magnetic properties
The thermal dependence of vMT for 1 shows an increase of vMTupon cooling from room temperature with a maximum value(9.17 cm3 K mol−1) at T = 4 K (Fig. 5). The vMT value at roomtemperature (5.17 cm3 K mol−1) is slightly larger from the expectedone for isolated one Ni(II) and two Cr(III) metal ions (4.96 cm3 Kmol−1 assuming gCr = 2.0 and gNi = 2.2). The slight decrease ofvMT below 4 K can, as usual, be assigned to the presence ofvery weak intermolecular antiferromagnetic interactions and/orzero-field splitting (magnetic anisotropy) within the ground state.The thermal dependence of vMT is in line with the presence ofa ferromagnetic exchange interaction leading to a S = 4 ground
This journal is © The Royal Society of Chemistry 2006 Dalton Trans., 2006, 2818–2828 | 2821
Publ
ishe
d on
11
May
200
6. D
ownl
oade
d by
Uni
vers
ity o
f H
ong
Kon
g L
ibra
ries
on
25/0
9/20
13 1
3:09
:56.
View Article Online
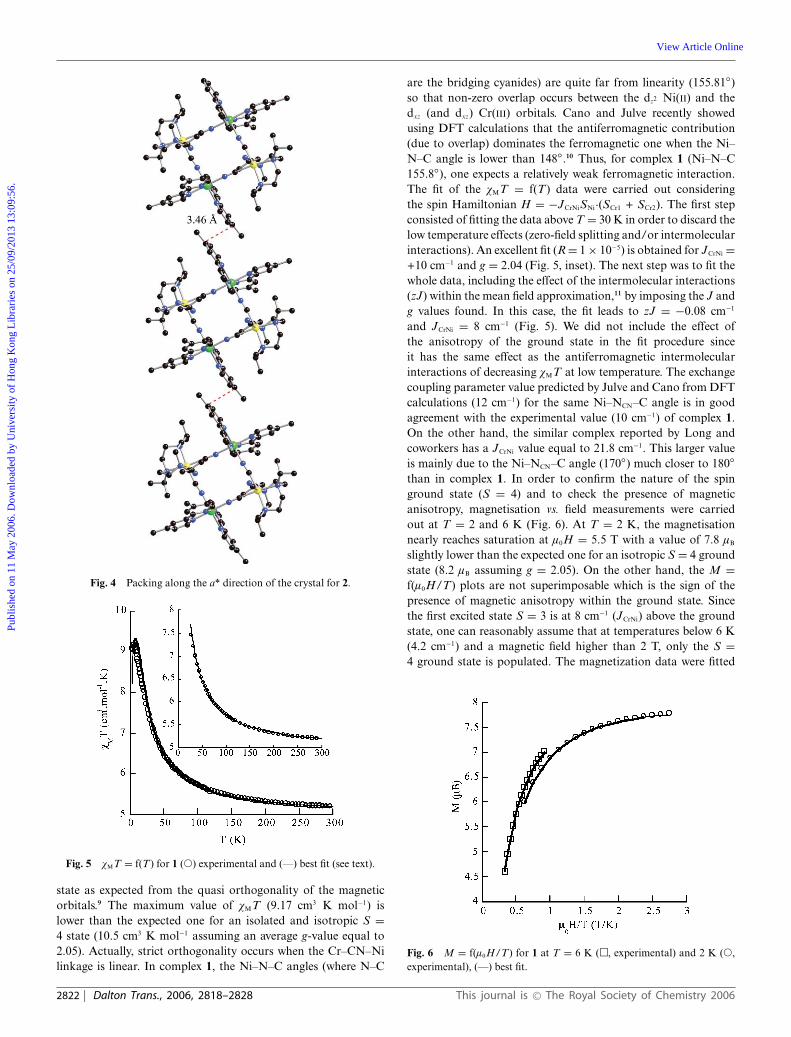
Fig. 4 Packing along the a* direction of the crystal for 2.
Fig. 5 vMT = f(T) for 1 (�) experimental and (—) best fit (see text).
state as expected from the quasi orthogonality of the magneticorbitals.9 The maximum value of vMT (9.17 cm3 K mol−1) islower than the expected one for an isolated and isotropic S =4 state (10.5 cm3 K mol−1 assuming an average g-value equal to2.05). Actually, strict orthogonality occurs when the Cr–CN–Nilinkage is linear. In complex 1, the Ni–N–C angles (where N–C
are the bridging cyanides) are quite far from linearity (155.81◦)so that non-zero overlap occurs between the dz2 Ni(II) and thedxz (and dxz) Cr(III) orbitals. Cano and Julve recently showedusing DFT calculations that the antiferromagnetic contribution(due to overlap) dominates the ferromagnetic one when the Ni–N–C angle is lower than 148◦.10 Thus, for complex 1 (Ni–N–C155.8◦), one expects a relatively weak ferromagnetic interaction.The fit of the vMT = f(T) data were carried out consideringthe spin Hamiltonian H = −JCrNiSNi·(SCr1 + SCr2). The first stepconsisted of fitting the data above T = 30 K in order to discard thelow temperature effects (zero-field splitting and/or intermolecularinteractions). An excellent fit (R = 1 × 10⁻⁵) is obtained for JCrNi =+10 cm−1 and g = 2.04 (Fig. 5, inset). The next step was to fit thewhole data, including the effect of the intermolecular interactions(zJ) within the mean field approximation,11 by imposing the J andg values found. In this case, the fit leads to zJ = −0.08 cm−1
and JCrNi = 8 cm−1 (Fig. 5). We did not include the effect ofthe anisotropy of the ground state in the fit procedure sinceit has the same effect as the antiferromagnetic intermolecularinteractions of decreasing vMT at low temperature. The exchangecoupling parameter value predicted by Julve and Cano from DFTcalculations (12 cm−1) for the same Ni–NCN–C angle is in goodagreement with the experimental value (10 cm−1) of complex 1.On the other hand, the similar complex reported by Long andcoworkers has a JCrNi value equal to 21.8 cm−1. This larger valueis mainly due to the Ni–NCN–C angle (170◦) much closer to 180◦
than in complex 1. In order to confirm the nature of the spinground state (S = 4) and to check the presence of magneticanisotropy, magnetisation vs. field measurements were carriedout at T = 2 and 6 K (Fig. 6). At T = 2 K, the magnetisationnearly reaches saturation at l0H = 5.5 T with a value of 7.8 lB
slightly lower than the expected one for an isotropic S = 4 groundstate (8.2 lB assuming g = 2.05). On the other hand, the M =f(l0H/T) plots are not superimposable which is the sign of thepresence of magnetic anisotropy within the ground state. Sincethe first excited state S = 3 is at 8 cm−1 (JCrNi) above the groundstate, one can reasonably assume that at temperatures below 6 K(4.2 cm−1) and a magnetic field higher than 2 T, only the S =4 ground state is populated. The magnetization data were fitted
Fig. 6 M = f(l0H/T) for 1 at T = 6 K (�, experimental) and 2 K (�,experimental), (—) best fit.
2822 | Dalton Trans., 2006, 2818–2828 This journal is © The Royal Society of Chemistry 2006
Publ
ishe
d on
11
May
200
6. D
ownl
oade
d by
Uni
vers
ity o
f H
ong
Kon
g L
ibra
ries
on
25/0
9/20
13 1
3:09
:56.
View Article Online
by full diagonalization of the energy matrices based on the ZFSHamiltonian HZFS = D4[Sz
2 − S(S + 1)/3] + E4(Sx2 − Sy
2) whereD4 and E4 are the axial and the rhombic ZFS parameters for theground S = 4 spin state, respectively, S the total spin and Sx, Sy andSz the components of the total spin operator. The diagonalisationwas carried out for 120 orientations of the magnetic field in orderto reproduce the magnetization of a powder. The best fit leadsto: D4 = 0.36 cm−1, E/D = 0.16 and g = 2.0. It is worth notinghere that the magnetization studies on powder do not give precisevalues of the anisotropy parameters; generally only the value ofthe axial parameter (D) is reliable since one can obtain good fitsfor almost any value of the rhombic parameter without changingthe value of D. As we will see in the next section, HF-HFEPRwill enable a precise determination of the anisotropy parameterD4 and E4.
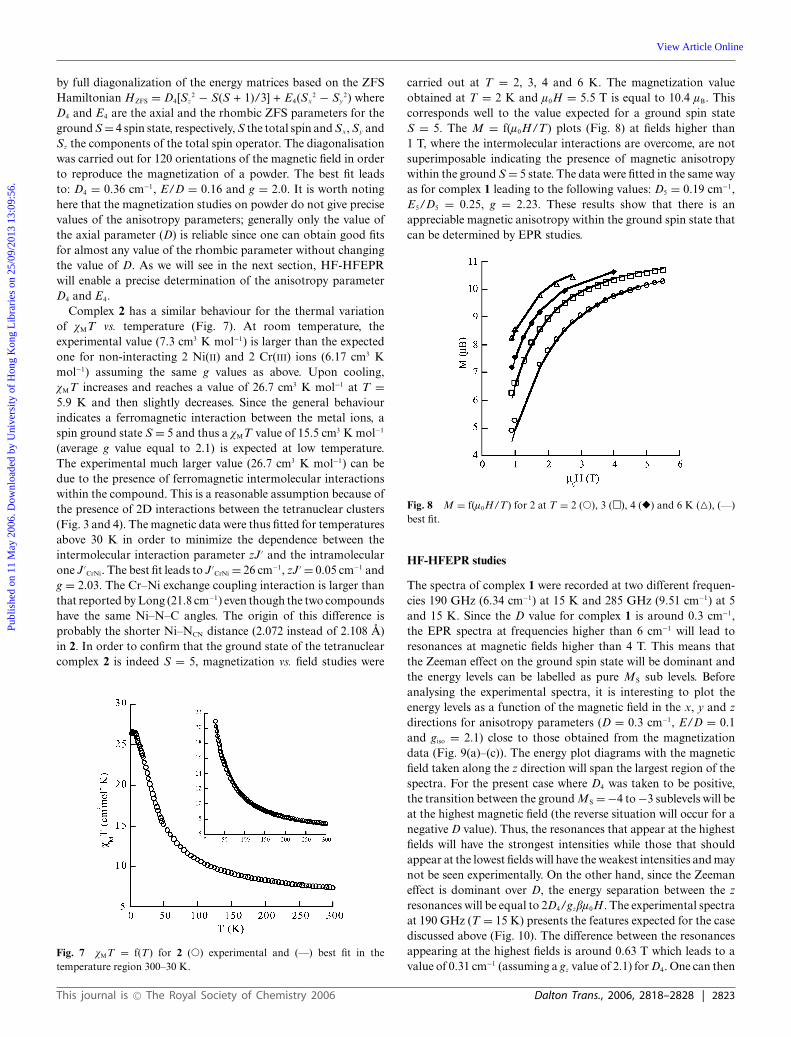
Complex 2 has a similar behaviour for the thermal variationof vMT vs. temperature (Fig. 7). At room temperature, theexperimental value (7.3 cm3 K mol−1) is larger than the expectedone for non-interacting 2 Ni(II) and 2 Cr(III) ions (6.17 cm3 Kmol−1) assuming the same g values as above. Upon cooling,vMT increases and reaches a value of 26.7 cm3 K mol−1 at T =5.9 K and then slightly decreases. Since the general behaviourindicates a ferromagnetic interaction between the metal ions, aspin ground state S = 5 and thus a vMT value of 15.5 cm3 K mol−1
(average g value equal to 2.1) is expected at low temperature.The experimental much larger value (26.7 cm3 K mol−1) can bedue to the presence of ferromagnetic intermolecular interactionswithin the compound. This is a reasonable assumption because ofthe presence of 2D interactions between the tetranuclear clusters(Fig. 3 and 4). The magnetic data were thus fitted for temperaturesabove 30 K in order to minimize the dependence between theintermolecular interaction parameter zJ ′ and the intramolecularone J ′
CrNi. The best fit leads to J ′CrNi = 26 cm−1, zJ ′ = 0.05 cm−1 and
g = 2.03. The Cr–Ni exchange coupling interaction is larger thanthat reported by Long (21.8 cm−1) even though the two compoundshave the same Ni–N–C angles. The origin of this difference isprobably the shorter Ni–NCN distance (2.072 instead of 2.108 A)in 2. In order to confirm that the ground state of the tetranuclearcomplex 2 is indeed S = 5, magnetization vs. field studies were
Fig. 7 vMT = f(T) for 2 (�) experimental and (—) best fit in thetemperature region 300–30 K.
carried out at T = 2, 3, 4 and 6 K. The magnetization valueobtained at T = 2 K and l0H = 5.5 T is equal to 10.4 lB. Thiscorresponds well to the value expected for a ground spin stateS = 5. The M = f(l0H/T) plots (Fig. 8) at fields higher than1 T, where the intermolecular interactions are overcome, are notsuperimposable indicating the presence of magnetic anisotropywithin the ground S = 5 state. The data were fitted in the same wayas for complex 1 leading to the following values: D5 = 0.19 cm−1,E5/D5 = 0.25, g = 2.23. These results show that there is anappreciable magnetic anisotropy within the ground spin state thatcan be determined by EPR studies.
Fig. 8 M = f(l0H/T) for 2 at T = 2 (�), 3 (�), 4 (�) and 6 K (�), (—)best fit.
HF-HFEPR studies
The spectra of complex 1 were recorded at two different frequen-cies 190 GHz (6.34 cm−1) at 15 K and 285 GHz (9.51 cm−1) at 5and 15 K. Since the D value for complex 1 is around 0.3 cm−1,the EPR spectra at frequencies higher than 6 cm−1 will lead toresonances at magnetic fields higher than 4 T. This means thatthe Zeeman effect on the ground spin state will be dominant andthe energy levels can be labelled as pure MS sub levels. Beforeanalysing the experimental spectra, it is interesting to plot theenergy levels as a function of the magnetic field in the x, y and zdirections for anisotropy parameters (D = 0.3 cm−1, E/D = 0.1and giso = 2.1) close to those obtained from the magnetizationdata (Fig. 9(a)–(c)). The energy plot diagrams with the magneticfield taken along the z direction will span the largest region of thespectra. For the present case where D4 was taken to be positive,the transition between the ground MS = −4 to −3 sublevels will beat the highest magnetic field (the reverse situation will occur for anegative D value). Thus, the resonances that appear at the highestfields will have the strongest intensities while those that shouldappear at the lowest fields will have the weakest intensities and maynot be seen experimentally. On the other hand, since the Zeemaneffect is dominant over D, the energy separation between the zresonances will be equal to 2D4/gzbl0H. The experimental spectraat 190 GHz (T = 15 K) presents the features expected for the casediscussed above (Fig. 10). The difference between the resonancesappearing at the highest fields is around 0.63 T which leads to avalue of 0.31 cm−1 (assuming a gz value of 2.1) for D4. One can then
This journal is © The Royal Society of Chemistry 2006 Dalton Trans., 2006, 2818–2828 | 2823
Publ
ishe
d on
11
May
200
6. D
ownl
oade
d by
Uni
vers
ity o
f H
ong
Kon
g L
ibra
ries
on
25/0
9/20
13 1
3:09
:56.
View Article Online
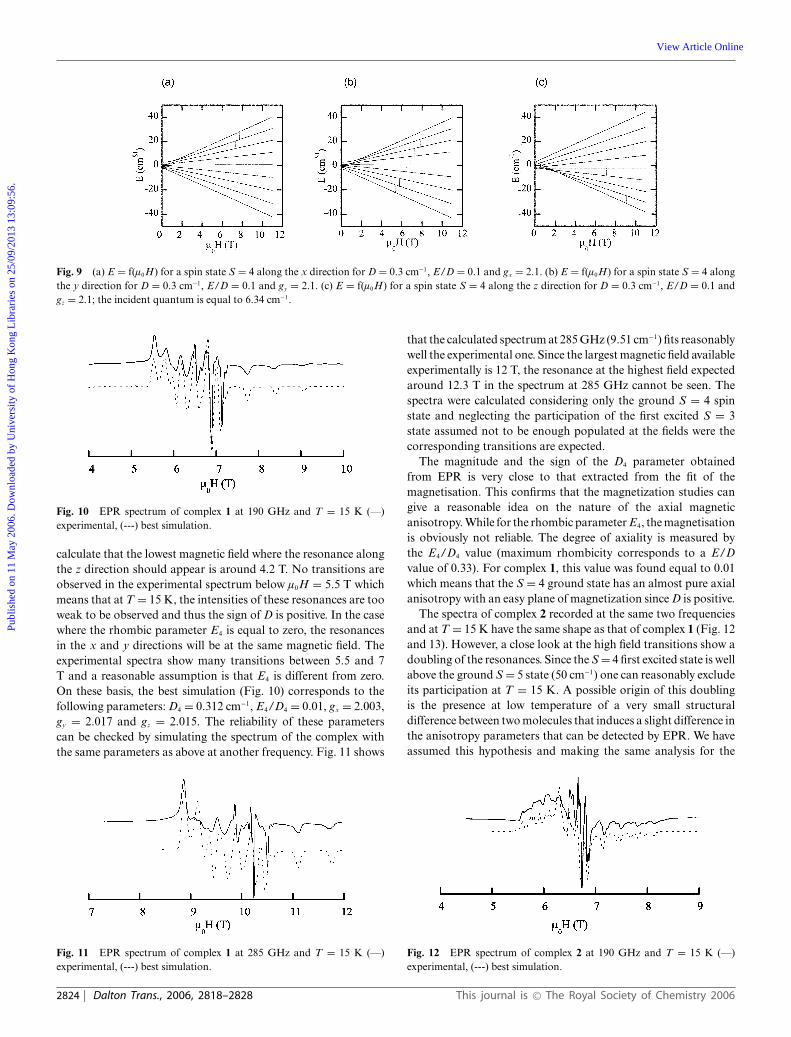
Fig. 9 (a) E = f(l0H) for a spin state S = 4 along the x direction for D = 0.3 cm−1, E/D = 0.1 and gx = 2.1. (b) E = f(l0H) for a spin state S = 4 alongthe y direction for D = 0.3 cm−1, E/D = 0.1 and gy = 2.1. (c) E = f(l0H) for a spin state S = 4 along the z direction for D = 0.3 cm−1, E/D = 0.1 andgz = 2.1; the incident quantum is equal to 6.34 cm−1.
Fig. 10 EPR spectrum of complex 1 at 190 GHz and T = 15 K (—)experimental, (---) best simulation.
calculate that the lowest magnetic field where the resonance alongthe z direction should appear is around 4.2 T. No transitions areobserved in the experimental spectrum below l0H = 5.5 T whichmeans that at T = 15 K, the intensities of these resonances are tooweak to be observed and thus the sign of D is positive. In the casewhere the rhombic parameter E4 is equal to zero, the resonancesin the x and y directions will be at the same magnetic field. Theexperimental spectra show many transitions between 5.5 and 7T and a reasonable assumption is that E4 is different from zero.On these basis, the best simulation (Fig. 10) corresponds to thefollowing parameters: D4 = 0.312 cm−1, E4/D4 = 0.01, gx = 2.003,gy = 2.017 and gz = 2.015. The reliability of these parameterscan be checked by simulating the spectrum of the complex withthe same parameters as above at another frequency. Fig. 11 shows
Fig. 11 EPR spectrum of complex 1 at 285 GHz and T = 15 K (—)experimental, (---) best simulation.
that the calculated spectrum at 285 GHz (9.51 cm−1) fits reasonablywell the experimental one. Since the largest magnetic field availableexperimentally is 12 T, the resonance at the highest field expectedaround 12.3 T in the spectrum at 285 GHz cannot be seen. Thespectra were calculated considering only the ground S = 4 spinstate and neglecting the participation of the first excited S = 3state assumed not to be enough populated at the fields were thecorresponding transitions are expected.
The magnitude and the sign of the D4 parameter obtainedfrom EPR is very close to that extracted from the fit of themagnetisation. This confirms that the magnetization studies cangive a reasonable idea on the nature of the axial magneticanisotropy. While for the rhombic parameter E4, the magnetisationis obviously not reliable. The degree of axiality is measured bythe E4/D4 value (maximum rhombicity corresponds to a E/Dvalue of 0.33). For complex 1, this value was found equal to 0.01which means that the S = 4 ground state has an almost pure axialanisotropy with an easy plane of magnetization since D is positive.
The spectra of complex 2 recorded at the same two frequenciesand at T = 15 K have the same shape as that of complex 1 (Fig. 12and 13). However, a close look at the high field transitions show adoubling of the resonances. Since the S = 4 first excited state is wellabove the ground S = 5 state (50 cm−1) one can reasonably excludeits participation at T = 15 K. A possible origin of this doublingis the presence at low temperature of a very small structuraldifference between two molecules that induces a slight difference inthe anisotropy parameters that can be detected by EPR. We haveassumed this hypothesis and making the same analysis for the
Fig. 12 EPR spectrum of complex 2 at 190 GHz and T = 15 K (—)experimental, (---) best simulation.
2824 | Dalton Trans., 2006, 2818–2828 This journal is © The Royal Society of Chemistry 2006
Publ
ishe
d on
11
May
200
6. D
ownl
oade
d by
Uni
vers
ity o
f H
ong
Kon
g L
ibra
ries
on
25/0
9/20
13 1
3:09
:56.
View Article Online
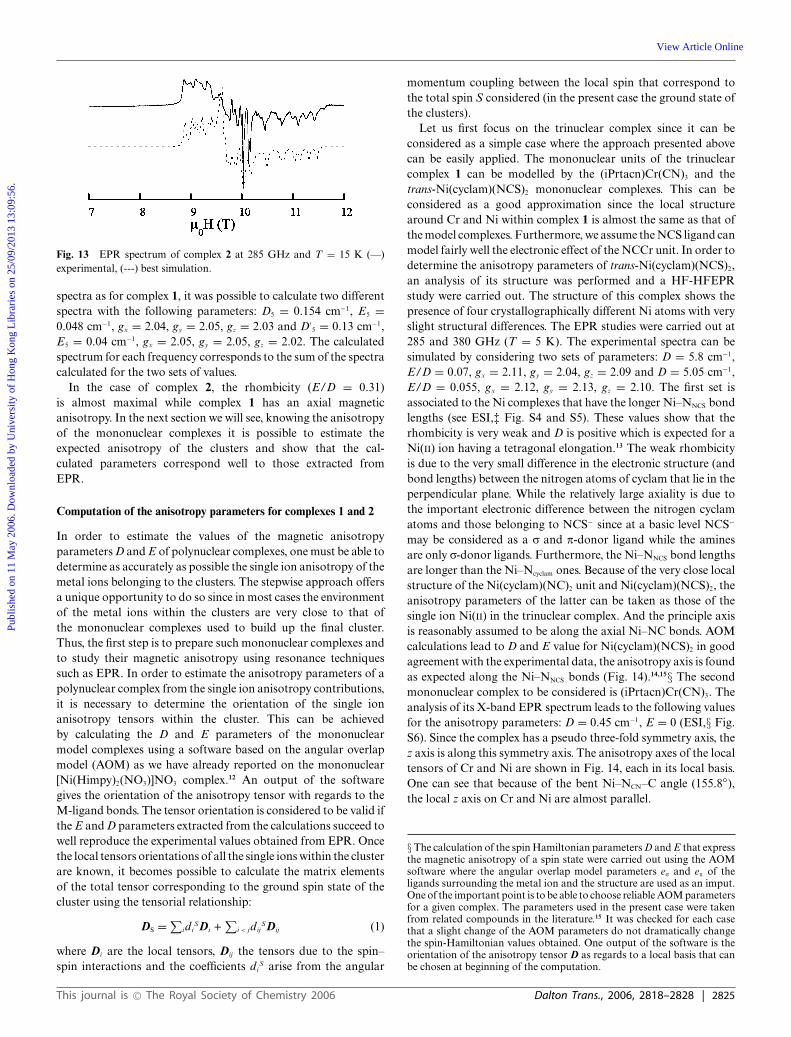
Fig. 13 EPR spectrum of complex 2 at 285 GHz and T = 15 K (—)experimental, (---) best simulation.
spectra as for complex 1, it was possible to calculate two differentspectra with the following parameters: D5 = 0.154 cm−1, E5 =0.048 cm−1, gx = 2.04, gy = 2.05, gz = 2.03 and D′
5 = 0.13 cm−1,E5 = 0.04 cm−1, gx = 2.05, gy = 2.05, gz = 2.02. The calculatedspectrum for each frequency corresponds to the sum of the spectracalculated for the two sets of values.
In the case of complex 2, the rhombicity (E/D = 0.31)is almost maximal while complex 1 has an axial magneticanisotropy. In the next section we will see, knowing the anisotropyof the mononuclear complexes it is possible to estimate theexpected anisotropy of the clusters and show that the cal-culated parameters correspond well to those extracted fromEPR.
Computation of the anisotropy parameters for complexes 1 and 2
In order to estimate the values of the magnetic anisotropyparameters D and E of polynuclear complexes, one must be able todetermine as accurately as possible the single ion anisotropy of themetal ions belonging to the clusters. The stepwise approach offersa unique opportunity to do so since in most cases the environmentof the metal ions within the clusters are very close to that ofthe mononuclear complexes used to build up the final cluster.Thus, the first step is to prepare such mononuclear complexes andto study their magnetic anisotropy using resonance techniquessuch as EPR. In order to estimate the anisotropy parameters of apolynuclear complex from the single ion anisotropy contributions,it is necessary to determine the orientation of the single ionanisotropy tensors within the cluster. This can be achievedby calculating the D and E parameters of the mononuclearmodel complexes using a software based on the angular overlapmodel (AOM) as we have already reported on the mononuclear[Ni(Himpy)2(NO3)]NO3 complex.12 An output of the softwaregives the orientation of the anisotropy tensor with regards to theM-ligand bonds. The tensor orientation is considered to be valid ifthe E and D parameters extracted from the calculations succeed towell reproduce the experimental values obtained from EPR. Oncethe local tensors orientations of all the single ions within the clusterare known, it becomes possible to calculate the matrix elementsof the total tensor corresponding to the ground spin state of thecluster using the tensorial relationship:
DS = ∑idi
SDi +∑
i < jdijSDij (1)
where Di are the local tensors, Dij the tensors due to the spin–spin interactions and the coefficients di
S arise from the angular
momentum coupling between the local spin that correspond tothe total spin S considered (in the present case the ground state ofthe clusters).
Let us first focus on the trinuclear complex since it can beconsidered as a simple case where the approach presented abovecan be easily applied. The mononuclear units of the trinuclearcomplex 1 can be modelled by the (iPrtacn)Cr(CN)3 and thetrans-Ni(cyclam)(NCS)2 mononuclear complexes. This can beconsidered as a good approximation since the local structurearound Cr and Ni within complex 1 is almost the same as that ofthe model complexes. Furthermore, we assume the NCS ligand canmodel fairly well the electronic effect of the NCCr unit. In order todetermine the anisotropy parameters of trans-Ni(cyclam)(NCS)2,an analysis of its structure was performed and a HF-HFEPRstudy were carried out. The structure of this complex shows thepresence of four crystallographically different Ni atoms with veryslight structural differences. The EPR studies were carried out at285 and 380 GHz (T = 5 K). The experimental spectra can besimulated by considering two sets of parameters: D = 5.8 cm−1,E/D = 0.07, gx = 2.11, gy = 2.04, gz = 2.09 and D = 5.05 cm−1,E/D = 0.055, gx = 2.12, gy = 2.13, gz = 2.10. The first set isassociated to the Ni complexes that have the longer Ni–NNCS bondlengths (see ESI,‡ Fig. S4 and S5). These values show that therhombicity is very weak and D is positive which is expected for aNi(II) ion having a tetragonal elongation.13 The weak rhombicityis due to the very small difference in the electronic structure (andbond lengths) between the nitrogen atoms of cyclam that lie in theperpendicular plane. While the relatively large axiality is due tothe important electronic difference between the nitrogen cyclamatoms and those belonging to NCS− since at a basic level NCS−
may be considered as a r and p-donor ligand while the aminesare only r-donor ligands. Furthermore, the Ni–NNCS bond lengthsare longer than the Ni–Ncyclam ones. Because of the very close localstructure of the Ni(cyclam)(NC)2 unit and Ni(cyclam)(NCS)2, theanisotropy parameters of the latter can be taken as those of thesingle ion Ni(II) in the trinuclear complex. And the principle axisis reasonably assumed to be along the axial Ni–NC bonds. AOMcalculations lead to D and E value for Ni(cyclam)(NCS)2 in goodagreement with the experimental data, the anisotropy axis is foundas expected along the Ni–NNCS bonds (Fig. 14).14,15§ The secondmononuclear complex to be considered is (iPrtacn)Cr(CN)3. Theanalysis of its X-band EPR spectrum leads to the following valuesfor the anisotropy parameters: D = 0.45 cm−1, E = 0 (ESI,§ Fig.S6). Since the complex has a pseudo three-fold symmetry axis, thez axis is along this symmetry axis. The anisotropy axes of the localtensors of Cr and Ni are shown in Fig. 14, each in its local basis.One can see that because of the bent Ni–NCN–C angle (155.8◦),the local z axis on Cr and Ni are almost parallel.
§The calculation of the spin Hamiltonian parameters D and E that expressthe magnetic anisotropy of a spin state were carried out using the AOMsoftware where the angular overlap model parameters er and ep of theligands surrounding the metal ion and the structure are used as an imput.One of the important point is to be able to choose reliable AOM parametersfor a given complex. The parameters used in the present case were takenfrom related compounds in the literature.15 It was checked for each casethat a slight change of the AOM parameters do not dramatically changethe spin-Hamiltonian values obtained. One output of the software is theorientation of the anisotropy tensor D as regards to a local basis that canbe chosen at beginning of the computation.
This journal is © The Royal Society of Chemistry 2006 Dalton Trans., 2006, 2818–2828 | 2825
Publ
ishe
d on
11
May
200
6. D
ownl
oade
d by
Uni
vers
ity o
f H
ong
Kon
g L
ibra
ries
on
25/0
9/20
13 1
3:09
:56.
View Article Online
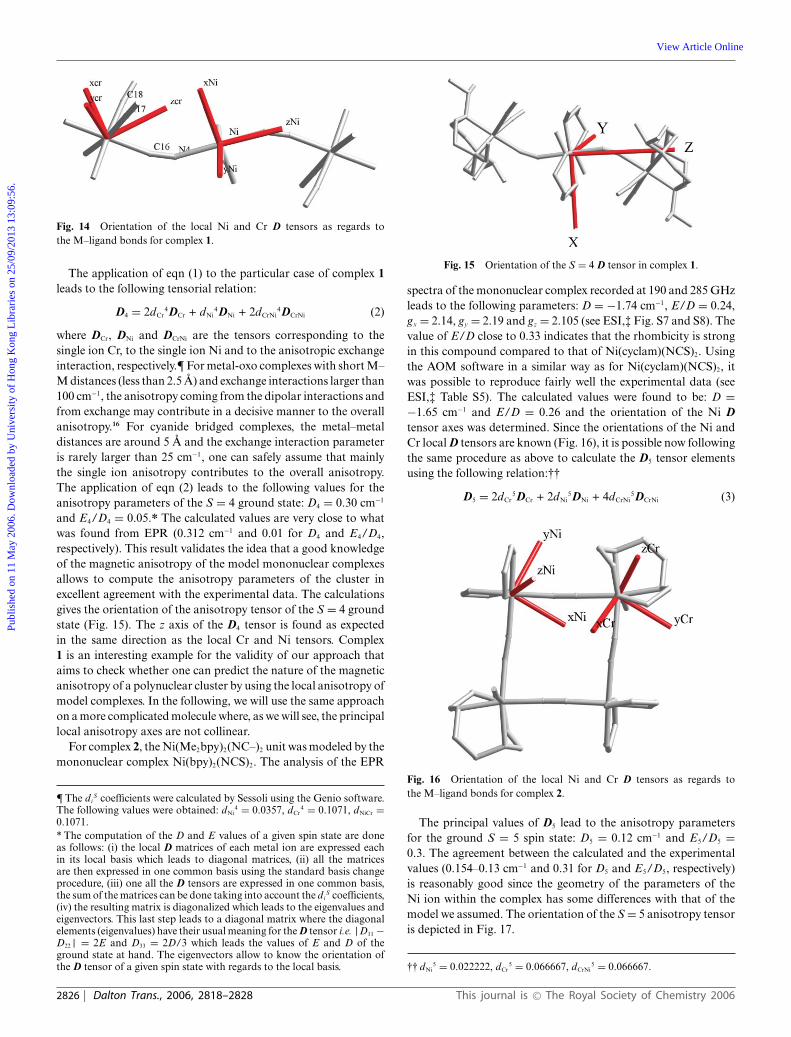
Fig. 14 Orientation of the local Ni and Cr D tensors as regards tothe M–ligand bonds for complex 1.
The application of eqn (1) to the particular case of complex 1leads to the following tensorial relation:
D4 = 2dCr4DCr + dNi
4DNi + 2dCrNi4DCrNi (2)
where DCr, DNi and DCrNi are the tensors corresponding to thesingle ion Cr, to the single ion Ni and to the anisotropic exchangeinteraction, respectively.¶For metal-oxo complexes with short M–M distances (less than 2.5 A) and exchange interactions larger than100 cm−1, the anisotropy coming from the dipolar interactions andfrom exchange may contribute in a decisive manner to the overallanisotropy.16 For cyanide bridged complexes, the metal–metaldistances are around 5 A and the exchange interaction parameteris rarely larger than 25 cm−1, one can safely assume that mainlythe single ion anisotropy contributes to the overall anisotropy.The application of eqn (2) leads to the following values for theanisotropy parameters of the S = 4 ground state: D4 = 0.30 cm−1
and E4/D4 = 0.05.* The calculated values are very close to whatwas found from EPR (0.312 cm−1 and 0.01 for D4 and E4/D4,respectively). This result validates the idea that a good knowledgeof the magnetic anisotropy of the model mononuclear complexesallows to compute the anisotropy parameters of the cluster inexcellent agreement with the experimental data. The calculationsgives the orientation of the anisotropy tensor of the S = 4 groundstate (Fig. 15). The z axis of the D4 tensor is found as expectedin the same direction as the local Cr and Ni tensors. Complex1 is an interesting example for the validity of our approach thataims to check whether one can predict the nature of the magneticanisotropy of a polynuclear cluster by using the local anisotropy ofmodel complexes. In the following, we will use the same approachon a more complicated molecule where, as we will see, the principallocal anisotropy axes are not collinear.
For complex 2, the Ni(Me2bpy)2(NC–)2 unit was modeled by themononuclear complex Ni(bpy)2(NCS)2. The analysis of the EPR
¶ The diS coefficients were calculated by Sessoli using the Genio software.
The following values were obtained: dNi4 = 0.0357, dCr
4 = 0.1071, dNiCr =0.1071.* The computation of the D and E values of a given spin state are doneas follows: (i) the local D matrices of each metal ion are expressed eachin its local basis which leads to diagonal matrices, (ii) all the matricesare then expressed in one common basis using the standard basis changeprocedure, (iii) one all the D tensors are expressed in one common basis,the sum of the matrices can be done taking into account the di
S coefficients,(iv) the resulting matrix is diagonalized which leads to the eigenvalues andeigenvectors. This last step leads to a diagonal matrix where the diagonalelements (eigenvalues) have their usual meaning for the D tensor i.e. |D11 −D22| = 2E and D33 = 2D/3 which leads the values of E and D of theground state at hand. The eigenvectors allow to know the orientation ofthe D tensor of a given spin state with regards to the local basis.
Fig. 15 Orientation of the S = 4 D tensor in complex 1.
spectra of the mononuclear complex recorded at 190 and 285 GHzleads to the following parameters: D = −1.74 cm−1, E/D = 0.24,gx = 2.14, gy = 2.19 and gz = 2.105 (see ESI,‡ Fig. S7 and S8). Thevalue of E/D close to 0.33 indicates that the rhombicity is strongin this compound compared to that of Ni(cyclam)(NCS)2. Usingthe AOM software in a similar way as for Ni(cyclam)(NCS)2, itwas possible to reproduce fairly well the experimental data (seeESI,‡ Table S5). The calculated values were found to be: D =−1.65 cm−1 and E/D = 0.26 and the orientation of the Ni Dtensor axes was determined. Since the orientations of the Ni andCr local D tensors are known (Fig. 16), it is possible now followingthe same procedure as above to calculate the D5 tensor elementsusing the following relation:††
D5 = 2dCr5DCr + 2dNi
5DNi + 4dCrNi5DCrNi (3)
Fig. 16 Orientation of the local Ni and Cr D tensors as regards tothe M–ligand bonds for complex 2.
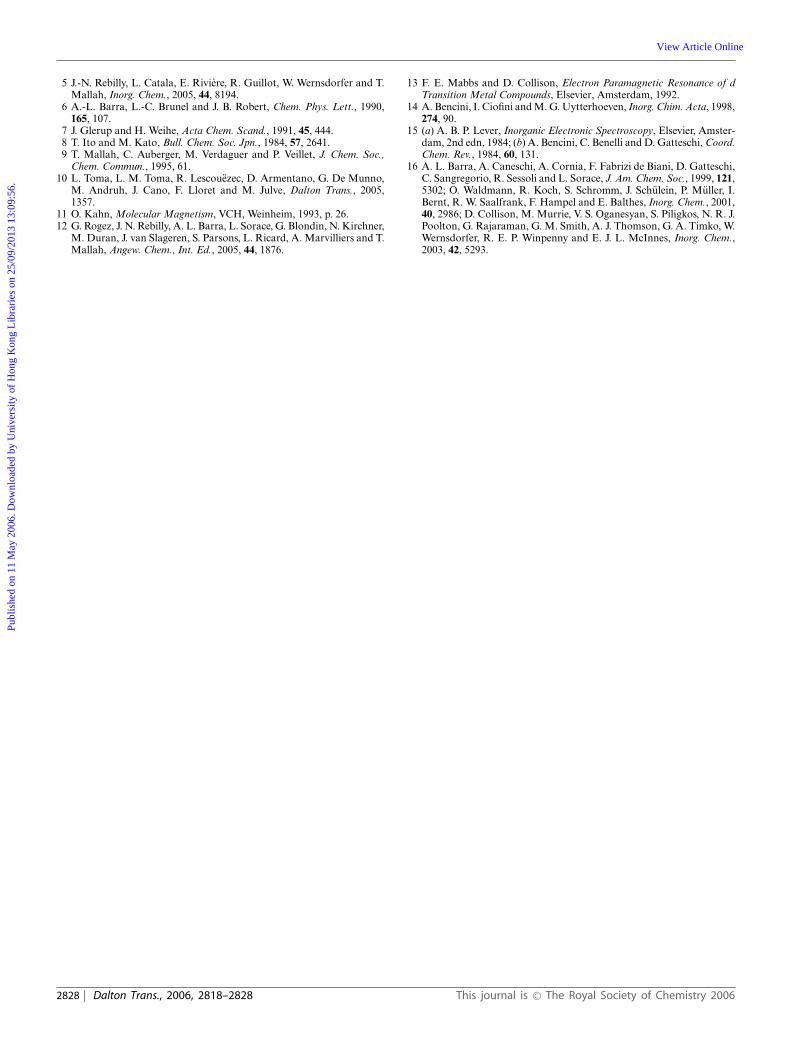
The principal values of D5 lead to the anisotropy parametersfor the ground S = 5 spin state: D5 = 0.12 cm−1 and E5/D5 =0.3. The agreement between the calculated and the experimentalvalues (0.154–0.13 cm−1 and 0.31 for D5 and E5/D5, respectively)is reasonably good since the geometry of the parameters of theNi ion within the complex has some differences with that of themodel we assumed. The orientation of the S = 5 anisotropy tensoris depicted in Fig. 17.
†† dNi5 = 0.022222, dCr
5 = 0.066667, dCrNi5 = 0.066667.
2826 | Dalton Trans., 2006, 2818–2828 This journal is © The Royal Society of Chemistry 2006
Publ
ishe
d on
11
May
200
6. D
ownl
oade
d by
Uni
vers
ity o
f H
ong
Kon
g L
ibra
ries
on
25/0
9/20
13 1
3:09
:56.
View Article Online
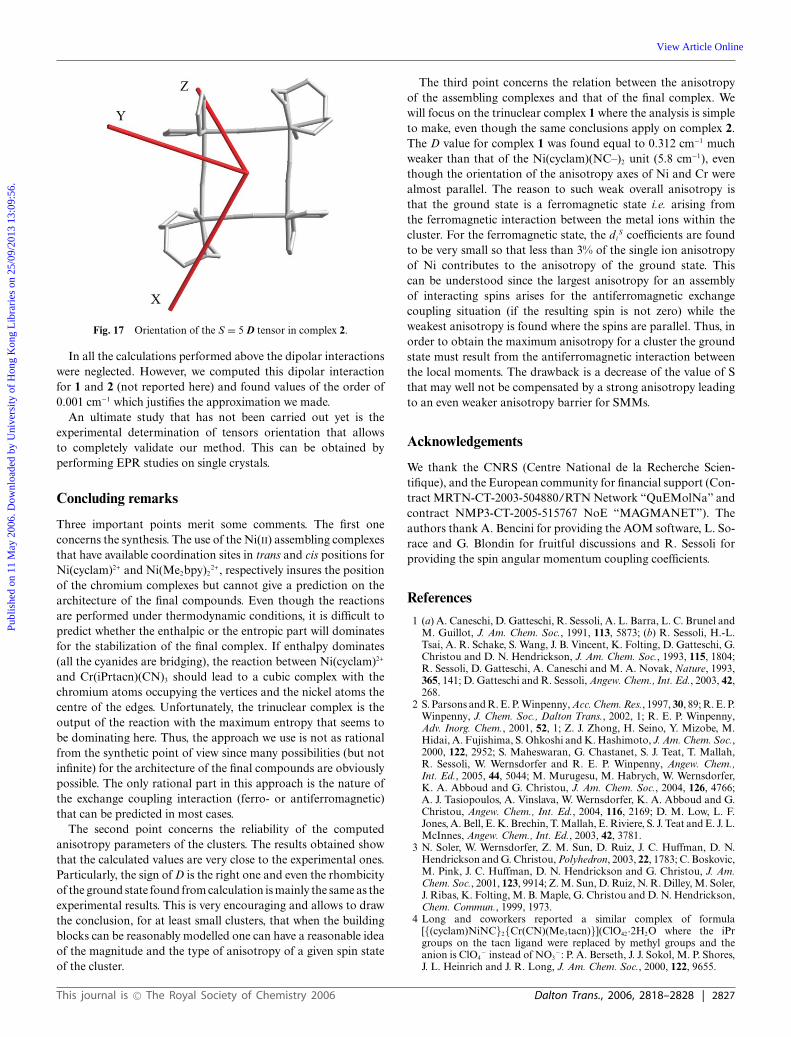
Fig. 17 Orientation of the S = 5 D tensor in complex 2.
In all the calculations performed above the dipolar interactionswere neglected. However, we computed this dipolar interactionfor 1 and 2 (not reported here) and found values of the order of0.001 cm−1 which justifies the approximation we made.
An ultimate study that has not been carried out yet is theexperimental determination of tensors orientation that allowsto completely validate our method. This can be obtained byperforming EPR studies on single crystals.
Concluding remarks
Three important points merit some comments. The first oneconcerns the synthesis. The use of the Ni(II) assembling complexesthat have available coordination sites in trans and cis positions forNi(cyclam)2+ and Ni(Me2bpy)2
2+, respectively insures the positionof the chromium complexes but cannot give a prediction on thearchitecture of the final compounds. Even though the reactionsare performed under thermodynamic conditions, it is difficult topredict whether the enthalpic or the entropic part will dominatesfor the stabilization of the final complex. If enthalpy dominates(all the cyanides are bridging), the reaction between Ni(cyclam)2+
and Cr(iPrtacn)(CN)3 should lead to a cubic complex with thechromium atoms occupying the vertices and the nickel atoms thecentre of the edges. Unfortunately, the trinuclear complex is theoutput of the reaction with the maximum entropy that seems tobe dominating here. Thus, the approach we use is not as rationalfrom the synthetic point of view since many possibilities (but notinfinite) for the architecture of the final compounds are obviouslypossible. The only rational part in this approach is the nature ofthe exchange coupling interaction (ferro- or antiferromagnetic)that can be predicted in most cases.
The second point concerns the reliability of the computedanisotropy parameters of the clusters. The results obtained showthat the calculated values are very close to the experimental ones.Particularly, the sign of D is the right one and even the rhombicityof the ground state found from calculation is mainly the same as theexperimental results. This is very encouraging and allows to drawthe conclusion, for at least small clusters, that when the buildingblocks can be reasonably modelled one can have a reasonable ideaof the magnitude and the type of anisotropy of a given spin stateof the cluster.
The third point concerns the relation between the anisotropyof the assembling complexes and that of the final complex. Wewill focus on the trinuclear complex 1 where the analysis is simpleto make, even though the same conclusions apply on complex 2.The D value for complex 1 was found equal to 0.312 cm−1 muchweaker than that of the Ni(cyclam)(NC–)2 unit (5.8 cm−1), eventhough the orientation of the anisotropy axes of Ni and Cr werealmost parallel. The reason to such weak overall anisotropy isthat the ground state is a ferromagnetic state i.e. arising fromthe ferromagnetic interaction between the metal ions within thecluster. For the ferromagnetic state, the di
S coefficients are foundto be very small so that less than 3% of the single ion anisotropyof Ni contributes to the anisotropy of the ground state. Thiscan be understood since the largest anisotropy for an assemblyof interacting spins arises for the antiferromagnetic exchangecoupling situation (if the resulting spin is not zero) while theweakest anisotropy is found where the spins are parallel. Thus, inorder to obtain the maximum anisotropy for a cluster the groundstate must result from the antiferromagnetic interaction betweenthe local moments. The drawback is a decrease of the value of Sthat may well not be compensated by a strong anisotropy leadingto an even weaker anisotropy barrier for SMMs.
Acknowledgements
We thank the CNRS (Centre National de la Recherche Scien-tifique), and the European community for financial support (Con-tract MRTN-CT-2003-504880/RTN Network “QuEMolNa” andcontract NMP3-CT-2005-515767 NoE “MAGMANET”). Theauthors thank A. Bencini for providing the AOM software, L. So-race and G. Blondin for fruitful discussions and R. Sessoli forproviding the spin angular momentum coupling coefficients.
References
1 (a) A. Caneschi, D. Gatteschi, R. Sessoli, A. L. Barra, L. C. Brunel andM. Guillot, J. Am. Chem. Soc., 1991, 113, 5873; (b) R. Sessoli, H.-L.Tsai, A. R. Schake, S. Wang, J. B. Vincent, K. Folting, D. Gatteschi, G.Christou and D. N. Hendrickson, J. Am. Chem. Soc., 1993, 115, 1804;R. Sessoli, D. Gatteschi, A. Caneschi and M. A. Novak, Nature, 1993,365, 141; D. Gatteschi and R. Sessoli, Angew. Chem., Int. Ed., 2003, 42,268.
2 S. Parsons and R. E. P. Winpenny, Acc. Chem. Res., 1997, 30, 89; R. E. P.Winpenny, J. Chem. Soc., Dalton Trans., 2002, 1; R. E. P. Winpenny,Adv. Inorg. Chem., 2001, 52, 1; Z. J. Zhong, H. Seino, Y. Mizobe, M.Hidai, A. Fujishima, S. Ohkoshi and K. Hashimoto, J. Am. Chem. Soc.,2000, 122, 2952; S. Maheswaran, G. Chastanet, S. J. Teat, T. Mallah,R. Sessoli, W. Wernsdorfer and R. E. P. Winpenny, Angew. Chem.,Int. Ed., 2005, 44, 5044; M. Murugesu, M. Habrych, W. Wernsdorfer,K. A. Abboud and G. Christou, J. Am. Chem. Soc., 2004, 126, 4766;A. J. Tasiopoulos, A. Vinslava, W. Wernsdorfer, K. A. Abboud and G.Christou, Angew. Chem., Int. Ed., 2004, 116, 2169; D. M. Low, L. F.Jones, A. Bell, E. K. Brechin, T. Mallah, E. Riviere, S. J. Teat and E. J. L.McInnes, Angew. Chem., Int. Ed., 2003, 42, 3781.
3 N. Soler, W. Wernsdorfer, Z. M. Sun, D. Ruiz, J. C. Huffman, D. N.Hendrickson and G. Christou, Polyhedron, 2003, 22, 1783; C. Boskovic,M. Pink, J. C. Huffman, D. N. Hendrickson and G. Christou, J. Am.Chem. Soc., 2001, 123, 9914; Z. M. Sun, D. Ruiz, N. R. Dilley, M. Soler,J. Ribas, K. Folting, M. B. Maple, G. Christou and D. N. Hendrickson,Chem. Commun., 1999, 1973.
4 Long and coworkers reported a similar complex of formula[{(cyclam)NiNC}2{Cr(CN)(Me3tacn)}](ClO42·2H2O where the iPrgroups on the tacn ligand were replaced by methyl groups and theanion is ClO4
− instead of NO3−: P. A. Berseth, J. J. Sokol, M. P. Shores,
J. L. Heinrich and J. R. Long, J. Am. Chem. Soc., 2000, 122, 9655.
This journal is © The Royal Society of Chemistry 2006 Dalton Trans., 2006, 2818–2828 | 2827
Publ
ishe
d on
11
May
200
6. D
ownl
oade
d by
Uni
vers
ity o
f H
ong
Kon
g L
ibra
ries
on
25/0
9/20
13 1
3:09
:56.
View Article Online
5 J.-N. Rebilly, L. Catala, E. Riviere, R. Guillot, W. Wernsdorfer and T.Mallah, Inorg. Chem., 2005, 44, 8194.
6 A.-L. Barra, L.-C. Brunel and J. B. Robert, Chem. Phys. Lett., 1990,165, 107.
7 J. Glerup and H. Weihe, Acta Chem. Scand., 1991, 45, 444.8 T. Ito and M. Kato, Bull. Chem. Soc. Jpn., 1984, 57, 2641.9 T. Mallah, C. Auberger, M. Verdaguer and P. Veillet, J. Chem. Soc.,
Chem. Commun., 1995, 61.10 L. Toma, L. M. Toma, R. Lescouezec, D. Armentano, G. De Munno,
M. Andruh, J. Cano, F. Lloret and M. Julve, Dalton Trans., 2005,1357.
11 O. Kahn, Molecular Magnetism, VCH, Weinheim, 1993, p. 26.12 G. Rogez, J. N. Rebilly, A. L. Barra, L. Sorace, G. Blondin, N. Kirchner,
M. Duran, J. van Slageren, S. Parsons, L. Ricard, A. Marvilliers and T.Mallah, Angew. Chem., Int. Ed., 2005, 44, 1876.
13 F. E. Mabbs and D. Collison, Electron Paramagnetic Resonance of dTransition Metal Compounds, Elsevier, Amsterdam, 1992.
14 A. Bencini, I. Ciofini and M. G. Uytterhoeven, Inorg. Chim. Acta, 1998,274, 90.
15 (a) A. B. P. Lever, Inorganic Electronic Spectroscopy, Elsevier, Amster-dam, 2nd edn, 1984; (b) A. Bencini, C. Benelli and D. Gatteschi, Coord.Chem. Rev., 1984, 60, 131.
16 A. L. Barra, A. Caneschi, A. Cornia, F. Fabrizi de Biani, D. Gatteschi,C. Sangregorio, R. Sessoli and L. Sorace, J. Am. Chem. Soc., 1999, 121,5302; O. Waldmann, R. Koch, S. Schromm, J. Schulein, P. Muller, I.Bernt, R. W. Saalfrank, F. Hampel and E. Balthes, Inorg. Chem., 2001,40, 2986; D. Collison, M. Murrie, V. S. Oganesyan, S. Piligkos, N. R. J.Poolton, G. Rajaraman, G. M. Smith, A. J. Thomson, G. A. Timko, W.Wernsdorfer, R. E. P. Winpenny and E. J. L. McInnes, Inorg. Chem.,2003, 42, 5293.
2828 | Dalton Trans., 2006, 2818–2828 This journal is © The Royal Society of Chemistry 2006
Publ
ishe
d on
11
May
200
6. D
ownl
oade
d by
Uni
vers
ity o
f H
ong
Kon
g L
ibra
ries
on
25/0
9/20
13 1
3:09
:56.
View Article Online