Embed Size (px)
Citation preview
1
Magic Modeling Language MML 1.0
Alvo Stockman
Copyright 2008 Penguin Magic.
2
Summary
Magic Modeling Language (MML) is a way professional magicians can abstractly describe and quantify the dynamics of a magic trick. By looking past the presentational details of a particular trick, we can compare tricks that are seemingly very different in interesting ways.
Through Effect Maps, we can quantify elements of magic tricks that are sometimes clouded by presentation.
Effect Maps are one more way that professional magicians can further analyze and refine their performances. They can be created on a computer, on a dry-erase board, or even on a bar napkin. The important thing isn’t how you draw it, but that you can visualize what Effect Maps mean.
3
Magic Modeling LanguageThe Basics
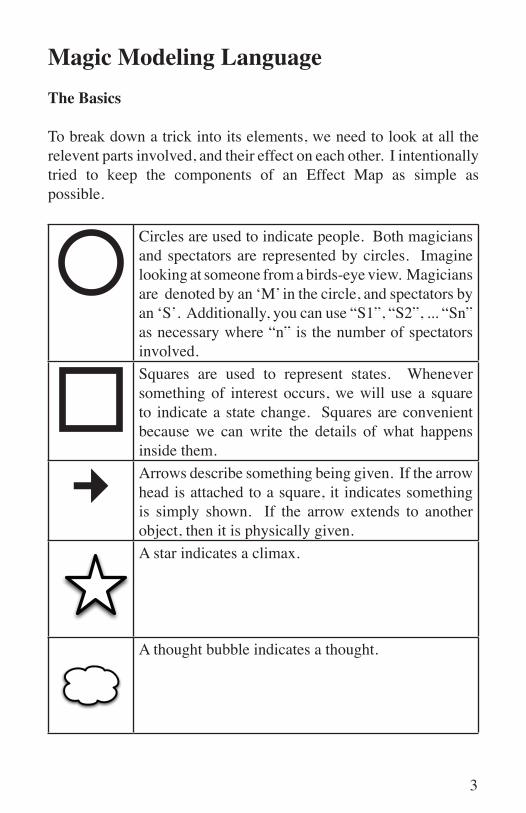
To break down a trick into its elements, we need to look at all the relevent parts involved, and their effect on each other. I intentionally tried to keep the components of an Effect Map as simple as possible.
Circles are used to indicate people. Both magicians and spectators are represented by circles. Imagine looking at someone from a birds-eye view. Magicians are denoted by an ‘M’ in the circle, and spectators by an ‘S’. Additionally, you can use “S1”, “S2”, ... “Sn” as necessary where “n” is the number of spectators involved.Squares are used to represent states. Whenever something of interest occurs, we will use a square to indicate a state change. Squares are convenient because we can write the details of what happens inside them.
Arrows describe something being given. If the arrow head is attached to a square, it indicates something is simply shown. If the arrow extends to another object, then it is physically given.A star indicates a climax.
A thought bubble indicates a thought.
4
Effect Maps
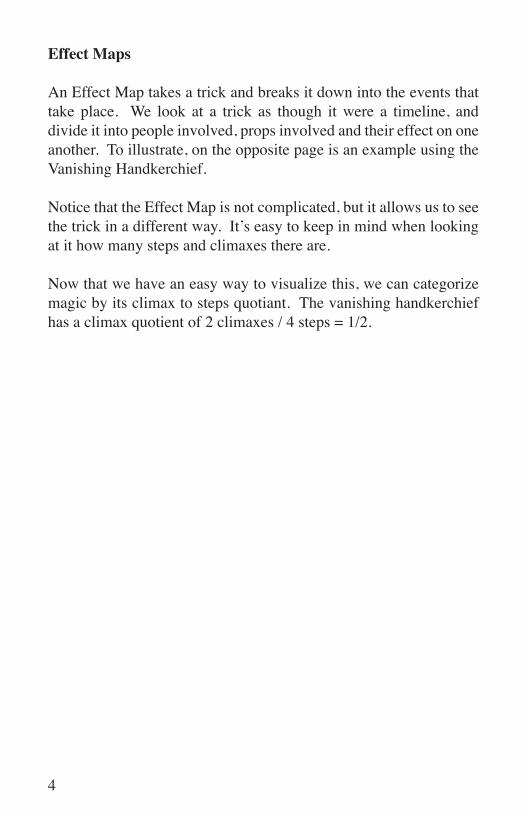
An Effect Map takes a trick and breaks it down into the events that take place. We look at a trick as though it were a timeline, and divide it into people involved, props involved and their effect on one another. To illustrate, on the opposite page is an example using the Vanishing Handkerchief.
Notice that the Effect Map is not complicated, but it allows us to see the trick in a different way. It’s easy to keep in mind when looking at it how many steps and climaxes there are.
Now that we have an easy way to visualize this, we can categorize magic by its climax to steps quotiant. The vanishing handkerchief has a climax quotient of 2 climaxes / 4 steps = 1/2.
5
M S
M shows Hanky
Magician put Hanky in fist
Vanishes!
Reappears!
Steps: 4Interactivity: 0Climaxes: 2
6
What consumes me as a creator is interactivity. I enjoy interesting interaction, so I focus on interaction in my maps. One of the elements we can quantify in our magic tricks is the interactivity. I define interactivity as the number of back and forths between magician and a spectator in an Effect Map. By this definition, the vanishing handkerchief (as described) has an interactivity of 0.
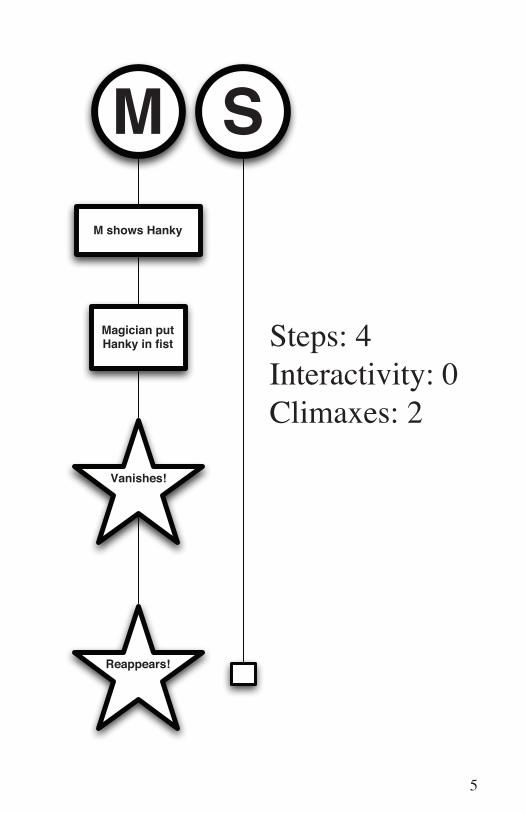
On the opposite page is an Effect Map of a simple performance of The Invisible Deck.
Here we can see that the interactivity of this trick is now 2. The spectator was asked to name a card, and then finally was responsible for taking the card out of the spread.
By looking at the Effect Map, we can also see easily that the impact or climax of this trick happens in the spectators own hands.
In this intentionally simple presentation, The Inivisible Deck has 5 steps and 1 climax. The climax quotient of the Invisible Deck is 1/5.
The climax quotient is obviously not necessarily bad if it’s low. There are many magicians who can make a longer presentation of the Invisible Deck build and build until the climax brings the house down! For magicians analyzing their performance however, it’s important that you recognize how many steps are involved in your performances so you can make sure they build as they go. If you watch Bill Malone’s Invisible Deck performance for example, you’ll see that he is constantly building building building, and inflating the climax to guarantee a standing ovation.
7
M S
M asks S to think of any
card
Same asNamedCard!
Magician spreads deck
face up.
1 Card facedown!
S names any card
S pulls it out
S thinks ofany card.
Steps: 5Interactivity: 2Climaxes: 1
8
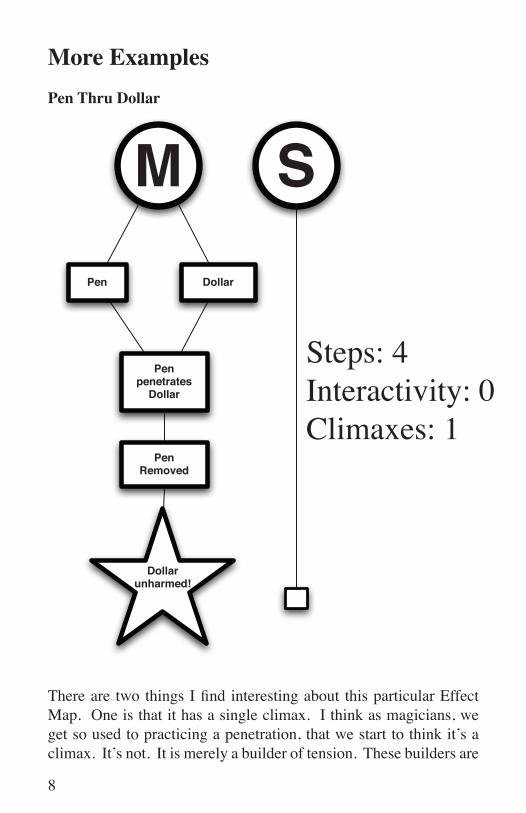
More ExamplesPen Thru Dollar
M S
Pen Dollar
Pen penetrates
Dollar
PenRemoved
Dollarunharmed!
There are two things I find interesting about this particular Effect Map. One is that it has a single climax. I think as magicians, we get so used to practicing a penetration, that we start to think it’s a climax. It’s not. It is merely a builder of tension. These builders are
Steps: 4Interactivity: 0Climaxes: 1
9
what make for a stronger climax. Like many good jokes, the setup gives a slight discomfort that the climax relieves. While I’m sure many of you who were well aware that it wasn’t a climax, perhaps the Effect Map helped you think about why it was even there.
This brings us to an important point. By drawing Effect Maps for our magic, it forces us to go step by step through our effects and categorize them. While drawing, you may be tempted to draw a star around something. Stop, think about it.
When a painter starts on a new canvas, he must look at every curve and corner, every tree and flower. By drawing a scene, you must notice everything. In the same way, by drawing an Effect Map, you are forced to notice things you may not have given thought to.
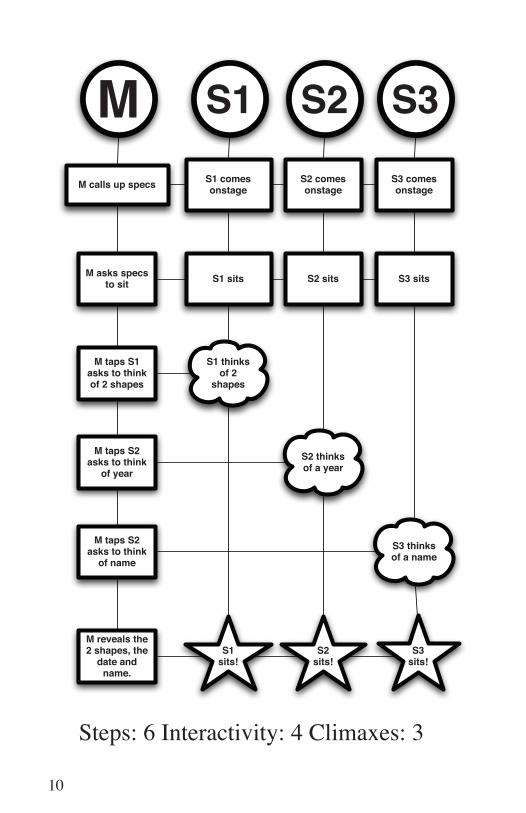
Touching on Hoy
We will now discuss a slightly more advanced example that uses multiple spectators. Luke Jermay’s Touching on Hoy is a marvelous piece that involves 3 spectators coming up on stage, thinking of shapes, a name and a date.
As we can see, there is a lot going on in a very small space. It manages to have a climax quotient of 1/2 which is about as large a number as is possible in a multi-phase routine.
10
M S1
M calls up specs
M asks specs to sit
S1 comes onstage
S2
S2 comes onstage
S3
S3 comes onstage
S1 sits S2 sits S3 sits
M taps S1 asks to think of 2 shapes
M taps S2 asks to think
of year
S1 thinksof 2
shapes
M taps S2 asks to think
of name
S2 thinksof a year
S3 thinksof a name
S1 sits!
M reveals the 2 shapes, the
date and name.
S2sits!
S3sits!
Steps: 6 Interactivity: 4 Climaxes: 3
11
ApplicationsThere are many applications of MML and Effect Maps. Here are just a few ideas:
Visual Description
Ideally, a magic trick would be straight-forward and simple. However many times, tricks have multiple phases, or complicated interactions that make an english description time-consuming to swim through. Using an Effect Map in conjunction with a description, your reader will have a much easier time zeroing in on the important dynamics of a trick. The usefulness of a visual description is even more important when dealing with an international audience.
Interactivity Some tricks are interactive, they involve the audience. Using Effect Maps, we can actually assign a number to a trick’s interactivity.
Number of steps involved
Does this trick get too long for the impact of the climax? Is it right for this part of the show? Would another trick be more suitable? And most importantly, do the steps build?
Categorizing
Using the visual Effect Map, you can see that effects like the Vanishing Handkerchief and the Pen Through Dollar are actually quite similar in a way you may not have realized. They both involve 3 steps and the steps are performed in straight succession. There are actually quite a large number of tricks like these. We can assign names to categories of simililar tricks to quickly describe them.
12
Number of spectators
While it’s easy to say, “oh, this trick has 2 spectators,” with an Effect Map, you can see each of their roles in the trick. Is one of them much more involved than another? Could this be fixed?
Optimizing
Is there too much “handling” in a presentation? By mapping out everything that happens in a routine, you have a visual way to see all the steps your props take on their journey to a climax.
Daisy Chaining Effect Maps
By connecting Effect Maps from a selection of tricks from your entire show, you may begin to see patterns, or more importantly opportunities to add audience interaction, fix dead time, bottlenecks, minimize delays, etc.
Accountability
To be able to look at a visual map of your trick and decide why each component is there is one of the most neglected part of routining and trick design. By making a map, you’re forcing yourself to answer each of these questions.
13
Final ThoughtsMy hope is that by establishing a universal language and convention to visually describe the dynamics of a magic trick, our community will be able to articulate and thereby think about elements of magic tricks in new and helpful ways.
MML is a constantly evolving project and I would love to hear your comments! Please email me directly at [email protected]
The latest version of this e-book will be available for download athttp://www.AlvoStockman.com. Subscribe to the RSS feed for update announcements.
Sincerely,
Alvo Stockman

14


![IMP - MML IMP - MML IMP - MML IMP - MMLIMP - MML IMP - …imp.gob.pe/images/Planos de Zonif Abril 2019/2_San Juan de Lurigancho.pdf · zte-2 cv [2] cv av. leocio prado av. ferrocarril](https://img.pdfslide.us/doc/110x75/5e1a193af2030578f7455c4b/imp-mml-imp-mml-imp-mml-imp-mmlimp-mml-imp-impgobpeimagesplanos.jpg)