Embed Size (px)
Citation preview
MAFIC EXPLOSIVE VOLCANISM AT LLAIMA VOLCANO: 3D X-RAY
MICROTOMOGRAPHY RECONSTRUCTION OF PYROCLASTS TO CONSTRAIN
SHALLOW CONDUIT PROCESSES
by
Pedro Antonio Valdivia-Munoz
A thesis
submitted in partial fulfillment
of the requirements for the degree of
Master of Science in Geoscience
Boise State University
August 2021

© 2021
Pedro Antonio Valdivia-Munoz
ALL RIGHTS RESERVED

BOISE STATE UNIVERSITY GRADUATE COLLEGE
DEFENSE COMMITTEE AND FINAL READING APPROVALS
of the thesis submitted by
Pedro Antonio Valdivia-Munoz
Thesis Title: Mafic Explosive Volcanism at Llaima Volcano: 3D X-ray Microtomography Reconstruction Of Pyroclasts to Constrain Shallow Conduit Processes
Date of Final Oral Examination: 03 May 2021
The following individuals read and discussed the thesis submitted by student Pedro Antonio Valdivia-Munoz, and they evaluated their presentation and response to questions during the final oral examination. They found that the student passed the final oral examination.
Brittany Brand, Ph.D. Chair, Supervisory Committee
Michael Manga, Ph.D. Member, Supervisory Committee
Dorsey Wanless, Ph.D. Member, Supervisory Committee
The final reading approval of the thesis was granted by Brittany Brand, Ph.D., Chair of the Supervisory Committee. The thesis was approved by the Graduate College.
iv
DEDICATION
This thesis is dedicated to my family and wife. For their unconditional support and
love.

v
ACKNOWLEDGMENTS
I would like to sincerely thank my supervisor, Dr. Brittany Brand, for her guidance
and constant support, and specially for her confidence in me. I would also like to thank Dr.
Michael Manga for serving as a member of my committee. I learned so much from him.
To Aaron Marshal, Sean Carney, Jade Bowers, Dorsey Wanless, Guido Giordano, Ben
Andrews, Alessandro Vona and Madison Myers for a wonderful fieldtrip in Chile and
further support. To all the professors and graduate students I met during my two years
living in Boise, thank you very much.
To all my friends and family, thank you for your constant support and love. And
specially to my wife, Lara Leiss, my favorite person in this world. Your love and company
are the most unvaluable treasures I have.
This work was funded by the NSF award # 1831143, so thanks to Dr. Brand for
letting me be part of the “Llaima team”.
vi
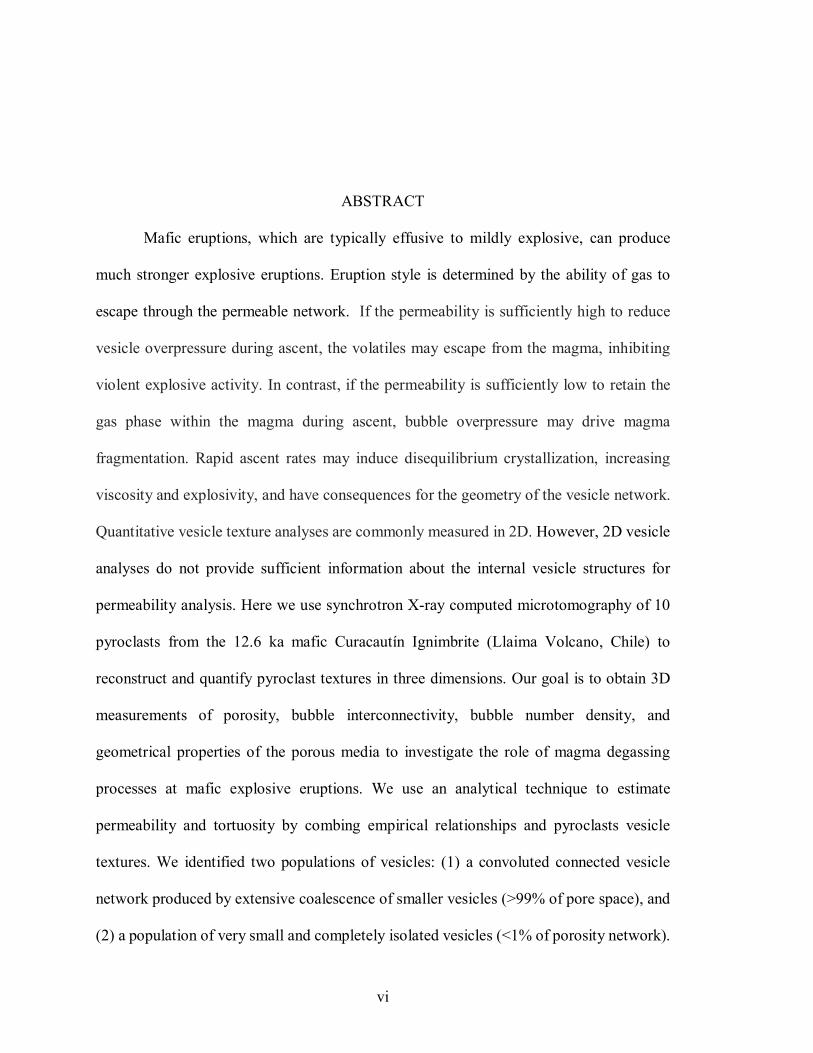
ABSTRACT
Mafic eruptions, which are typically effusive to mildly explosive, can produce
much stronger explosive eruptions. Eruption style is determined by the ability of gas to
escape through the permeable network. If the permeability is sufficiently high to reduce
vesicle overpressure during ascent, the volatiles may escape from the magma, inhibiting
violent explosive activity. In contrast, if the permeability is sufficiently low to retain the
gas phase within the magma during ascent, bubble overpressure may drive magma
fragmentation. Rapid ascent rates may induce disequilibrium crystallization, increasing
viscosity and explosivity, and have consequences for the geometry of the vesicle network.
Quantitative vesicle texture analyses are commonly measured in 2D. However, 2D vesicle
analyses do not provide sufficient information about the internal vesicle structures for
permeability analysis. Here we use synchrotron X-ray computed microtomography of 10
pyroclasts from the 12.6 ka mafic Curacautín Ignimbrite (Llaima Volcano, Chile) to
reconstruct and quantify pyroclast textures in three dimensions. Our goal is to obtain 3D
measurements of porosity, bubble interconnectivity, bubble number density, and
geometrical properties of the porous media to investigate the role of magma degassing
processes at mafic explosive eruptions. We use an analytical technique to estimate
permeability and tortuosity by combing empirical relationships and pyroclasts vesicle
textures. We identified two populations of vesicles: (1) a convoluted connected vesicle
network produced by extensive coalescence of smaller vesicles (>99% of pore space), and
(2) a population of very small and completely isolated vesicles (<1% of porosity network).
vii
Bubble numbe2r density measurements are 1-29×103 bubbles per mm3, implying an
average decompression rate of 1.4 MPa/s under heterogeneous nucleation. We computed
tortuosities factor between 1.89 and 4.4, with higher values in the less vesicular samples.
Permeability ranges are between 3×10-13 and 6.27×10⁻¹² m2. 3D vesicle textures evidence
rapid ascent rates that induced high disequilibrium, promoting rapid syn-eruptive
crystallization of microlites and late vesiculation. We propose that the increase in viscosity
due to crystallization and vesiculation, combined with rapid ascent, inhibited outgassing
and increased bubble overpressures, leading to explosive fragmentation. We estimated that
a bubble overpressure greater than 5.2 MPa could have been sufficient to fragment the
Curacautín magma. Other mafic explosive eruptions report similar disequilibrium
conditions induced by rapid ascent rate, implying that syn-eruptive disequilibrium may
control the explosivity of mafic eruptions more generally.
viii
TABLE OF CONTENTS
DEDICATION ............................................................................................................... iv
ACKNOWLEDGMENTS ............................................................................................... v
ABSTRACT .................................................................................................................. vi
LIST OF TABLES .......................................................................................................... x
LIST OF FIGURES ....................................................................................................... xi
LIST OF ABBREVIATIONS....................................................................................... xiii
CHAPTER ONE: INTRODUCTION .............................................................................. 1
CHAPTER TWO: METHODOLOGY ............................................................................ 7
Sample Preparation .............................................................................................. 7
X-ray microtomography ...................................................................................... 7
3D reconstruction ................................................................................................ 8
3D Tortuosity factor .......................................................................................... 14
Permeability calculations ................................................................................... 15
Decompression and discharge rates.................................................................... 16
Forchheimer and Stokes numbers ...................................................................... 17
CHAPTER THREE: RESULTS .................................................................................... 19
Reconstruction and measurements of vesicle textures in 3D ............................... 19
Tortuosity factor ................................................................................................ 22
Permeability calculations ................................................................................... 26
ix
Decompression and discharge rates .................................................................... 26
Forchheimer and Stokes numbers ....................................................................... 28
CHAPTER FOUR: DISCUSSION................................................................................. 31
CHAPTER FIVE: CONCLUSIONS .............................................................................. 37
REFERENCES .............................................................................................................. 39
APPENDIX ................................................................................................................... 47

x
LIST OF TABLES
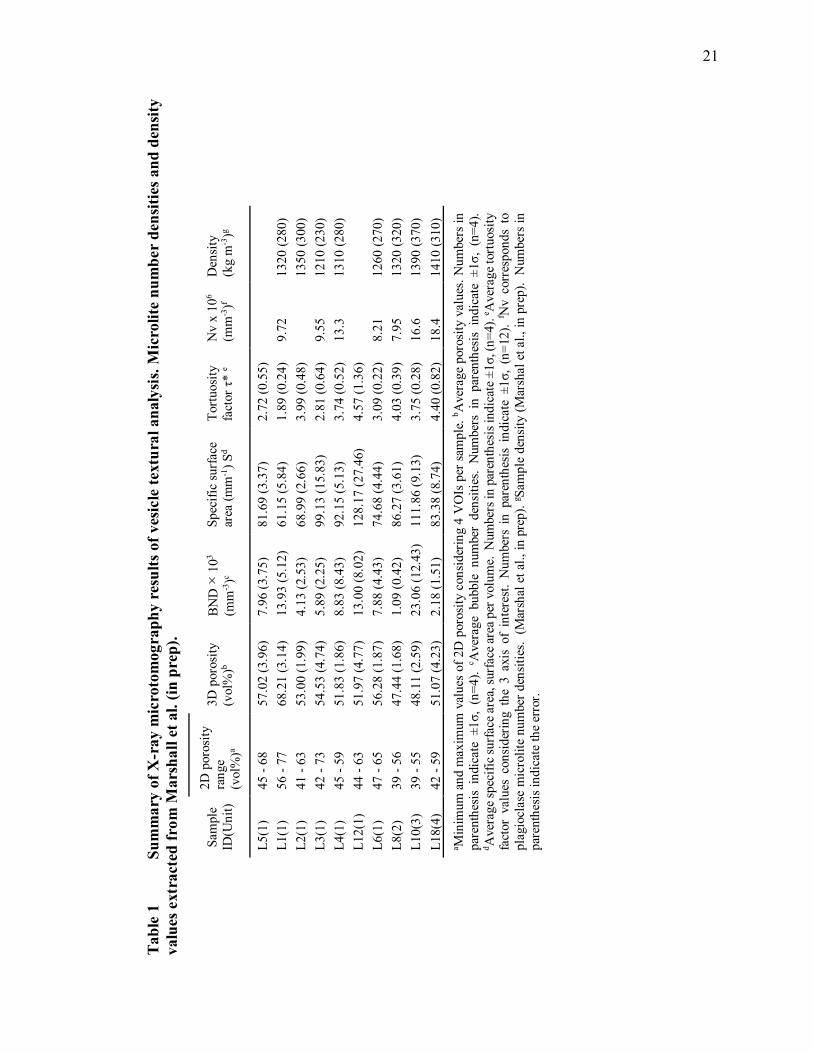
Table 1 Summary of X-ray microtomography results of vesicle textural analysis. Microlite number densities and density values extracted from Marshall et al. (in prep). ........................................................................................... 21
Table 2 Summary of results for Darcian and Inertial permeabilities, Decompression rates, Discharge rates and Fragmentation threshold. ...... 25
Table 3 Reference parameters and results for calculation of Stokes and Forchheimer numbers............................................................................. 29
Table A.1 Full compilation of X-ray microtomography results of vesicle textural analysis, tortuosity factors, Darcian permeabilities and inertial permeabilities. ........................................................................................ 48
Table A.2 Full compilation of Discharge rates, decompression rates and fragmentation threshold. ......................................................................... 50
xi
LIST OF FIGURES
Figure 1 (A) Map showing Curacautín deposits and sample locations (southeast of Llaima volcano summit). (B) Photo of Unit 1, the thickest deposit in the sequence. The base is not exposed. (C) Photo showing the contact between Unit 1, Unit 2, and Unit 3. Samples L12 (top of Unit 1) and L18 (Unit 4) are not visible in these photos. Modified from Marshall et al., in prep. .....5
Figure 2 SEM image of a pyroclast from the Curacautín Ignimbrite. (A) Sample L1, Unit 1. (B) Sample L8, Unit 2. The vesicle shapes are controlled by the high amount of plagioclase microlites. ......................................................6
Figure 3 Image reconstructions and Volume of interest. (A) 3D reconstruction of L4. Image was obtained stacking 820 reconstructed 2D X-ray microtomography images (B) 2D orthogonal view from the top of the volume. The white dashed square represents the area of interest used to generate a subvolume (C) 3D visualization of sample L4(Figure 2), one of the four volumes of interest we extracted per sample. ...............................9
Figure 4 (A) 2D view of a slice of one VOI (sample L4). Darker grey pixels correspond to pores/vesicles, while the brighter ones correspond to the solid phase. (B) Segmentation based on a brightness/grayscale histogram threshold. The segmented phase in cyan color shows the artifacts in the form of islands and holes. (C) Final view of the cleaning process after using morphological operations as “Erode”, “Dilate” and “Smooth” to remove artifacts shown in (B). (D) 2D view of the separation of vesicles. Every color represents a single vesicle. The golden color represents one single convoluted vesicle. ....................................................................... 11
Figure 5 3D visualization of L4. All three volumes have the same size. (A) 3D reconstruction of L4. (B) Segmentation of the porous media represented in cyan color. (C) Separation of interconnected vesicles. Every color represents a single bubble. (D) 3D visualization of the skeletonization of sample L4. The purple matrix represents the medial axis of the pore network. The convoluted shape and the chaotic distribution of the final structure make it very difficult to calculate classic tortuosity. ................. 13
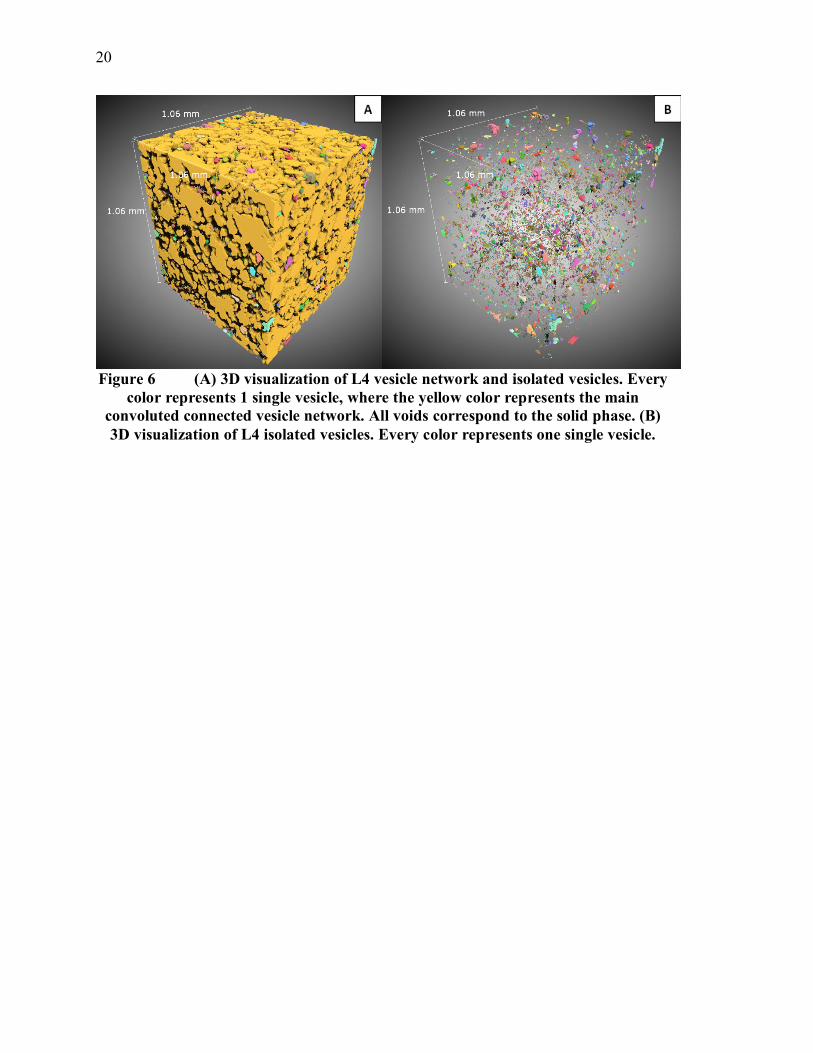
Figure 6 (A) 3D visualization of L4 vesicle network and isolated vesicles. Every color represents 1 single vesicle, where the yellow color represents the main convoluted connected vesicle network. All voids correspond to the
xii
solid phase. (B) 3D visualization of L4 isolated vesicles. Every color represents one single vesicle................................................................... 20
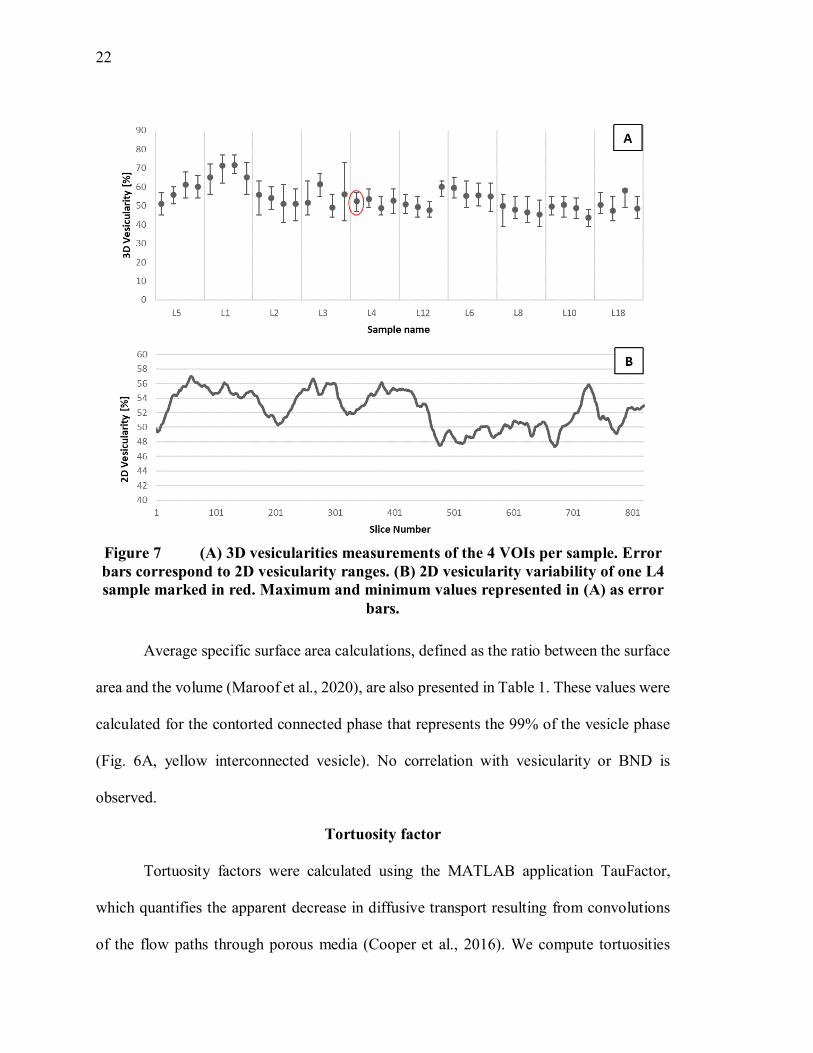
Figure 7 (A) 3D vesicularities measurements of the 4 VOIs per sample. Error bars correspond to 2D vesicularity ranges. (B) 2D vesicularity variability of one L4 sample marked in red. Maximum and minimum values represented in (A) as error bars. ................................................................................ 22
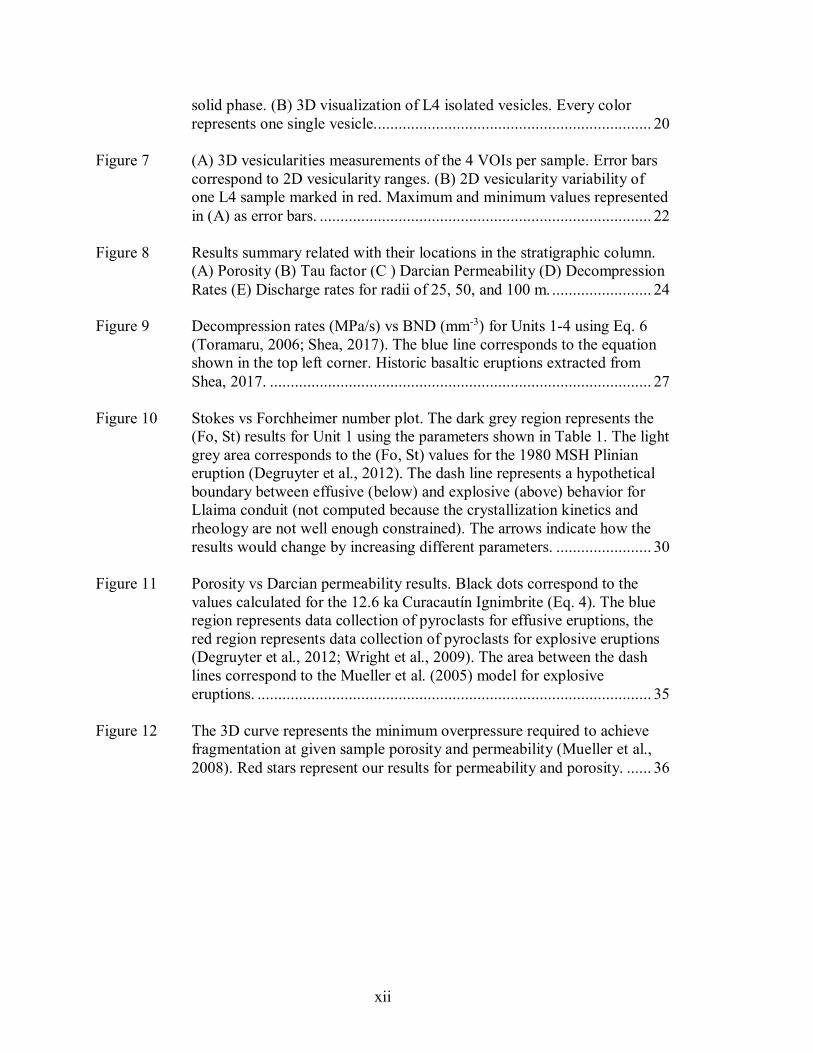
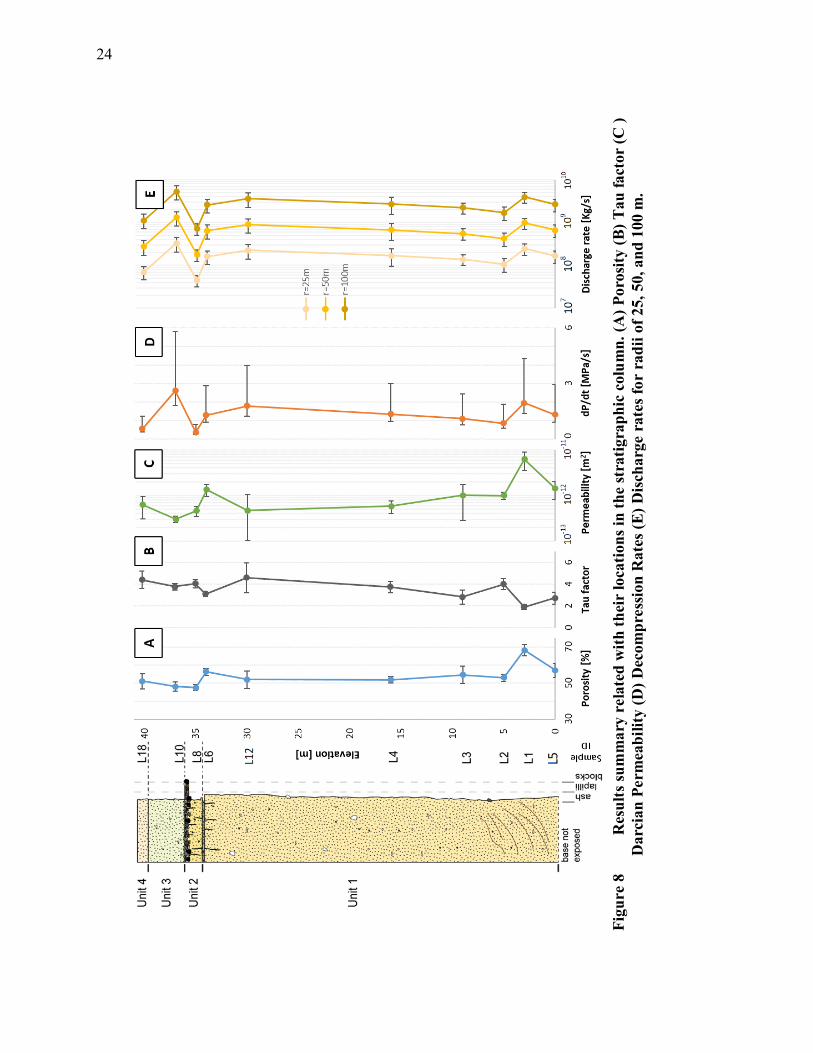
Figure 8 Results summary related with their locations in the stratigraphic column. (A) Porosity (B) Tau factor (C ) Darcian Permeability (D) Decompression Rates (E) Discharge rates for radii of 25, 50, and 100 m. ........................ 24
Figure 9 Decompression rates (MPa/s) vs BND (mm-3) for Units 1-4 using Eq. 6 (Toramaru, 2006; Shea, 2017). The blue line corresponds to the equation shown in the top left corner. Historic basaltic eruptions extracted from Shea, 2017. ............................................................................................ 27
Figure 10 Stokes vs Forchheimer number plot. The dark grey region represents the (Fo, St) results for Unit 1 using the parameters shown in Table 1. The light grey area corresponds to the (Fo, St) values for the 1980 MSH Plinian eruption (Degruyter et al., 2012). The dash line represents a hypothetical boundary between effusive (below) and explosive (above) behavior for Llaima conduit (not computed because the crystallization kinetics and rheology are not well enough constrained). The arrows indicate how the results would change by increasing different parameters. ....................... 30
Figure 11 Porosity vs Darcian permeability results. Black dots correspond to the values calculated for the 12.6 ka Curacautín Ignimbrite (Eq. 4). The blue region represents data collection of pyroclasts for effusive eruptions, the red region represents data collection of pyroclasts for explosive eruptions (Degruyter et al., 2012; Wright et al., 2009). The area between the dash lines correspond to the Mueller et al. (2005) model for explosive eruptions. ............................................................................................... 35
Figure 12 The 3D curve represents the minimum overpressure required to achieve fragmentation at given sample porosity and permeability (Mueller et al., 2008). Red stars represent our results for permeability and porosity. ...... 36
xiii
LIST OF ABBREVIATIONS
2D 2-dimentional
3D 3-dimentional
BSU Boise State University
BND Bubble Number Density
FO Forcheimer Number
GC Graduate College
ID Identification
MATLAB Matrix Laboratory
MSH Mount Saint Helens
SEM Scanning Electron Microscopy
ST Stokes Number
TDC Thesis and Dissertation Coordinator
VOI Volume of Interest


1
CHAPTER ONE: INTRODUCTION
Mafic eruptions, which are typically effusive to mildly explosive, are the most
common style of volcanism on Earth (Parfitt, 2004). However, mafic volcanoes can
produce much stronger, Plinian-style eruptions, capable of destructive pyroclastic currents
and widespread ash fall (La Spina et al., 2020). The most powerful examples include the
basaltic Plinian deposits of ∼60 ka Fontana Lapilli and ∼2 ka Masaya Triple Layer at
Masaya volcano in Nicaragua (Constantini et al., 2009; Constantini et al., 2010; Bamber et
al., 2020; Pérez et al., 2020); the 122 BC eruption of Etna, Italy (Coltelli et al., 1998;
Houghton et al., 2004; Sable et al., 2006); and the 1886 Tarawera eruption, New Zealand
(Houghton et al., 2004; Sable et al., 2006; Shea et al., 2017; Moitra et al., 2018).
In general, explosive eruptions are modulated by the conditions of volatile
exsolution that lead to vesiculation. Vesiculation is a process in which volatiles originally
dissolved in the magma exsolve into gas bubbles due to a decrease in the pressure-
dependent solubility during magma ascent (Yoshimura, 2019). The resulting bubbles
undergo decompression expansion, reducing the bulk mixture density of the magma and
enhancing buoyancy (Cassidy et al., 2018). As bubbles expand, they coalesce to form
permeable pathways connecting the dispersed volatile phase (Klug and Cashman, 1996).
If the resulting permeability is sufficiently high to reduce vesicle overpressure during
ascent, the volatiles may escape from the magma, limiting the chance of violent explosive
activity. In contrast, if the permeability is sufficiently low to maintain the gas phase trapped
within the magma during ascent, overpressure in bubbles may drive magma fragmentation,
2
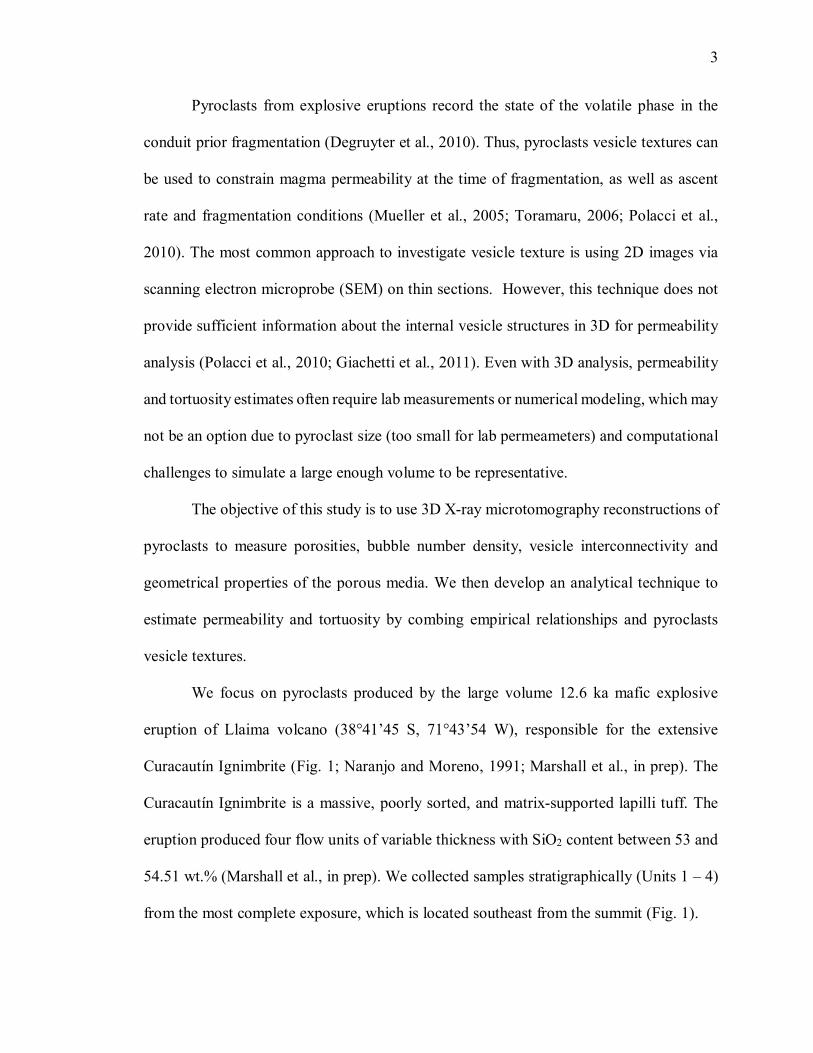
producing an explosive eruption (Mueller et al., 2008; Degruyter at al., 2012; Cashman and
Scheu, 2015; Cassidy et al., 2018). The exsolution of volatiles within a magma is controlled
by decompression rate, the degree of volatile saturation, availability of nucleation sites,
surface tension, and viscosity of magma (Mangan et al., 2004; Cassidy et al., 2018).
Many studies show that there is a link between mafic explosive volcanism, rapid
ascent, and syn-eruptive disequilibrium conditions in both the gas and solid phases (La
Spina et al., 2016; Polacci et al., 2018; Arzilli et al., 2019; Bamber et al., 2020; Namiki et
al., 2021). When decompression rate is high, the volatiles may not degas from the magma
under equilibrium conditions. Such disequilibrium degassing may lead to volatile
supersaturation, late vesiculation, and high bubble overpressures (Mangan and Sisson,
2000). Similarly, crystallization kinetics are controlled by water content, degassing, and
ascent rates (La Spina et al., 2016; Befus and Andrews, 2018; Arzilli et al., 2019). High
degrees of disequilibrium due to rapid ascent results in high crystal nucleation and growth
rates (Befus and Andrews, 2018). This increases the magma bulk viscosity and may further
prevent degassing, promoting the conditions necessary for explosive volcanism (Arzilli et
al., 2019).
The volatile and crystal textures of magmas are critical in determining their
rheology and eruptive behavior (Gonnermann and Manga, 2007). Rapid crystallization due
to disequilibrium degassing triggers profound rheological changes in ascending magmas
(Vona et al., 2011; Arzilli et al., 2019). Indeed, pyroclasts from mafic Plinian eruptions
typically display high microlite number densities (Murch and Cole, 2019), suggesting that
changes in rheology due to rapid crystallization may be responsible for triggering highly
explosive basaltic volcanism (Sable et al., 2006).
3
Pyroclasts from explosive eruptions record the state of the volatile phase in the
conduit prior fragmentation (Degruyter et al., 2010). Thus, pyroclasts vesicle textures can
be used to constrain magma permeability at the time of fragmentation, as well as ascent
rate and fragmentation conditions (Mueller et al., 2005; Toramaru, 2006; Polacci et al.,
2010). The most common approach to investigate vesicle texture is using 2D images via
scanning electron microprobe (SEM) on thin sections. However, this technique does not
provide sufficient information about the internal vesicle structures in 3D for permeability
analysis (Polacci et al., 2010; Giachetti et al., 2011). Even with 3D analysis, permeability
and tortuosity estimates often require lab measurements or numerical modeling, which may
not be an option due to pyroclast size (too small for lab permeameters) and computational
challenges to simulate a large enough volume to be representative.
The objective of this study is to use 3D X-ray microtomography reconstructions of
pyroclasts to measure porosities, bubble number density, vesicle interconnectivity and
geometrical properties of the porous media. We then develop an analytical technique to
estimate permeability and tortuosity by combing empirical relationships and pyroclasts
vesicle textures.
We focus on pyroclasts produced by the large volume 12.6 ka mafic explosive
eruption of Llaima volcano (38°41’45 S, 71°43’54 W), responsible for the extensive
Curacautín Ignimbrite (Fig. 1; Naranjo and Moreno, 1991; Marshall et al., in prep). The
Curacautín Ignimbrite is a massive, poorly sorted, and matrix-supported lapilli tuff. The
eruption produced four flow units of variable thickness with SiO2 content between 53 and
54.51 wt.% (Marshall et al., in prep). We collected samples stratigraphically (Units 1 – 4)
from the most complete exposure, which is located southeast from the summit (Fig. 1).
4
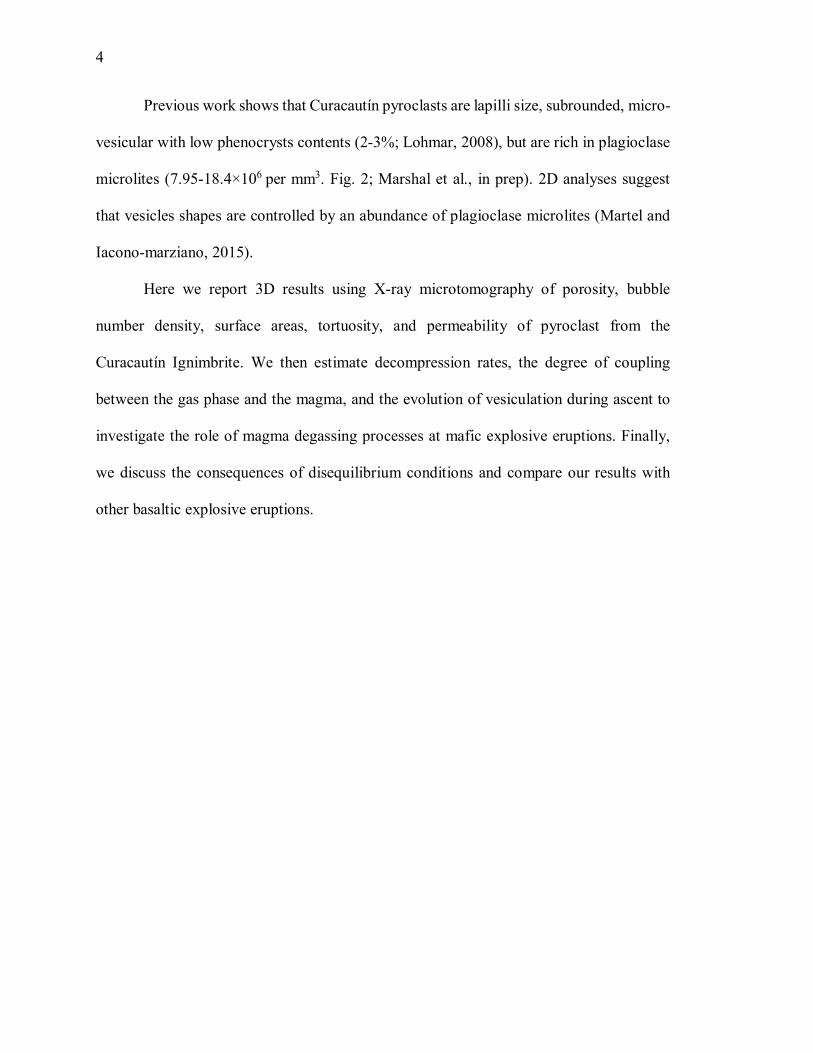
Previous work shows that Curacautín pyroclasts are lapilli size, subrounded, micro-
vesicular with low phenocrysts contents (2-3%; Lohmar, 2008), but are rich in plagioclase
microlites (7.95-18.4×10⁶ per mm3. Fig. 2; Marshal et al., in prep). 2D analyses suggest
that vesicles shapes are controlled by an abundance of plagioclase microlites (Martel and
Iacono-marziano, 2015).
Here we report 3D results using X-ray microtomography of porosity, bubble
number density, surface areas, tortuosity, and permeability of pyroclast from the
Curacautín Ignimbrite. We then estimate decompression rates, the degree of coupling
between the gas phase and the magma, and the evolution of vesiculation during ascent to
investigate the role of magma degassing processes at mafic explosive eruptions. Finally,
we discuss the consequences of disequilibrium conditions and compare our results with
other basaltic explosive eruptions.

5
Figu
re 1
(A
) Map
show
ing
Cur
acau
tín d
epos
its a
nd sa
mpl
e lo
catio
ns (s
outh
east
of L
laim
a vo
lcan
o su
mm
it). (
B) P
hoto
of
Uni
t 1, t
he th
icke
st d
epos
it in
the
sequ
ence
. The
bas
e is
not e
xpos
ed. (
C) P
hoto
show
ing
the
cont
act b
etw
een
Uni
t 1, U
nit 2
, and
U
nit 3
. Sam
ples
L12
(top
of U
nit 1
) and
L18
(Uni
t 4) a
re n
ot v
isibl
e in
thes
e ph
otos
. M
odifi
ed fr
om M
arsh
all e
t al.,
in p
rep.
6
Figure 2 SEM image of a pyroclast from the Curacautín Ignimbrite. (A) Sample L1, Unit 1. (B) Sample L8, Unit 2. The vesicle shapes are controlled by the
high amount of plagioclase microlites.

7
CHAPTER TWO: METHODOLOGY
Sample Preparation
Collected pyroclasts were picked, cleaned, and sorted by density (Table 1; Marshall
et al., in prep.). We chose the mean and median density pyroclasts from each sample for
3D analysis and drilled 3.4 mm diameter cores for further X-Ray microtomography. The
mean pyroclast density for each sample was chosen for this study; if the mean pyroclast
was unavailable, we used the median density pyroclast for 3D analysis. Cores were
immersed in an ultrasonicator water bath for 25 minutes to remove powder produced by
coring, then dried in an oven at 95 ˚C.
X-ray microtomography
X-Ray microtomography was performed on beamline 8.3.2 at the Advanced Light
Source, Lawrence Berkeley National Lab. 2D images were acquired over five sessions
between September 2017 and October 2018. Owing to differences in beam stability and
small changes in setup, scanning parameters varied slightly between sessions to optimize
image quality. Images were acquired with 25-30 keV monochromatic X-rays and 200
millisecond exposure times. 1025-2625 projections were imaged with a PCO edge camera,
a 5X Mitutoyo lens, and a 50 mm LuAG scintillator over a 180 degrees continuous rotation
of the sample. Isotropic pixel size was 1.3 microns. A subset of 5 samples were imaged
0.64 microns/pixel for comparison. Image reconstruction was performed with Xi-cam
(Pandolfi et al., 2018), including center of rotation optimization along with ring and outlier
removal.

8
3D reconstruction
Image processing, volume rendering, and geometric computations were generated
using the Dragonfly software, Version 2020.1.0.797 for Windows 10 (Object Research
Systems (ORS) Inc, Montreal, Canada, 2018; software available at
http://www.theobjects.com/dragonfly). All 2D and 3D images were extracted using the
Dragonfly software. We stacked 820 2D images per sample to reconstruct the 3D
microstructures. Due to the size of the resulting volume (22.2 GBs; Fig. 3A) and the
computational problems to process that amount of data, four cubic sub volumes of
820x820x820 pixels (~1.21 mm3) per sample were extracted as Volumes of Interest (VOI;
Figure 3C). These VOIs are large enough to be representative of the complexity and
heterogeneity of the samples, but small enough to not overwhelm the computing resources
available for this project (Baker et al., 2012; Degruyter et al., 2010). We selected four sub
volume locations vertically throughout each core sample to reduce ring errors (maximum
at the center of the sample) and avoid the cylindrical boundaries of the 2D images (Fig.
3A, Fig. 3B). Using four VOIs also provides a sensitivity analysis, enabling error
calculations.
9
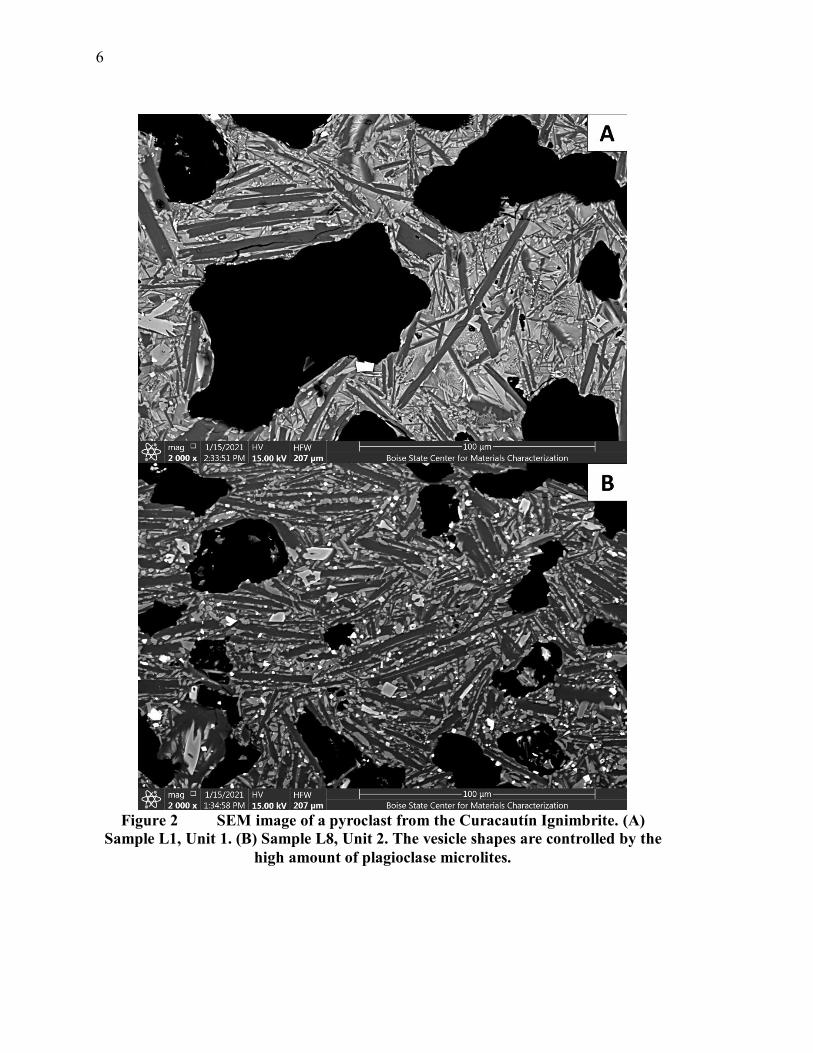
Figure 3 Image reconstructions and Volume of interest. (A) 3D reconstruction of L4. Image was obtained stacking 820 reconstructed 2D X-ray microtomography
images (B) 2D orthogonal view from the top of the volume. The white dashed square represents the area of interest used to generate a subvolume (C) 3D visualization of sample L4(Figure 2), one of the four volumes of interest we extracted per sample.
In order to analyze and visualize the pore network, the VOIs were segmented using
Dragonfly’s segmentation toolkit. This process partitions the volume into groups of voxels
of each phase of interest. For simplicity, we defined two phases of interest: pores and solid
rock. We utilized a segmentation criteria based on a brightness/grayscale histogram

10
threshold, where the darker voxels correspond to bubbles or pores and the brighter ones
correspond to the solid phase (Fig. 4A). Commonly, this process leads to the generation of
artifacts and errors due to the heterogeneities in pixel brightness (Figure 4B; Baker et al.,
2012; Degruyter et al., 2010; Ketcham and Carlson, 2001; Ketcham, 2005; Shanti et al.,
2014). Thus, a cleaning procedure was performed using morphological operations, part of
Dragonfly’s segmentation toolkit, to “Erode”, “Dilate” and “Smooth”, effectively
removing artifacts such as islands and holes smaller than 9 voxels. This process was
repeated as many times as necessary until a clear, bimodal image was produced (confirmed
by a visual inspection, Fig. 4C). Once the segmentation was successful, we separated the
interconnected voxels from the isolated ones (Fig. 4D). Every connected or isolated pore
was counted and identified, followed by the computation of geometrical properties as
Volume and Surface Area (Appendix A.1).

11
Figure 4 (A) 2D view of a slice of one VOI (sample L4). Darker grey pixels
correspond to pores/vesicles, while the brighter ones correspond to the solid phase. (B) Segmentation based on a brightness/grayscale histogram threshold. The
segmented phase in cyan color shows the artifacts in the form of islands and holes. (C) Final view of the cleaning process after using morphological operations as
“Erode”, “Dilate” and “Smooth” to remove artifacts shown in (B). (D) 2D view of the separation of vesicles. Every color represents a single vesicle. The golden color
represents one single convoluted vesicle.

12
Quantification of 2D and 3D vesicle textures in terms of vesicularity (volumetric
fraction of vesicles), bubble number densities (number of vesicles per unit volume), vesicle
volume, surface areas, and connectivity (volume fraction of connected vesicles) were
performed with the same software (Table 1, Appendix A.1). Additionally, we extracted 3D
visualizations of the skeletonization (Fig. 5D), segmented phases (Fig. 5B), and separated
phases (Fig. 5C). The final 3D segmented volumes were extracted as 2D 8-bit binary
images for further tortuosity analysis.
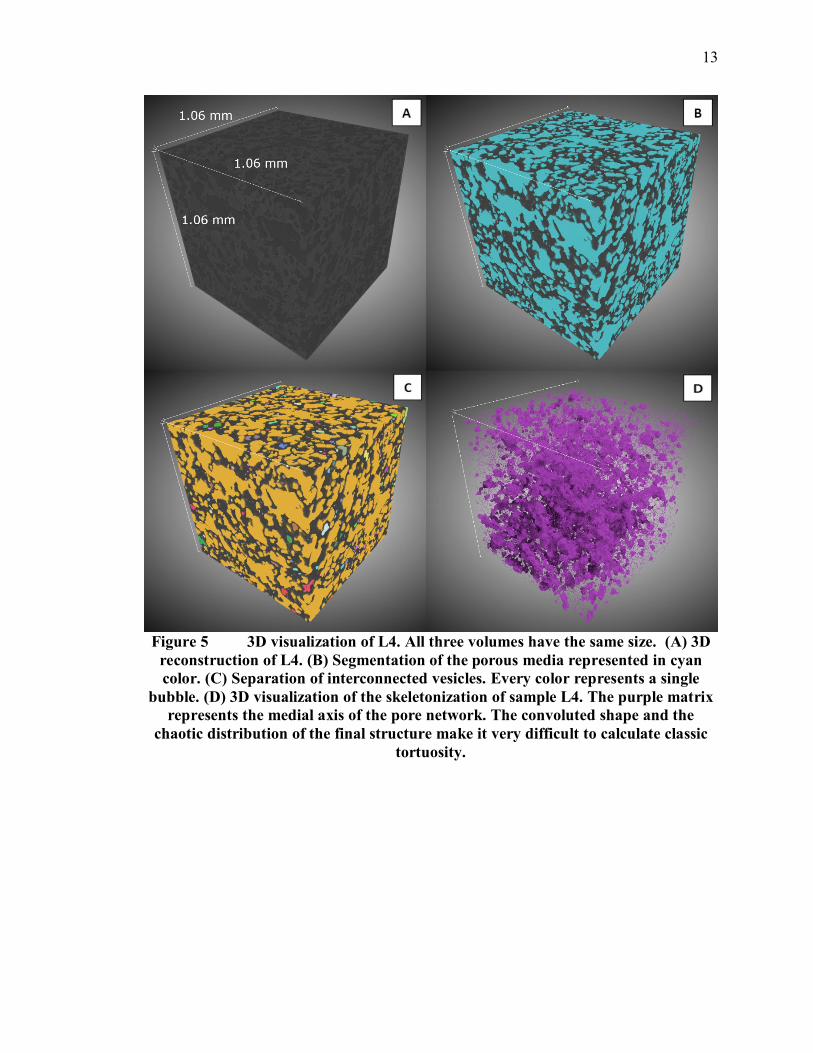
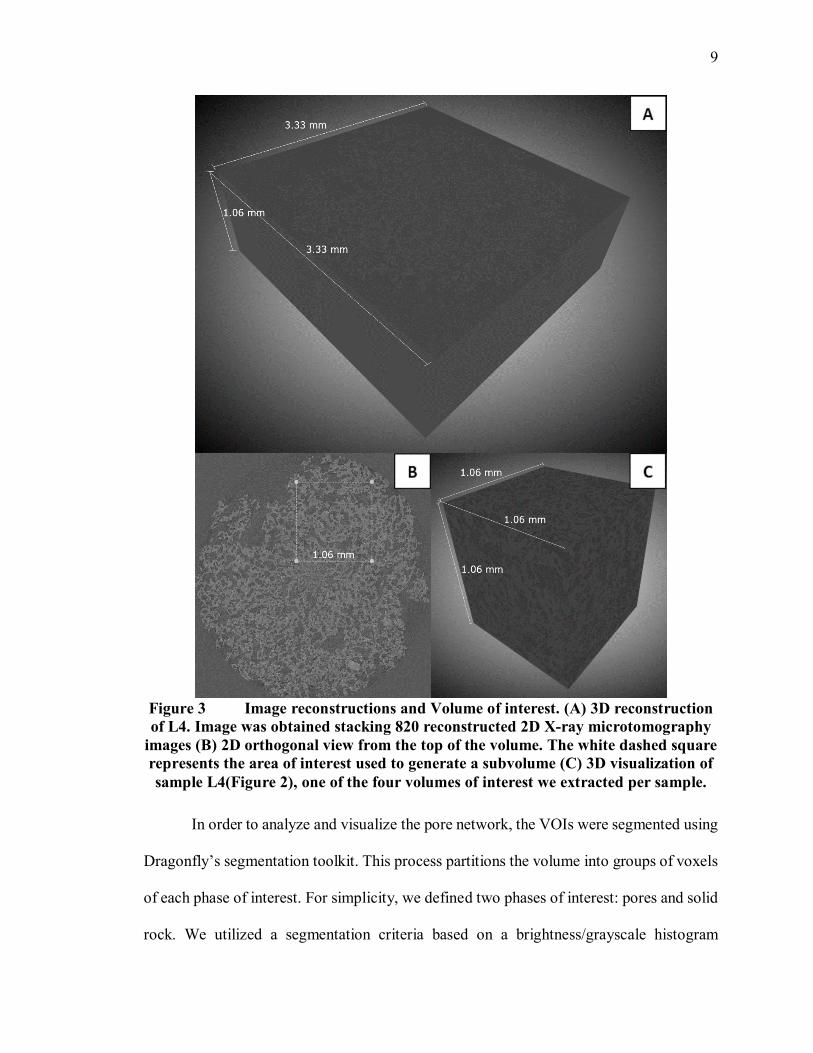
13
Figure 5 3D visualization of L4. All three volumes have the same size. (A) 3D
reconstruction of L4. (B) Segmentation of the porous media represented in cyan color. (C) Separation of interconnected vesicles. Every color represents a single
bubble. (D) 3D visualization of the skeletonization of sample L4. The purple matrix represents the medial axis of the pore network. The convoluted shape and the
chaotic distribution of the final structure make it very difficult to calculate classic tortuosity.
14
3D Tortuosity factor
Tortuosity factors (𝜏𝜏∗) were calculated using the MatLab application TauFactor
(Cooper et al., 2016). TauFactor calculates the changes in diffusive transport produced by
convolutions and heterogeneities of the interconnected porous media (Eq. 1; Backeberg et
al., 2017; Cooper et al., 2016). Equation (1) calculates effective diffusivity (Deff) in terms
of tortuosity factor,
𝐷𝐷eff = 𝐷𝐷0𝜖𝜖𝜏𝜏∗
(1)
where D0 is the intrinsic diffusivity of the conductive phase and ε is the volume fraction of
the porous phase. TauFactor calculates the directional tortuosity factor along three
mutually perpendicular axes of interconnected “diffusive phases” (or porous phases)
through a 3D volume generated by stacking binary or trinary 2D images (Appendix A.3)
It is important to note that tortuosity factor and tortuosity (𝜏𝜏) are two different
parameters, although both characterize the relationship between the geometry and length
of interconnected phases. In porous media, tortuosity is defined as the ratio between the
flow-path length and a straight line length in the direction of flow, which has been
commonly used to quantify flow, or diffusion along porous media (Suman and Ruth, 1993;
Shanti et al., 2014; Backeberg et al., 2017; Cooper et al., 2016). Tortuosity is measured
from skeletonized data using finite element analysis or finite difference calculation on
meshed data (Shanti et al., 2014). Unfortunately, the skeletonization of the porous network
of our samples are too complex and chaotic for this kind of operation (Fig. 5D). As such,
a tortuosity factor calculation is better suited for modelling more complex pore networks
such as those in our clasts (Backeberg et al., 2017; Cooper et al., 2016).

15
In a system where the cross-sectional area of the flow path remains constant,
tortuosity factor is equal to the square of tortuosity (Eq. 2; Tjaden et al., 2016; Backeberg
et al., 2017).
𝜏𝜏∗ ≃ 𝜏𝜏2 (2)
The Tortuosity factor and tortuosity both increase as pathways become more contorted.
Both parameters approach 1 when the cross-sectional area of the flow pathways remains
constant and the direction of flow follows the axis that is orthogonal to that cross-sectional
area (Backeberg et al., 2017).
TauFactor also computes 2D volume fractions, 3D phase volume fraction
(vesicularity), effective diffusivity (𝐷𝐷𝑒𝑒𝑒𝑒𝑒𝑒), directional percolation, tortuosity factor (𝜏𝜏∗),
and a provides a visual representation of the flux during steady state (Appendix A.3).
Permeability calculations
One of the most widely used relationships between permeability and tortuosity is
the Kozeny‐Carman relation (Yokoyama and Takeuchi, 2009; Matyka and Koza, 2001;
Farquharson et al., 2015; Berg, 2014; Bernard et al., 2007; Wei et al., 2018)
𝑘𝑘1 = 𝜙𝜙3
𝑐𝑐𝜏𝜏2𝑆𝑆2 (3)
where k1 is the Darcian permeability, given by the porosity (𝜙𝜙), tortuosity (𝜏𝜏), the surface
area per unit volume (S) and the Kozeny constant (c). Bernabe et al. (2010) defines two
simplified Kozeny constants: a crack-controlled media where c = 12; and a pore-controlled
media where c = 8 (Farquharson et al., 2015). We use c = 8 due to the nature of the porous
network. Given the complexity of the porous media and the low variation in the cross-
sectional area of the flow path, we combined Eq. (2) and Eq. (3) to find a relationship
between permeability and tortuosity factor (Eq. 4):
16
𝑘𝑘1 ≃𝜙𝜙3
𝑐𝑐𝜏𝜏∗𝑆𝑆2(4)
Decompression and discharge rates
We use the bubble number density decompression rate meter proposed by
Toramaru (2006) to calculate decompression rates (dP/dt) from volumetric bubble number
densities (Nv) for basaltic magmas under heterogeneous nucleation (Eq. 5; Shea, 2017;
Toramaru, 2006):
𝑑𝑑𝑑𝑑𝑑𝑑𝑡𝑡
= � 𝑁𝑁𝑣𝑣5(±3.5)×103
�23
(5)
Additionally, if we assume a cylindrical conduit geometry, we can estimate mass
discharge rates (𝑚𝑚)̇ as a function of bulk magma density (𝜌𝜌𝑚𝑚), decompression rate,
pressure gradient in the conduit (dP/dz), and conduit radius (r) (Shea, 2017):
�̇�𝑚 = 𝜌𝜌𝑚𝑚 �𝑑𝑑𝑑𝑑𝑑𝑑𝑑𝑑�−1�𝑑𝑑𝑑𝑑𝑑𝑑𝑡𝑡� 𝜋𝜋𝑟𝑟2 (6)
We approximate the pressure gradient in the conduit with the magmastatic gradient.
For a mafic magma at 1200˚C, dP/dz = 0.026 MPa m−1 (Cas and Simmons, 2018). We used
the bulk magma density (𝜌𝜌𝑚𝑚) (i.e. melt +vesicles±crystals) as the average density of our
pyroclasts for Unit 1, 𝜌𝜌𝑏𝑏𝑏𝑏𝑏𝑏𝑏𝑏 ∼ 1290 kg m−3(Marshall et al., in prep.). For the radius, we
considered that Plinian eruptions require larger conduits radius, between 10 and 150 m, to
explain the relationship between mass discharge and decompression rates (Shea, 2017). As
such, we calculated three discharge rates for radii of 25, 50 and 100 m.
17
Forchheimer and Stokes numbers
We calculated the Stokes and Forchheimer numbers for Unit 1 following Degruyter
et al. (2012) equations to validate and compare our results with the Plinian phase of the
May 18, 1980 eruption of Mount St. Helens (MSH 1980, Degruyter et al., 2012). The
Stokes number (St) is a non-dimensional number that represents the ratio of the magma
response time scale and the gas phase characteristic flow time (Eq. 7):
St =𝜌𝜌𝑚𝑚𝑘𝑘1𝜇𝜇𝑔𝑔𝑟𝑟𝑈𝑈𝑜𝑜
(7)
where 𝜌𝜌𝑚𝑚 is the bulk magma density, k1 is the Darcian permeability, μg is the viscosity of
the gas phase, r is the conduit radius, and U0 is the velocity. Velocity is calculated as the
ratio between the mean decompression rate and the magmastatic gradient in the conduit.
When St is small, magma and gas are coupled and ascend at the same velocity, preventing
degassing. For larger St, the degree of coupling decreases inducing degassing (Degruyter
et al., 2012; La Spina et al., 2017). In contrast, the Forchheimer number (Fo) corresponds
to the ratio of the inertial and viscous term in the Forchheimer’s law (Eq. 9; Degruyter et
al., 2012; La Spina et al., 2017):
Fo = 𝜌𝜌𝑔𝑔0𝑏𝑏1𝑈𝑈𝑜𝑜𝑏𝑏2𝜇𝜇𝑔𝑔
(8)
𝜌𝜌𝑔𝑔0 = 𝑑𝑑0𝑅𝑅𝑅𝑅
(9)
where ρg0 is the density of the gas phase and k2 is the inertial permeability. The density of
the gas phase is calculated using the Eq (9), where P0 is the pressure in the conduit at a
18
certain depth and R is the specific gas constant. The inertial permeability is calculated using
the Gonnermann et al. (2017) relationship between Darcian and Inertial permeabilities (Eq
10):
log10(𝑘𝑘2) = 1.353 log10(𝑘𝑘1) + 8.175 (10)
For small Fo, outgassing is controlled by the viscous permeability (Darcian). For
larger Fo, the inertial permeability dominates (Degruyter et al., 2012; La Spina et al., 2017).
In order to obtain Fo and St values, we assumed that the temperature in the conduit
is constant. We used a temperature of 1100 ˚C (1375 K), which represents the mean
temperature for the Curacautín Ignimbrite pre-eruptive magma (Lohmar, 2008). Gas
viscosity and velocity throughout the conduit are assumed constant as well, while conduit
radius and reference depth are variable between 25 and 100 m, and between 100 and 1000
m, respectively. Parameters used for Fo and St computations are summarized in Table 3.

19
CHAPTER THREE: RESULTS
Reconstruction and measurements of vesicle textures in 3D
We analyzed 40 VOIs from 10 representative pyroclasts, 4 VOIs per sample. The
reconstructed volumes obtained using synchrotron X-ray microtomography allow us to
visualize and quantify the vesicle network of Llaima pyroclasts in 3D (Fig. 6). All samples
show high vesicle interconnectivity and no signs of preferential vesicle elongation. There
are two main populations of vesicles: (1) a contorted connected vesicle network produced
by coalescence of smaller vesicles (>99% of porosity network, yellow color in Fig. 6A,
and (2) a population of very small and completely isolated vesicles (<1% of porosity
network; Fig. 6B). Isolated vesicles present multiple shapes with no evidence of high
sphericity or preferential elongation.
Quantitative textural parameters as 2D and 3D vesicularities, bubble number
densities (BND) and specific surface area are summarized in Table 1. Individual 3D
measurements of vesicularities are shown in Fig. 7A; the 2D ranges are represented by the
error bars. Average 3D vesicularities, correlated stratigraphically in Fig. 8A, and BND are
presented in Table 1. The BND results correspond to less than 1% of the total vesicle phase
(Fig. 6B). No correlation between BND and vesicularity is observed.
20
Figure 6 (A) 3D visualization of L4 vesicle network and isolated vesicles. Every
color represents 1 single vesicle, where the yellow color represents the main convoluted connected vesicle network. All voids correspond to the solid phase. (B) 3D visualization of L4 isolated vesicles. Every color represents one single vesicle.
21
Tabl
e 1
Sum
mar
y of
X-r
ay m
icro
tom
ogra
phy
resu
lts o
f ves
icle
text
ural
ana
lysi
s. M
icro
lite
num
ber
dens
ities
and
den
sity
valu
es e
xtra
cted
from
Mar
shal
l et a
l. (in
pre
p).
Sam
ple
ID(U
nit)
2D p
oros
ity
rang
e (v
ol%
)a
3D p
oros
ity
(vol
%)b
BND
× 1
03 (m
m-3
)c Sp
ecifi
c su
rfac
e ar
ea (m
m-1
) Sd
Tortu
osity
fa
ctor
τ*
e N
v x
106
(mm
-3)f
Den
sity
(k
g m
-3)g
L5(1
) 45
- 68
57
.02
(3.9
6)
7.96
(3.7
5)
81.6
9 (3
.37)
2.
72 (0
.55)
L1
(1)
56 -
77
68.2
1 (3
.14)
13
.93
(5.1
2)
61.1
5 (5
.84)
1.
89 (0
.24)
9.
72
1320
(280
) L2
(1)
41 -
63
53.0
0 (1
.99)
4.
13 (2
.53)
68
.99
(2.6
6)
3.99
(0.4
8)
1350
(300
) L3
(1)
42 -
73
54.5
3 (4
.74)
5.
89 (2
.25)
99
.13
(15.
83)
2.81
(0.6
4)
9.55
12
10 (2
30)
L4(1
) 45
- 59
51
.83
(1.8
6)
8.83
(8.4
3)
92.1
5 (5
.13)
3.
74 (0
.52)
13
.3
1310
(280
) L1
2(1)
44
- 63
51
.97
(4.7
7)
13.0
0 (8
.02)
12
8.17
(27.
46)
4.57
(1.3
6)
L6(1
) 47
- 65
56
.28
(1.8
7)
7.88
(4.4
3)
74.6
8 (4
.44)
3.
09 (0
.22)
8.
21
1260
(270
) L8
(2)
39 -
56
47.4
4 (1
.68)
1.
09 (0
.42)
86
.27
(3.6
1)
4.03
(0.3
9)
7.95
13
20 (3
20)
L10(
3)
39 -
55
48.1
1 (2
.59)
23
.06
(12.
43)
111.
86 (9
.13)
3.
75 (0
.28)
16
.6
1390
(370
) L1
8(4)
42
- 59
51
.07
(4.2
3)
2.18
(1.5
1)
83.3
8 (8
.74)
4.
40 (0
.82)
18
.4
1410
(310
) a M
inim
um a
nd m
axim
um v
alue
s of
2D
por
osity
con
side
ring
4 V
OIs
per
sam
ple.
b Ave
rage
por
osity
val
ues.
Num
bers
in
pare
nthe
sis
indi
cate
±1σ
, (n
=4).
c Ave
rage
bub
ble
num
ber
dens
ities
. N
umbe
rs i
n pa
rent
hesi
s in
dica
te ±
1σ,
(n=4
). d A
vera
ge sp
ecifi
c sur
face
are
a, su
rfac
e are
a per
vol
ume.
Num
bers
in p
aren
thes
is in
dica
te ±
1σ, (
n=4)
. e Ave
rage
tortu
osity
fa
ctor
val
ues
cons
ider
ing
the
3 ax
is o
f in
tere
st.
Num
bers
in
pare
nthe
sis
indi
cate
±1σ
, (n
=12)
. f N
v co
rres
pond
s to
pl
agio
clas
e m
icro
lite
num
ber d
ensit
ies.
(Mar
shal
et a
l., in
pre
p). g Sa
mpl
e de
nsity
(Mar
shal
et a
l., in
pre
p).
Num
bers
in
pare
nthe
sis i
ndic
ate
the
erro
r.
22
Figure 7 (A) 3D vesicularities measurements of the 4 VOIs per sample. Error bars correspond to 2D vesicularity ranges. (B) 2D vesicularity variability of one L4 sample marked in red. Maximum and minimum values represented in (A) as error
bars.
Average specific surface area calculations, defined as the ratio between the surface
area and the volume (Maroof et al., 2020), are also presented in Table 1. These values were
calculated for the contorted connected phase that represents the 99% of the vesicle phase
(Fig. 6A, yellow interconnected vesicle). No correlation with vesicularity or BND is
observed.
Tortuosity factor
Tortuosity factors were calculated using the MATLAB application TauFactor,
which quantifies the apparent decrease in diffusive transport resulting from convolutions
of the flow paths through porous media (Cooper et al., 2016). We compute tortuosities

23
factors in three orthogonal directions following the axis of our cubic VOIs. Results are
presented in Table 1 and correlated stratigraphically in Fig. 8B. We observe low directional
variability, implying that there is no preferential path direction for the gas flux. We also
observe an inverse relationship between vesicularity and tortuosity, and a strong direct
correlation with specific surface area (Appendix A.1).
24
Figu
re 8
R
esul
ts su
mm
ary
rela
ted
with
thei
r lo
catio
ns in
the
stra
tigra
phic
col
umn.
(A) P
oros
ity (B
) Tau
fact
or (C
) D
arci
an P
erm
eabi
lity
(D) D
ecom
pres
sion
Rat
es (E
) Disc
harg
e ra
tes f
or r
adii
of 2
5, 5
0, a
nd 1
00 m
.

25
Tabl
e 2
Sum
mar
y of
res
ults
for
Dar
cian
and
Iner
tial p
erm
eabi
litie
s, D
ecom
pres
sion
rate
s, D
ischa
rge
rate
s and
Fr
agm
enta
tion
thre
shol
d.
Sam
ple
ID(U
nit)
Dar
cian
Pe
rmea
bilit
y ×1
0-12 (m
2 ) k1a
Iner
tial
Perm
eabi
lity
×10-8
(m) k
2b
Dec
ompr
essi
on
rate
(MPa
s-1)
c D
isch
arge
rate
x 1
08 (K
g s-1
) ΔP
fr (M
Pa)g
r 25d
r 50e
r 100
f
L5(1
) 1.
43 (0
.61)
1.
48 (0
.81)
1.
32 (0
.39)
(1.6
2)
1.65
(0.5
4)
6.59
(2.1
5)
26.4
(8.6
0)
4.32
(0.0
5)
L1(1
) 6.
27 (2
.7)
10.5
(5.8
) 1.
95 (0
.58)
(2.4
0)
2.44
(0.7
1)
9.77
(2.8
3)
39.1
(11.
3)
5.14
(0.2
1)
L2(1
) 0.
99 (0
.18)
0.
87 (0
.19)
0.
84 (0
.25)
(1.0
3)
1.05
(0.3
7)
4.21
(1.4
8)
16.8
(5.9
2)
4.39
(0.0
4)
L3(1
) 1.
00 (0
.71)
1.
07 (0
.92)
1.
10 (0
.33)
(1.3
5)
1.37
(0.4
0)
5.49
(1.6
2)
22.0
(6.4
7)
4.17
(0.0
9)
L4(1
) 0.
58 (0
.18)
0.
41 (0
.16)
1.
34 (0
.40)
(1.6
5)
1.68
(0.7
3)
6.72
(2.9
1)
26.9
(11.
2)
4.11
(0.0
3)
L12(
1)
0.47
(0.5
8)
0.38
(0.5
6)
1.78
(0.5
3)(2
.19)
2.
23 (0
.83)
8.
91 (3
.32)
35
.6 (1
3.3)
3.
81 (0
.10)
L6
(1)
1.35
(0.3
9)
1.31
(0.5
2)
1.28
(0.3
8)(1
.58)
1.
61 (0
.57)
6.
44 (2
.29)
25
.8 (9
.15)
4.
36 (0
.06)
L8
(2)
0.46
(0.1
2)
0.27
(0.1
) 0.
36 (0
.11)
(0.4
4)
0.47
(0.1
3)
1.78
(0.5
6)
7.13
(2.1
0)
4.35
(0.0
4)
L10(
3)
0.30
(0.0
5)
0.17
(0.0
3)
2.60
(0.7
8)(3
.21)
3.
20 (1
.20)
13
.1 (4
.79)
52
.2 (1
9.2)
4.
08 (0
.11)
L1
8(4)
0.
62 (0
.31)
0.
57 (0
.41)
0.
55 (0
.16)
(0.6
8)
0.68
(0.2
5)
2.75
(0.9
6)
11.0
(3.9
4)
4.19
(0.0
6)
a Ave
rage
Dar
cian
per
mea
bilit
y va
lues
con
side
ring
the 3
axi
s of i
nter
est u
sing
Eq. 4
and
c=8
(Ber
nabe
et a
l., 2
010;
Far
quha
rson
et
al.,
201
5).
Num
bers
in
pare
nthe
sis
indi
cate
±1σ
, (n=
12).
b Ave
rage
Ine
rtial
per
mea
bilit
y va
lues
cal
cula
ted
usin
g Eq
. 11
(G
onne
rman
n et
al.,
201
7). N
umbe
rs in
par
enth
esis
indi
cate
±1σ
. (n=
12).
c Ave
rage
dec
ompr
essi
on r
ates
val
ues
usin
g Eq
. 5
(Tor
amar
u, 2
006;
She
a, 2
017)
. Firs
t and
seco
nd n
umbe
r in
pare
nthe
sis i
ndic
ate
the m
inim
um a
nd m
axim
um v
alue
resp
ectiv
ely,
(n
=4).
d Ave
rage
dis
char
ge ra
te fo
r a 2
5 m
eter
s con
duit
radi
us u
sing
Eq. 6
. Num
bers
in p
aren
thes
is in
dica
te ±
1σ, (
n=4)
. e Ave
rage
di
scha
rge
rate
for a
50
met
ers c
ondu
it ra
dius
usin
g Eq
. 6. N
umbe
rs in
par
enth
esis
indi
cate
±1σ
, (n=
4). f A
vera
ge d
isch
arge
rate
fo
r a 1
00 m
eter
s con
duit
radi
us u
sing
Eq. 6
. Num
bers
in p
aren
thes
is in
dica
te ±
1σ, (
n=4)
. g Frag
men
tatio
n th
resh
old
(Mue
ller e
t al
., 20
08).
26
Permeability calculations
Darcian Permeabilities were calculated using Eq. (4) and assuming a pore-
controlled medium (c = 8; Bernabe et al., 2010; Farquharson et al., 2015). Similar to the
tortuosity factor calculations, we computed permeability values in three orthogonal
directions following the axis of our cubic VOIs. Computations of average Darcian
permeability are presented in Table 2 and correlated stratigraphically in Figure 8C. These
results have an inverse correlation with tortuosity, a direct correlation with vesicularity,
and a strong inverse correlation with the specific surface area. We calculated inertial
permeabilities using the Darcian permeability results and the Eq. (11) (Gonnermann et al.,
2017). Average values of inertial permeabilities are also presented in Table 2, and present
similar correlations to Darcian permeabilities.
Decompression and discharge rates
Due to the large amount of microlites and the absence of glass in our samples (Fig.
2), we propose a heterogeneous nucleation regime for the formation of the small isolated
vesicles (Fig. 6B). Therefore, we calculated decompression rates using the Eq. (5) proposed
by Toramaru (2006) for basaltic magmas under heterogeneous nucleation (Shea, 2017).
Decompression rates for all samples range from 0.36 to 2.60 MPa s-1 (Table 2; Fig. 8D).
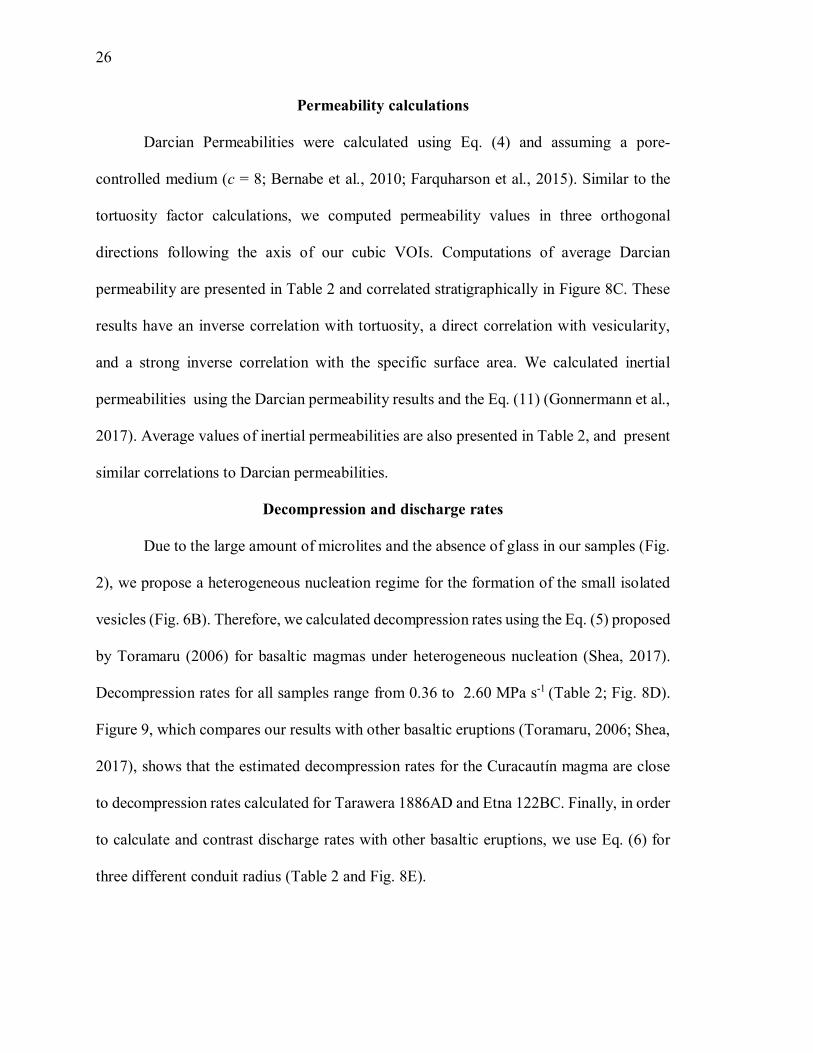
Figure 9, which compares our results with other basaltic eruptions (Toramaru, 2006; Shea,
2017), shows that the estimated decompression rates for the Curacautín magma are close
to decompression rates calculated for Tarawera 1886AD and Etna 122BC. Finally, in order
to calculate and contrast discharge rates with other basaltic eruptions, we use Eq. (6) for
three different conduit radius (Table 2 and Fig. 8E).
27
Figure 9 Decompression rates (MPa/s) vs BND (mm-3) for Units 1-4 using Eq. 6 (Toramaru, 2006; Shea, 2017). The blue line corresponds to the equation shown in
the top left corner. Historic basaltic eruptions extracted from Shea, 2017.
Etna 122BC
Etna 2000AD (Str)
Etna 2000AD (FF)
Fontana 60ka
Villarica 2003-2004AD
Pu'u O'o 1983-1986AD
Mauna Ulu 1969-1971AD
Pu'u O'o 1983-1986AD
Tarawera 1886AD
0.00
0.01
0.10
1.00
10.00
1.E+00 1.E+01 1.E+02 1.E+03 1.E+04 1.E+05
dP/d
t [M
Pa/s
]
BND[mm-3]
Shea, 2017Unit 1Unit 2Unit 3Unit 4

28
Forchheimer and Stokes numbers
We calculated Fo and St number for Unit 1 following equations 7, 8, 9, and 10
using the reference parameters in Table 3 (Degruyter et al., 2012; La Spina et al., 2017).
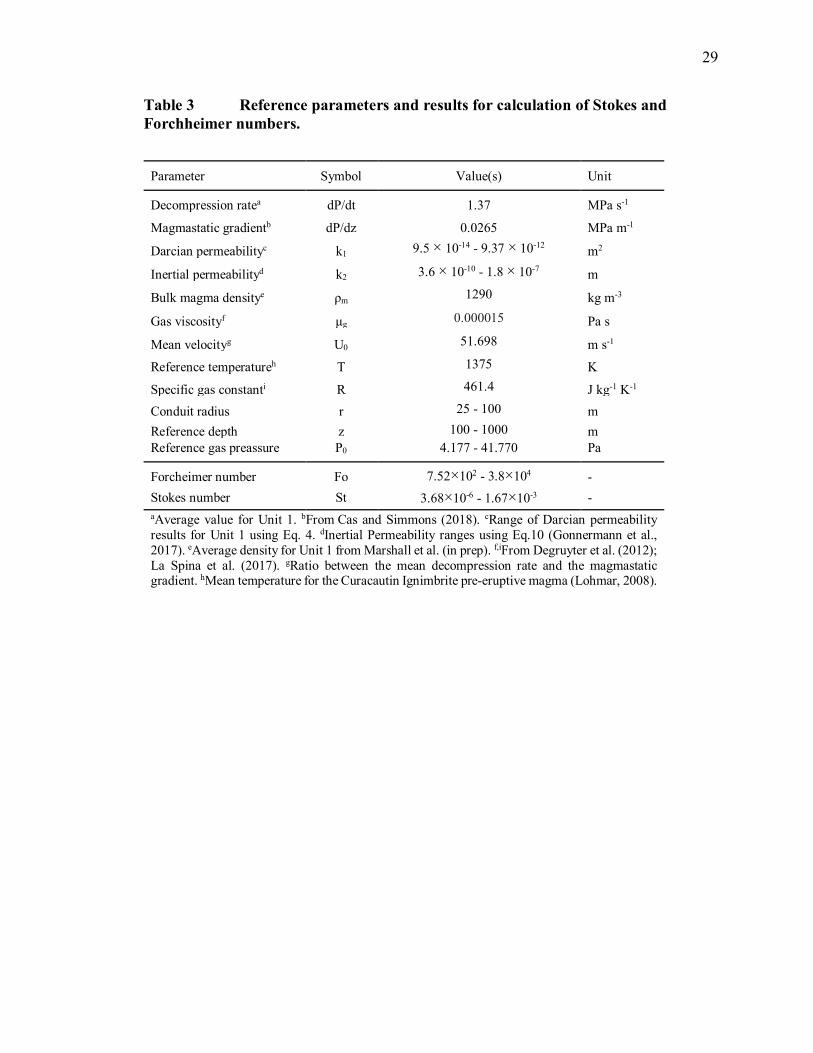
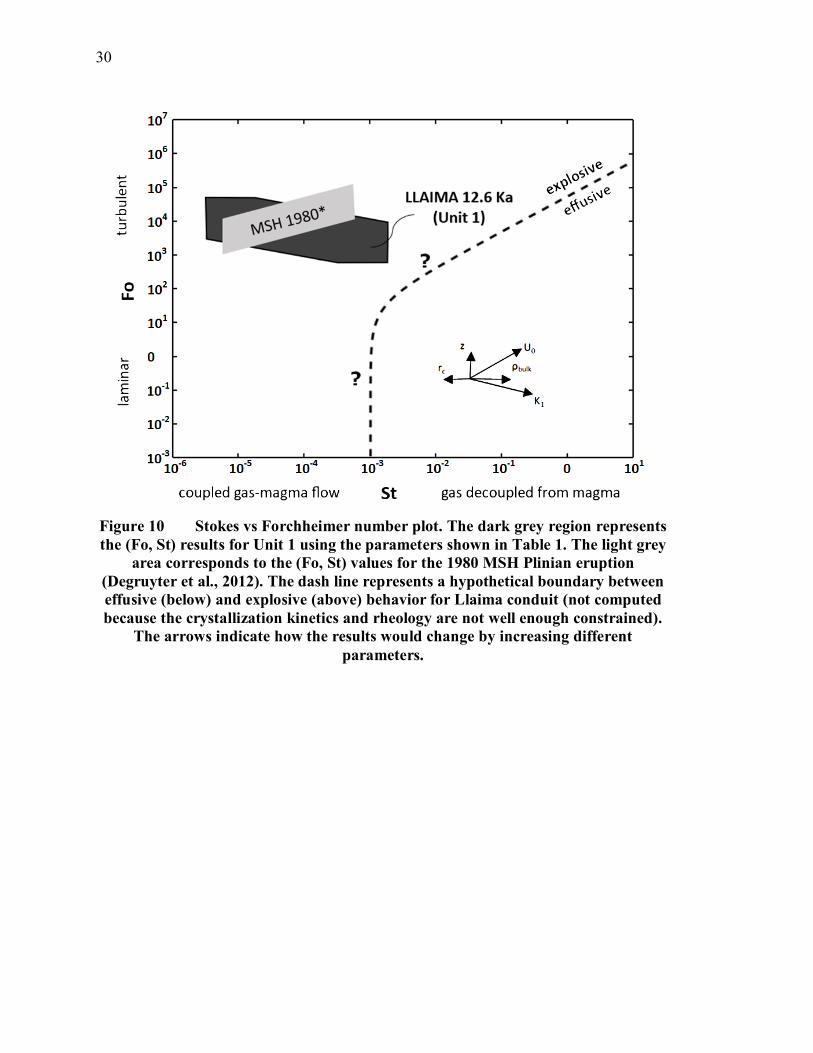
The (St, Fo) results for Unit 1 overlap with the (St, Fo) values for the 1980 Mount St.
Helens (MSH) Plinian eruption reported by Degruyter et al. (2012) (Fig. 10). Both areas
are in the low St and high Fo regions, indicating that the magma and gas were coupled,
ascending at the same velocity, and the outgassing was turbulent (Degruyter et al., 2012).
Higher permeabilities resulted in higher and lower values of St and Fo, respectively,
increasing the outgassing efficiency but not enough to decouple the gas phase from the
magma. Conversely, lower permeabilities resulted in lower and higher values of St and Fo,
respectively, enhancing the coupling between magma and the gas phase. Figure 10 shows
how increasing certain parameters influence the St and Fo numbers.
29
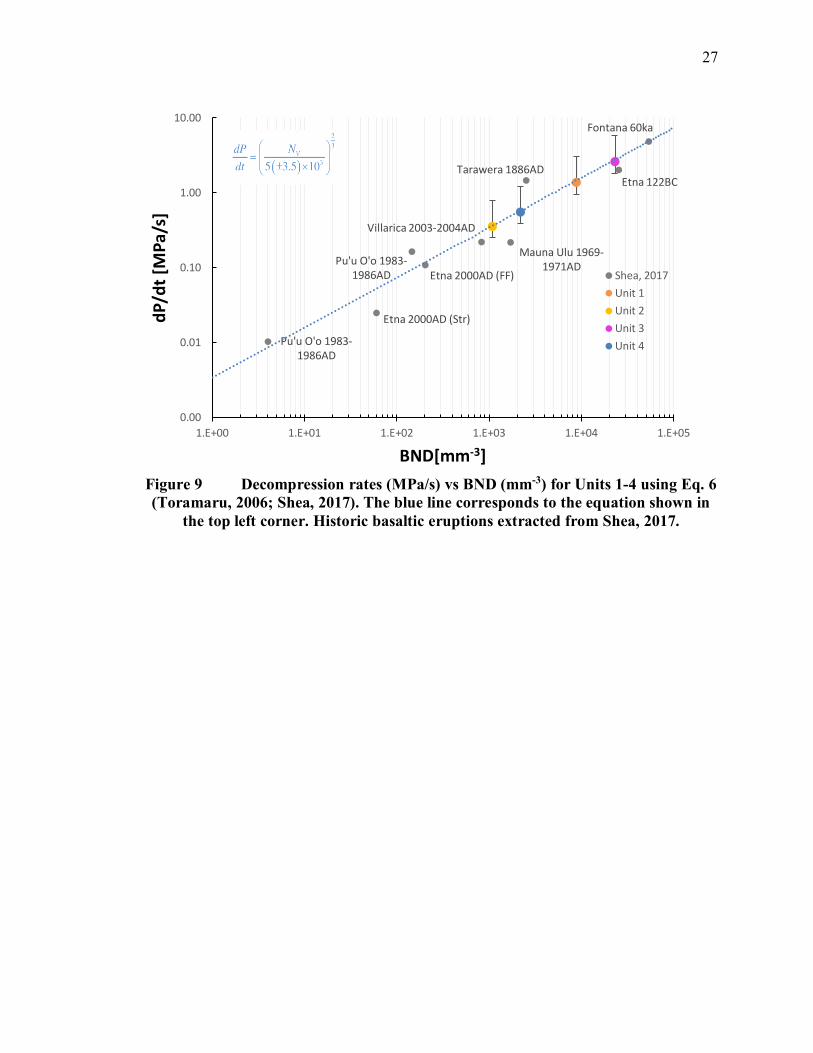
Table 3 Reference parameters and results for calculation of Stokes and Forchheimer numbers.
Parameter Symbol Value(s) Unit
Decompression ratea dP/dt 1.37 MPa s-1
Magmastatic gradientb dP/dz 0.0265 MPa m-1
Darcian permeabilityc k1 9.5 × 10⁻¹⁴ - 9.37 × 10⁻¹² m2
Inertial permeabilityd k2 3.6 × 10⁻¹⁰ - 1.8 × 10⁻⁷ m
Bulk magma densitye ρm 1290 kg m-3
Gas viscosityf μg 0.000015 Pa s
Mean velocityg U0 51.698 m s-1
Reference temperatureh T 1375 K
Specific gas constanti R 461.4 J kg-1 K-1
Conduit radius r 25 - 100 m
Reference depth z 100 - 1000 m
Reference gas preassure P0 4.177 - 41.770 Pa
Forcheimer number Fo 7.52×10² - 3.8×10⁴ -
Stokes number St 3.68×10⁻⁶ - 1.67×10⁻³ - aAverage value for Unit 1. bFrom Cas and Simmons (2018). cRange of Darcian permeability results for Unit 1 using Eq. 4. dInertial Permeability ranges using Eq.10 (Gonnermann et al., 2017). eAverage density for Unit 1 from Marshall et al. (in prep). f,iFrom Degruyter et al. (2012); La Spina et al. (2017). gRatio between the mean decompression rate and the magmastatic gradient. hMean temperature for the Curacautin Ignimbrite pre-eruptive magma (Lohmar, 2008).
30
Figure 10 Stokes vs Forchheimer number plot. The dark grey region represents the (Fo, St) results for Unit 1 using the parameters shown in Table 1. The light grey
area corresponds to the (Fo, St) values for the 1980 MSH Plinian eruption (Degruyter et al., 2012). The dash line represents a hypothetical boundary between effusive (below) and explosive (above) behavior for Llaima conduit (not computed because the crystallization kinetics and rheology are not well enough constrained).
The arrows indicate how the results would change by increasing different parameters.

31
CHAPTER FOUR: DISCUSSION
The 3D reconstructions allow us to investigate the pyroclast textures in detail and
extract valuable information, including vesicularity, surface areas, interconnectivity, and
number of vesicles, all of which are more challenging to interpret in 2D slices. For example,
we observe an average variation of ~13% for the 2D vesicularities considering all our VOIs
(Fig. 7). That variation decreases to less than ~3% if we compare the 3D vesicularity
between the four VOIs per sample (Table 1). This increment of accuracy suggests that the
VOI selected for this research is sufficient to account for the major textural variabilities of
our samples. In addition, we observe a vesicle network with more than 99%
interconnectivity in all our samples, something that would be impossible to conclude with
2D section analyses. This argument also applies to BND calculations, where it is harder to
discern if a vesicle is connected or not, especially under the presence of a convoluted
vesicle network that looks more disconnected in 2D (Fig. 2; Fig. 6).
BND results suggest that the magma rose at fast decompression rates, similar to
other basaltic explosive eruptions reported in the literature (Shea, 2017). Specifically, Unit
1 shows an average decompression rate of 1.4 MPa s-1 (Eq. 5), similar to the 1.5 and 2.0
MPa s-1 reported for Tarawera 1886AC and Etna 122BC, respectively (Figure 9; Shea,
2017). Although the lack of more samples for Unit 2, 3 and 4 add additional uncertainty
to the results, their decompression rates show a similarly rapid ascent behavior. We
estimate average discharge rates between 1.6×10⁸ and 2.2×10⁹ kg s-1 (Fig. 8E; Eq. 6), close
32
to the 1.4×10⁸ kg s-1 and 5-8.5×10⁸ kg s-1 reported for Fontana Lapilli Masaya 60ka and
Etna 122BC, respectively (Shea, 2017).
The presence of two populations of vesicles implies that there were at least two
events of bubble nucleation and growth in the magmatic system. We assume that the first
vesiculation event occurred deeper in the conduit. Decompression expansion likely caused
bubble growth and some degree of coalescence. Such vesiculation would have enhanced
the buoyancy of the bulk magma, driving magma acceleration (Cassidy et al., 2018).
The formation of the second population of vesicles (~1% of isolated vesicles; Fig
6B) might be the result of a syn-eruptive or late stage crystallization of microlites induced
by rapid ascent rates (La Spina et al., 2016). Decompression experiments show that rapid
ascent rates lead to high degrees of disequilibrium, promoting rapid nucleation of
plagioclase microlites at shallow depths (Brugger and Hammer, 2010; Befus and Andrews,
2018). Our samples are rich in microlites, with microlite number densities between of 7.95-
18.4×10⁸ plagioclase microlites per mm3 (Marshall et al., in prep; Table 1), evidencing
high degrees of disequilibrium crystallization. We infer that microlite nucleation shifted
the solubility conditions of the remaining melt (Hajimirza et al., 2021), causing a second,
late-stage exsolution event that formed the smaller and isolated vesicles. Simultaneously,
rapid crystallization of microlites would have restricted bubble expansion of the first
population of vesicles forcing them to grow toward each other resulting in a tortuous
vesicle network structure (99% interconnectivity) controlled by the geometry of
plagioclase microlites (Fig. 2; Arzilli et al., 2019; deGraffenried et al., 2019). This
contorted vesicle network shape and abundance of microlites between vesicles would limit
the diffusion of the remaining dissolved volatiles to existing bubbles and provide sites for

33
heterogeneous nucleation, leading the nucleation of the disconnected group of vesicles
(Hajimirza et al., 2021).
Fo and St calculations for Unit 1 (Eq. 8 and 9) suggest that the gas phase was
coupled with the magma during ascent, similar to the Plinian phase of the 1980 MSH
eruption (Degruyter et al., 2012). We propose that despite the well-connected network of
vesicles promoted by crystallization (e.g., Lindoo et al., 2017), the high viscosity of the
magma hindered the growth of pathways for gas transport through the convoluted vesicle
network leading to the coupling of the gas with the magma during ascent. The restricted
growth and coalescence, in addition to the late bubble nucleation event, may have
generated enough overpressure to the system to lead to brittle fragmentation of the magma
(Gonnermann and Manga, 2007). Given the evidence for rapid ascent rates, shear-induced
fragmentation may also have played a role.
As a preliminary validation, our permeability calculations indicate that our samples
are similar to those of other explosive eruptions (Fig. 11). Additionally, our results fall
within the wide empirical bounds provided by Mueller et al. (2005) for explosive volcanic
rocks and are consistent with collected data from pyroclasts from explosive eruptions
(Degruyter et al., 2012; Wright et al., 2009). Our values are similar to those measured on
samples generated experimentally in crystallizing and vesiculating basaltic andesites
(Lindoo et al., 2017). In order to assign a degree of accuracy to our work and given the
small size of pyroclast available for this research, we propose further experimental
validation of our methodology using other volcanic products, sufficiently large in size for
traditional permeameters, or Lattice-Boltzmann simulations (Degruyter et al., 2010).

34
Following the methods of Mueller et al. (2008), we calculate the minimum bubble
overpressure needed to lead fragmentation (ΔPfr)
∆𝑃𝑃fr = 𝑎𝑎�𝑏𝑏1+ 𝜎𝜎𝑚𝑚𝜙𝜙
(11)
where a and σm are constants equal to 8.21×10⁵ MPa m-1, and 1.54 MPa, respectively. Our
results show that a bubble overpressure greater than 5.2 MPa could have been sufficient to
fragment the Curacautín magma (Fig. 12; Table 2).
Lastly, low variations in the stratigraphic sequence (Fig. 8) support the assertion of
Marshall et al (in prep.) that the Curacautín Ignimbrite is the result of one eruptive event
with perhaps several discrete explosive pulses, resulting in the four flow units.

35
Figure 11 Porosity vs Darcian permeability results. Black dots correspond to the
values calculated for the 12.6 ka Curacautín Ignimbrite (Eq. 4). The blue region represents data collection of pyroclasts for effusive eruptions, the red region
represents data collection of pyroclasts for explosive eruptions (Degruyter et al., 2012; Wright et al., 2009). The area between the dash lines correspond to the
Mueller et al. (2005) model for explosive eruptions.

36
Figure 12 The 3D curve represents the minimum overpressure required to
achieve fragmentation at given sample porosity and permeability (Mueller et al., 2008). Red stars represent our results for permeability and porosity.
37
CHAPTER FIVE: CONCLUSIONS
We focus on the 12.6 ka explosive mafic eruption at Llaima Volcano, Chile, that
resulted in an extensive ignimbrite. The objective of this study was to use 3D X-ray
microtomography reconstructions of pyroclasts to measure porosities, bubble number
density, vesicle interconnectivity, and geometrical properties of the porous media. We use
these textures to constrain vesicle tortuosity, permeabilities, decompression rates, the
degree of coupling between the gas phase and the magma, and the evolution of vesiculation
during ascent. The analytical calculations provide an approach for quantifying the
permeability and tortuosity of pyroclasts vesicle networks in samples too small to use
laboratory techniques (e.g., permeameter).
The 3D geometrical parameters extracted from X-ray microtomography analyses
provides high degrees of accuracy than using 2D approaches, allowing us to accurately
characterize the texture of our pyroclasts. Even though the relationship between tau factor
and tortuosity is not well constrained yet, tau factor produced a reasonable approximation
of tortuosity for the complex and convoluted vesicle networks of our pyroclasts without
requiring high computational power. In order to validate the methodology used in this
research, we propose further experimental research using bigger pyroclast products to
compare X-ray microtomography permeabilities with permeameter calculations.
Our 3D vesicle texture results evidence rapid ascent rates that induced
disequilibrium crystallization of microlites during ascent. The increase in microlite content

38
shifted the solubility of the remaining magma causing a second vesiculation, completely
disconnected from the existing vesicle network. Simultaneously, microlite crystallization
confined bubbles during expansion, enhancing bubble coalescence (connectivity). This
crystallization event forced bubbles to grow toward each other, resulting in the convoluted
interconnected vesicle network. At this stage, volatile phase was coupled with the magma
inhibiting outgassing and promoting an increase in bubble overpressure. Our permeability
and vesicularity results suggest that a minimum bubble overpressure of 5.2 MPa was
required to induce fragmentation of the magma.
The conditions that led to explosive mafic volcanism at Llaima Volcano are similar
to other basaltic explosive eruptions (Tarawera 1886AC, Etna 122BC and Fontana Lapilli
Masaya 60ka). Our results provide further evidence that mafic explosive volcanism at
Llaima volcano, as well as other mafic centers, is driven by rapid magma ascent. Rapid
ascent induces disequilibrium crystallization conditions and rapid crystallization of
microlites. Crystallization increased viscosity of the magma, inhibiting gas escape. We
suggest that future work should focus on the evaluation of rheology evolution due to
nucleation and growth of microlites during ascent, the mechanism behind the initiation and
evolution of the vesicle network, and the conditions that lead to coupling of the gas and
magma, promoting explosive behavior.
39
REFERENCES
Arzilli, F., La Spina, G., Burton, M., Polacci, M., Le Gall, N., Hartley, M., Di Genova,
D., Cai, B., Vo, N., Bamber, E., Nonni, S., Atwood, R., Llewellin, E., Brooker,
R., Mader, H., & Lee, P. (2019). Magma fragmentation in highly explosive
basaltic eruptions induced by rapid crystallisation. Nature Geoscience, 12, 1023–
1028. https://doi.org/10.1038/s41561-019-0468-6
Backeberg, N. R., Iacoviello, F., Rittner, M., Mitchell, T. M., Jones, A. P., Day, R., …
Striolo, A. (2017). Quantifying the anisotropy and tortuosity of permeable
pathways in clay-rich mudstones using models based on X-ray tomography.
Scientific Reports, 7(1), 1–12. https://doi.org/10.1038/s41598-017-14810-1
Baker, D. R., Mancini, L., Polacci, M., Higgins, M. D., Gualda, G. A. R., Hill, R. J., &
Rivers, M. L. (2012). An introduction to the application of X-ray
microtomography to the three-dimensional study of igneous rocks. Lithos, 148,
262–276. https://doi.org/10.1016/j.lithos.2012.06.008
Bamber, E. C., Arzilli, F., Polacci, M., Hartley, M. E., Fellowes, J., Di Genova, D., …
Burton, M. R. (2020). Pre- and syn-eruptive conditions of a basaltic Plinian
eruption at Masaya Volcano, Nicaragua: The Masaya Triple Layer (2.1 ka).
Journal of Volcanology and Geothermal Research, 392, 106761.
https://doi.org/10.1016/j.jvolgeores.2019.106761
Befus, K. S., & Andrews, B. J. (2018). Crystal nucleation and growth produced by
continuous decompression of Pinatubo magma. Contributions to Mineralogy and
Petrology, 173(11). https://doi.org/10.1007/s00410-018-1519-5
Berg, C. F. (2014). Permeability Description by Characteristic Length, Tortuosity,
Constriction and Porosity. Transport in Porous Media, 103(3), 381–400.
https://doi.org/10.1007/s11242-014-0307-6
40
Bernabé, Y., Li, M., Maineult, A. (2010). Permeability and pore connectivity: a new
model based on network simulations. J. Geophys. Res. 155, B10203.
http://dx.doi.org/10.1023/2010JB007444
Bernard, M. L., Zamora, M., Géraud, Y., & Boudon, G. (2007). Transport properties of
pyroclastic rocks from Montagne Pelée volcano (Martinique, Lesser Antilles).
Journal of Geophysical Research: Solid Earth, 112(5), 1–16.
https://doi.org/10.1029/2006JB004385
Brugger, C. R., & Hammer, J. E. (2010). Crystallization kinetics in continuous
decompression experiments: Implications for interpreting natural magma ascent
processes. Journal of Petrology, 51(9), 1941–1965.
https://doi.org/10.1093/petrology/egq044
Cas, R. A. F., & Simmons, J. M. (2018). Why deep-water eruptions are so different from
subaerial eruptions. Frontiers in Earth Science, 6(November), 1–21.
https://doi.org/10.3389/feart.2018.00198
Cashman, K. V., & Scheu, B. (2015). Magmatic Fragmentation. In The Encyclopedia of
Volcanoes (Second Edi). https://doi.org/10.1016/b978-0-12-385938-9.00025-0
Cassidy, M., Manga, M., Cashman, K., & Bachmann, O. (2018). Controls on explosive-
effusive volcanic eruption styles. Nature Communications, 9(1).
https://doi.org/10.1038/s41467-018-05293-3
Coltelli M, Del Carlo P, Vezzoli L (1998) Discovery of a Plinian basaltic eruption of
Roman age at Etna volcano, Italy. Geology 26:1095–1098
Costantini L, Bonadonna C, Houghton BF, Wehrmann H (2009) New physical
characterization of the Fontana Lapilli basaltic Plinian eruption, Nicaragua. Bull
Volcanol 71:337–355. https://doi.org/10.1007/s00445-008-0227-9
Costantini L, Houghton BF, Bonadonna C (2010) Constraints on eruption dynamics of
basaltic explosive activity derived from chemical and microtextural study: The
example of the Fontana Lapilli Plinian eruption, Nicaragua. J Volcanol Geotherm
Res 189:207–224. https://doi.org/j.jvolgeores.2009.11.008
41
Cooper, S. J., Bertei, A., Shearing, P. R., Kilner, J. A., & Brandon, N. P. (2016).
TauFactor: An open-source application for calculating tortuosity factors from
tomographic data. SoftwareX, 5, 203–210.
https://doi.org/10.1016/j.softx.2016.09.002
deGraffenried, R. L., Larsen, J. F., Graham, N. A., & Cashman, K. V. (2019). The
Influence of Phenocrysts on Degassing in Crystal-Bearing Magmas With
Rhyolitic Groundmass Melts. Geophysical Research Letters, 46(10), 5127–5136.
https://doi.org/10.1029/2018GL081822
Degruyter, W., Burgisser, A., Bachmann, O., & Malaspinas, O. (2010). Synchrotron X-
ray microtomography and lattice Boltzmann simulations of gas flow through
volcanic pumices. Geosphere, 6(5), 470–481. https://doi.org/10.1130/GES00555.1
Degruyter, W., Bachmann, O., Burgisser, A., & Manga, M. (2012). The effects of
outgassing on the transition between effusive and explosive silicic eruptions.
Earth and Planetary Science Letters, 349–350, 161–170.
https://doi.org/10.1016/j.epsl.2012.06.056
Farquharson, J., Heap, M. J., Varley, N. R., Baud, P., & Reuschlé, T. (2015).
Permeability and porosity relationships of edifice-forming andesites: A combined
field and laboratory study. Journal of Volcanology and Geothermal Research,
297, 52–68. https://doi.org/10.1016/j.jvolgeores.2015.03.016
Giachetti, T., Burgisser, A., Arbaret, L., Druitt, T. H., & Kelfoun, K. (2011). Quantitative
textural analysis of Vulcanian pyroclasts (Montserrat) using multi-scale X-ray
computed microtomography: Comparison with results from 2D image analysis.
Bulletin of Volcanology, 73(9), 1295–1309. https://doi.org/10.1007/s00445-011-
0472-1
Gonnermann, H. M., & Manga, M. (2007). The fluid mechanics inside a volcano. Annual
Review of Fluid Mechanics, 39, 321–356.
https://doi.org/10.1146/annurev.fluid.39.050905.110207

42
Gonnermann, H. M., Giachetti, T., Fliedner, C., Nguyen, C. T., Carey, R. J., Houghton,
B. F., & Crozier, J. A. (2017). Journal of Geophysical Research : Solid Earth.
Permeability During Magma Expansion and Compaction. 1–24.
Hajimirza, S., Gonnermann, H. M., & Gardner, J. E. (2021). Reconciling bubble
nucleation in explosive eruptions with geospeedometers. Nature
Communications, 12(1), 1-8.
Houghton BF, Wilson CJN, Del Carlo P, Coltelli M, Sable JE, Carey R (2004) The
influence of conduit processes on changes in styles of basaltic Plinian eruptions:
Tarawera 1886 and Etna 122 BC. J Volcanol Geotherm Res 137:1–14.
https://doi.org/j.jvolgeores.2004.05.009
Ketcham, R. A., & Carlson, W. D. (2001). Acquisition, optimization and interpretation of
x-ray computed tomographic imagery: Applications to the geosciences.
Computers and Geosciences, 27(4), 381–400. https://doi.org/10.1016/S0098-
3004(00)00116-3
Ketcham, R. A. (2005). Computational methods for quantitative analysis of three-
dimensional features in geological specimens. Geosphere, 1(1), 32–41.
https://doi.org/10.1130/GES00001.1
Klug, C., Cashman, K. Permeability development in vesiculating magmas: implications
for fragmentation. Bull Volcanol 58, 87–100 (1996). https://doi-
org.libproxy.boisestate.edu/10.1007/s004450050128
La Spina, G., Burton, M., De’Michieli Vitturi, M., & Arzilli, F. (2016). Role of syn-
eruptive plagioclase disequilibrium crystallization in basaltic magma ascent
dynamics. Nature Communications, 7(November 2017).
https://doi.org/10.1038/ncomms13402
La Spina, G., Polacci, M., Burton, M., & de’ Michieli Vitturi, M. (2017). Numerical
investigation of permeability models for low viscosity magmas: Application to the
2007 Stromboli effusive eruption. Earth and Planetary Science Letters, 473, 279–
290. https://doi.org/10.1016/j.epsl.2017.06.013

43
La Spina, G., Arzilli, F., Llewellin, E. W., Burton, M. R., Clarke, A. B., de’ Michieli
Vitturi, M., … Mader, H. M. (2020). Explosivity of basaltic lava fountains is
controlled by magma rheology, ascent rate and outgassing. Earth and Planetary
Science Letters, 553, 116658. https://doi.org/10.1016/j.epsl.2020.116658
Lindoo, A., Larsen, J. F., Cashman, K. V., & Oppenheimer, J. (2017). Crystal controls on
permeability development and degassing in basaltic andesite
magma. Geology, 45(9), 831-834.
Lohmar, S. (2008). Petrologia de las ignimbritas Lican y Pucon (Volcan Villarrica) y
Curacautín (Volcan Llaima) en los Andes del sur de Chile. Universidad de Chile.
Mangan, M., Sisson, T. (2000). Delayed, disequilibrium degassing in rhyolite magma:
decompression experiments and implications for explosive volcanism. Earth and
Planetary Science Letters 183, 441–455.
Mangan, M., Mastin, L., Sisson, T. (2004). Gas evolution in eruptive conduits:
combining insights from high temperature and pressure decompression
experiments with steady-state flow modelling. Journal of Volcanology and
Geothermal Research 129, 23–36
Maroof, M. A., Mahboubi, A., & Noorzad, A. (2020). A new method to determine
specific surface area and shape coefficient of a cohesionless granular medium.
Advanced Powder Technology, 31(7), 3038–3049.
https://doi.org/10.1016/j.apt.2020.05.028
Martel, C., & Iacono-marziano, G. (2015). Timescales of bubble coalescence , outgassing
, and foam collapse in decompressed rhyolitic melts. Earth and Planetary Science
Letters, 412, 173–185. https://doi.org/10.1016/j.epsl.2014.12.010
Matyka, M., & Koza, Z. (2011). Tortuosity-porosity relation in porous media flow. (May
2014). https://doi.org/10.1103/PhysRevE.78.026306
Moitra, P., Gonnermann, H. M., Houghton, B. F., & Tiwary, C. S. (2018). Fragmentation
and Plinian eruption of crystallizing basaltic magma. Earth and Planetary Science
Letters, 500, 97–104. https://doi.org/10.1016/j.epsl.2018.08.003

44
Mueller, S., Melnik, O., & Spieler, O. (2005). Permeability and degassing of dome lavas
undergoing rapid decompression : An experimental determination. 526–538.
https://doi.org/10.1007/s00445-004-0392-4
Mueller, S., Scheu, B., Spieler, O., & Dingwell, D. B. (2008). Permeability control on
magma fragmentation. Geology, 36(5), 399–402.
https://doi.org/10.1130/G24605A.1
Murch, A. P., & Cole, P. D. (2019). Using microlites to gain insights into ascent
conditions of differing styles of volcanism at Soufrière Hills Volcano. Journal of
Volcanology and Geothermal Research, 384, 221–231.
https://doi.org/10.1016/j.jvolgeores.2019.07.022
Namiki, A., Patrick, M. R., Manga, M., & Houghton, B. F. (2021). Brittle fragmentation
by rapid gas separation in a Hawaiian fountain. Nature Geoscience, 1-6.
Naranjo, J., & Moreno, M. (1991). Actividad explosiva postglacial en el volcan Llaima,
Andes del Sur, 38° 45S. Rev. Geol. Chile, 18(1), 69–80.
https://doi.org/10.5027/andgeoV18n1-a06
Pandolfi, R. J. et al. (2018). Xi-cam: a versatile interface for data visualization and
analysis. J. Synchrotron Radiation 25, 1261–1270.
Parfitt, E. A. (2004). A discussion of the mechanisms of explosive basaltic eruptions.
Journal of Volcanology and Geothermal Research, 134(1–2), 77–107.
https://doi.org/10.1016/j.jvolgeores.2004.01.002
Pérez W, Freundt A, Kutterolf S (2020) The basaltic plininan eruption of the ~6 ka San
Antonio Tephra and formation of the Masaya caldera, Nicaragua. J Volcanol
Geotherm Res 401:1–17. doi: 10.1016/j.jvolgeores.2020.106975
Polacci, M., Mancini, L., & Baker, D. R. (2010). The contribution of synchrotron X-ray
computed microtomography to understanding volcanic processes. Journal of
Synchrotron Radiation, 17(2), 215–221.
https://doi.org/10.1107/S0909049509048225
45
Polacci, M., Arzilli, F., La Spina, G., Le Gall, N., Cai, B., Hartley, M. E., … Burton, M.
R. (2018). Crystallisation in basaltic magmas revealed via in situ 4D synchrotron
X-ray microtomography. Scientific Reports, 8(1), 1–13.
https://doi.org/10.1038/s41598-018-26644-6
Sable, J. E., Houghton, B. F., Del Carlo, P., & Coltelli, M. (2006). Changing conditions
of magma ascent and fragmentation during the Etna 122 BC basaltic Plinian
eruption: Evidence from clast microtextures. Journal of Volcanology and
Geothermal Research, 158(3–4), 333–354.
https://doi.org/10.1016/j.jvolgeores.2006.07.006
Shanti, N. O., Chan, V. W. L., Stock, S. R., De Carlo, F., Thornton, K., & Faber, K. T.
(2014). X-ray micro-computed tomography and tortuosity calculations of
percolating pore networks. Acta Materialia, 71, 126–135.
https://doi.org/10.1016/j.actamat.2014.03.003
Shea, T. (2017). Bubble nucleation in magmas : A dominantly heterogeneous process ?
Journal of Volcanology and Geothermal Research, 343, 155–170.
https://doi.org/10.1016/j.jvolgeores.2017.06.025
Suman, R., & Ruth, D. (1993). Formation factor and tortuosity of homogeneous porous
media. Transport in Porous Media, 12(2), 185–206.
https://doi.org/10.1007/BF00616979
Tjaden, B., Cooper, S. J., Brett, D. J., Kramer, D. & Shearing, P. R. (2016). On the origin
and application of the Bruggeman correlation for analysing transport phenomena
in electrochemical systems. Current Opinion in Chemical Engineering 12, 44–51
Toramaru, A. (2006). BND ( bubble number density ) decompression rate meter for
explosive volcanic eruptions. 154, 303–316.
https://doi.org/10.1016/j.jvolgeores.2006.03.027
Vona, A., Romano, C., Dingwell, D. B., & Giordano, D. (2011). The rheology of crystal-
bearing basaltic magmas from Stromboli and Etna. Geochimica et Cosmochimica
Acta, 75(11), 3214–3236. https://doi.org/10.1016/j.gca.2011.03.031
46
Yokoyama, T., & Takeuchi, S. (2009). Porosimetry of vesicular volcanic products by a
water-expulsion method and the relationship of pore characteristics to
permeability. Journal of Geophysical Research: Solid Earth, 114(2).
https://doi.org/10.1029/2008JB005758
Yoshimura, S., Kuritani, T., Matsumoto, A., & Nakagawa, M. (2019). Fingerprint of
silicic magma degassing visualised through chlorine microscopy. Scientific
Reports, 9(1), 1–10. https://doi.org/10.1038/s41598-018-37374-0
Wei, W., Cai, J., Xiao, J., Meng, Q., Xiao, B., & Han, Q. (2018). Kozeny-Carman
constant of porous media: Insights from fractal-capillary imbibition theory. Fuel,
234(June), 1373–1379. https://doi.org/10.1016/j.fuel.2018.08.012
Wright, H. M. N., Cashman, K. V., Gottesfeld, E. H., & Roberts, J. J. (2009). Pore
structure of volcanic clasts: Measurements of permeability and electrical
conductivity. Earth and Planetary Science Letters, 280(1–4), 93–104.
https://doi.org/10.1016/j.epsl.2009.01.023

47
APPENDIX

48
Tabl
e A
.1
Full
com
pila
tion
of X
-ray
mic
roto
mog
raph
y re
sults
of v
esic
le te
xtur
al a
naly
sis, t
ortu
osity
fact
ors,
Dar
cian
pe
rmea
bilit
ies a
nd in
ertia
l per
mea
bilit
ies.
ID
2D p
oros
ity
3D p
oros
ity
BND
S
Tortu
osity
fact
or
Dar
cian
Per
mea
bilit
y (m
2 ) In
ertia
l Per
mea
bilit
y (m
) (v
ol%
) (v
ol%
) (m
m-3
) (m
m-1
) d1
d2
d3
d1
d2
d3
d1
d2
d3
L5
45 -
57
51.0
4 1.
80E+
03
84.5
8 3.
46
3.44
3.
70
6.72
E-13
6.
75E-
13
6.28
E-13
5.
07E-
09
5.11
E-09
4.
63E-
09
51 -
60
55.8
8 8.
09E+
03
85.2
7 2.
75
2.59
2.
84
1.09
E-12
1.
16E-
12
1.05
E-12
9.
80E-
09
1.06
E-08
9.
34E-
09
54 -
68
61.0
2 1.
11E+
04
77.1
7 2.
53
2.11
2.
21
1.89
E-12
2.
27E-
12
2.16
E-12
2.
05E-
08
2.63
E-08
2.
46E-
08
54 -
66
60.1
3 1.
09E+
04
79.7
5 2.
55
2.15
2.
26
1.68
E-12
1.
98E-
12
1.89
E-12
1.
75E-
08
2.19
E-08
2.
06E-
08
L1
56 -
72
65.0
7 1.
90E+
04
66.9
9 2.
00
2.09
2.
20
3.83
E-12
3.
67E-
12
3.50
E-12
5.
35E-
08
5.05
E-08
4.
73E-
08
62 -
77
71.1
6 7.
52E+
03
55.5
0 1.
57
1.56
1.
59
9.31
E-12
9.
37E-
12
9.20
E-12
1.
78E-
07
1.79
E-07
1.
75E-
07
67 -
77
71.5
4 1.
03E+
04
55.1
3 1.
75
1.78
1.
83
8.61
E-12
8.
47E-
12
8.25
E-12
1.
60E-
07
1.56
E-07
1.
51E-
07
56 -
73
65.0
7 1.
90E+
04
66.9
9 2.
00
2.09
2.
20
3.83
E-12
3.
67E-
12
3.50
E-12
5.
35E-
08
5.05
E-08
4.
73E-
08
L2
45 -
63
55.7
7 5.
57E+
03
70.4
2 3.
64
3.22
3.
46
1.20
E-12
1.
36E-
12
1.27
E-12
1.
11E-
08
1.31
E-08
1.
19E-
08
48 -
60
54.0
1 7.
54E+
03
72.6
1 4.
05
3.58
3.
96
9.22
E-13
1.
04E-
12
9.44
E-13
7.
78E-
09
9.22
E-09
8.
03E-
09
41 -
61
51.0
8 1.
99E+
03
67.0
0 4.
16
3.93
4.
06
8.93
E-13
9.
44E-
13
9.14
E-13
7.
45E-
09
8.04
E-09
7.
69E-
09
42 -
59
51.1
3 1.
41E+
03
65.9
5 4.
97
4.42
4.
44
7.73
E-13
8.
69E-
13
8.65
E-13
6.
13E-
09
7.19
E-09
7.
15E-
09
L3
45 -
63
51.4
7 7.
43E+
03
109.
11
3.17
3.
64
3.09
4.
51E-
13
3.93
E-13
4.
64E-
13
2.96
E-09
2.
46E-
09
3.07
E-09
55
- 67
61
.54
8.45
E+03
79
.05
2.46
2.
45
2.15
1.
90E-
12
1.90
E-12
2.
17E-
12
2.07
E-08
2.
08E-
08
2.48
E-08
44
- 56
49
.12
5.04
E+03
11
9.15
3.
97
3.42
2.
91
2.63
E-13
3.
05E-
13
3.58
E-13
1.
43E-
09
1.75
E-09
2.
17E-
09
42 -
73
55.9
9 2.
64E+
03
89.2
1 2.
28
2.18
2.
06
1.21
E-12
1.
26E-
12
1.34
E-12
1.
13E-
08
1.19
E-08
1.
29E-
08
L4
47 -
57
52.3
9 2.
34E+
04
90.6
5 3.
96
4.13
4.
22
5.53
E-13
5.
30E-
13
5.19
E-13
3.
90E-
09
3.68
E-09
3.
57E-
09
49 -
59
53.5
7 3.
34E+
03
84.8
2 3.
22
3.24
3.
38
8.31
E-13
8.
24E-
13
7.90
E-13
6.
76E-
09
6.68
E-09
6.
32E-
09
45 -
55
48.6
9 3.
98E+
03
98.8
2 3.
97
4.43
4.
51
3.72
E-13
3.
33E-
13
3.27
E-13
2.
28E-
09
1.97
E-09
1.
92E-
09
46 -
59
52.6
5 4.
57E+
03
94.3
2 3.
07
3.41
3.
31
6.67
E-13
6.
01E-
13
6.20
E-13
5.
03E-
09
4.36
E-09
4.
55E-
09
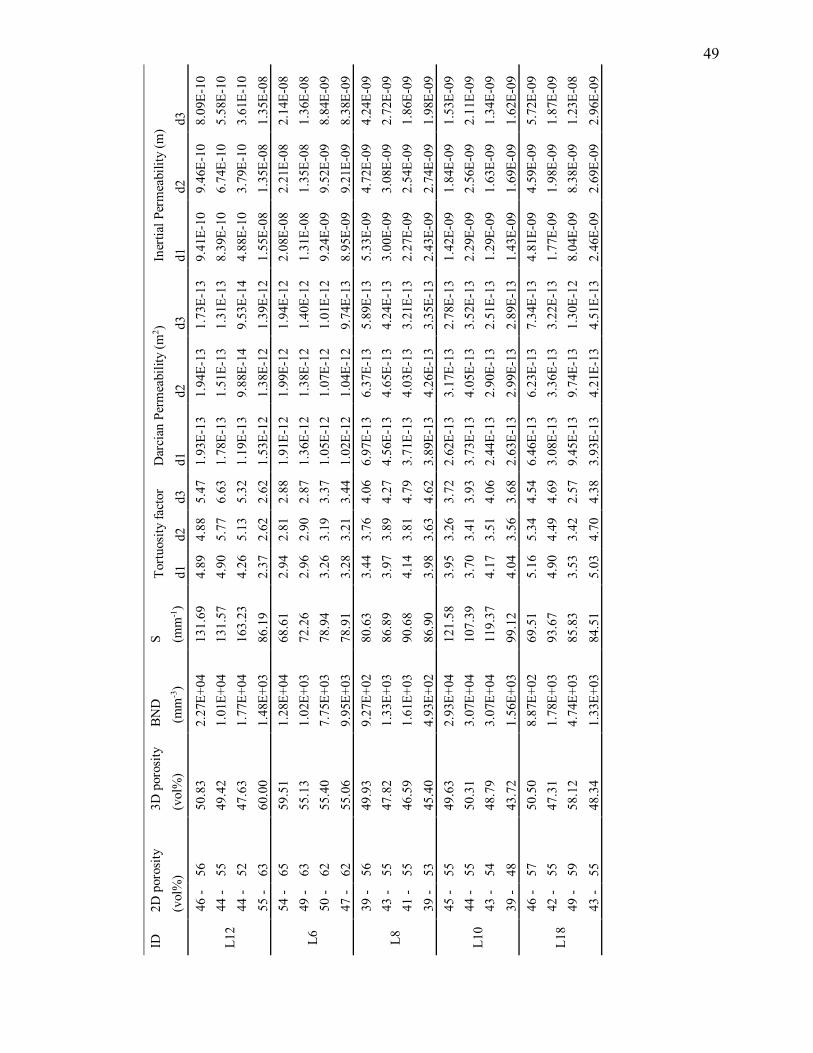
49
ID
2D p
oros
ity
3D p
oros
ity
BND
S
Tortu
osity
fact
or
Dar
cian
Per
mea
bilit
y (m
2 ) In
ertia
l Per
mea
bilit
y (m
) (v
ol%
) (v
ol%
) (m
m-3
) (m
m-1
) d1
d2
d3
d1
d2
d3
d1
d2
d3
L12
46 -
56
50.8
3 2.
27E+
04
131.
69
4.89
4.
88
5.47
1.
93E-
13
1.94
E-13
1.
73E-
13
9.41
E-10
9.
46E-
10
8.09
E-10
44
- 55
49
.42
1.01
E+04
13
1.57
4.
90
5.77
6.
63
1.78
E-13
1.
51E-
13
1.31
E-13
8.
39E-
10
6.74
E-10
5.
58E-
10
44 -
52
47.6
3 1.
77E+
04
163.
23
4.26
5.
13
5.32
1.
19E-
13
9.88
E-14
9.
53E-
14
4.88
E-10
3.
79E-
10
3.61
E-10
55
- 63
60
.00
1.48
E+03
86
.19
2.37
2.
62
2.62
1.
53E-
12
1.38
E-12
1.
39E-
12
1.55
E-08
1.
35E-
08
1.35
E-08
L6
54 -
65
59.5
1 1.
28E+
04
68.6
1 2.
94
2.81
2.
88
1.91
E-12
1.
99E-
12
1.94
E-12
2.
08E-
08
2.21
E-08
2.
14E-
08
49 -
63
55.1
3 1.
02E+
03
72.2
6 2.
96
2.90
2.
87
1.36
E-12
1.
38E-
12
1.40
E-12
1.
31E-
08
1.35
E-08
1.
36E-
08
50 -
62
55.4
0 7.
75E+
03
78.9
4 3.
26
3.19
3.
37
1.05
E-12
1.
07E-
12
1.01
E-12
9.
24E-
09
9.52
E-09
8.
84E-
09
47 -
62
55.0
6 9.
95E+
03
78.9
1 3.
28
3.21
3.
44
1.02
E-12
1.
04E-
12
9.74
E-13
8.
95E-
09
9.21
E-09
8.
38E-
09
L8
39 -
56
49.9
3 9.
27E+
02
80.6
3 3.
44
3.76
4.
06
6.97
E-13
6.
37E-
13
5.89
E-13
5.
33E-
09
4.72
E-09
4.
24E-
09
43 -
55
47.8
2 1.
33E+
03
86.8
9 3.
97
3.89
4.
27
4.56
E-13
4.
65E-
13
4.24
E-13
3.
00E-
09
3.08
E-09
2.
72E-
09
41 -
55
46.5
9 1.
61E+
03
90.6
8 4.
14
3.81
4.
79
3.71
E-13
4.
03E-
13
3.21
E-13
2.
27E-
09
2.54
E-09
1.
86E-
09
39 -
53
45.4
0 4.
93E+
02
86.9
0 3.
98
3.63
4.
62
3.89
E-13
4.
26E-
13
3.35
E-13
2.
43E-
09
2.74
E-09
1.
98E-
09
L10
45 -
55
49.6
3 2.
93E+
04
121.
58
3.95
3.
26
3.72
2.
62E-
13
3.17
E-13
2.
78E-
13
1.42
E-09
1.
84E-
09
1.53
E-09
44
- 55
50
.31
3.07
E+04
10
7.39
3.
70
3.41
3.
93
3.73
E-13
4.
05E-
13
3.52
E-13
2.
29E-
09
2.56
E-09
2.
11E-
09
43 -
54
48.7
9 3.
07E+
04
119.
37
4.17
3.
51
4.06
2.
44E-
13
2.90
E-13
2.
51E-
13
1.29
E-09
1.
63E-
09
1.34
E-09
39
- 48
43
.72
1.56
E+03
99
.12
4.04
3.
56
3.68
2.
63E-
13
2.99
E-13
2.
89E-
13
1.43
E-09
1.
69E-
09
1.62
E-09
L18
46 -
57
50.5
0 8.
87E+
02
69.5
1 5.
16
5.34
4.
54
6.46
E-13
6.
23E-
13
7.34
E-13
4.
81E-
09
4.59
E-09
5.
72E-
09
42 -
55
47.3
1 1.
78E+
03
93.6
7 4.
90
4.49
4.
69
3.08
E-13
3.
36E-
13
3.22
E-13
1.
77E-
09
1.98
E-09
1.
87E-
09
49 -
59
58.1
2 4.
74E+
03
85.8
3 3.
53
3.42
2.
57
9.45
E-13
9.
74E-
13
1.30
E-12
8.
04E-
09
8.38
E-09
1.
23E-
08
43 -
55
48.3
4 1.
33E+
03
84.5
1 5.
03
4.70
4.
38
3.93
E-13
4.
21E-
13
4.51
E-13
2.
46E-
09
2.69
E-09
2.
96E-
09
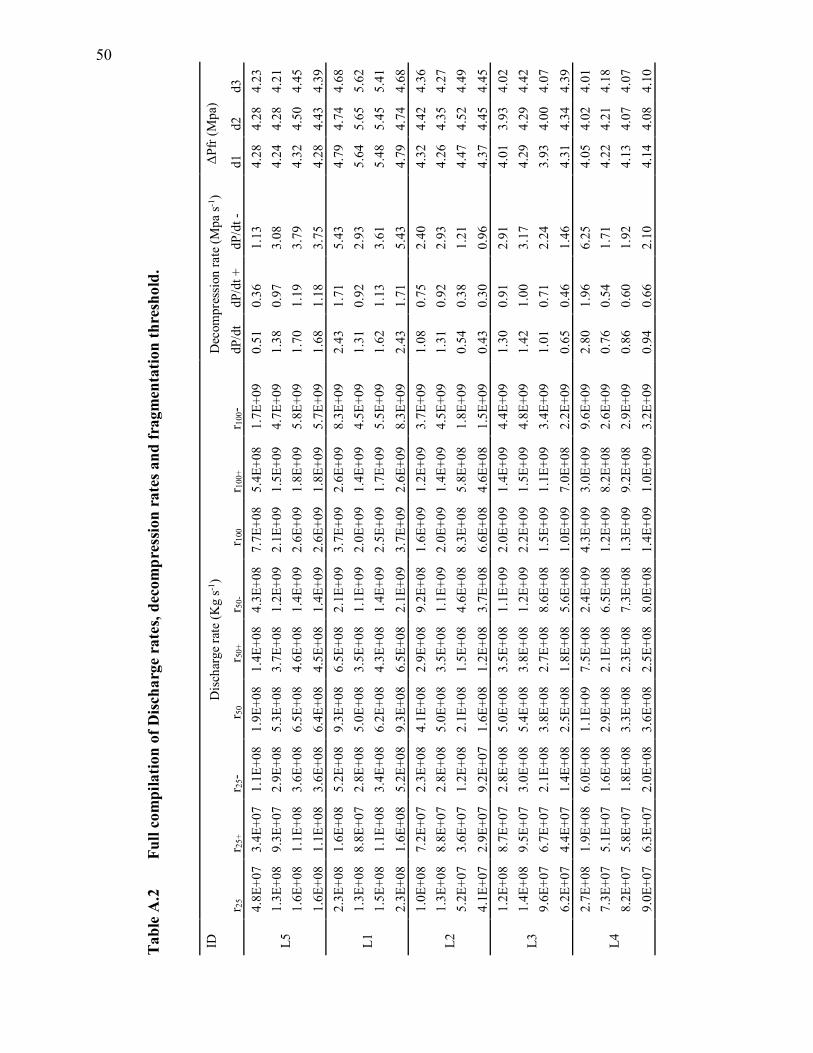
50
Tabl
e A
.2
Full
com
pila
tion
of D
ischa
rge
rate
s, de
com
pres
sion
rate
s and
frag
men
tatio
n th
resh
old.
ID
Dis
char
ge ra
te (K
g s-1
) D
ecom
pres
sion
rate
(Mpa
s-1)
ΔPf
r (M
pa)
r 25
r 25+
r 2
5- r
50
r50
+ r 5
0-
r10
0 r 1
00+
r 100
- dP
/dt
dP/d
t +
dP/d
t -
d1
d2
d3
L5
4.8E
+07
3.4E
+07
1.1E
+08
1.9E
+08
1.4E
+08
4.3E
+08
7.7E
+08
5.4E
+08
1.7E
+09
0.51
0.
36
1.13
4.
28
4.28
4.
23
1.3E
+08
9.3E
+07
2.9E
+08
5.3E
+08
3.7E
+08
1.2E
+09
2.1E
+09
1.5E
+09
4.7E
+09
1.38
0.
97
3.08
4.
24
4.28
4.
21
1.6E
+08
1.1E
+08
3.6E
+08
6.5E
+08
4.6E
+08
1.4E
+09
2.6E
+09
1.8E
+09
5.8E
+09
1.70
1.
19
3.79
4.
32
4.50
4.
45
1.6E
+08
1.1E
+08
3.6E
+08
6.4E
+08
4.5E
+08
1.4E
+09
2.6E
+09
1.8E
+09
5.7E
+09
1.68
1.
18
3.75
4.
28
4.43
4.
39
L1
2.3E
+08
1.6E
+08
5.2E
+08
9.3E
+08
6.5E
+08
2.1E
+09
3.7E
+09
2.6E
+09
8.3E
+09
2.43
1.
71
5.43
4.
79
4.74
4.
68
1.3E
+08
8.8E
+07
2.8E
+08
5.0E
+08
3.5E
+08
1.1E
+09
2.0E
+09
1.4E
+09
4.5E
+09
1.31
0.
92
2.93
5.
64
5.65
5.
62
1.5E
+08
1.1E
+08
3.4E
+08
6.2E
+08
4.3E
+08
1.4E
+09
2.5E
+09
1.7E
+09
5.5E
+09
1.62
1.
13
3.61
5.
48
5.45
5.
41
2.3E
+08
1.6E
+08
5.2E
+08
9.3E
+08
6.5E
+08
2.1E
+09
3.7E
+09
2.6E
+09
8.3E
+09
2.43
1.
71
5.43
4.
79
4.74
4.
68
L2
1.0E
+08
7.2E
+07
2.3E
+08
4.1E
+08
2.9E
+08
9.2E
+08
1.6E
+09
1.2E
+09
3.7E
+09
1.08
0.
75
2.40
4.
32
4.42
4.
36
1.3E
+08
8.8E
+07
2.8E
+08
5.0E
+08
3.5E
+08
1.1E
+09
2.0E
+09
1.4E
+09
4.5E
+09
1.31
0.
92
2.93
4.
26
4.35
4.
27
5.2E
+07
3.6E
+07
1.2E
+08
2.1E
+08
1.5E
+08
4.6E
+08
8.3E
+08
5.8E
+08
1.8E
+09
0.54
0.
38
1.21
4.
47
4.52
4.
49
4.1E
+07
2.9E
+07
9.2E
+07
1.6E
+08
1.2E
+08
3.7E
+08
6.6E
+08
4.6E
+08
1.5E
+09
0.43
0.
30
0.96
4.
37
4.45
4.
45
L3
1.2E
+08
8.7E
+07
2.8E
+08
5.0E
+08
3.5E
+08
1.1E
+09
2.0E
+09
1.4E
+09
4.4E
+09
1.30
0.
91
2.91
4.
01
3.93
4.
02
1.4E
+08
9.5E
+07
3.0E
+08
5.4E
+08
3.8E
+08
1.2E
+09
2.2E
+09
1.5E
+09
4.8E
+09
1.42
1.
00
3.17
4.
29
4.29
4.
42
9.6E
+07
6.7E
+07
2.1E
+08
3.8E
+08
2.7E
+08
8.6E
+08
1.5E
+09
1.1E
+09
3.4E
+09
1.01
0.
71
2.24
3.
93
4.00
4.
07
6.2E
+07
4.4E
+07
1.4E
+08
2.5E
+08
1.8E
+08
5.6E
+08
1.0E
+09
7.0E
+08
2.2E
+09
0.65
0.
46
1.46
4.
31
4.34
4.
39
L4
2.7E
+08
1.9E
+08
6.0E
+08
1.1E
+09
7.5E
+08
2.4E
+09
4.3E
+09
3.0E
+09
9.6E
+09
2.80
1.
96
6.25
4.
05
4.02
4.
01
7.3E
+07
5.1E
+07
1.6E
+08
2.9E
+08
2.1E
+08
6.5E
+08
1.2E
+09
8.2E
+08
2.6E
+09
0.76
0.
54
1.71
4.
22
4.21
4.
18
8.2E
+07
5.8E
+07
1.8E
+08
3.3E
+08
2.3E
+08
7.3E
+08
1.3E
+09
9.2E
+08
2.9E
+09
0.86
0.
60
1.92
4.
13
4.07
4.
07
9.0E
+07
6.3E
+07
2.0E
+08
3.6E
+08
2.5E
+08
8.0E
+08
1.4E
+09
1.0E
+09
3.2E
+09
0.94
0.
66
2.10
4.
14
4.08
4.
10
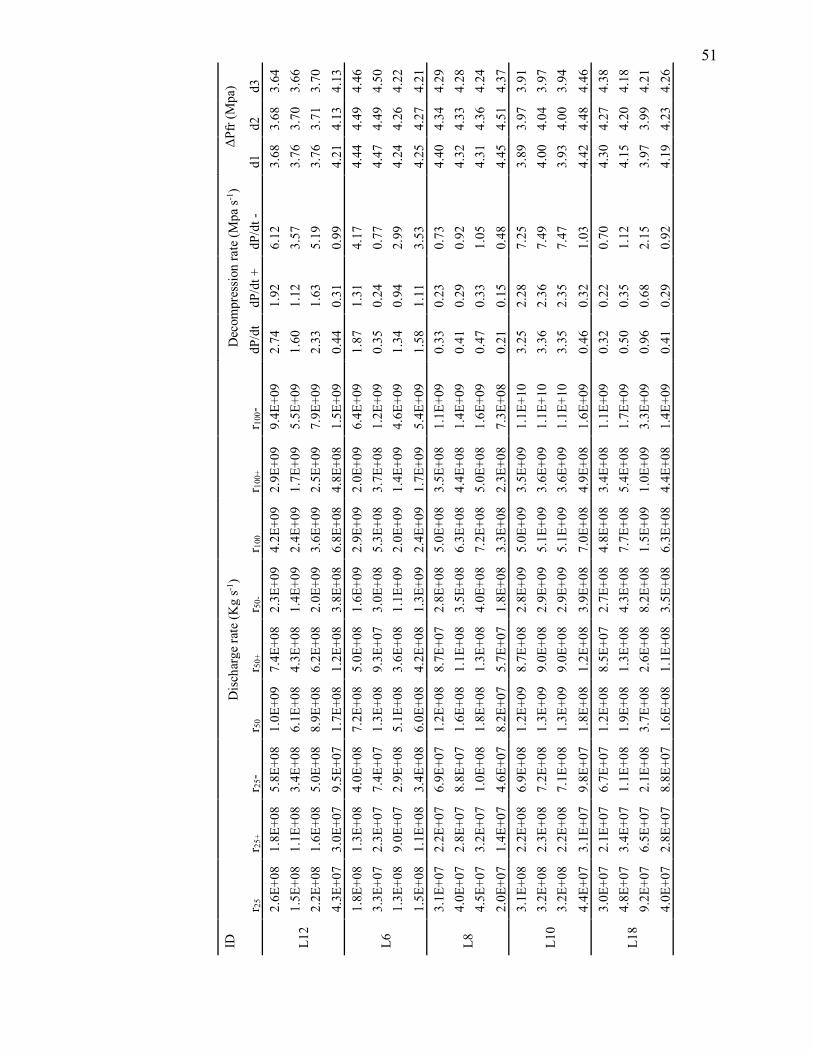
51
ID
Dis
char
ge ra
te (K
g s-1
) D
ecom
pres
sion
rate
(Mpa
s-1)
ΔPf
r (M
pa)
r 25
r 25+
r 2
5- r 5
0 r 5
0+
r 50-
r 1
00
r 100
+ r 1
00-
dP/d
t dP
/dt +
dP
/dt -
d1
d2
d3
L12
2.6E
+08
1.8E
+08
5.8E
+08
1.0E
+09
7.4E
+08
2.3E
+09
4.2E
+09
2.9E
+09
9.4E
+09
2.74
1.
92
6.12
3.
68
3.68
3.
64
1.5E
+08
1.1E
+08
3.4E
+08
6.1E
+08
4.3E
+08
1.4E
+09
2.4E
+09
1.7E
+09
5.5E
+09
1.60
1.
12
3.57
3.
76
3.70
3.
66
2.2E
+08
1.6E
+08
5.0E
+08
8.9E
+08
6.2E
+08
2.0E
+09
3.6E
+09
2.5E
+09
7.9E
+09
2.33
1.
63
5.19
3.
76
3.71
3.
70
4.3E
+07
3.0E
+07
9.5E
+07
1.7E
+08
1.2E
+08
3.8E
+08
6.8E
+08
4.8E
+08
1.5E
+09
0.44
0.
31
0.99
4.
21
4.13
4.
13
L6
1.8E
+08
1.3E
+08
4.0E
+08
7.2E
+08
5.0E
+08
1.6E
+09
2.9E
+09
2.0E
+09
6.4E
+09
1.87
1.
31
4.17
4.
44
4.49
4.
46
3.3E
+07
2.3E
+07
7.4E
+07
1.3E
+08
9.3E
+07
3.0E
+08
5.3E
+08
3.7E
+08
1.2E
+09
0.35
0.
24
0.77
4.
47
4.49
4.
50
1.3E
+08
9.0E
+07
2.9E
+08
5.1E
+08
3.6E
+08
1.1E
+09
2.0E
+09
1.4E
+09
4.6E
+09
1.34
0.
94
2.99
4.
24
4.26
4.
22
1.5E
+08
1.1E
+08
3.4E
+08
6.0E
+08
4.2E
+08
1.3E
+09
2.4E
+09
1.7E
+09
5.4E
+09
1.58
1.
11
3.53
4.
25
4.27
4.
21
L8
3.1E
+07
2.2E
+07
6.9E
+07
1.2E
+08
8.7E
+07
2.8E
+08
5.0E
+08
3.5E
+08
1.1E
+09
0.33
0.
23
0.73
4.
40
4.34
4.
29
4.0E
+07
2.8E
+07
8.8E
+07
1.6E
+08
1.1E
+08
3.5E
+08
6.3E
+08
4.4E
+08
1.4E
+09
0.41
0.
29
0.92
4.
32
4.33
4.
28
4.5E
+07
3.2E
+07
1.0E
+08
1.8E
+08
1.3E
+08
4.0E
+08
7.2E
+08
5.0E
+08
1.6E
+09
0.47
0.
33
1.05
4.
31
4.36
4.
24
2.0E
+07
1.4E
+07
4.6E
+07
8.2E
+07
5.7E
+07
1.8E
+08
3.3E
+08
2.3E
+08
7.3E
+08
0.21
0.
15
0.48
4.
45
4.51
4.
37
L10
3.1E
+08
2.2E
+08
6.9E
+08
1.2E
+09
8.7E
+08
2.8E
+09
5.0E
+09
3.5E
+09
1.1E
+10
3.25
2.
28
7.25
3.
89
3.97
3.
91
3.2E
+08
2.3E
+08
7.2E
+08
1.3E
+09
9.0E
+08
2.9E
+09
5.1E
+09
3.6E
+09
1.1E
+10
3.36
2.
36
7.49
4.
00
4.04
3.
97
3.2E
+08
2.2E
+08
7.1E
+08
1.3E
+09
9.0E
+08
2.9E
+09
5.1E
+09
3.6E
+09
1.1E
+10
3.35
2.
35
7.47
3.
93
4.00
3.
94
4.4E
+07
3.1E
+07
9.8E
+07
1.8E
+08
1.2E
+08
3.9E
+08
7.0E
+08
4.9E
+08
1.6E
+09
0.46
0.
32
1.03
4.
42
4.48
4.
46
L18
3.0E
+07
2.1E
+07
6.7E
+07
1.2E
+08
8.5E
+07
2.7E
+08
4.8E
+08
3.4E
+08
1.1E
+09
0.32
0.
22
0.70
4.
30
4.27
4.
38
4.8E
+07
3.4E
+07
1.1E
+08
1.9E
+08
1.3E
+08
4.3E
+08
7.7E
+08
5.4E
+08
1.7E
+09
0.50
0.
35
1.12
4.
15
4.20
4.
18
9.2E
+07
6.5E
+07
2.1E
+08
3.7E
+08
2.6E
+08
8.2E
+08
1.5E
+09
1.0E
+09
3.3E
+09
0.96
0.
68
2.15
3.
97
3.99
4.
21
4.0E
+07
2.8E
+07
8.8E
+07
1.6E
+08
1.1E
+08
3.5E
+08
6.3E
+08
4.4E
+08
1.4E
+09
0.41
0.
29
0.92
4.
19
4.23
4.
26

52
A.3
Tau
Fact
or r
epor
ts sa
mpl
e fo
r L4