Embed Size (px)
DESCRIPTION
It is not in the tools but in the designing.
Citation preview
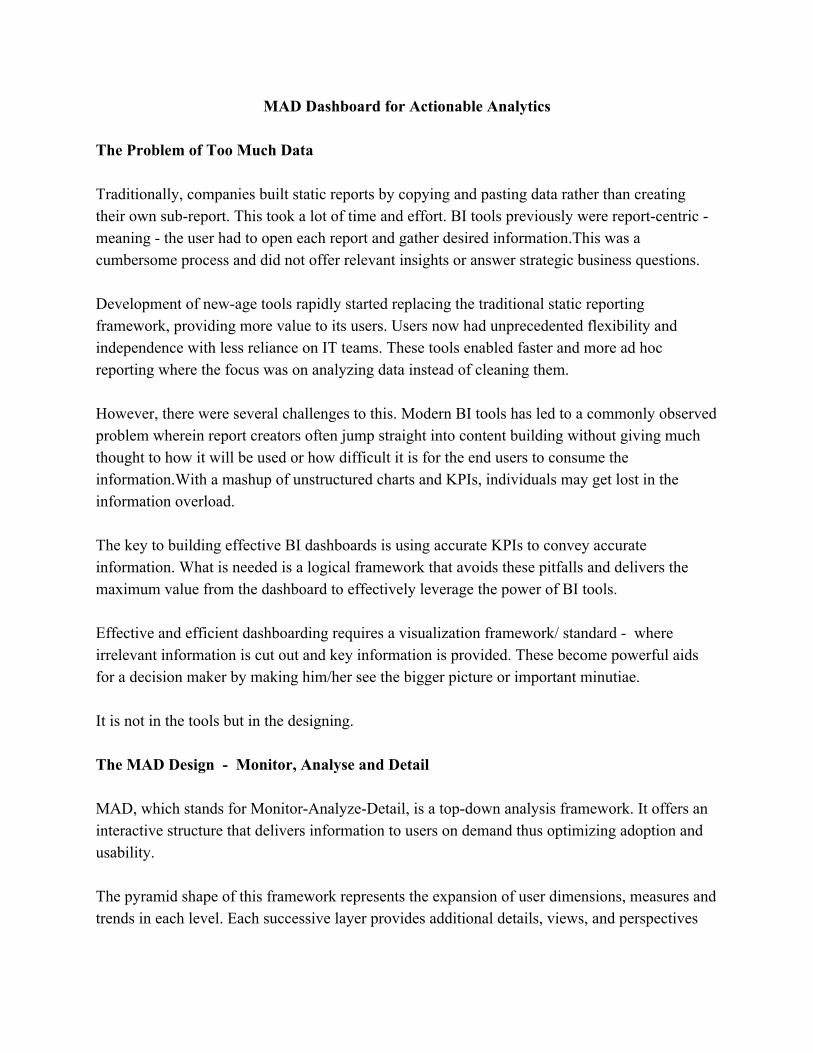
MAD Dashboard for Actionable Analytics The Problem of Too Much Data Traditionally, companies built static reports by copying and pasting data rather than creating their own subreport. This took a lot of time and effort. BI tools previously were reportcentric meaning the user had to open each report and gather desired information.This was a cumbersome process and did not offer relevant insights or answer strategic business questions. Development of newage tools rapidly started replacing the traditional static reporting framework, providing more value to its users. Users now had unprecedented flexibility and independence with less reliance on IT teams. These tools enabled faster and more ad hoc reporting where the focus was on analyzing data instead of cleaning them. However, there were several challenges to this. Modern BI tools has led to a commonly observed problem wherein report creators often jump straight into content building without giving much thought to how it will be used or how difficult it is for the end users to consume the information.With a mashup of unstructured charts and KPIs, individuals may get lost in the information overload. The key to building effective BI dashboards is using accurate KPIs to convey accurate information. What is needed is a logical framework that avoids these pitfalls and delivers the maximum value from the dashboard to effectively leverage the power of BI tools. Effective and efficient dashboarding requires a visualization framework/ standard where irrelevant information is cut out and key information is provided. These become powerful aids for a decision maker by making him/her see the bigger picture or important minutiae. It is not in the tools but in the designing. The MAD Design Monitor, Analyse and Detail MAD, which stands for MonitorAnalyzeDetail, is a topdown analysis framework. It offers an interactive structure that delivers information to users on demand thus optimizing adoption and usability. The pyramid shape of this framework represents the expansion of user dimensions, measures and trends in each level. Each successive layer provides additional details, views, and perspectives
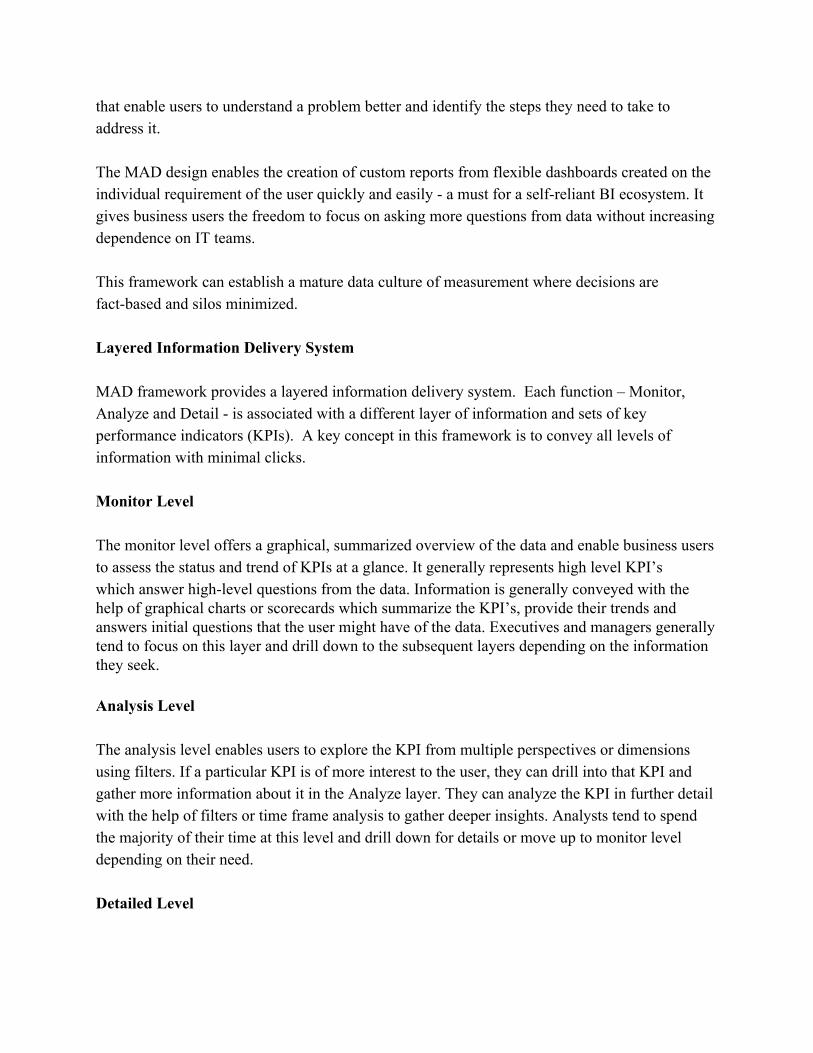
that enable users to understand a problem better and identify the steps they need to take to address it. The MAD design enables the creation of custom reports from flexible dashboards created on the individual requirement of the user quickly and easily a must for a selfreliant BI ecosystem. It gives business users the freedom to focus on asking more questions from data without increasing dependence on IT teams. This framework can establish a mature data culture of measurement where decisions are factbased and silos minimized. Layered Information Delivery System MAD framework provides a layered information delivery system. Each function – Monitor, Analyze and Detail is associated with a different layer of information and sets of key performance indicators (KPIs). A key concept in this framework is to convey all levels of information with minimal clicks. Monitor Level The monitor level offers a graphical, summarized overview of the data and enable business users to assess the status and trend of KPIs at a glance. It generally represents high level KPI’s which answer highlevel questions from the data. Information is generally conveyed with the help of graphical charts or scorecards which summarize the KPI’s, provide their trends and answers initial questions that the user might have of the data. Executives and managers generally tend to focus on this layer and drill down to the subsequent layers depending on the information they seek. Analysis Level The analysis level enables users to explore the KPI from multiple perspectives or dimensions using filters. If a particular KPI is of more interest to the user, they can drill into that KPI and gather more information about it in the Analyze layer. They can analyze the KPI in further detail with the help of filters or time frame analysis to gather deeper insights. Analysts tend to spend the majority of their time at this level and drill down for details or move up to monitor level depending on their need. Detailed Level
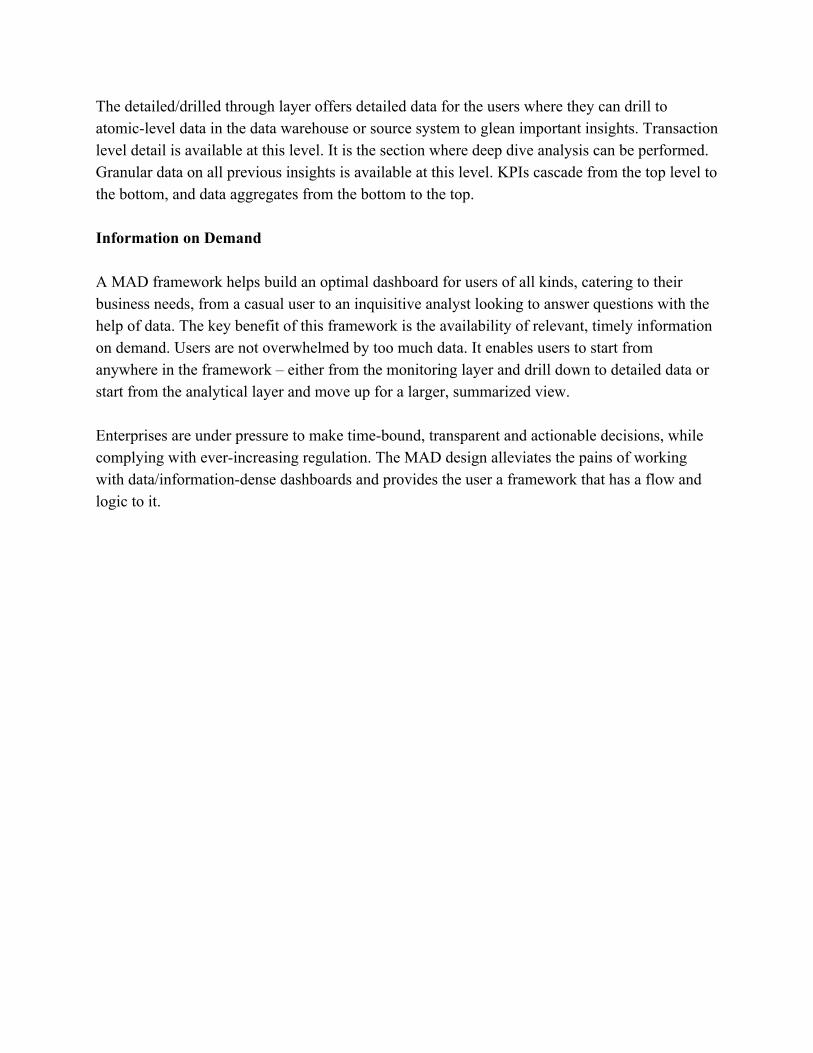
The detailed/drilled through layer offers detailed data for the users where they can drill to atomiclevel data in the data warehouse or source system to glean important insights. Transaction level detail is available at this level. It is the section where deep dive analysis can be performed. Granular data on all previous insights is available at this level. KPIs cascade from the top level to the bottom, and data aggregates from the bottom to the top. Information on Demand A MAD framework helps build an optimal dashboard for users of all kinds, catering to their business needs, from a casual user to an inquisitive analyst looking to answer questions with the help of data. The key benefit of this framework is the availability of relevant, timely information on demand. Users are not overwhelmed by too much data. It enables users to start from anywhere in the framework – either from the monitoring layer and drill down to detailed data or start from the analytical layer and move up for a larger, summarized view. Enterprises are under pressure to make timebound, transparent and actionable decisions, while complying with everincreasing regulation. The MAD design alleviates the pains of working with data/informationdense dashboards and provides the user a framework that has a flow and logic to it.