Embed Size (px)
Citation preview

1
Macroprudential policies and monetary policy: an empirical assessment
Claudio Oliveira de Moraes
Central Bank of Brazil
Candido Mendes University
(Master in Business Economics)
Address: Avenida Presidente Vargas 730
Centro-RJ – Rio de Janeiro – Brazil
CEP: 20071-900
email:[email protected]
Helder Ferreira de Mendonça
Fluminense Federal University
Department of Economics and
National Council for Scientific and Technological
Development (CNPq)
Address: Miguel Pereira – Rio de Janeiro – Brazil
CEP: 26900-000
email: [email protected]
Abstract
Based on an original database of 121 Brazilian banks from March 2001 to June 2015,
this study contributes to understand how monetary policy affects
macroprudential financial institutions-based policies. The findings denote that an
increase in the monetary policy interest rate implies an adjustment in the banks’ strategy
for ensuring the safety and soundness, which, in turn, amplifies the use of
macroprudential financial institutions-based policies. On the other hand, when this
interest rate falls, the instruments for macroprudential financial institutions-
based policies (capital buffer, credit provisions, and leverage) are reduced, which
implies a greater risk for the financial stability. This result suggests the need for
coordination between macroprudential policy and monetary policy.
Key words: macroprudential regulation, financial stability, monetary policy.
Resumo
A partir de uma base de dados de 121 bancos brasileiros no período de março de 2001
até junho de 2015 foi analisado o efeito das taxas de juros da política monetária sobre o
comportamento dos instrumentos macroprudenciais. Os resultados indicam que um
aumento da taxa de juros da política monetária leva os bancos a aumentar o buffer de
capital, as provisões de crédito e a alavancagem bancária (instrumentos
macroprudenciais). Por outro lado, quando há queda das taxas de juros os instrumentos
macroprudenciais são reduzidos, o que implica em um maior risco para a estabilidade
financeira. Este resultado sugere a necessidade da coordenação entre a utilização dos
instrumentos macroprudenciais e a política monetária, principalmente durante os
períodos de baixas taxa de juros.
Palavras-chave: Política Macroprudencial, Estabilidade Financeira e Política
monetária.
JEL classification: E44, E52, E58

2
1. Introduction
In general, central banks have two objectives: price stability and financial
stability. One consequence of the subprime crisis for central bank’s management is the
need to use macroprudential instruments to safeguard the financial system. Nowadays,
an important issue for policymakers is to identify the effects that exist between
monetary policy and macroprudential policy (Cecchetti, 2016). A challenge for central
banks is to see how the conduct of the monetary policy can affect the macroprudential
instruments that are being used to ensure the stability of the financial system (Poloz,
2015; and Smets, 2014).
In order to ensure financial stability, macroprudential policy must be used to
avoid or minimize the procyclicality of banks’ behavior (Claessens, 2015). The
macroprudential instrument that has gained most attention from policymakers is the
countercyclical capital buffer – CCyB (BCBS, 2010; Drehmann, Borio, and Tsatsaronis,
2011). The aim of the use of CCyB is to ensure that commercial banks raise the buffer
when the economy is expanding in order to be used to absorb bank losses in times of
downturn. In addition to CCyB, the countercyclical use of credit provisions (dynamic
provisions) and the limits on leverage has been considered by policymakers as a toolkit
of financial institutions-based policies (Cerutti, Claessens, Laeven, 2017).
This study is a contribution to the literature that analyzes the effect of monetary
policy interest rate on the use of macroprudential financial institutions-based policies. In
order to evaluate this phenomenon it is necessary to consider an economic environment
that combines a developed financial system and that the central bank has the interest
rate as its main instrument of monetary policy. In this context, Brazil has characteristics
that fit in this profile and thus allows an investigation that can be useful for other
economies. The Central Bank of Brazil (CBB) has two mandates: financial stability and
price stability. In order to maintain financial stability, the CBB supervises the operation
of all banks (Brazilian banks’ assets correspond to 180% of GDP - IMF, 2012).
Regarding the search for price stability, the CBB adopts inflation targeting since June
1999 and has the Selic rate (monetary policy interest rate) as its main instrument.
The CBB analyzes economic-financial data provided by commercial banks to
supervise the banks. Based on this information, the CBB discloses, every quarter, the
“economic-financial analysis” report. Hence, such reports represent an essential source
of information for micro and macroprudential analysis. An original database (total 7,000
observations taking into account 121 banks) was built by analyzing the content of the
reports for the period from March 2001 to June 2015. This database extracted from
banks (micro-level data) allows us to evaluate how changes in the CBB’s monetary
policy interest rate affect macroprudential financial institutions-based policies. For this
purpose, several panel data models are used which consider monetary policy interest
rate and specific instruments for macroprudential financial institutions-based policies
(capital buffer, credit provisions, and leverage).
The findings denote that an increase in the monetary policy interest rate implies
an adjustment in the banks’ strategy for ensuring the safety and soundness, which, in
turn, amplifies the use macroprudential financial institutions-based policies. In contrast,
when the central bank reduces the interest rate, banks reduce the use of this kind of
macroprudential tools and thereby decrease the safety of the financial system.

3
Besides this introduction, this paper is organized as follows. Section 2 presents
the data and variables, as well as the models and methods used in this study. Section 3
shows evidence regarding the effect of the monetary policy interest rate on the
macroprudential financial institutions-based policies. Section 4 presents the conclusion.
2. Data and methodology
The effect of monetary policy on the financial system is through the banks’ risk-
taking channel. The risk-taking channel refers to how changes in monetary policy
interest rates affect the banks’ risk perceptions (Borio and Zhu, 2012). Nowadays, in
addition to the risk-taking channel, policymakers are concerned with investigating
whether monetary policy can affect financial stability (Poloz, 2015, Smets, 2014).
Assuming that macroprudential instruments are useful to maintain the financial stability,
this study is a contribution to understand this relashionship.
In order to consider the impact of the conduct of monetary policy on
macroprudential instruments, panel data models are used. The sample consists of 7,000
observations extracted from the balance sheets of 121 banks for the period from March
2001 to June 2015 (58 quarters). Such information is made available from the CBB
through the IF.data system (Selected Information on Supervised Institutions). In order to
carry out this study, three instruments for macroprudential financial institutions-based
policies are considered: capital buffer, credit provisions, and bank leverage.
The capital buffer (BUF) represents the volume of capital higher than the
minimum regulatory requirement held by the banks. The buffer is measured by the
difference between the capital of financial institutions and the minimum capital required
by the regulators (CAR). Therefore, the larger the buffer, the lower the risk of
bankruptcy. On the other hand, in relation to the economic cycle, banks maintain the
buffer on a procyclical path, that is, reduce the buffer in times of economic growth and
increase in times of depression (Stolz and Wedow, 2011). In other words, they amplify
the cycle and thus increase the risk of events of financial instability.
Credit provisions (PROV) represent the coverage that banks maintain to support
probable credit losses. Provisions are measured by the ratio of the coverage for credit
losses provided by the banks to the total credit volume. It is important to highlight that
credit provisions held by banks have a forward-looking characteristic because they
behave according to banks’ expectations in relation to the future business cycle (de
Moraes, Montes and Antunes, 2016; Jiménez and Saurina, 2006). Such as observed for
the case of the capital buffer, the procyclical behavior regarding credit provisions can
represent a threat for the financial stability.
Bank’s leverage (LEV) represents capital to assets ratio. Therefore, it is
calculated by the ratio between the capital and the total assets held by the banks.
Therefore, the higher the LEV the lower the leverage. The behavior of bank’s leverage is
procyclical, that is, leverage increases in times of economic boom and reduces in times
of economic downturn (Adrian and Shin, 2009). As a result of the subprime crisis, the
Basel Committee suggested that central banks should monitor and limit bank’s leverage
in order to reduce their procyclical component (BCBS, 2014).
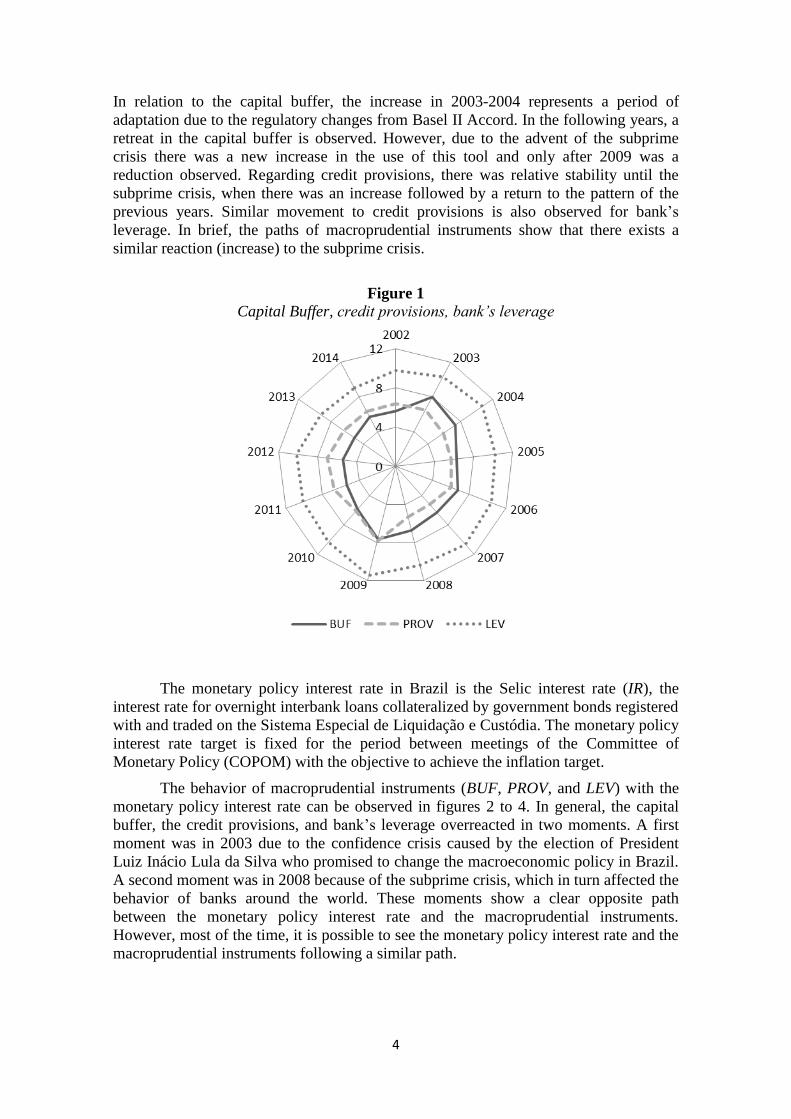
Taking into account the annual average of the financial institutions used in this
study, figure 1 shows the path of macroprudential instruments between 2002 and 2014.
4
In relation to the capital buffer, the increase in 2003-2004 represents a period of
adaptation due to the regulatory changes from Basel II Accord. In the following years, a
retreat in the capital buffer is observed. However, due to the advent of the subprime
crisis there was a new increase in the use of this tool and only after 2009 was a
reduction observed. Regarding credit provisions, there was relative stability until the
subprime crisis, when there was an increase followed by a return to the pattern of the
previous years. Similar movement to credit provisions is also observed for bank’s
leverage. In brief, the paths of macroprudential instruments show that there exists a
similar reaction (increase) to the subprime crisis.
Figure 1
Capital Buffer, credit provisions, bank’s leverage
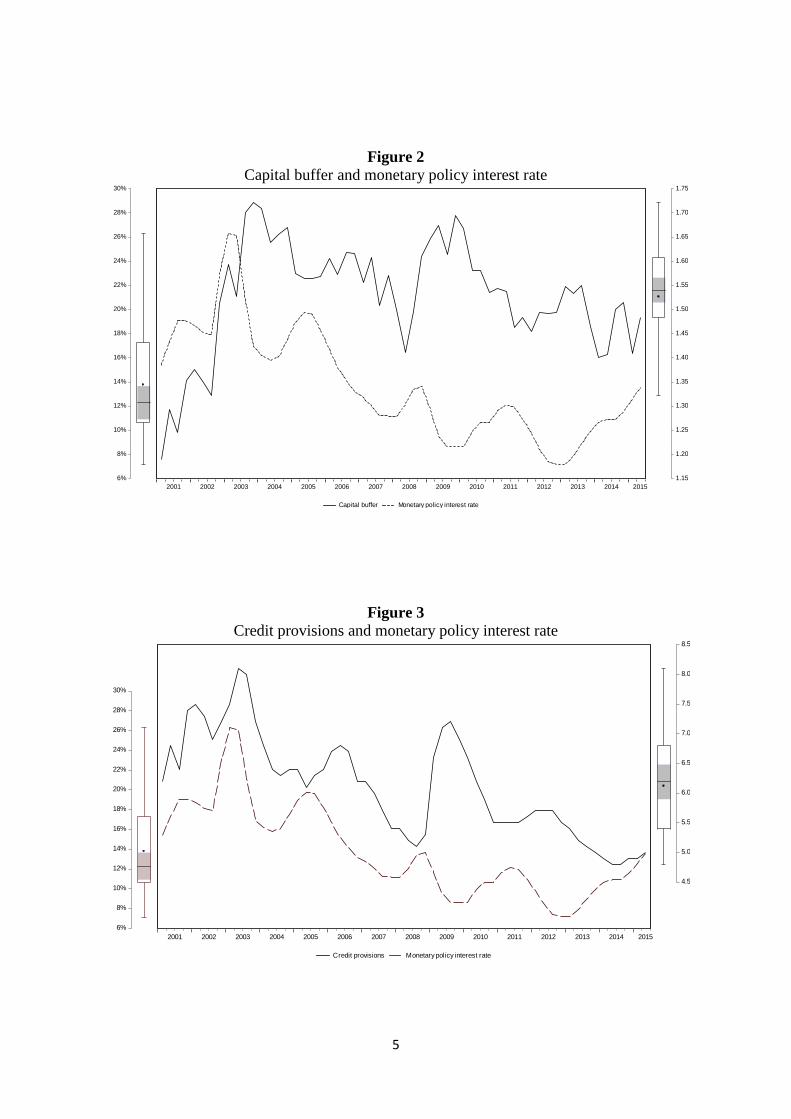
The monetary policy interest rate in Brazil is the Selic interest rate (IR), the
interest rate for overnight interbank loans collateralized by government bonds registered
with and traded on the Sistema Especial de Liquidação e Custódia. The monetary policy
interest rate target is fixed for the period between meetings of the Committee of
Monetary Policy (COPOM) with the objective to achieve the inflation target.
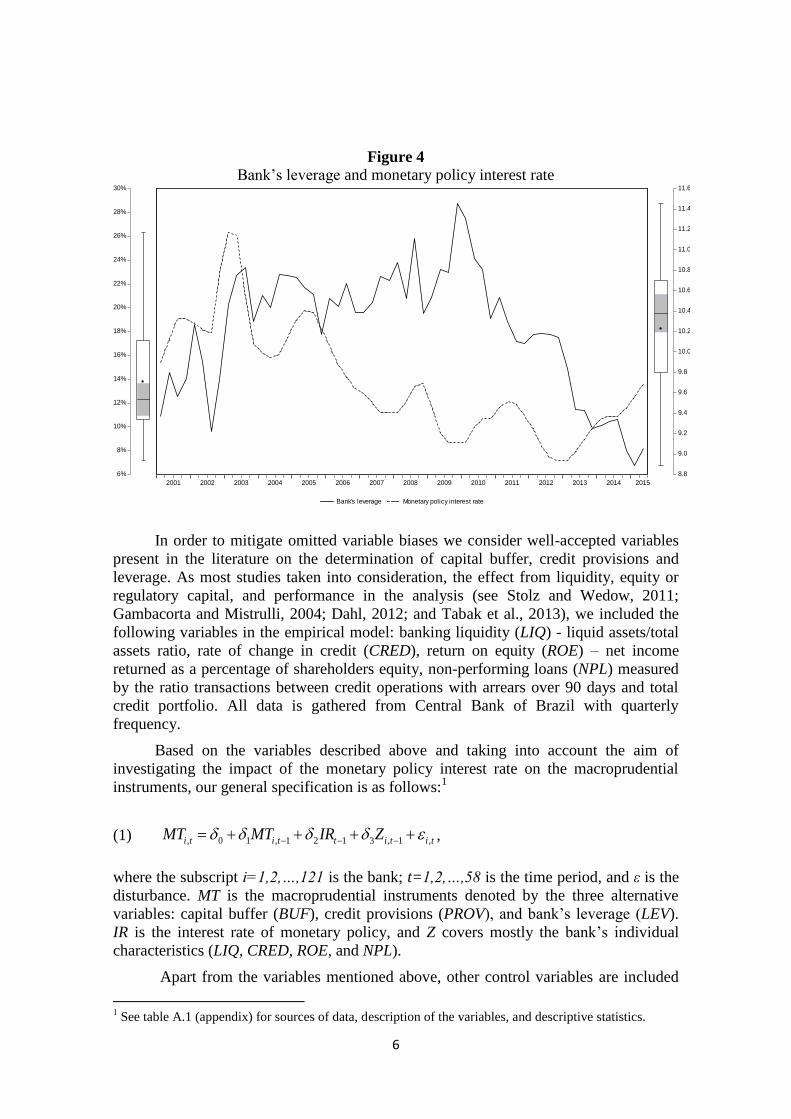
The behavior of macroprudential instruments (BUF, PROV, and LEV) with the
monetary policy interest rate can be observed in figures 2 to 4. In general, the capital
buffer, the credit provisions, and bank’s leverage overreacted in two moments. A first
moment was in 2003 due to the confidence crisis caused by the election of President
Luiz Inácio Lula da Silva who promised to change the macroeconomic policy in Brazil.
A second moment was in 2008 because of the subprime crisis, which in turn affected the
behavior of banks around the world. These moments show a clear opposite path
between the monetary policy interest rate and the macroprudential instruments.
However, most of the time, it is possible to see the monetary policy interest rate and the
macroprudential instruments following a similar path.
5
Figure 2
Capital buffer and monetary policy interest rate
Figure 3
Credit provisions and monetary policy interest rate
6%
8%
10%
12%
14%
16%
18%
20%
22%
24%
26%
28%
30%
4.5
5.0
5.5
6.0
6.5
7.0
7.5
8.0
8.5
2001 2002 2003 2004 2005 2006 2007 2008 2009 2010 2011 2012 2013 2014 2015
Credit provisions Monetary policy interest rate
6%
8%
10%
12%
14%
16%
18%
20%
22%
24%
26%
28%
30%
1.15
1.20
1.25
1.30
1.35
1.40
1.45
1.50
1.55
1.60
1.65
1.70
1.75
2001 2002 2003 2004 2005 2006 2007 2008 2009 2010 2011 2012 2013 2014 2015
Capital buffer Monetary policy interest rate
6
Figure 4
Bank’s leverage and monetary policy interest rate
6%
8%
10%
12%
14%
16%
18%
20%
22%
24%
26%
28%
30%
8.8
9.0
9.2
9.4
9.6
9.8
10.0
10.2
10.4
10.6
10.8
11.0
11.2
11.4
11.6
2001 2002 2003 2004 2005 2006 2007 2008 2009 2010 2011 2012 2013 2014 2015
Bank's leverage Monetary policy interest rate
In order to mitigate omitted variable biases we consider well-accepted variables
present in the literature on the determination of capital buffer, credit provisions and
leverage. As most studies taken into consideration, the effect from liquidity, equity or
regulatory capital, and performance in the analysis (see Stolz and Wedow, 2011;
Gambacorta and Mistrulli, 2004; Dahl, 2012; and Tabak et al., 2013), we included the
following variables in the empirical model: banking liquidity (LIQ) - liquid assets/total
assets ratio, rate of change in credit (CRED), return on equity (ROE) – net income
returned as a percentage of shareholders equity, non-performing loans (NPL) measured
by the ratio transactions between credit operations with arrears over 90 days and total
credit portfolio. All data is gathered from Central Bank of Brazil with quarterly
frequency.
Based on the variables described above and taking into account the aim of
investigating the impact of the monetary policy interest rate on the macroprudential
instruments, our general specification is as follows:1
(1) , 0 1 , 1 2 1 3 , 1 ,t i ti t ii ttMT IR ZMT ,
where the subscript i=1,2,…,121 is the bank; t=1,2,…,58 is the time period, and ε is the
disturbance. MT is the macroprudential instruments denoted by the three alternative
variables: capital buffer (BUF), credit provisions (PROV), and bank’s leverage (LEV).
IR is the interest rate of monetary policy, and Z covers mostly the bank’s individual
characteristics (LIQ, CRED, ROE, and NPL).
Apart from the variables mentioned above, other control variables are included
1 See table A.1 (appendix) for sources of data, description of the variables, and descriptive statistics.

7
in the model in order to consider the possible effect caused by the business cycle, size of
banks, and the subprime crisis on the macroprudential instruments. In this context, the
output gap (GAP), measured as result of the difference between GDP and the potential
output (Hodrick-Prescott filter), is introduced in order to observe the effects from the
business cycle. In the same vein, the size of banks (SIZE) measured by the log of total
banks’ assets is also included in the analysis. At last, in order to consider the effect from
the subprime crisis, a dummy variable (CRISIS) equal to one for the period from the
second quarter 2008 to second quarter 2009 (period which CBB reduced the interest rate
in response to the crisis) and zero otherwise is introduced in the model.
Such as Guidara et.al (2013), and Stolz and Wedow (2011) this study makes use
of dynamic panel data framework through System Generalized Method of Moments (S-
GMM). According to Arellano and Bond (1991), the use of dynamic panel data method
(GMM) is able to eliminate non-observed effects on the regressions and the estimates
are reliable even in the presence of omitted variables. The use of instruments permits
the estimation of parameters more consistently, even in the case of endogeneity in
explanatory variables and in the presence of measurement errors (Bond, Hoeffler, and
Temple, 2001).
The empirical model developed in this study is subject to the above-mentioned
problems. In short, not all explanatory variables of the model are known and
measurable. In addition, the presence of reverse causality is possible, for example, in the
relation between capital buffer and liquidity as well as in the relation between credit
provisions and rate of change in credit. Furthermore, regarding the
endogeneity/simultaneity problem, it is possible that credit provisions affect non-
performing loans.
As a way of mitigating the fact that, for example, first-difference GMM has a
bias (for large and small samples), low accuracy, and the use of lags can generate weak
instruments, Arellano and Bover (1995) and Blundell and Bond (1998) suggest the
introduction of moment conditions. Therefore, S-GMM combines regression equations
in differences and in levels into one system and makes use of lagged differences and
lagged levels as instruments.
Although S-GMM estimation approach is suitable for a small number of time
periods (t) and a large number of cross-sections (i), in the case of small samples, when
the instruments are too many, they tend to over-fit the instrumented variables generating
a bias in the outcomes (Roodman, 2009). Hence, with the intention of avoiding the use
of an excessive number of instruments in the regressions, and thus lose the power of
tests, the number of instruments/number of cross-sections ratio considered in each
regression is less than 1 (de Mendonça and Barcelos, 2015). Furthermore, in order to
observe the validity of the instruments in the models, the test of over-identifying
restrictions (J-test) is performed as suggested by Arellano (2003). Moreover, tests of
first-order (AR1) and second-order (AR2) serial correlation are also performed.
Taking into account the baseline model, we extend our analysis providing new
empirical evidence regarding the effect of the monetary policy interest rate on the
macroprudential instruments through a Panel Structural Vector Autoregressive approach
(panel S-VAR).
(2) 0 0 1 1 0
, 0 , , 0 , 1 ,
1 1
p p
i t n i t n n i t n i t i t
n n
MT MT IR Z
where: n=1,2,…, p (order); 0
0 and 1
0 are constant terms; and 0
0 is the innovation term

8
(impulse or shocks).
Although, a VAR model allows one to see how each variable in the model
responds to itself and others, the focus of this analysis in on how an impulse transmitted
by monetary policy interest rate affects the macroprudential instruments over time. In
general, the dynamic analysis of VAR is made through impulse response functions.
Thus graphs which show the response of BUF, PROV, and LEV to IR with a horizon of
five years (twenty quarters) are presented. The errors are orthogonalized by Cholesky
decomposition, which in turn implies that the ordination of the variables in the model is
important for impulse-response analysis (see Enders, 2015). Following the presentation
of the variables in equation 1 and based on Akaike (AIC), Schwarz (SIC), and Hannan-
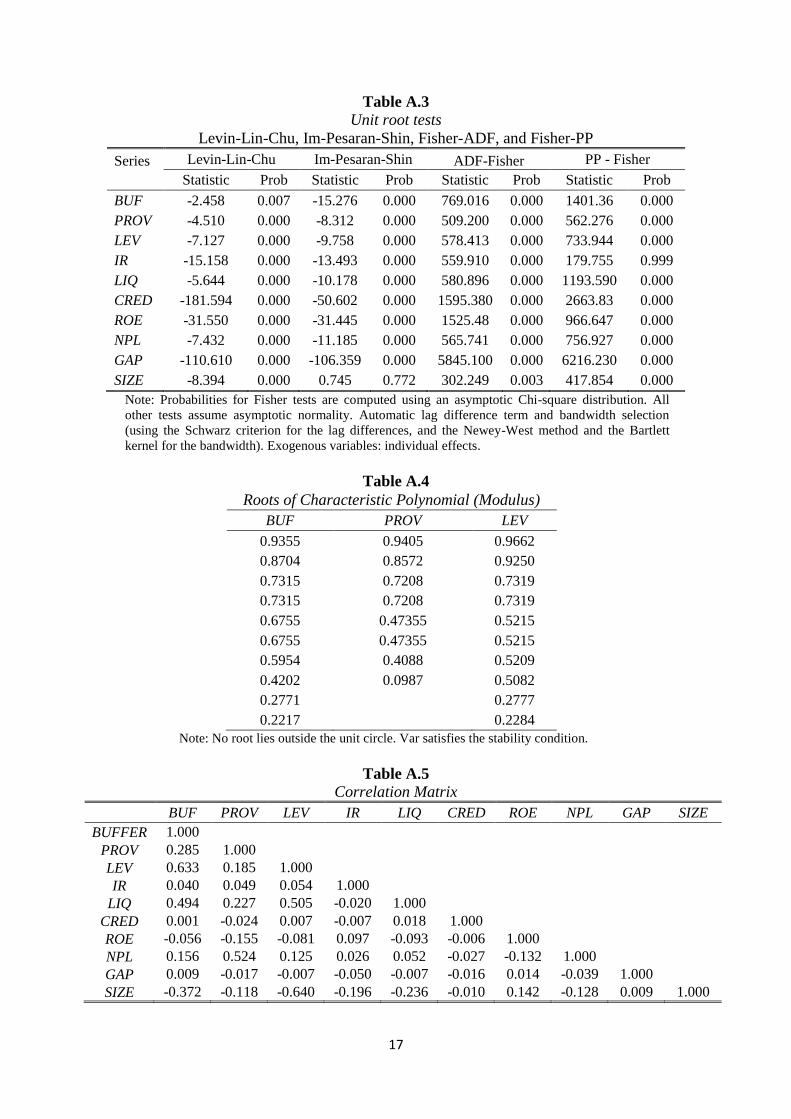
Quinn (HQ) criteria, the VAR order is defined (see table A.2 - appendix).2 Furthermore,
it is noteworthy to highlight that all roots in models have modulus less than one and lie
inside the unit circle and thus impulse response and standard errors are valid (see table
A.4 – appendix).
3. Estimation results
With the objective of observing the relation between the variables used in the
models regarding monetary policy interest rate and macroprudential instruments, the
correlation matrix is presented in table A.5 (see appendix). In particular, we can observe
that the positive correlation between IR and BUF, PROV, and LEV (macroprudential
instruments) suggests that a restrictive monetary policy induces banks to increase the
security of the financial system. On the other hand, a reduction in the interest rate may
lead banks to reduce capital buffer, credit provisions and to increase leverage, thereby
reducing the protection of the financial system.
The estimation results for capital buffer, credit provisions, and bank’s leverage,
all of which take into account the effect from the monetary policy interest rate, are
reported in tables 1, 2, and 3, respectively. All regressions accept the null hypothesis in
the J-test and thus the over-identifying restrictions are valid. Furthermore, both serial
autocorrelation tests (AR(1) and AR(2)) do not indicate the presence of serial
autocorrelation.
In general, the results from all models (see tables 1, 2 and 3) reveal statistical
significance for the coefficients regarding monetary policy interest rate. Therefore, we
cannot rule out the effect the monetary policy interest rate has on macroprudential
instruments (BUF, PROV and LEV). The sign of the coefficients denotes that the banks
react to an increase in the interest rates with the amplification of the macroprudential
instruments. This result can be explained by an increase in bank’s risk aversion due to
an expected worsening of the economy’s consequence of the increase in the interest
rate. On the other hand, a reduction in the interest rate increases the bank’s risk appetite,
which in turn implies a reduction of macroprudential instruments and, therefore, a
greater risk for the financial stability.
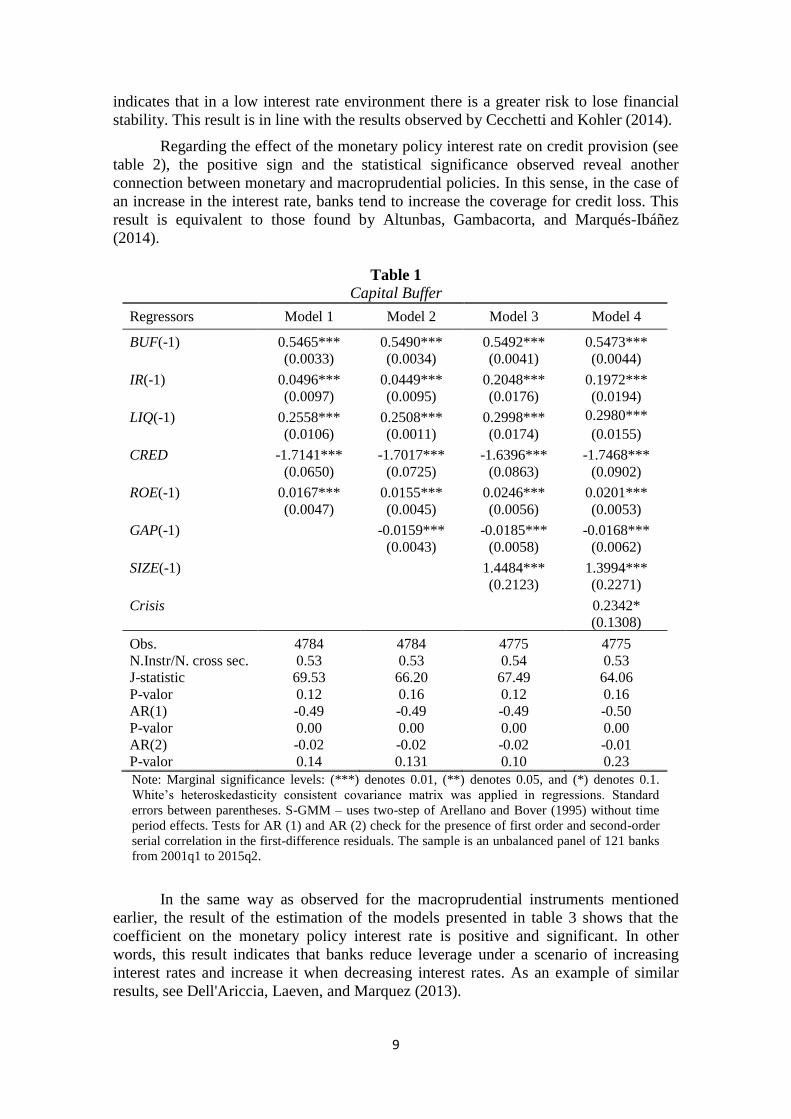
In particular, the increase in the capital buffer due to an increase in the monetary
policy interest rate (see table 1) denotes the concern of the banks to increase their
coverage against bank’s solvency risk (increase in the buffer). On the other hand, a
reduction of the interest rate induces banks to reduce the capital buffer. Hence, this
2 In order to check presence of unit root, the tests Levin-Lin-Chu, Im-Pesaran-Shin, Fisher-ADF, and
Fisher-PP were performed (see table A.3 - appendix). The results do not indicate that the series are non-
stationary.
9
indicates that in a low interest rate environment there is a greater risk to lose financial
stability. This result is in line with the results observed by Cecchetti and Kohler (2014).
Regarding the effect of the monetary policy interest rate on credit provision (see
table 2), the positive sign and the statistical significance observed reveal another
connection between monetary and macroprudential policies. In this sense, in the case of
an increase in the interest rate, banks tend to increase the coverage for credit loss. This
result is equivalent to those found by Altunbas, Gambacorta, and Marqués-Ibáñez
(2014).
Table 1
Capital Buffer
Regressors Model 1 Model 2 Model 3 Model 4
BUF(-1) 0.5465*** 0.5490*** 0.5492*** 0.5473***
(0.0033) (0.0034) (0.0041) (0.0044)
IR(-1) 0.0496*** 0.0449*** 0.2048*** 0.1972***
(0.0097) (0.0095) (0.0176) (0.0194)
LIQ(-1) 0.2558*** 0.2508*** 0.2998*** 0.2980***
(0.0106) (0.0011) (0.0174) (0.0155)
CRED -1.7141*** -1.7017*** -1.6396*** -1.7468***
(0.0650) (0.0725) (0.0863) (0.0902)
ROE(-1) 0.0167*** 0.0155*** 0.0246*** 0.0201***
(0.0047) (0.0045) (0.0056) (0.0053)
GAP(-1)
-0.0159*** -0.0185*** -0.0168***
(0.0043) (0.0058) (0.0062)
SIZE(-1)
1.4484*** 1.3994***
(0.2123) (0.2271)
Crisis
0.2342*
(0.1308)
Obs. 4784 4784 4775 4775
N.Instr/N. cross sec. 0.53 0.53 0.54 0.53
J-statistic 69.53 66.20 67.49 64.06
P-valor 0.12 0.16 0.12 0.16
AR(1) -0.49 -0.49 -0.49 -0.50
P-valor 0.00 0.00 0.00 0.00
AR(2) -0.02 -0.02 -0.02 -0.01
P-valor 0.14 0.131 0.10 0.23
Note: Marginal significance levels: (***) denotes 0.01, (**) denotes 0.05, and (*) denotes 0.1.
White’s heteroskedasticity consistent covariance matrix was applied in regressions. Standard
errors between parentheses. S-GMM – uses two-step of Arellano and Bover (1995) without time
period effects. Tests for AR (1) and AR (2) check for the presence of first order and second-order
serial correlation in the first-difference residuals. The sample is an unbalanced panel of 121 banks
from 2001q1 to 2015q2.
In the same way as observed for the macroprudential instruments mentioned
earlier, the result of the estimation of the models presented in table 3 shows that the
coefficient on the monetary policy interest rate is positive and significant. In other
words, this result indicates that banks reduce leverage under a scenario of increasing
interest rates and increase it when decreasing interest rates. As an example of similar
results, see Dell'Ariccia, Laeven, and Marquez (2013).

10
The buffer, credit provision and leverage’s reaction to monetary policy can be
explained by banks’ forward-looking behavior. When there is an increase in the
monetary policy interest rate, banks expect a deterioration of the economy and thus they
adopt a conservative position (intensify the protection through macroprudential
instruments). On the other hand, when monetary policy interest rate decreases, banks
reduce the security level of macroprudential instruments. The intuition behind these
results corresponding the idea that banks react taking less risk when monetary policy is
tightened and more when it is eased, similar to Jimenez et al. (2014) for least capitalized
banks.
Table 2
Credit provisions
Regressors Model 1 Model 2 Model 3 Model 4
PROV(-1) 0.5345*** 0.5378*** 0.6674*** 0.5514***
(0.0216) (0.0228) (0.0198) (0.0271)
IR(-1) 0.1716*** 0.1764*** 0.2221*** 0.1804***
(0.0433) (0.0410) (0.0405) (0.0452)
LIQ(-1) 0.37663*** 0.3937*** 0.3977*** 0.4773***
(0.0783) (0.0788) (0.0606) (0.0790)
CRED -0.5578*** -0.5450*** -0.5745*** -0.5608***
(0.0174) (0.0187) (0.0170) (0.0176)
NPL(-1) 0.1411*** 0.1145*** 0.0630*** 0.07828**
(0.0168) (0.0164) (0.0178) (0.0208)
GAP(-1)
-0.0922*** -0.1079*** -0.0694***
(0.0163) (0.0162) (0.0159)
SIZE(-1)
1.9672*** 0.7159**
(0.2549) (0.3030)
Crisis
1.1901***
(0.3191)
Obs. 5043 5043 5023 5026
N.Instr/N. cross sec. 0.48 0.48 0.50 0.48
J-statistic 58.64 59.03 57.11 55.91
P-valor 0.21 0.17 0.25 0.20
AR(1) -0.41 -0.40 -0.41 -0.39
P-valor 0.00 0.00 0.00 0.00
AR(2) 0.01 0.01 0.01 0.02
P-valor 0.16 0.29 0.31 0.27
Note: Marginal significance levels: (***) denotes 0.01, (**) denotes 0.05, and (*) denotes 0.1. White’s
heteroskedasticity consistent covariance matrix was applied in regressions. Standard errors between
parentheses. S-GMM – uses two-step of Arellano and Bover (1995) without time period effects. Tests
for AR (1) and AR (2) check for the presence of first order and second-order serial correlation in the
first-difference residuals. The sample is an unbalanced panel of 121 banks from 2001q1 to 2015q2.
In relation to the variables that represent the individual characteristics of the
banks (variable Z - equation 1), the results are in agreement with those observed for
most of the literature on banks. The coefficients on liquidity (LIQ) are positive and
significant in all models, which makes it possible to infer that macroprudential
instruments (BUF, PROV and LEV) are sensitive to liquidity conditions. The more
liquid the banks are, the less risk they assume. In relation to the coefficients related to
the credit growth rate (CRED), it is observed that they are negative and significant. As
11
observed by Jokivuolle, Pesola, and Viren (2015), this result suggests that, for example,
when there is a positive credit variation, capital buffer and leverage are reduced due to
higher bank leverage with respect to credit. Moreover, as observed by Foos, Norden,
and Weber (2010), this result indicates that the higher the provision for credit risk
(PROV), the lower the volume of credit granted to the economy as a whole. In
consonance with de Mendonça and Barcelos (2015), the positive sign and the statistical
significance observed for return on assets (ROE) in the models for capital buffer and for
leverage denote the well-known relationship between risk and return. In the model for
credit provision the statistical significance and the positive sign of the coefficients
related to non-performing loans (NPL) reveal that the higher the default, the greater the
coverage for credit risk.
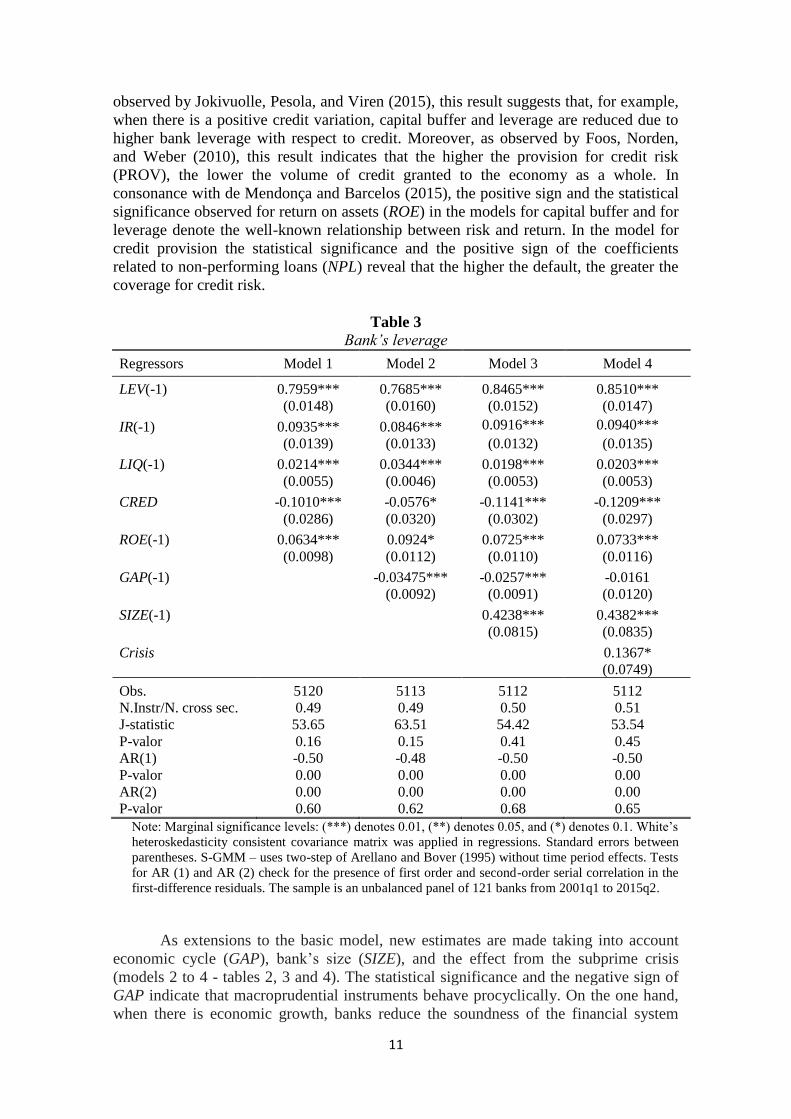
Table 3
Bank’s leverage
Regressors Model 1 Model 2 Model 3 Model 4
LEV(-1) 0.7959*** 0.7685*** 0.8465*** 0.8510***
(0.0148) (0.0160) (0.0152) (0.0147)
IR(-1) 0.0935*** 0.0846*** 0.0916*** 0.0940***
(0.0139) (0.0133) (0.0132) (0.0135)
LIQ(-1) 0.0214*** 0.0344*** 0.0198*** 0.0203***
(0.0055) (0.0046) (0.0053) (0.0053)
CRED -0.1010*** -0.0576* -0.1141*** -0.1209***
(0.0286) (0.0320) (0.0302) (0.0297)
ROE(-1) 0.0634*** 0.0924* 0.0725*** 0.0733***
(0.0098) (0.0112) (0.0110) (0.0116)
GAP(-1)
-0.03475*** -0.0257*** -0.0161
(0.0092) (0.0091) (0.0120)
SIZE(-1)
0.4238*** 0.4382***
(0.0815) (0.0835)
Crisis
0.1367*
(0.0749)
Obs. 5120 5113 5112 5112
N.Instr/N. cross sec. 0.49 0.49 0.50 0.51
J-statistic 53.65 63.51 54.42 53.54
P-valor 0.16 0.15 0.41 0.45
AR(1) -0.50 -0.48 -0.50 -0.50
P-valor 0.00 0.00 0.00 0.00
AR(2) 0.00 0.00 0.00 0.00
P-valor 0.60 0.62 0.68 0.65
Note: Marginal significance levels: (***) denotes 0.01, (**) denotes 0.05, and (*) denotes 0.1. White’s
heteroskedasticity consistent covariance matrix was applied in regressions. Standard errors between
parentheses. S-GMM – uses two-step of Arellano and Bover (1995) without time period effects. Tests
for AR (1) and AR (2) check for the presence of first order and second-order serial correlation in the
first-difference residuals. The sample is an unbalanced panel of 121 banks from 2001q1 to 2015q2.
As extensions to the basic model, new estimates are made taking into account
economic cycle (GAP), bank’s size (SIZE), and the effect from the subprime crisis
(models 2 to 4 - tables 2, 3 and 4). The statistical significance and the negative sign of
GAP indicate that macroprudential instruments behave procyclically. On the one hand,
when there is economic growth, banks reduce the soundness of the financial system

12
through the reduction of macroprudential instruments. On the other hand, when the
economic growth is lower than the potential, banks widen macroprudential instruments
and therefore increase the soundness of the financial system. In brief, countercyclical
regulatory actions are necessary in order to maintain financial stability (BIS 2014,
Murcia and Kohlscheen, 2016). Statistical significance and the positive sign of SIZE
indicate that larger banks tend to maintain larger coverages for risks assumed. One
possible explanation for this result is the fact that large banks have greater access to the
market (equity and debt markets). Finally, the statistical significance and the positive
sign related to the subprime crisis dummy indicate that banks react to financial crises
with greater risk aversion (increase protection through macroprudential instruments).
Extending the analysis regarding the impact of the monetary policy interest rate
on macroprudential instruments, impulse-response functions plotted out to the 20th
quarter from a S-VAR model (see equation 2) are presented. In general, the findings are
in consonance with those observed in tables 2, 3 and 4. In other words, figure 5 shows
that a positive shock transmitted through interest rate provokes an amplification of the
macroprudential instruments which abides over time.
Regarding the capital buffer and leverage, the response to a shock transmitted
through monetary policy interest rate (first and third graphs in figure 5) denotes that
there is statistical significance for an increase in the capital buffer and leverage from 7th
quarter. This is an important observation, because according to the BCBS (2010), the
announcement of an increase in the countercyclical capital buffer (CCyB) takes four
quarters to be effective. The same interpretation is valid for leverage because this
variable is similar to the capital buffer and thus it represents a relation between the
capital and the bank’s assets. The shock transmitted through interest rate to credit
provisions (second graph in figure 5) does not show lag for seeing statistical
significance. A possible justification for this result is that, in a different manner from the
previous instruments, there is no schedule of adjustment for this instrument (time to be
effective).
Figure 5
Responses of macroprudential instruments to monetary policy interest rate innovation
-.15
-.10
-.05
.00
.05
.10
.15
.20
.25
1 2 3 4 5 6 7 8 9 10 11 12 13 14 15 16 17 18 19 20
Response of BUF to Cholesky - One S.D. IR Innovation

13
-.1
.0
.1
.2
.3
.4
.5
.6
1 2 3 4 5 6 7 8 9 10 11 12 13 14 15 16 17 18 19 20
Response of PROV to Cholesky - One S.D. IR Innovation
-.1
.0
.1
.2
.3
.4
.5
.6
.7
1 2 3 4 5 6 7 8 9 10 11 12 13 14 15 16 17 18 19 20
Response of LEV to Cholesky - One S.D. IR Innovation
4. Conclusion
Based on an original database built from balance sheets provided by Central
Bank of Brasil of 121 banks for a whole of 58 quarters (March 2001 to June 2015), this
study investigated empirically the relation between macroprudential policy and
monetary policy. In particular, the effect of the monetary policy interest rate on the
instruments for macroprudential financial institutions-based policies (capital buffer,
credit provisions, and leverage) was analyzed.
The empirical evidence in this study allows one to see that the monetary policy
affects macroprudential instruments. The findings indicate that an increase in the
monetary policy interest rate takes banks to increase capital buffer and credit provisions
and to decrease leverage. A possible explanation for this reaction is the banks’ forward-
looking behavior causing the banks to anticipate a scenario of an increase in the interest
rate. Therefore, when there is an increase in the monetary policy interest rate, banks
expect a deterioration of the economy and thus adopt a conservative position (amplify

14
the protection through macroprudential instruments). On the other hand, a decrease in
the interest rate takes banks to accept more risk, which, in turn, can represent a threat
for the financial stability. In brief, under a scenario of an increase in the interest rate the
financial system becomes more solid. However, when there is a decrease in the interest
rate the system tends to be fragile which, in turn, demands actions from the
macroprudential supervisor.
It is important to highlight that the main objective of the monetary policy is not
to guarantee the financial stability. However, the effects that the monetary policy
interest rate causes on macroprudential instruments cannot be neglected. Therefore, it is
mandatory to aggregate to the macroprudential policy the possibility of interconnection
with the monetary policy in order to guarantee financial stability.
5. References
ADRIAN, T., SHIN, H. S. (2010). “Liquidity and leverage.” Journal of Financial
Intermediation, 19(3), 418-437.
ALTUNBAS, Y., GAMBACORTA, L., MARQUES-IBANEZ, D. (2010). “Bank risk
and monetary policy.” Journal of Financial Stability, 6(3), 121-129.
ARELLANO, M. (2003). “Panel data econometrics.” Oxford University Press.
ARELLANO, M., BOND, S. (1991). “Some Tests of Specification for Panel Data:
Monte Carlo Evidence and an Application to Employment Equations.” Review of
Economic Studies, 58(2), 277-297.
ARELLANO, M., BOVER, O., (1995). “Another Look at the Instrumental Variables
Estimation of Error-components Models.” Journal of Econometrics, 68(1), 29-51.
BANKSCOPE (2015)
BCBS - Basel Committee on Banking Supervision. (2010). “Guidance for national
authorities operating the countercyclical capital buffer.” Basel Committee on
Banking Supervision, Bank for International Settlements.
BCBS - Basel Committee on Banking Supervision. (2014) “Basel III leverage ratio
framework and disclosure requirements.” Basel Committee on Banking
Supervision, Bank for International Settlements.
BLUNDELL, R., BOND, S. (1998). “Initial conditions and moments restrictions in
dynamic panel data models.” Journal of Econometrics, 86(1), 115-143.
BOND, S., HOEFFLER, A., TEMPLE, J. (2001). “GMM Estimation of empirical
growth models.” Economics Papers W21, Economics Group, Nuffield College,
University of Oxford.
BORIO, C., H. ZHU. (2012). “Capital Regulation, Risk-Taking and Monetary Policy: A
Missing Link in the Transmission Mechanism?” Journal of Financial Stability 8(4),
236-251.
CECCHETTI S.G., KOHLER, M. (2014). “When capital adequacy and interest rate
policy are substitutes (And When they are not).” International Journal of Central
Banking, 10(3), 205-231.
CECCHETTI, S. (2016). “On the separation of monetary and prudential policy: how
much of the precrisis consensus remains?” Journal of International Money and
Finance, 66(C), 157-169.
CERUTTI, E., CLAESSENS, S., LAEVEN, L. (2017). “The Use and Effectiveness of
Macroprudential Policies: New Evidence.” Journal of Financial Stability
(forthcoming).
CLAESSENS, S. (2015). “An Overview of Macroprudential Policy Tools.” Annual
Review of Financial Economics, 7(1), 397-422.

15
DAHL, D. (2012). “Coincident correlations of growth and cash flow in banking.”
Journal of Banking and Finance, 36(4), 1139-1143.
DELLʼARICCIA, G., LAEVEN, L., MARQUEZ, R. (2014). “Real interest rates,
leverage, and bank risk-taking.” Journal of Economic Theory, 149(C), 65-99.
de MENDONÇA, H., BARCELOS, V. (2015). "Securitization and credit risk:
Empirical evidence from an emerging economy." North American Journal of
Economics and Finance, 32 (C), 12-28.
de MORAES, C.O., MONTES, G., ANTUNES, J. (2016). “How does capital regulation
react to monetary policy? New evidence on the risk-taking channel.” Economic
Modelling, 56(C), 177-186.
DREHMANN, M., BORIO, C., TSATSARONIS, K. (2011). “Anchoring
countercyclical capital buffers: the role of credit aggregates.” International Journal
of Central Banking, 7(4), 189-240.
ENDERS, W. (2015). Applied Econometric Time Series, 4th Edition.
FOOS, D., NORDEN, L., WEBER, M. (2010). “Loan growth and riskiness of banks.”
Journal of Banking and Finance, 34(12), 2929-2940.
GAMBACORTA, L., MISTRULLI, E. (2004), “Does bank capital affect lending
behavior?" Journal of Financial Intermediation, 13(4), 436-457.
GUIDARA, A., LAI, V.S., SOUMARÉ, I., TCHANA, F.T. (2013). “Banks’ capital
buffer, risk and performance in the Canadian banking system: Impact of business
cycles and regulatory changes.” Journal of Banking and Finance, 37(9), 3373-
3387.
JIMÉNEZ G., SAURINA J. (2006). “Credit Cycles, Credit Risk, and Prudential
Regulation.” International Journal of Central Banking, 2(2), 65-98.
JIMÉNEZ G., STEVEN O., PEYDRÓ J.L., SAURINA J. (2014). “Hazardous times for
monetary policy: What do 23 million loans say about the impact of monetary policy
on credit risk-taking?” Econometrica, 82(2), 463-505.
JOKIVUOLLE, E., PESOLA, J., VIREN, M. (2015). “Why is credit-to-GDP a good
measure for setting countercyclical capital buffer?” Journal of Financial Stability,
18(C), 117-126.
JOKIPII, T., MILNE, A. (2008). “The cyclical behaviour of european bank capital
buffers.” Journal of Banking and Finance 32(8), 1440–1451.
MURCIA, A., KOHLSCHEEN, E. (2016). “Moving in tandem: bank provisioning in
emerging market economies.” BIS Working Papers 548, Bank for International
Settlements.
POLOZ, S. (2015). “Integrating Financial Stability into Monetary Policy.” Business
Economics, 50(4), 200-205.
ROODMAN, D. (2009). “How to do xtabond2: An introduction to difference and
system GMM in Stata.” Stata Journal, 9(1), 86-136.
SMETS, F. (2014). “Financial Stability and Monetary Policy: How Closely
Interlinked?” International Journal of Central Banking, 10(2), 263-300.
STOLZ, S., WEDOW, M. (2005). “Banks’ regulatory capital buffer and the business
cycle: Evidence for german saving and cooperative banks.” Discussion Paper
Series 2: Banking and Financial Studies, 249–264.
STOLZ, S., WEDOW, M. (2011). “Banks' regulatory capital buffer and the business
cycle: Evidence for Germany.” Journal of Financial Stability, 7(2), 98-110.
TABAK, B.M., LAIZ, M.T., CAJUEIRO, D.O., (2013). “Financial stability and
monetary policy – the case of Brazil.” Revista Brasileira de Economia, 67(4), 431-
441.

16
Appendix
Table A.1
Sources of data, description of the variables, and descriptive statistics
Variable description Data source Mean Std. dev. Min Max Obs
BUF
Difference between the
capital of financial
institutions and the
minimum capital required
by regulators (CAR).
IEFA/CBB – devised
by authors 3.29 5.67 -2.38 90.82 5857
PROV
Coverage for credit losses
provided by the banks/ total
credit volume ratio.
IEFA/CBB – devised
by authors 5.82 9.04 0.00 100.00 5642
LEV Capital to assets ratio IEFA/CBB – devised
by authors 25.83 21.16 0.11 173.31 6060
IR Monetary policy interest
rate (SELIC).
CBB, SGS – devised
by authors 13.79 4.56 7.15 26.32 7018
LIQ Liquid assets/total assets
ratio.
IEFA/CBB – devised
by authors 29.95 21.34 0.01 100.00 5882
CRED Credit growth rate. IEFA/CBB – devised
by authors 0.16 4.11 -1.00 255.91 5524
ROE Net income/shareholder’s
equity ratio.
IEFA/CBB – devised
by authors 4.87 14.14 -247.99 138.43 5768
NPL
Credit operations with
arrears over 90 days/total
credit portfolio ratio.
IEFA/CBB – devised
by authors 6.29 8.84 0.00 100.00 5647
GAP
Difference between GDP
and the potential output
(Hodrick-Prescott filter).
TSMS/CBB –
devised by authors -0.04 3.06 -9.88 7.76 7018
SIZE Log of total banks’ assets. IEFA/CBB– devised
by authors 21.04 2.28 14.90 27.70 6052
Note: IEFA/CBB - Information for Economic-Financial Analysis/Central Bank of Brazil, TSMS/CBB –
Time Series Management System.
Table A.2
AIC, SIC, and HQ criteria for VAR
Note: (*) denotes lag order selected by the criterion.
Buffer Prov Lev
Lag
AIC SC HQ
AIC SC HQ
AIC SC HQ
0
11.765 11.781 11.771
12.892 12.908 12.897
14.422 14.438 14.427
1
8.121 8.142 8.128
9.099 9.120 9.106
9.139 9.160 9.147
2
7.690 7.716 7.699
8.657 8.684 8.667
8.689 8.715 8.698
3
7.368 7.400 7.380
8.393 8.425 8.404
8.420 8.452* 8.431
4
7.355 7.392 7.368
8.386* 8.423* 8.399*
8.417 8.454 8.430
5
7.333* 7.376* 7.348*
8.386 8.429 8.401
8.412* 8.455 8.427*
6
7.335 7.382 7.351
8.387 8.435 8.404
8.413 8.461 8.430
17
Table A.3
Unit root tests
Levin-Lin-Chu, Im-Pesaran-Shin, Fisher-ADF, and Fisher-PP
Series Levin-Lin-Chu Im-Pesaran-Shin ADF-Fisher PP - Fisher
Statistic Prob Statistic Prob Statistic Prob Statistic Prob
BUF -2.458 0.007 -15.276 0.000 769.016 0.000 1401.36 0.000
PROV -4.510 0.000 -8.312 0.000 509.200 0.000 562.276 0.000
LEV -7.127 0.000 -9.758 0.000 578.413 0.000 733.944 0.000
IR -15.158 0.000 -13.493 0.000 559.910 0.000 179.755 0.999
LIQ -5.644 0.000 -10.178 0.000 580.896 0.000 1193.590 0.000
CRED -181.594 0.000 -50.602 0.000 1595.380 0.000 2663.83 0.000
ROE -31.550 0.000 -31.445 0.000 1525.48 0.000 966.647 0.000
NPL -7.432 0.000 -11.185 0.000 565.741 0.000 756.927 0.000
GAP -110.610 0.000 -106.359 0.000 5845.100 0.000 6216.230 0.000
SIZE -8.394 0.000 0.745 0.772 302.249 0.003 417.854 0.000
Note: Probabilities for Fisher tests are computed using an asymptotic Chi-square distribution. All
other tests assume asymptotic normality. Automatic lag difference term and bandwidth selection
(using the Schwarz criterion for the lag differences, and the Newey-West method and the Bartlett
kernel for the bandwidth). Exogenous variables: individual effects.
Table A.4
Roots of Characteristic Polynomial (Modulus)
BUF PROV LEV
0.9355 0.9405 0.9662
0.8704 0.8572 0.9250
0.7315 0.7208 0.7319
0.7315 0.7208 0.7319
0.6755 0.47355 0.5215
0.6755 0.47355 0.5215
0.5954 0.4088 0.5209
0.4202 0.0987 0.5082
0.2771
0.2777
0.2217 0.2284
Note: No root lies outside the unit circle. Var satisfies the stability condition.
Table A.5
Correlation Matrix
BUF PROV LEV IR LIQ CRED ROE NPL GAP SIZE
BUFFER 1.000
PROV 0.285 1.000
LEV 0.633 0.185 1.000
IR 0.040 0.049 0.054 1.000
LIQ 0.494 0.227 0.505 -0.020 1.000
CRED 0.001 -0.024 0.007 -0.007 0.018 1.000
ROE -0.056 -0.155 -0.081 0.097 -0.093 -0.006 1.000
NPL 0.156 0.524 0.125 0.026 0.052 -0.027 -0.132 1.000
GAP 0.009 -0.017 -0.007 -0.050 -0.007 -0.016 0.014 -0.039 1.000
SIZE -0.372 -0.118 -0.640 -0.196 -0.236 -0.010 0.142 -0.128 0.009 1.000