Embed Size (px)
Citation preview
ARTICLE
Received 17 Aug 2015 | Accepted 26 Apr 2016 | Published 26 May 2016
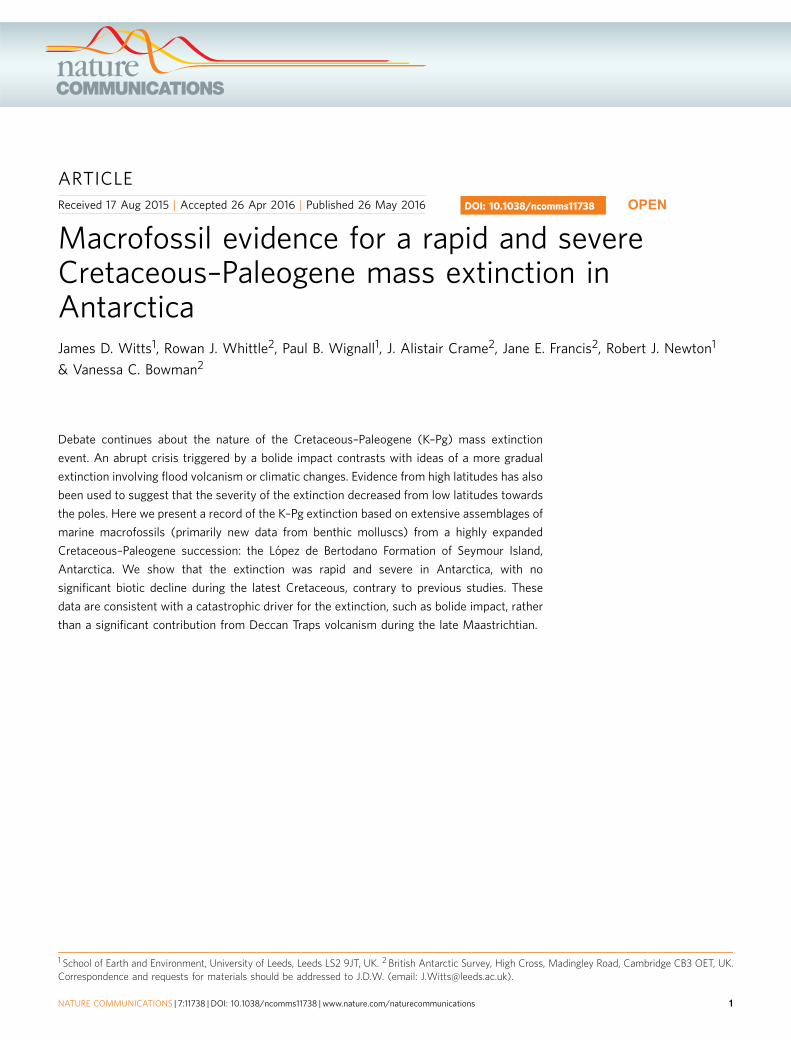
Macrofossil evidence for a rapid and severeCretaceous–Paleogene mass extinction inAntarcticaJames D. Witts1, Rowan J. Whittle2, Paul B. Wignall1, J. Alistair Crame2, Jane E. Francis2, Robert J. Newton1
& Vanessa C. Bowman2
Debate continues about the nature of the Cretaceous–Paleogene (K–Pg) mass extinction
event. An abrupt crisis triggered by a bolide impact contrasts with ideas of a more gradual
extinction involving flood volcanism or climatic changes. Evidence from high latitudes has also
been used to suggest that the severity of the extinction decreased from low latitudes towards
the poles. Here we present a record of the K–Pg extinction based on extensive assemblages of
marine macrofossils (primarily new data from benthic molluscs) from a highly expanded
Cretaceous–Paleogene succession: the Lopez de Bertodano Formation of Seymour Island,
Antarctica. We show that the extinction was rapid and severe in Antarctica, with no
significant biotic decline during the latest Cretaceous, contrary to previous studies. These
data are consistent with a catastrophic driver for the extinction, such as bolide impact, rather
than a significant contribution from Deccan Traps volcanism during the late Maastrichtian.
DOI: 10.1038/ncomms11738 OPEN
1 School of Earth and Environment, University of Leeds, Leeds LS2 9JT, UK. 2 British Antarctic Survey, High Cross, Madingley Road, Cambridge CB3 OET, UK.Correspondence and requests for materials should be addressed to J.D.W. (email: [email protected]).
NATURE COMMUNICATIONS | 7:11738 | DOI: 10.1038/ncomms11738 | www.nature.com/naturecommunications 1
The Cretaceous–Paleogene (K–Pg) mass extinction at66 Ma is the most intensively studied of the‘Big Five’ crises to have affected life during the
Phanerozoic1–8. The extinction led to a fundamentalrestructuring of global ecosystems and the rise of moderntaxonomic groups7,9–11. Despite this interest, debate continues asto the duration of the crisis as well as the relative contributions ofthe bolide impact at Chicxulub1,4, voluminous eruptions fromthe Deccan Traps large igneous province12,13, and dynamicclimate instability during the preceding Maastrichtian stage(72.1–66 Ma)6,14. Parts of this discourse have particularlyfocused on the Antarctic fossil record. Previous studies on highsouthern latitude biotas have claimed the extinction to be either agradual diversity decline15,16, a series of extinction pulses linkedto episodes of Deccan volcanism17 or, for ammonites at least,a single rapid event18. In addition, it has been suggested that theintensity of the extinction and environmental stress varied withlatitude and was related to the proximity of the impact site or thevolcanism (both at mid to low latitudes)19,20. As a result, the highsouthern latitudes are thought to have weathered the crisis betterthan lower latitude regions15,21,22.
The Lopez de Bertodano Formation of southern SeymourIsland, Antarctica (Fig. 1) represents one of the mosthighly expanded onshore Maastrichtian–Danian sedimentarysuccessions in the world with B1,000 m of sedimentation inB4 Myr (refs 17,23,24). At a palaeolatitude of B65� S during thelatest Cretaceous25, this succession represents a true high latituderecord of events during this critical time period. The successionexposed on Seymour Island is dominated by silty-clays with
occasional, thin glauconite-rich sandstone horizons becomingmore prevalent in the uppermost 300 m, along with induratedlayers formed of early diagenetic concretions and thin bioturbatedsands26–28. Despite the lithological homogeneity of thesuccession, several environmental changes have been proposedthat have a bearing on marine biodiversity. The depositionalenvironment of the Lopez de Bertodano Formation isbroadly transgressive; the lower portion has been interpreted asrelatively shallow water, outer estuarine facies28,29, with alow-energy, marine shelf facies forming the remainder of thesuccession27,30.
Here we address these debates on the timing and intensity ofAntarctic marine extinctions with a detailed analysis of marinediversity trends during the Maastrichtian to earliest PaleoceneB70–65.6 Ma (ref. 23) from the Lopez de Bertodano Formation.We evaluate the nature of the K–Pg extinction, its abruptness andintensity in this region. In addition, we test the relationshipbetween palaeoenvironmental changes and diversity, using pyritepetrography as an indicator of palaeoenvironmental conditions.Besides comparisons of existing low-resolution faunal rangecharts with oxygen isotope data as a proxy for marinepalaeotemperature trends17, there have been few previousattempts to relate faunal diversity trends in this succession toother local environmental conditions, for example benthic redoxchanges. We suggest that the K–Pg extinction in Antarctica wasas rapid and severe as that seen at lower latitudes, with noevidence for significant precursor extinction events during thelatest Maastrichtian, which can be related to the onset of Deccanvolcanism or climatic instability.
South America
90°W
WeddellSea
Antarctica
180°
90°E
Indian Ocean
B
A
C
Seymourlsland
Cross valley & La Meseta Fms(Paleocene - Eocene)
Sobral Fm (Paleocene)
Snow Hill lsland Fm(Cretaceous)
BAS sectionlines
López de Bertodano Fm(Cretaceous - Paleocene)
56°45'W
64°15'S
S65°
60°W
65°S
60°W
cJRB
b
a b
c
K-P
g
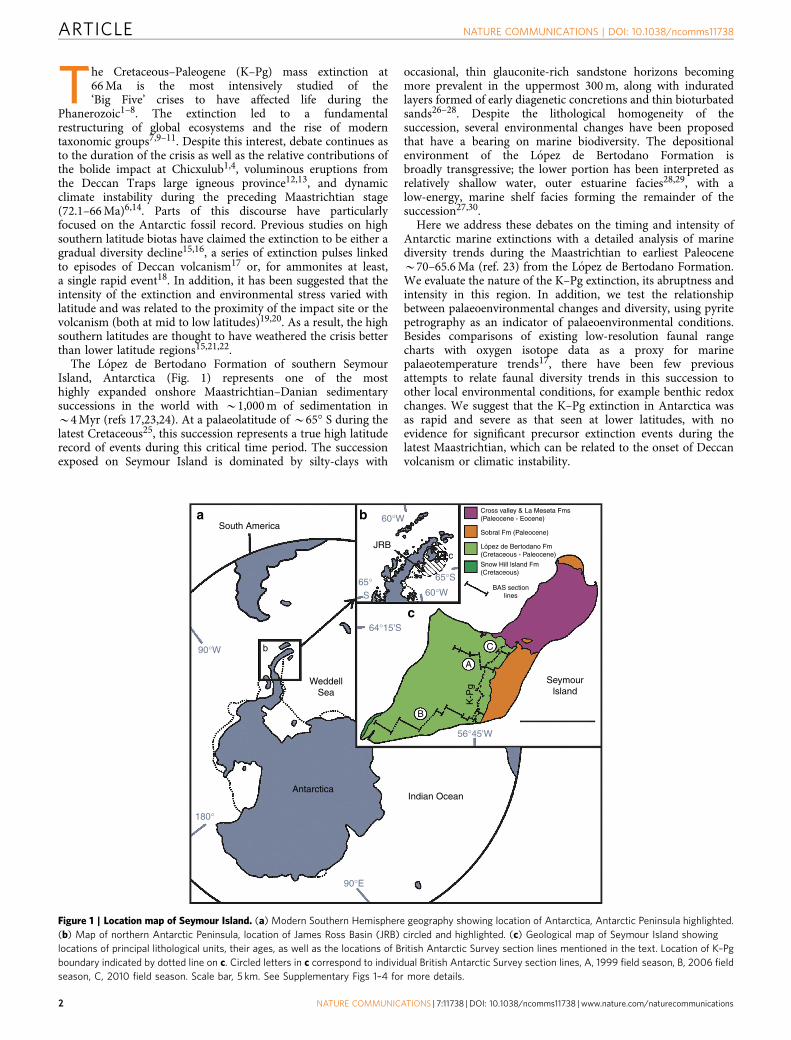
Figure 1 | Location map of Seymour Island. (a) Modern Southern Hemisphere geography showing location of Antarctica, Antarctic Peninsula highlighted.
(b) Map of northern Antarctic Peninsula, location of James Ross Basin (JRB) circled and highlighted. (c) Geological map of Seymour Island showing
locations of principal lithological units, their ages, as well as the locations of British Antarctic Survey section lines mentioned in the text. Location of K–Pg
boundary indicated by dotted line on c. Circled letters in c correspond to individual British Antarctic Survey section lines, A, 1999 field season, B, 2006 field
season, C, 2010 field season. Scale bar, 5 km. See Supplementary Figs 1–4 for more details.
ARTICLE NATURE COMMUNICATIONS | DOI: 10.1038/ncomms11738
2 NATURE COMMUNICATIONS | 7:11738 | DOI: 10.1038/ncomms11738 | www.nature.com/naturecommunications
ResultsFossil evidence for diversity and extinction. The primary datafor this study comprises 46,000 benthic molluscan fossils(bivalves and gastropods) from 377 individual samplingstations accurately located within a series of detailed measuredsedimentary sections through the Lopez de Bertodano Formation(Fig. 1; Supplementary Figs 1–4). Species range charts based onthese collections were combined and compared directly with datafrom nektonic and nekto-benthic cephalopod molluscs from thesame sections18 (Fig. 2) and from previous studies of the K–Pgboundary interval on Seymour Island undertaken by Zinsmeisteret al.16 (Supplementary Fig. 6). The K–Pg boundary onSeymour Island occurs in a 2.5–3-m-thick glauconite-richhorizon 1,007.5 m above the base of our composite section,based on biostratigraphic data from marine palynology24,30,31
(Fig. 2; Supplementary Figs 1–5) and the presence in a parallelsection of the globally recognized iridium (Ir) anomaly used as amarker for the K–Pg boundary30,32 (Fig. 3). Besides an abundantand diverse molluscan fauna, other common faunal elementsfound throughout the Maastrichtian portion of the Lopez deBertodano Formation include serpulid worm tubes (Rotularia),cidaroid echinoid spines, scaphopods, rare solitary corals,decapod crustaceans, marine reptiles, shark vertebrae and fossil
wood bored by Teredolites26,27,33. Recent work has also revealedthe presence of fossil methane seeps, which are periodicallydeveloped on the Maastrichtian sea-floor and are characterized bya distinctive benthic molluscan fauna34.
On the basis of the combined data sets, a total of 44 species and39 genera of benthic molluscs occur within the Maastrichtianportion of the Lopez de Bertodano Formation (Fig. 2) alongwith 15 species and 9 genera of nektonic and nekto-benthiccephalopods18. Focusing on the benthos, a total of 25 out of 37benthic molluscan species (67%) have their last occurrence at orbelow the K–Pg boundary and 15 out of 35 benthic molluscangenera disappear during the Maastrichtian (43%) (excludingthose represented by a single occurrence: 7 species and 4 genera,respectively). Standing species richness based on range-throughdata gives a good approximation of taxonomic diversity, andindicates an overall increase in benthic molluscan diversityup-section from the base of the Lopez de Bertodano Formation,culminating in a maximum of 33 species at 690 m (310 m belowthe K–Pg boundary in our composite section) (Fig. 3a). Manyof the benthic molluscan genera and species present in the Lopezde Bertodano Formation are also known from the underlyingSantonian-early Maastrichtian Santa Marta and Snow Hill Islandformations35–37 (Supplementary Table 1). However, a similar
Agemodel
Lithostratigraphy
1,100
1,000
900
800
700
600
500
400
300
200
100
0 m
C31
RC
31N
C30
NC
29R
Danian
66.0A
67.0
68.0
69.0
C
Maa
stric
htia
nla
te
B
early
Lópe
z de
Ber
toda
no F
orm
atio
n
G
SH
I
G
c si fs ms
SPgK
G
G
G
G
Ois
totr
igon
ia p
ygos
celiu
m (
B)
Leio
nucu
la s
ubob
long
a (B
)N
orde
nskj
oldi
a no
rden
skjo
ldi (
B)
Mar
wic
kial
Cyc
loris
min
a sp
. (B
)P
anop
ea c
laus
a (B
)P
ycno
dont
e (P
hygr
aea)
ves
icul
aris
(B
)E
sela
evitr
igon
ia r
egin
a (B
)C
ucul
laea
ant
arct
ica
(B)
Thr
acia
ask
inae
(B
)“L
ucin
a” s
cotti
(B
)“T
hyas
ira”
tow
nsen
di (
B)
Sol
emya
ros
sian
a (B
)
Fossil ranges in compositeBAS section
Range extentions based ondata from Zinsmeister16
Range-through taxa(supplementary Table 1, ref. 44)
1 2 3 4 5 6 7 8 9 10 11 12 13 14 15 16 17 18 19 20 21 22 23 24 25 26 27 28 29 30 31 32 33 34 35 36 37 38 39 40 41 42 43 44 45 46 47 48 49 50 51 52 53 54 55 56 57 58 59 60 61 62 63 64 65 66 MR
S E R
Aus
troc
ucul
laea
oliv
eroi
(B
)M
odio
lus
cf. p
onto
toce
ncis
(B
)S
eym
ourt
ula
anta
rctic
a (B
)N
eilo
cas
ei (
B)
Lim
opsi
s (L
imop
sis)
ant
arct
ica
(B)
Pin
na fr
enei
xae
(B)
Gon
iom
ya h
yriif
orm
is (
B)
Sur
obul
a nu
cleu
s (B
)D
ozyi
a dr
ygal
skia
na (
B)
Pul
vini
tes
anta
rctic
a (
B)
“Ent
oliu
m”
cf. m
embr
anac
eum
(B
)La
hilli
a la
rsen
i (B
)N
eilo
gra
cilis
(B
)
Sax
oluc
ina
sp. (
B)
Jupi
teria
? sp
. (B
)C
ucul
laea
elli
oti (
B)
Lim
atul
a n.
sp?
(B
)A
cest
a sh
ackl
eton
i (B
)P
helo
pter
ia fe
ldm
anni
(B
)A
cest
a w
ebbi
(B
)
“Van
ikor
opsi
s” a
rkto
wsk
iana
(G
)T
aiom
a ch
arco
tiana
(G
)“C
assi
daria
” m
irabi
lis (
G)
Cry
ptor
hytis
? ph
ilipp
iana
(G
)‘A
mbe
rleya
’ spi
nige
ra (
G)
Aus
troa
porr
hais
sp.
(G
)N
eoga
stro
pod
new
gen
us B
(G
)H
eter
oter
ma
sp. (
G)
Het
erot
ema
sp 2
. (G
)A
cteo
n (T
enui
acte
on)
anta
rctih
adru
m (
G)
Neo
gast
ropo
d ne
w g
enus
A (
G)
Lept
omar
ia a
ntip
oden
sis
(G)
Lept
omar
ia h
ickm
anae
(G
)H
eter
oter
ma
sp 1
. (G
)H
aust
ator
? sp
. (G
)S
trut
hioc
heno
pus
hurle
yi (
G)
Per
isso
dont
a au
ster
ocal
losa
(G
)A
ustr
osph
aera
bul
loid
es (
G)
Lept
omar
ia c
f. se
ymou
riens
is (
G)
Dip
lom
ocer
as c
ylin
drac
eum
(A
)P
seud
ophy
llite
s cf
. lor
yi (
A)
Eut
reph
ocer
as d
orbi
gnya
num
(N
)
Rot
ular
ia s
pp.
Ech
indo
id s
pine
sS
hark
ver
tebr
aeM
arin
e re
ptile
rem
ains
Zel
andi
tes
varu
na (
A)
Pac
hydi
scus
(P
achy
disc
us)
ultim
us (
A)
Pac
hydi
scus
(P
achy
disc
us)
ricca
rdi (
A)
Mao
rites
den
sico
stat
us (
A)
Kitc
hini
tes
laur
ae (
A)
Pac
hydi
scus
(P
achy
disc
us)
cf. ‘
oota
code
nsis
’ (A
)
Mao
rites
tube
rcul
atus
(A
)M
aorit
es s
eym
ouria
nus
(A)
Kitc
hini
tes
sp. (
A)
Mao
rites
cf.
wed
delli
ensi
s (A
)G
ross
ouvr
ites
joha
rae
(A)
Ana
gaud
ryce
ras
seym
ourie
nse
(A)
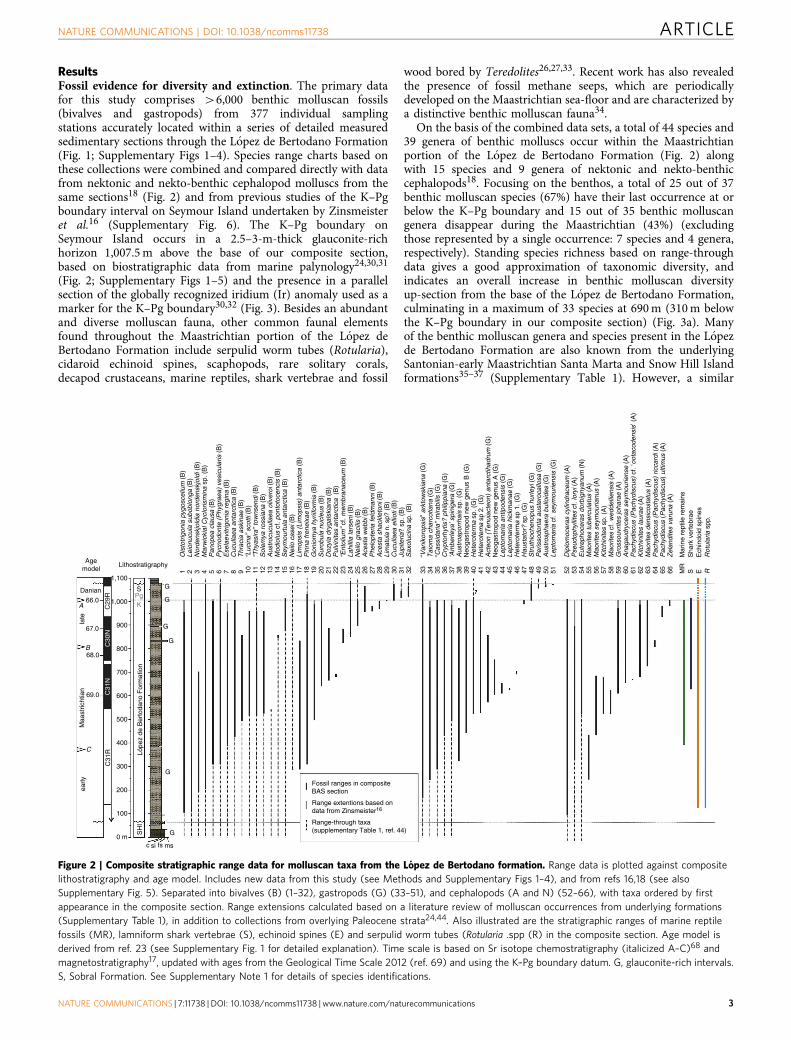
Figure 2 | Composite stratigraphic range data for molluscan taxa from the Lopez de Bertodano formation. Range data is plotted against composite
lithostratigraphy and age model. Includes new data from this study (see Methods and Supplementary Figs 1–4), and from refs 16,18 (see also
Supplementary Fig. 5). Separated into bivalves (B) (1–32), gastropods (G) (33–51), and cephalopods (A and N) (52–66), with taxa ordered by first
appearance in the composite section. Range extensions calculated based on a literature review of molluscan occurrences from underlying formations
(Supplementary Table 1), in addition to collections from overlying Paleocene strata24,44. Also illustrated are the stratigraphic ranges of marine reptile
fossils (MR), lamniform shark vertebrae (S), echinoid spines (E) and serpulid worm tubes (Rotularia .spp (R) in the composite section. Age model is
derived from ref. 23 (see Supplementary Fig. 1 for detailed explanation). Time scale is based on Sr isotope chemostratigraphy (italicized A–C)68 and
magnetostratigraphy17, updated with ages from the Geological Time Scale 2012 (ref. 69) and using the K–Pg boundary datum. G, glauconite-rich intervals.
S, Sobral Formation. See Supplementary Note 1 for details of species identifications.
NATURE COMMUNICATIONS | DOI: 10.1038/ncomms11738 ARTICLE
NATURE COMMUNICATIONS | 7:11738 | DOI: 10.1038/ncomms11738 | www.nature.com/naturecommunications 3
increase in species richness is also seen in the cephalopod faunaduring the same interval18 (Figs 2 and 3), suggesting that thisearly Maastrichtian diversity increase represents a true ecologicalsignal. Rates of turnover (extinction and origination38) generallyremain low throughout the Maastrichtian (Fig. 3b) for benthicmolluscs in particular (Supplementary Fig. 7), with two periods ofslightly elevated extinction rates in the benthos between 850 and890 m, and at 960 m.
Standing species richness of bivalve and gastropod faunasremains stable until a level B40 m below the K–Pg interval(Figs 2 and 3). Above this horizon, there is a slight decline due tothe apparent loss of six species, before a significant extinctionevent between 1,000 and 1,007.5 m in our composite section(that is, the interval directly beneath the K–Pg boundary) where11 benthic species disappear along with all eight remainingspecies and genera of cephalopods18 (Fig. 2; SupplementaryFig. 7). Turnover metrics clearly indicate a significant peak inextinction rate at this level, which is apparent in both a combinedanalysis (Fig. 3a,b) and when data are separated into benthos andnekton (Supplementary Fig. 7). Two bivalve species (Panopeaclausa and Seymourtula antarctica) range into the glauconite-rich
beds in the earliest Paleocene before disappearing, and based onexisting data from Zinsmeister et al.16, another species (Surobulanucleus) also shows this pattern (Supplementary Fig. 6). Thesetaxa are classed as additional victims of the extinction (Fig. 2).Thus combined raw stratigraphic range data suggest the benthicmolluscan community at Seymour Island saw a species-levelextinction of 56% (14 out of 25 species) at the K–Pg event.Local generic level extinction was lower at only 30% (9 out of30 genera), although several genera (Cryptorhytis, Haustator)were extirpated in Antarctica but may have survived the K–Pgevent at lower latitudes10.
These are also likely to be conservative estimates because manyof the taxa that disappear within the Maastrichtian are rareand could therefore be under-sampled with respect to theirtrue stratigraphic range (that is, the ‘Signor-Lipps’ effect)39. Toexamine this phenomenon, we first employed a modified versionof Meldahl’s method40,41 to our combined records (see Methods).Significantly, the majority of the most common molluscs (thosemost likely to give a true picture of their stratigraphic range40)disappear immediately below the K–Pg boundary (Fig. 3c). Thissuggests that the preceding decline is likely due to the apparent
Agemodel Lithostratigraphy
1,100
1,000
900
800
700
600
500
400
300
200
100
0
Danian66.0
67.0
68.0
69.0
Maa
stric
htia
nea
rly
C29
RC
30N
C31
NC
31R
SH
I
G
c si fs ms 0 10 20 30 40
N species
0 0.2 0.4 0.6 0.8 0 10 20
Stratigraphicabundance (%)
Extinctionand
origination
–1 0 1 2
Benthos
Nekton
G
Standingspeciesrichness
G
G
G
G
SPgK
Lópe
z de
Ber
toda
no F
orm
atio
n
Benthos LO
Nekton LO
(4)
(2)
(2)
aMolluscandiversity
bTurnovermetrics
cExtinction
pattern
dPalaeoclimate, LIP Volcanism,
impact events
Coo
l?W
arm
Coo
l,F
luct
uatin
g te
mpe
ratu
res
Coo
l
?
DT
Origination
Extinction
late
δ18O(‰VPDB)
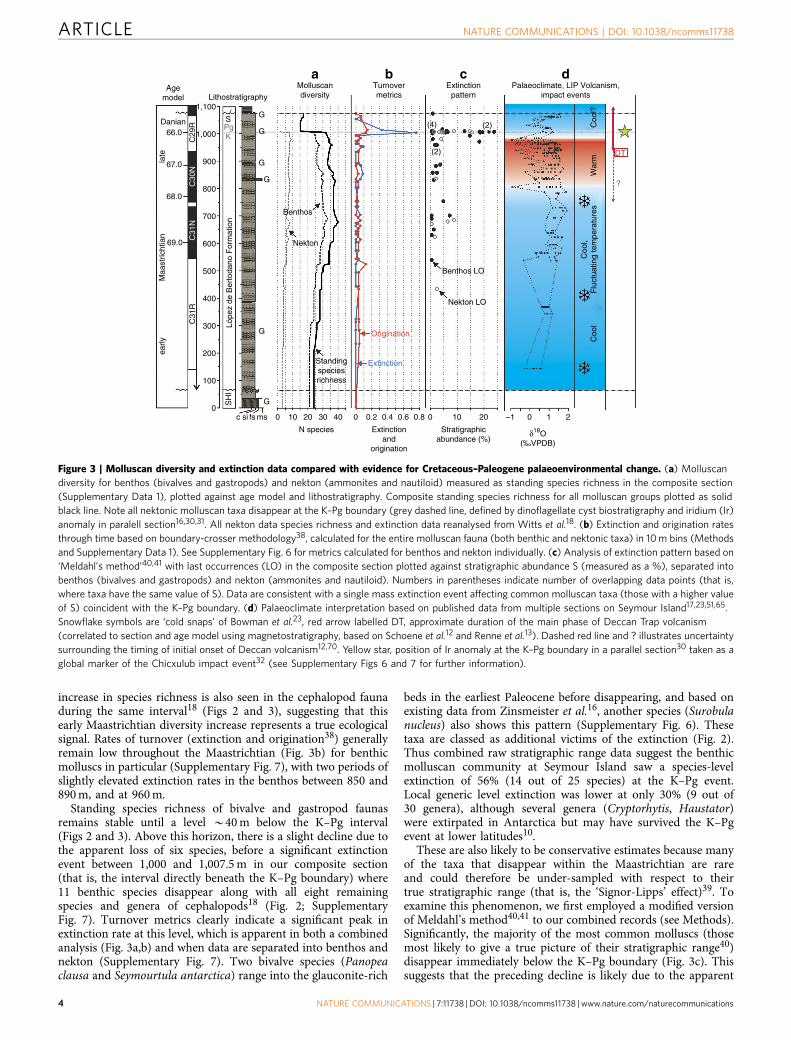
Figure 3 | Molluscan diversity and extinction data compared with evidence for Cretaceous–Paleogene palaeoenvironmental change. (a) Molluscan
diversity for benthos (bivalves and gastropods) and nekton (ammonites and nautiloid) measured as standing species richness in the composite section
(Supplementary Data 1), plotted against age model and lithostratigraphy. Composite standing species richness for all molluscan groups plotted as solid
black line. Note all nektonic molluscan taxa disappear at the K–Pg boundary (grey dashed line, defined by dinoflagellate cyst biostratigraphy and iridium (Ir)
anomaly in paralell section16,30,31. All nekton data species richness and extinction data reanalysed from Witts et al.18. (b) Extinction and origination rates
through time based on boundary-crosser methodology38, calculated for the entire molluscan fauna (both benthic and nektonic taxa) in 10 m bins (Methods
and Supplementary Data 1). See Supplementary Fig. 6 for metrics calculated for benthos and nekton individually. (c) Analysis of extinction pattern based on
‘Meldahl’s method’40,41 with last occurrences (LO) in the composite section plotted against stratigraphic abundance S (measured as a %), separated into
benthos (bivalves and gastropods) and nekton (ammonites and nautiloid). Numbers in parentheses indicate number of overlapping data points (that is,
where taxa have the same value of S). Data are consistent with a single mass extinction event affecting common molluscan taxa (those with a higher value
of S) coincident with the K–Pg boundary. (d) Palaeoclimate interpretation based on published data from multiple sections on Seymour Island17,23,51,65.
Snowflake symbols are ‘cold snaps’ of Bowman et al.23, red arrow labelled DT, approximate duration of the main phase of Deccan Trap volcanism
(correlated to section and age model using magnetostratigraphy, based on Schoene et al.12 and Renne et al.13). Dashed red line and ? illustrates uncertainty
surrounding the timing of initial onset of Deccan volcanism12,70. Yellow star, position of Ir anomaly at the K–Pg boundary in a parallel section30 taken as a
global marker of the Chicxulub impact event32 (see Supplementary Figs 6 and 7 for further information).
ARTICLE NATURE COMMUNICATIONS | DOI: 10.1038/ncomms11738
4 NATURE COMMUNICATIONS | 7:11738 | DOI: 10.1038/ncomms11738 | www.nature.com/naturecommunications
loss of rare taxa, known as ‘backward smearing’39–41. Applicationof confidence intervals to raw range and occurrence data in thetwo longest stratigraphic sections (A and B in Fig. 1c andSupplementary Fig. 1) in the form of range extensions42 supportthis assertion, showing a cluster of both 50 and 95% confidenceintervals around the K–Pg boundary interval outlined above(Supplementary Figs 2 and 3). Only two benthic taxawith a stratigraphic abundance 410 (Austroaporrhais sp. andEselaevitrigonia regina) disappear 410 m below the K–Pgboundary, and only one of these disappearances is close to theinterval identified by Tobin et al.17 as containing a supposedprecursor extinction event (see Supplementary Data 1 for moredetails). Furthermore, extension of their 95% confidence intervalsinto the K–Pg interval in the two BAS section lines suggests thatboth these taxa, plus a further rare species of bivalve (Dozyiadrygalskiana), could be additional victims of extinction in theboundary interval. Assuming this is the case would raise thespecies-level extinction to 61% (17 out of 28) and generic-levelextinction to 36% (12 out of 33).
Directly above the K–Pg boundary a low-diversity molluscanassemblage occurs, dominated by large numbers of the bivalvesLahillia larseni and Cucullaea ellioti, along with the gastropodStruthiochenopus hurleyi27,43. Beds immediately above the Iranomaly level also contain a large number of diageneticconcretions containing articulated and disarticulated fishremains16, the only such horizon in the Seymour Islandsuccession. A total of eight benthic molluscan species rangethrough the K–Pg boundary and occur in the 60-m-thickPaleocene portion of the Lopez de Bertodano Formation. Thisnumber increases to 11 when taxa that disappear in theMaastrichtian but reappear in the overlying Paleocene SobralFormation are included43,44 (Figs 2 and 3; Supplementary Data 1).Origination rates peak in the interval containing the extinctionhorizon and directly above in the earliest Paleocene, and sevenbenthic molluscan species make their first appearances in the 60-mbetween the K–Pg boundary and the base of the Sobral Formation,an interval that represents B350 kyr (refs 17,23,24) with only oneof these taxa disappearing during the same interval (Figs 2 and 3).However, diversity of the molluscan fauna fails to recover to levelsattained during the Maastrichtian.
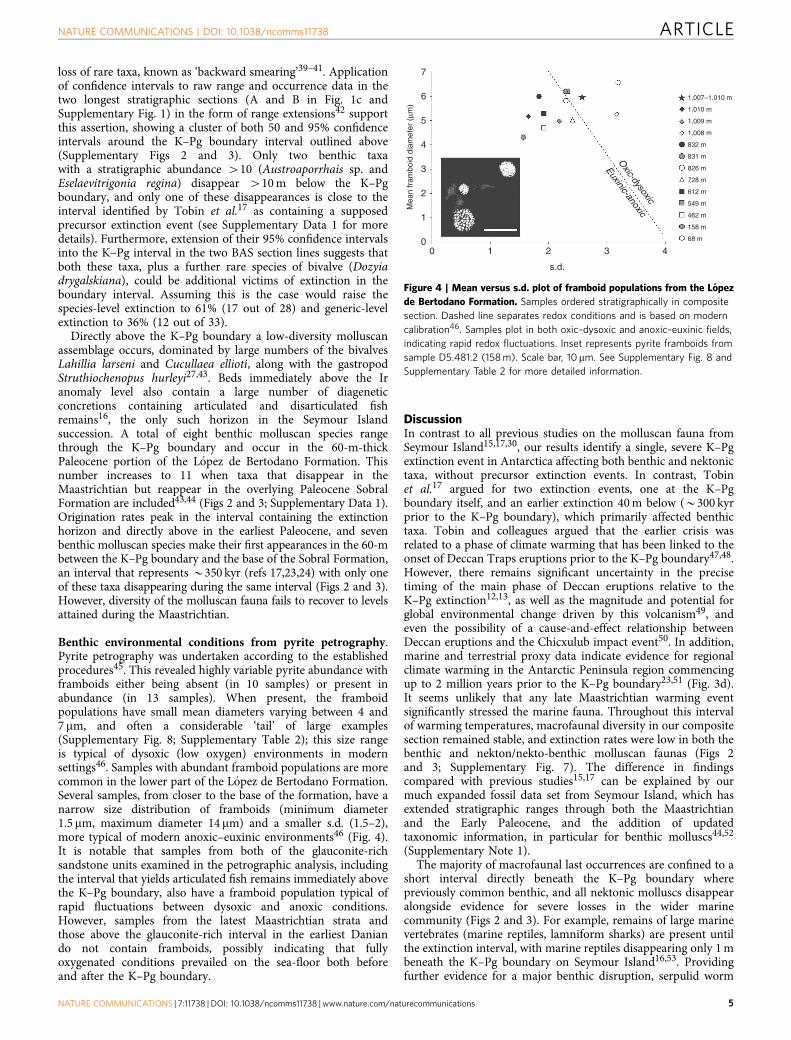
Benthic environmental conditions from pyrite petrography.Pyrite petrography was undertaken according to the establishedprocedures45. This revealed highly variable pyrite abundance withframboids either being absent (in 10 samples) or present inabundance (in 13 samples). When present, the framboidpopulations have small mean diameters varying between 4 and7 mm, and often a considerable ‘tail’ of large examples(Supplementary Fig. 8; Supplementary Table 2); this size rangeis typical of dysoxic (low oxygen) environments in modernsettings46. Samples with abundant framboid populations are morecommon in the lower part of the Lopez de Bertodano Formation.Several samples, from closer to the base of the formation, have anarrow size distribution of framboids (minimum diameter1.5 mm, maximum diameter 14mm) and a smaller s.d. (1.5–2),more typical of modern anoxic–euxinic environments46 (Fig. 4).It is notable that samples from both of the glauconite-richsandstone units examined in the petrographic analysis, includingthe interval that yields articulated fish remains immediately abovethe K–Pg boundary, also have a framboid population typical ofrapid fluctuations between dysoxic and anoxic conditions.However, samples from the latest Maastrichtian strata andthose above the glauconite-rich interval in the earliest Daniando not contain framboids, possibly indicating that fullyoxygenated conditions prevailed on the sea-floor both beforeand after the K–Pg boundary.
DiscussionIn contrast to all previous studies on the molluscan fauna fromSeymour Island15,17,30, our results identify a single, severe K–Pgextinction event in Antarctica affecting both benthic and nektonictaxa, without precursor extinction events. In contrast, Tobinet al.17 argued for two extinction events, one at the K–Pgboundary itself, and an earlier extinction 40 m below (B300 kyrprior to the K–Pg boundary), which primarily affected benthictaxa. Tobin and colleagues argued that the earlier crisis wasrelated to a phase of climate warming that has been linked to theonset of Deccan Traps eruptions prior to the K–Pg boundary47,48.However, there remains significant uncertainty in the precisetiming of the main phase of Deccan eruptions relative to theK–Pg extinction12,13, as well as the magnitude and potential forglobal environmental change driven by this volcanism49, andeven the possibility of a cause-and-effect relationship betweenDeccan eruptions and the Chicxulub impact event50. In addition,marine and terrestrial proxy data indicate evidence for regionalclimate warming in the Antarctic Peninsula region commencingup to 2 million years prior to the K–Pg boundary23,51 (Fig. 3d).It seems unlikely that any late Maastrichtian warming eventsignificantly stressed the marine fauna. Throughout this intervalof warming temperatures, macrofaunal diversity in our compositesection remained stable, and extinction rates were low in both thebenthic and nekton/nekto-benthic molluscan faunas (Figs 2and 3; Supplementary Fig. 7). The difference in findingscompared with previous studies15,17 can be explained by ourmuch expanded fossil data set from Seymour Island, which hasextended stratigraphic ranges through both the Maastrichtianand the Early Paleocene, and the addition of updatedtaxonomic information, in particular for benthic molluscs44,52
(Supplementary Note 1).The majority of macrofaunal last occurrences are confined to a
short interval directly beneath the K–Pg boundary wherepreviously common benthic, and all nektonic molluscs disappearalongside evidence for severe losses in the wider marinecommunity (Figs 2 and 3). For example, remains of large marinevertebrates (marine reptiles, lamniform sharks) are present untilthe extinction interval, with marine reptiles disappearing only 1 mbeneath the K–Pg boundary on Seymour Island16,53. Providingfurther evidence for a major benthic disruption, serpulid worm
7
6
5
4
3
2
1
0
Mea
n fr
ambo
id d
iam
eter
(μm
)
0 1 2 3 4
s.d.
Oxic-dysoxic
Euxinic-anoxic
1,007–1,010 m
1,010 m
1,009 m
1,008 m
832 m
831 m
826 m
728 m
612 m
549 m
462 m
158 m
68 m
Figure 4 | Mean versus s.d. plot of framboid populations from the Lopez
de Bertodano Formation. Samples ordered stratigraphically in composite
section. Dashed line separates redox conditions and is based on modern
calibration46. Samples plot in both oxic–dysoxic and anoxic–euxinic fields,
indicating rapid redox fluctuations. Inset represents pyrite framboids from
sample D5.481.2 (158 m). Scale bar, 10mm. See Supplementary Fig. 8 and
Supplementary Table 2 for more detailed information.
NATURE COMMUNICATIONS | DOI: 10.1038/ncomms11738 ARTICLE
NATURE COMMUNICATIONS | 7:11738 | DOI: 10.1038/ncomms11738 | www.nature.com/naturecommunications 5
tubes (Rotularia spp.) and cidaroid echinoid spines, the mostcommon of all Maastrichtian benthic fossils on Seymour Island,temporarily disappear from the succession at the K–Pgboundary16 (Supplementary Fig. 6), only reappearing in thebasal levels of the Sobral Formation some B350 kyr later (Fig. 2).The record from microfossils is more equivocal. In common withlow latitude sections, dinoflagellate cysts exhibit a turnover oftaxa at the K–Pg boundary on Seymour Island, but show nosignificant extinction events24,30,31, as do diatoms54. This may bedue to the ability to encyst (dinoflagellates) or create restingspores (diatoms) during periods of environmental stress55,56.Cretaceous planktonic and benthic foraminifera also disappearbeneath the K–Pg boundary following a long period of apparentfaunal stability in the Lopez de Bertodano Formation57.Silicoflagellate assemblages show a similar pattern of stasisfollowed by an abrupt turnover coincident with the K–Pgboundary on Seymour Island54.
The 30–43% extinction of bivalves and gastropods at genericlevel on Seymour Island is similar to that seen in other SouthernHemisphere molluscan faunas (for example, 21.7–32.1% inPatagonia10) These values are also comparable to extinctionestimates from Northern Hemisphere K–Pg boundary sections(for example, 30.5% for bivalves and gastropods in the clasticfacies of the Gulf Coast, USA10,58, and 22.5% for bivalves in thechalk facies of Stevns Klint, Denmark10,59). Estimates for themagnitude of the extinction are similar despite significantdifferences in the diversity (in terms of generic richness) ofthese different benthic molluscan faunas from differentpalaeolatitudes10,44,58–60. Our data are thus also in broadagreement with the suggestion made using global databases,albeit analysed at stage level, that there was no latitudinalvariation to the K–Pg losses in these groups60. A latitudinaldiversity gradient provided no protection against mass extinctionfor molluscs at the K–Pg boundary, with the polar regionsseemingly no safer than the tropics.
Previous studies have postulated that longer-term bioticchanges recorded in the James Ross Basin, such as changes inmolluscan faunas during the Campanian–Maastrichtian interval,were ‘harbingers’ of the K–Pg extinction itself15,30,61. We inferthat these changes are more likely recording high-latitude bioticresponse to environmental perturbations on a longer time-scale,such as the long-term global cooling trend evident at thistime18,62,63, and are thus independent of events at the K–Pgboundary.
Nevertheless, existing geochemical, palaeontological andsedimentological data sets from Seymour Island support ideasof a relationship between local palaeoenvironmental changes andmarine diversity during the Maastrichtian–Paleocene interval inAntarctica. The lower part of the succession on Seymour Islandcontains evidence for predominantly cool ocean temperaturesduring the early Maastrichtian17,23,64 (Fig. 2; SupplementaryFig. 7) supporting records from lower latitudes62,63. Althoughlithological homogeneity and lack of key horizons makes adetailed analysis of water depth changes difficult, the shallowwater setting proposed for this interval26,28,29, correlates to aperiod of low molluscan diversity in our sections (Figs 2 and 3;Supplementary Fig. 7). A transition to a more offshoreenvironment occurred during the mid Maastrichtian26,28,29,under a variable temperate climate with fluctuatingtemperatures and occasional ‘cold-snaps’ when sea ice mayhave developed on the Antarctic margin17,23,51. This interval islinked to an increase in diversity and establishment of a morediverse and stable benthic and nektonic molluscan fauna (Figs 2and 3). Warming in the late Maastrichtian occurred alongside aslight facies change, with more frequent deposition of glauconite-rich horizons perhaps indicative of subtle changes in water depth
and the nature of the substrate26. This may account for the minorincrease in benthic extinction rates recorded in this interval(Supplementary Fig. 7). Warming is followed by further coolingin the latest Maastrichtian17,24,51,65, and evidence for an overallshallowing of the basin into the Paleocene26,29,30. The cluster oflast occurrences at the K–Pg boundary appear unrelated tosignificant facies change.
Integration of our new pyrite petrographic analysis with thesedata reveals a broadly inverse relationship between diversity inthe Lopez de Bertodano Formation and the occurrence offramboid-rich samples. This suggests that, contrary to previousstudies of the Lopez de Bertodano Formation that assumed fullyoxic conditions throughout deposition16,26,29, fluctuating redoxconditions on the Maastrichtian sea-floor may have been afurther factor influencing benthic diversity.
Initial low molluscan diversity during the early Maastrichtianalso corresponded with evidence for the periodic development ofshallow water dysoxia, anoxia and even euxinia (Fig. 4;Supplementary Fig. 8). Significantly, the apparent reappearanceof a large number of range-through taxa from underlyingformations (Supplementary Table 1) in the mid-Lopez deBertodano Formation indicates that early Maastrichtian environ-mental fluctuations were not accompanied by any significantextinction events, at least in the benthos, and any reduction indiversity was temporary (Figs 2 and 3). Oxygenation levels andbenthic diversity subsequently improved, although framboidevidence for redox conditions fluctuating between dysoxia andanoxia–euxinia is present in samples in at least three distinctlevels in the upper Lopez de Bertodano Formation (Fig. 4;Supplementary Fig. 8).
Interestingly, these include the glauconite-rich sandstonehorizons immediately above the K–Pg boundary, suggesting thedevelopment of local bottom-water anoxia in the aftermath ofthe extinction. Although the occurrence of similar conditionsassociated with another, older, glauconite-rich horizon in theMaastrichtian suggest this is not unusual (Supplementary Fig. 8),certain characteristics of the extinction interval suggest thedevelopment of harsh conditions in the water column as well ason the sea-floor at this time. These include the loss of pelagic andnektonic/nektobenthic macrofauna18,53 (Fig. 2), disruption toplanktonic microfauna and flora31,54,57, and occurrence of largenumbers of articulated fish remains immediately above the K–Pgboundary on Seymour Island16. The origin of recurrent ‘fish-kill’events in this short stratigraphic interval is unclear; Zinsmeister16
suggested they may have resulted from large-scale algal orbacterial blooms, or unspecified changes in water chemistryfollowing the end-Cretaceous impact event. Such blooms ofopportunistic primary producers and geographically hetero-geneous high-stress marine conditions have been hypothesizedworldwide in the aftermath of the Chicxulub impact66, followingperturbation or collapse of the global marine food web due tomass extinction of many groups of phytoplankton4. In Antarctica,local benthic anoxia likely led to enhanced preservation potentialfor victims of the subsequent ‘fish-kills’ by limiting the activity ofbenthic scavengers. The loss of common scavenging taxa such asmany epifaunal gastropods and echinoids in the aftermath of theextinction event on Seymour Island (Fig. 2), may also havefavoured enhanced preservation of fish carcasses. The benthos ofthis immediate post-extinction interval is also characterized byunusual high abundance ‘blooms’ of presumably opportunisticmolluscan taxa, primarily represented by the infaunal bivalveLahillia larseni and the aporrhaid gastropod Struthiochenopushurleyi27,43.
Pyrite framboid data probably indicate a return to oxygenatedsea-floor conditions above the boundary interval (SupplementaryFig. 8). However, successive acmes of several species of
ARTICLE NATURE COMMUNICATIONS | DOI: 10.1038/ncomms11738
6 NATURE COMMUNICATIONS | 7:11738 | DOI: 10.1038/ncomms11738 | www.nature.com/naturecommunications
dinoflagellate cyst31, and an increase in diatom resting spores54 inthe 60 m stratigraphic interval above the K–Pg boundary mayindicate the persistence of unstable marine conditions and aperturbed marine ecosystem following the extinction on SeymourIsland. Despite a peak in origination rates at and above the K–Pginterval (Fig. 3), significant recovery of benthic species richnessonly commenced, B350 kyr after the extinction, just prior toinitial deposition of the Sobral Formation24,44. This providessome support for the hypothesized continuation of unusualenvironmental conditions into the early Danian.
In summary, intensive collecting of marine fossils from theMaastrichtian-earliest Paleocene Lopez de Bertodano Formationon Seymour Island, Antarctica, reveals that, contrary to allprevious studies, there was a single, abrupt extinction at theend of the Cretaceous at this location. We find no counter-evidence for any precursor biotic crises at this high southernpalaeolatitude. Our results support the idea that a sudden eventsuch as the Chicxulub bolide impact and associated rapidenvironmental deterioration4,22,32 was the most probable causeof the K–Pg mass extinction. Although recent dating estimates foronset of the main phase of the Deccan Traps large igneousprovince do suggest a complex temporal coincidence betweenvolcanism and impact at this time12,13, the precise environmentaleffects of this volcanism on global ecosystems remain unclear49.
Prior to the K–Pg extinction interval, minor diversityfluctuations in Antarctica were linked to local water depthchanges with associated changes in seawater temperature. Pyriteframboid data indicates fluctuations in local benthic oxygenationlevels may also have played a role in controlling diversity of themarine fauna. In conjunction with the temporary absence ofscavenging benthic taxa in the immediate aftermath of the massextinction event, this provided favourable conditions forfossilization of well-preserved fish directly above the K–Pgboundary in Antarctica, perhaps related to transient unstablemarine conditions following the Chicxulub impact. Althoughevidence for rapid climate oscillations and a late Maastrichtianwarming event are present on Seymour Island17,23,51, they are notassociated with any significant diversity decline in the marinemacrofauna prior to the K–Pg boundary. This argues againstmodels that invoke rapid Maastrichtian climate changes as asignificant stressor on pre-extinction communities6,14. The lossesamong the benthic invertebrates in Antarctica due to the K–Pgextinction are closely comparable with those recorded from lowerlatitudes, despite the overall lower diversity of the Antarcticmolluscan fauna, and do not support the theory of latitudinalextinction selectivity during this major mass extinction event22,60.
MethodsSampling strategy. Our primary data are derived from extensive macrofossilcollecting in three sedimentary section lines spanning the Lopez de BertodanoFormation and K–Pg interval. All sub-sections that comprise the composite sectionwere measured perpendicular to strike using a Jacob’s staff and tape measure.Fieldwork was undertaken during three field seasons to Seymour Island andencompassed the main outcrop of the Lopez de Bertodano Formation in thesouthern part of the island24,27,44,51. The island is ice-free and exposure excellent.Sections DJ.959, DJ.957, DJ.952 and DJ.953 were made during the 1999 fieldseason, and are located close to the central portion of the outcrop, commencing inthe mid-levels of the Lopez de Bertodano Formation representing the informalmapping units Klb7–9 and Ktplb10 of Macellari26 (Fig. 1). Section D5.251(comprising sub-sections D5.212, D5.215, D5.218, D5.219, D5.220, D5.222 andD5.229) was measured and sampled during the 2006 field season and runsperpendicular to strike and approximately parallel to the southern coast of theisland, beginning within the uppermost levels of the Snow Hill Island Formation.Sections D9.205, D9.206 and D9.207 were located at the northern end of theoutcrop during the 2010 field season, and begin immediately below the K–Pgboundary. All three composite sections extend through the K–Pg boundary and theinformal mapping unit Ktplb10 to the unconformable contact with the overlyingSobral Formation (Supplementary Figs 1–4).
Macrofossil collections were made systematically at varying scales during thedifferent field seasons, with sample bins ranging on average from 1 m to intervals
10–15 m thick (see Supplementary Figs 2–4 and Supplementary Data 1 forillustration of sampling intervals and bin length in each individual section line).Changes in the size of sample bins within and between individual section lines werenecessary during field collecting due to the nature of the ‘scarp and dip-slope’topography that predominates on southern Seymour Island, whereby fossils areinvariably more common on dip-slopes than scarps. Collections were made at eachstation until a representative collection of all the obvious macrofossil types hadbeen obtained; just as it was not possible to standardize sample bin size, so it wasnot possible to use a standard collecting time either. For these reasons we chose tofocus only on range-through data and standing species richness to estimate changesin taxonomic diversity across the K–Pg boundary. In Supplementary Fig. 7, wehave plotted variations in sample species richness through all three of our sections,including data from Zinsmeister16 (Supplementary Fig. 6). These all show fairlyregular variation around a sample mean, but no major trends that could belinked to any obvious form of either local or global environmental variation.Such small-scale fluctuations in species richness are an inevitable consequenceof specimen collection in a scarp and dip-slope terrain, and are unlikely torepresent any true response to environmental change.
Correlation between section lines and the construction of a composite sectionwas achieved using several stratigraphic tie-points, notably the glauconite-rich bedsthat mark the K–Pg boundary and a further prominent glauconite-rich horizonpresent in all section lines B174 m below the K–Pg. To enable a full analysis ofextinction patterns at the K–Pg boundary, field data derived from British AntarcticSurvey sampling was also supplemented with additional data from Zinsmeister16
(Supplementary Fig. 6). Zinsmeister’s16 macrofossil collections were taken from aseries of short (20 m) sections measured and sampled during a detailed along-strikemapping study of the K–Pg boundary across B5.5 km of southern Seymour Island.When plotting these additional fossil occurrences the base of the ‘LowerGlauconite’ horizon of Zinsmeister16 is taken as a reference plane, and assumed tobe equivalent to the base of the glauconite-rich beds and K–Pg boundary in ourcomposite measured section at a stratigraphic height of 1,007.5 m (refs 31,51). Forall these stratigraphic correlations, we assume planar bedding along strike. Theunconformable contact at the base of the Sobral Formation is also useful as atie-point, although it can be demonstrated that on a regional scale the degree oferosion of the upper levels of the Lopez de Bertodano Formation changes subtlyalong strike across the island26,67.
The occurrence of glauconite-rich horizons, such as those that mark the K–Pginterval, suggest periods of slower, condensed sedimentation. The base of theseunits appears gradational in the field16,24,27,30 and high-resolution palynologicalstudies18,23,24 show they are not associated with significant sedimentary hiatuses inthe studied sections, but probably represent conformable facies boundaries24.
Fossil data analysis. Over 6,000 fossils of benthic molluscs (bivalves andgastropods) were examined during this study, with 5,710 identified to at leastgeneric level, these have been combined with 4700 cephalopod macrofossils18 foran examination of overall diversity of the molluscan fauna. Following taxonomicidentification and reassessment (Supplementary Note 1), first and last occurrencedata from individual section lines were used to construct a composite range chartusing the stratigraphic tie points outlined above. Changes in stratigraphic bin sizewere accounted for by taking the base of the stratigraphic bin in which a speciesfirst occurred as the first appearance, and the top of the stratigraphic bin in which aspecies last occurred as the last appearance. While this introduces a degree of errorinto the results (for example, where a sampling bin straddles the K–Pg boundary ina single stratigraphic section), it is negligible given the expanded nature of thesuccession. A presence–absence data set based on this range data (SupplementaryData 1) was used to calculate standing species richness variations throughout thesection, supplemented with additional collections from the overlying PaleoceneSobral Formation24,44 and a literature review to identify range-through taxa fromolder, underlying formations (Supplementary Table 1). To assess changing rates ofbiotic turnover through the succession, the presence–absence data set was split into10 m bins and both extinction (Er) and origination (Or) rates calculated for each10 m bin using the boundary-crosser methodology outlined by Foote38:
Or ¼ � lnNbt
NftþNbtð1Þ
Er ¼ � lnNbt
Nbl þNbtð2Þ
where Nbt¼ number of range-through taxa, Nft¼ number of taxa that originatewithin any given 10 m bin and cross the top boundary of that bin andNbl¼ number of taxa that cross the bottom boundary of the bin but have their lastoccurrence within the bin. These should be considered as ‘extinction’ and‘origination’ rates only in the local context, and are not expressed relative to binduration. Available evidence suggests overall sedimentation rates remained highthroughout deposition of the Lopez de Bertodano Formation at 0.1–0.2 mm peryear (ref. 17) (Supplementary Fig. 5) indicating that any variation in bin duration islikely to have a negligible effect on the magnitude of biotic turnover rates.
To test the hypothesis of multiple extinction events and visually assessthe pattern of taxonomic turnover more generally through the Maastrichtian,we also employed the stratigraphic abundance method of Meldahl40. Stratigraphicabundance (S, the percentage of sample intervals in which a given taxon occurs)
NATURE COMMUNICATIONS | DOI: 10.1038/ncomms11738 ARTICLE
NATURE COMMUNICATIONS | 7:11738 | DOI: 10.1038/ncomms11738 | www.nature.com/naturecommunications 7
was calculated using a recently modified method41 to enable us to include datafrom all three studied sedimentary sections in addition to data from Zinsmeister16:
S ¼ Noccurrence 1 þNoccurrence 2 þNoccurrence 3
Nsample 1 þNsample 2 þNsample 3�100
� �ð3Þ
where Noccurrence 1 is the number of occurrences of a given species in section 1, andNsample 1 is the number of samples in section 1. A plot of S versus last occurrenceprovides a visual estimate of the likely position of an extinction horizon based onthe disappearance of the most common taxa in an assemblage (Fig. 3c), and alongwith a plot of the frequency distribution of last occurrences in a stratigraphicsection (Supplementary Fig. 7), can be compared with simulated models of suddenand gradual extinction40. We included all molluscan taxa in this analysis, includinga reanalysis of the nekton to include additional data from field collections made in2010 (data reanalysed from ref. 18). To investigate the extent to which the data isinfluenced by the ‘Signor-Lipps Effect’39 due to the sampling strategy, 50 and 95%confidence intervals were calculated for all benthic taxa with 45 occurrencesduring the Maastrichtian within two BAS section lines (sections A and B, Fig. 1c).We applied the ‘classical’ method as summarised by Marshall42, and illustrate theseconfidence intervals as range extensions (Supplementary Figs 3 and 4) using thefollowing equation:
rC;i ¼ ½ð1�CÞ� 1=ðH� 1Þ � 1�R ð4ÞAverage gap size between fossil occurrences also provides an unbiased point
estimate of the true time of appearance or disappearance in any given stratigraphicsection assuming random fossil recovery42, and was calculated for the same taxausing:
runbiased ¼ R=ðH� 1Þ ð5Þ
where rC,i is the length of the range extension, runbiased is the average gap betweenfossil occurrences as a percentage of that taxon’s stratigraphic range, C is thedesired confidence level (expressed as a decimal; 0.5 and 0.95), H is the number ofobserved fossil occurrences for a species in an individual section line and R is theobserved stratigraphic range of the taxon in the same section line. Confidenceintervals were only calculated for data from two sections directly sampled by theauthors (sections A and B, Fig. 1c), both of which have extended records from theMaastrichtian into the Paleocene. Because of the constraints of the samplingstrategy outlined above, confidence intervals were not applied to any compositedata set that is derived only from range-through data (Fig. 2).
Pyrite petrography. Polished blocks were made from 21 bulk sediment samplescollected throughout composite section D5.251 (Supplementary Table 2). Thesewere examined using an FEI Quanta 650 scanning electron microscope (SEM) inback-scatter mode to identify microfacies and quantify the diameter of pyriteframboid populations. The size and distribution of pyrite framboids in both ancientand modern sediments are interpreted to result from local redox conditions45,46. Inmodern environments, syngenetic framboids form in a narrow iron reductionregion developed at the redox boundary, but cease growing in the underlying fullyanoxic sulphate reduction zone. Under fully euxinic conditions (where free H2Soccurs in the water column), syngenetic framboids grow to a maximum diameter of6–7 mm in the water column before gravity causes them to sink to the seabed45.Framboid populations formed under these conditions will exhibit both a small sizerange and a small s.d. In dysoxic settings, conditions on the seabed are often weaklyoxygenated, leading to framboid development in the pore water of the underlyingsediments. Here the size range is controlled primarily by the availability ofreactants and therefore framboid populations typically grow to larger sizes (up to20mm) with a correspondingly higher s.d.46. Supplementary Figure 8 presents a‘Box and Whisker’ plot showing the stratigraphic distribution of the sampledhorizons and illustration of framboid populations.
Data availability. The authors declare that all data supporting the findings of thisstudy are available within the article and its Supplementary Information Files.
References1. Alvarez, L. W., Alvarez, W., Asaro, F. & Michel, H. V. Extraterrestrial cause for
the Cretaceous-Tertiary extinction. Science 208, 1095–1108 (1980).2. Raup, D. M. & Sepkoski, J. J. Mass extinctions in the marine fossil record.
Science 215, 1501–1503 (1982).3. Bambach, R. K. Phanerozoic biodiversity mass extinctions. Annu. Rev. Earth
Planet. Sci. 34, 127–155 (2006).4. Schulte, P. et al. The Chicxulub asteroid impact and mass extinction at the
Cretaceous-Paleogene boundary. Science 327, 1214–1218 (2010).5. Keller, G. et al. Cretaceous extinctions: evidence overlooked. Science 328,
974–975 (2010).6. Archibald, J. D. et al. Cretaceous extinctions: multiple causes. Science 328, 973
(2010).7. McGhee, G. R., Clapham, M. E., Sheehan, P. M., Bottjer, D. J. & Droser, M. L.
A new ecological severity ranking of major Phanerozoic biodiversity crises.Palaeogeogr. Palaeoclimatol. Palaeoecol. 283, 260–270 (2013).
8. Brusatte, S. L. et al. The extinction of the dinosaurs. Biol. Rev. 90, 628–642(2015).
9. Krug, A. Z., Jablonski, D. & Valentine, J. W. Signature of the end-Cretaceousmass extinction in the modern biota. Science 323, 767–771 (2009).
10. Aberhan, M. & Kiessling, W. Rebuilding biodiversity of Patagonian marinemolluscs after the end-Cretaceous mass extinction. PLoS ONE 9, e106269(2014).
11. Aberhan, M. & Kiessling, W. Persistent ecological shifts in marine molluscanassemblages across the end-Cretaceous mass extinction. Proc. Natl Acad. Sci.USA 112, 7207–7212 (2015).
12. Schoene, B. et al. U-Pb geochronology of the Deccan Traps and relation to theend-Cretaceous mass extinction. Science 347, 182–184 (2014).
13. Renne, P. R. et al. State shift in Deccan volcanism at the Cretaceous-Paleogeneboundary, possibly induced by impact. Science 350, 76–78 (2015).
14. Renne, P. R. et al. Time scales of critical events around the Cretaceous-Paleogene boundary. Science 339, 684–687 (2013).
15. Zinsmeister, W. J., Feldmann, R. M., Woodburne, M. O. & Elliot, D. H.Latest Cretaceous/earliest Tertiary transition on Seymour Island, Antarctica.J. Palaeont. 63, 731–738 (1989).
16. Zinsmeister, W. J. Discovery of fish mortality horizon at the K-T boundaryon Seymour Island: re-evaluation of events at the end of the Cretaceous.J. Palaeont. 72, 556–571 (1998).
17. Tobin, T. S. et al. Extinction patterns, d18O trends, and magnetostratigraphyfrom a southern high-latitude Cretaceous-Paleogene section: links with Deccanvolcanism. Palaeogeogr. Palaeoclimatol. Palaeoecol. 350–352, 180–188 (2012).
18. Witts, J. D. et al. Evolution and extinction of Maastrichtian (Late Cretaceous)cephalopods from the Lopez de Bertodano Formation, Seymour Island,Antarctica. Palaeogeogr. Palaeoclimatol. Palaeoecol. 418, 193–212 (2015).
19. Powell, M. G. & MacGregor, J. A geographic test of species selection usingplanktonic foraminifera during the Cretaceous/Paleogene mass extinction.Paleobiology 37, 426–437 (2011).
20. Punekar, J., Mateo, P. & Keller, G. in Volcanism, Impacts, and Mass Extinctions:Causes and Effects vol. 505 (eds Keller, K. & Kerr, A. C.) SPE504–SPE505(Geol. Soc. Am., 2014).
21. Jablonski, D. Geographic variation in the molluscan recovery from theend-Cretaceous extinction. Science 279, 1327–1330 (1998).
22. Jiang, S., Bralower, T. J., Patzkowsky, M. E., Kump, L. R. & Schueth, J. D.Geographic controls on nannoplankton extinction across the Cretaceous/Paleogene boundary. Nat. Geosci. 3, 280–285 (2010).
23. Bowman, V. C., Francis, J. E. & Riding, J. B. Late Cretaceous winter sea ice inAntarctica? Geology 41, 1227–1230 (2013).
24. Bowman, V. C. et al. The Paleocene of Antarctica: Dinoflagellate cystbiostratigraphy, chronostratigraphy and implications for the palaeo-Pacificmargin of Gondwana. Gondwana Res. (in the press).
25. Hathway, B. Continental rift to back-arc basin: Jurassic-Cretaceousstratigraphical and structural evolution of the Larsen Basin, AntarcticPeninsula. J. Geol. Soc. London 157, 417–432 (2000).
26. Macellari, C. E. Stratigraphy, sedimentology, and paleoecology of UpperCretaceous/Paleocene shelf-deltaic sediments of Seymour Island. Geol. Soc. Am.Mem. 169, 25–53 (1988).
27. Crame, J. A., Francis, J. E., Cantrill, D. J. & Pirrie, D. Maastrichtian stratigraphyof Antarctica. Cretac. Res. 25, 411–423 (2004).
28. Olivero, E. B. Sedimentary cycles, ammonite diversity and palaeoenvironmentalchanges in the Upper Cretaceous Marambio group, Antarctica. Cretac. Res. 34,348–366 (2012).
29. Olivero, E. B., Ponce, J. J., Marsicano, C. & Martinioni, D. R. Depositionalsettings of the basal Lopez de Bertodano formation, Maastrichtian, Antarctica.Rev. la Asoc. Geol. Argentina 62, 521–529 (2007).
30. Elliot, D. H., Askin, R. A., Kyte, F. T. & Zinsmeister, W. J. Iridium anddinocysts at the Cretaceous-Tertiary boundary on Seymour Island, Antarctica:implications for the K-T event. Geology 22, 675–678 (1994).
31. Bowman, V. C., Francis, J. E., Riding, J. B., Hunter, S. J. & Haywood, A. M.A latest Cretaceous to earliest Paleogene dinoflagellate cyst zonation fromAntarctica, and implications for phytoprovincialism in the high southernlatitudes. Rev. Palaeobot. Palynol. 171, 40–56 (2012).
32. Molina, E. et al. The global boundary stratotype section and point for the baseof the Danian stage (Paleocene, Paleogene, ‘Tertiary’, Cenozoic) at El Kef,Tunisia—original definition and revision. Episodes 29, 263–273 (2006).
33. Francis, J. E. & Poole, I. Cretaceous and early Tertiary climates of Antarctica:evidence from fossil wood. Palaeogeogr. Palaeoclimatol. Palaeoecol. 182, 47–64(2002).
34. Little, C. T. S. et al. Late Cretaceous (Maastrichtian) shallow water hydrocarbonseeps from Snow Hill and Seymour Islands, James Ross Basin, Antarctica.Palaeogeogr. Palaeoclimatol. Palaeoecol. 418, 213–228 (2015).
35. Scasso, R. A., Olivero, E. B. & Buatois, L. Lithofacies, biofacies, andichnoassemblage evolution of a shallow submarine volcaniclastic fan-shelfdepositional system (Upper Cretaceous, James Ross Island, Antarctica). J. SouthAm. Earth Sci. 4, 239–260 (1991).
ARTICLE NATURE COMMUNICATIONS | DOI: 10.1038/ncomms11738
8 NATURE COMMUNICATIONS | 7:11738 | DOI: 10.1038/ncomms11738 | www.nature.com/naturecommunications
36. Pirrie, D., Crame, J. A., Lomas, S. A. & Riding, J. B. Late Cretaceousstratigraphy of the Admiralty Sound region, James Ross Basin, Antarctica.Cretac. Res. 18, 109–137 (1997).
37. Stilwell, J. D. Geological exploration of Cockburn Island, Antarctic Peninsula.Polish Polar Res. 23, 47–73 (2002).
38. Foote, M. Origination and extinction components of taxonomic diversity:general problems. Paleobiology 26, 74–102 (2000).
39. Signor, P. W. & Lipps, J. H. in Geological Implications of Impacts of LargeAsteroids and Comets on the Earth vol. 190 (eds Silver, L. T. & Schultz, P. H.)291–296 (Geol. Soc. Am., 1982).
40. Meldahl, K. Sampling, species abundance, and the stratigraphic signature ofmass extinction: a test using Holocene tidal flat molluscs. Geology 18, 890–893(1990).
41. Song, H., Wignall, P. B., Tong, J. & Yin, H. Two pulses of extinction during thePermian-Triassic crisis. Nat. Geosci. 6, 52–56 (2012).
42. Marshall, C. R. in Quantitative Methods in Paleobiology vol. 16 (eds Alroy, J. &Hunt, G.) 291–316 (The Pal. Soc., 2010).
43. Stilwell, J. D., Zinsmeister, W. J. & Oleinik, A. E. Early Paleocene mollusks ofAntarctica: systematics, paleoecology and paleogeographic significance. Bull.Am. Paleontol. 367, 1–89 (2004).
44. Crame, J. A. et al. The early origins of the Antarctic marine fauna and itsevolutionary implications. PLoS ONE 9, e114732 (2014).
45. Wignall, P. B. & Newton, R. Pyrite framboid diameter as a measure of oxygendeficiency in ancient mudrocks. Am. J. Sci. 298, 537–552 (1998).
46. Wilkin, R. T., Barnes, H. L. & Brantley, S. L. The size distribution of framboidalpyrite in modern sediments: an indicator of redox conditions. Geochim.Cosmochim. Acta 60, 3897–3912 (1996).
47. Thibault, N. & Gardin, S. The nannofossil response to the end-Cretaceouswarm event in the tropical Pacific. Palaeogeogr. Palaeoclimatol. Palaeoecol. 291,239–252 (2010).
48. Thibault, N. & Husson, D. Climatic fluctuations and sea-surface watercirculation patterns at the end of the Cretaceous era: Calcareous nannofossilresponse. Palaeogeogr. Palaeoclimatol. Palaeoecol. 441, 152–164 (2016).
49. Schmidt, A. et al. Selective environmental stress from sulphur emitted bycontinental flood basalt eruptions. Nat. Geosci. 9, 77–82 (2016).
50. Richards, M. A. et al. Triggering of the largest Deccan eruptions by theChicxulub impact. Geol. Soc. Am. Bull. 127, 1507–1520 (2015).
51. Bowman, V. C., Francis, J. E., Askin, R. A., Riding, J. B. & Swindles, G. T. LatestCretaceous-earliest Paleogene vegetation and climate change at the highsouthern latitudes: palynological evidence from Seymour Island, AntarcticPeninsula. Palaeogeogr. Palaeoclimatol. Palaeoecol. 408, 26–47 (2014).
52. Beu, A. G. Before the ice: biogeography of Antarctic Paleogene molluscanfaunas. Palaeogeogr. Palaeoclimatol. Palaeoecol. 284, 191–226 (2009).
53. Martin, J. E. Biostratigraphy of the Mosasauridae (Reptilia) from theCretaceous of Antarctica. Geol. Soc. Lond. Spec. Pub. 258, 101–108 (2006).
54. Harwood, D. M. Upper Cretaceous and lower Paleocene diatom andsilicoflagellate biostratigraphy of Seymour Island, eastern Antarctic Peninsula.Geol. Soc. Am. Mem. 169, 55–130 (1988).
55. Lewis, J., Harris, A. S. D., Jones, K. J. & Edmonds, R. L. Long term survival ofmarine planktonic diatoms and dinoflagellates in stored sediment samples.J. Plankton Res. 21, 343–354 (1999).
56. Ribeiro, S. et al. Phytoplankton growth after a century of dormancy illuminatespast resilience to catastrophic darkness. Nat. Commun. 2, 311 (2011).
57. Huber, B. T. Upper Campanian-Paleocene foraminfera from the JamesRoss Island region, Antarctic Peninsula. Geol. Soc. Am. Mem. 169, 163–252(1988).
58. Hansen, T. A., Farrell, B. R. & Upshaw, III. B. The first 2 million years after theCretaceous-Tertiary boundary in east Texas: rate and paleoecology of themolluscan recovery. Paleobiology 19, 251–265 (1993).
59. Heinberg, C. Lower Danian bivalves, Stevns Klint, Denmark. Continuity acrossthe K/T boundary. Palaeogeogr. Palaeoclimatol. Palaeoecol. 154, 87–106 (1999).
60. Raup, D. M. & Jablonski, D. Geography of end-Cretaceous marine bivalveextinctions. Science 260, 971–973 (1993).
61. Crame, J. A., Lomas, S. A., Pirrie, D. & Luther, A. Late Cretaceous extinctionpatterns in Antarctica. J. Geol. Soc. Lond. 153, 503–506 (1996).
62. Friedrich, O., Norris, R. D. & Erbacher, J. Evolution of middle to LateCretaceous oceans—a 55 m.y. record of Earth’s temperature and carbon cycle.Geology 40, 107–110 (2012).
63. Linnert, C. et al. Evidence for global cooling in the Late Cretaceous. Nat.Commun. 5, 1–7 (2014).
64. Dutton, A., Huber, B. T., Lohmann, K. C. & Zinsmeister, W. J. High-resolutionstable isotope profiles of a dimitobelid belemnite: implications for paleodepthhabitat and late Maastrichtian climate seasonality. Palaios 22, 642–650 (2007).
65. Kemp, D. B. et al. A cool temperate climate on the Antarctic Peninsula throughthe latest Cretaceous to early Paleogene. Geology 42, 583–586 (2014).
66. Alegret, L. & Thomas, E. Food supply to the seafloor in the Pacific Ocean afterthe Cretaceous/Paleogene boundary event. Mar. Micropaleontol. 73, 105–116(2009).
67. Montes, N., Nozal, F., Santillana, S., Marenssi, S. A. & Olivero, E. B.Mapa geologioco de la Isla Marambio (Seymour) Escala 1:20,000. Inst. Ant. Arg.Inst. Geol. Min. Espana (2010).
68. McArthur, J. M., Thirlwall, M. F., Engkilde, M., Zinsmeister, W. J. &Howarth, R. J. Strontium isotope profiles across K/T boundary sequences inDenmark and Antarctica. Earth Planet Sci. Lett. 160, 179–192 (1998).
69. Gradstein, F. M., Ogg, J. G., Schmitz, M. & Ogg, G. The Geological Time Scale2012 (Elsevier Science Ltd, 2012).
70. Chenet, A. L. et al. Determination of rapid Deccan eruptions across theCretaceous-Tertiary boundary using paleomagnetic secular variation: 2.constraints from analysis of eight new sections and synthesis for a3500-m-thick composite section. J. Geophys. Res. 114, BO6103 (2009).
AcknowledgementsFunding for this study was provided by a PhD scholarship from the University of Leedsto J.D.W., and UK Natural Environment Research Council (NERC) grants NE/C506399/1(Antarctic Funding Initiative) (to J.E.F.) and NE/I00582X/1 (PALEOPOLAR) (to J.A.C.).Fieldwork to Seymour Island was supported logistically by the British Antarctic Survey,and we thank Hilary Blagbrough (BAS, Cambridge, UK) for subsequent laboratory andtechnical support. We also acknowledge the help of staff at the Paleontological ResearchInstitute (PRI, Ithaca, New York, USA) for assisting with access to the Zinsmeister FossilCollection. We thank Cris Little and Alex Dunhill (University of Leeds, UK) for theirconstructive comments on an earlier version of this manuscript, and Jon Ineson (GEUS,Copenhagen, Denmark) as well as other members of the PALEOPOLAR research team,for useful discussions regarding the sedimentology and stratigraphy of Seymour Island.
Author contributionsFieldwork and fossil sampling on Seymour Island was conducted by J.A.C., R.J.W., J.E.F.and V.C.B. Macrofossil identifications were made by J.D.W. with assistance fromR.J.W. and J.A.C. J.D.W. analysed the data and wrote the manuscript with help andcontributions from all co-authors.
Additional informationSupplementary Information accompanies this paper at http://www.nature.com/naturecommunications
Competing financial interests: The authors declare no competing financial interests.
Reprints and permission information is available online at http://npg.nature.com/reprintsandpermissions/
How to cite this article: Witts, J. D. et al. Macrofossil evidence for a rapid and severeCretaceous–Paleogene mass extinction in Antarctica. Nat. Commun. 7:11738doi: 10.1038/ncomms11738 (2016).
This work is licensed under a Creative Commons Attribution 4.0International License. The images or other third party material in this
article are included in the article’s Creative Commons license, unless indicated otherwisein the credit line; if the material is not included under the Creative Commons license,users will need to obtain permission from the license holder to reproduce the material.To view a copy of this license, visit http://creativecommons.org/licenses/by/4.0/
NATURE COMMUNICATIONS | DOI: 10.1038/ncomms11738 ARTICLE
NATURE COMMUNICATIONS | 7:11738 | DOI: 10.1038/ncomms11738 | www.nature.com/naturecommunications 9