Embed Size (px)
Citation preview
MACROECONOMICS
© 2015 Worth Publishers, all rights reserved
PowerPoint ® Slides by Ron Cronovich
N. Gregory MankiwFall 2014 update
The Science of Macroeconomics
1
IN THIS CHAPTER, YOU WILL LEARN:
about the issues macroeconomists study
about the tools macroeconomists use
some important concepts in macroeconomic analysis
2

3CHAPTER 1 The Science of Macroeconomics
Important issues in macroeconomics
What causes recessions? What is “government stimulus” and why might it help?
How can problems in the housing market spread to the rest of the economy?
What is the government budget deficit? How does it affect workers, consumers, businesses, and taxpayers?
Macroeconomics, the study of the economy as a whole, addresses many topical issues, e.g.:

4CHAPTER 1 The Science of Macroeconomics
Important issues in macroeconomics
Why does the cost of living keep rising?
Why are so many countries poor? What policies might help them grow out of poverty?
What is the trade deficit? How does it affect the country’s well-being?
Macroeconomics, the study of the economy as a whole, addresses many topical issues, e.g.:
1900
1910
1920
1930
1940
1950
1960
1970
1980
1990
2000
2010
$0
$10,000
$20,000
$30,000
$40,000
$50,000
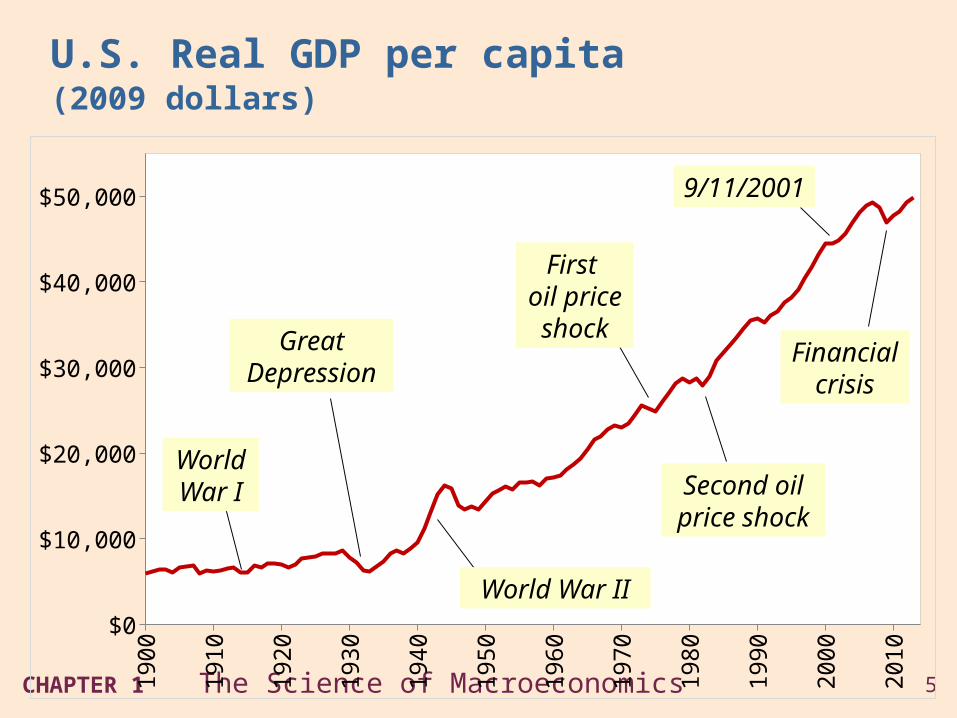
U.S. Real GDP per capita (2009 dollars)
Great Depression
World War II
First oil price shock
Second oil price shock
9/11/2001
World War I
Financial crisis
1900
1910
1920
1930
1940
1950
1960
1970
1980
1990
2000
2010
-15
-10
-5
0
5
10
15
20
25
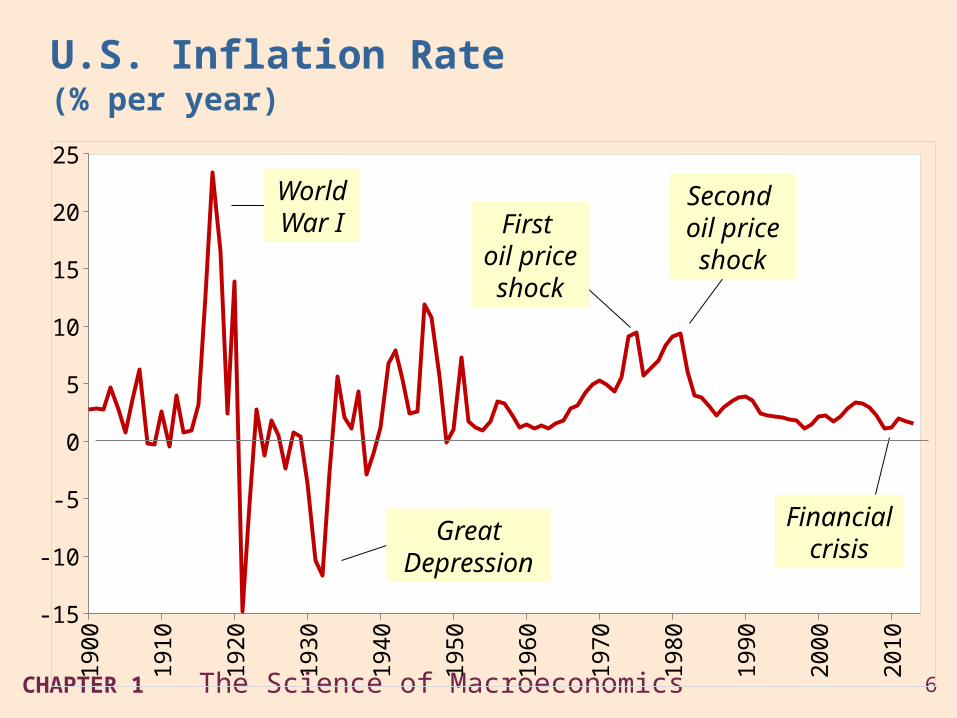
U.S. Inflation Rate(% per year)
Great Depression
First oil price shock
Second oil price shock
Financial crisis
World War I
1900
1910
1920
1930
1940
1950
1960
1970
1980
1990
2000
2010
0
5
10
15
20
25
30
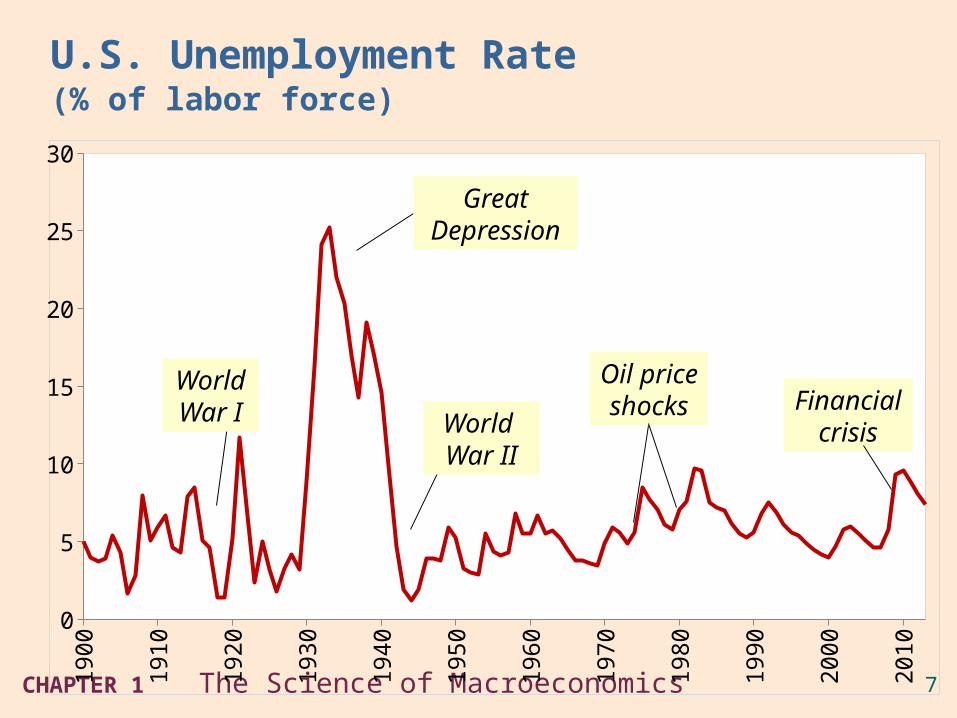
U.S. Unemployment Rate(% of labor force)
Great Depression
Financial crisisWorld
War II
World War I
Oil price shocks
8CHAPTER 1 The Science of Macroeconomics
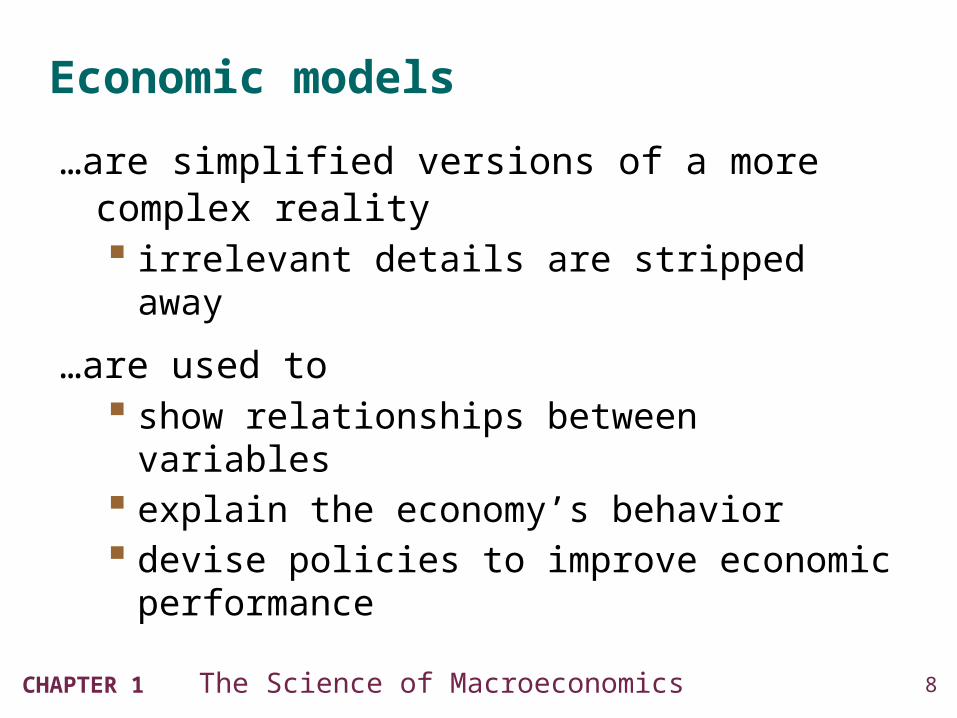
Economic models
…are simplified versions of a more complex reality irrelevant details are stripped away
…are used to show relationships between variables explain the economy’s behavior devise policies to improve economic
performance
9CHAPTER 1 The Science of Macroeconomics
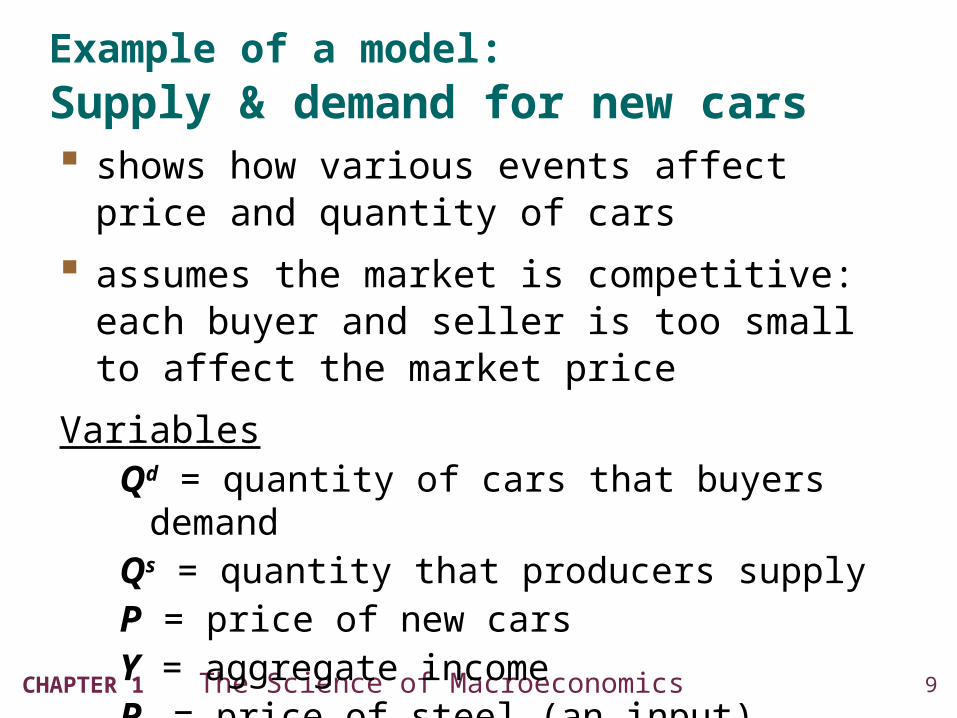
Example of a model: Supply & demand for new cars shows how various events affect price and
quantity of cars
assumes the market is competitive: each buyer and seller is too small to affect the market price
VariablesQd = quantity of cars that buyers demandQs = quantity that producers supplyP = price of new carsY = aggregate incomePs = price of steel (an input)
10CHAPTER 1 The Science of Macroeconomics
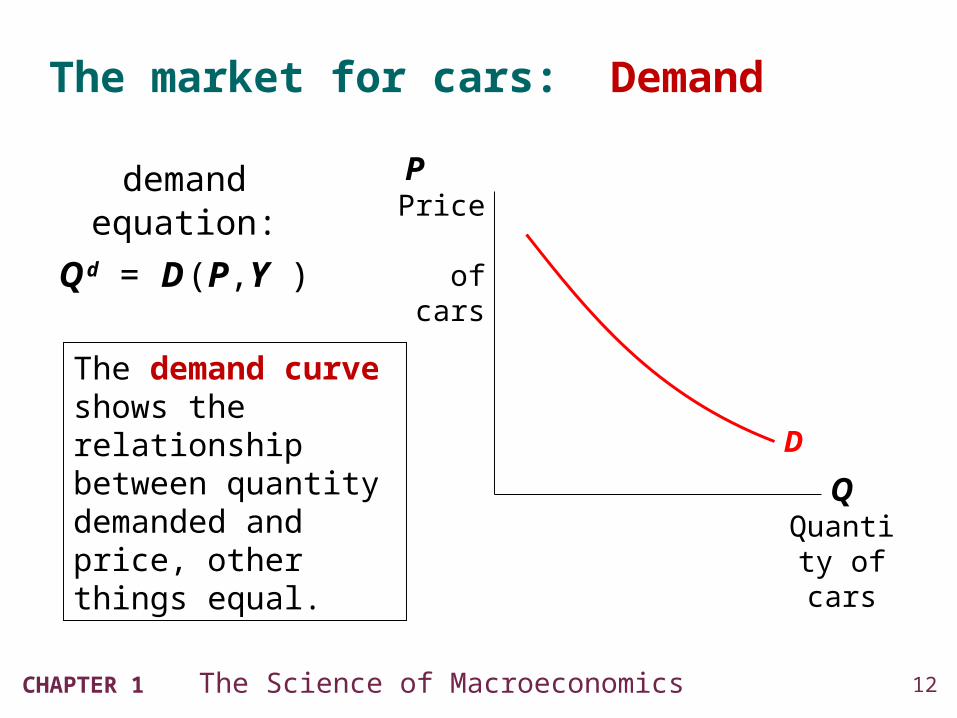
The demand for cars
demand equation: Q d = D (P,Y )
shows that the quantity of cars consumers demand is related to the price of cars and aggregate income
11CHAPTER 1 The Science of Macroeconomics
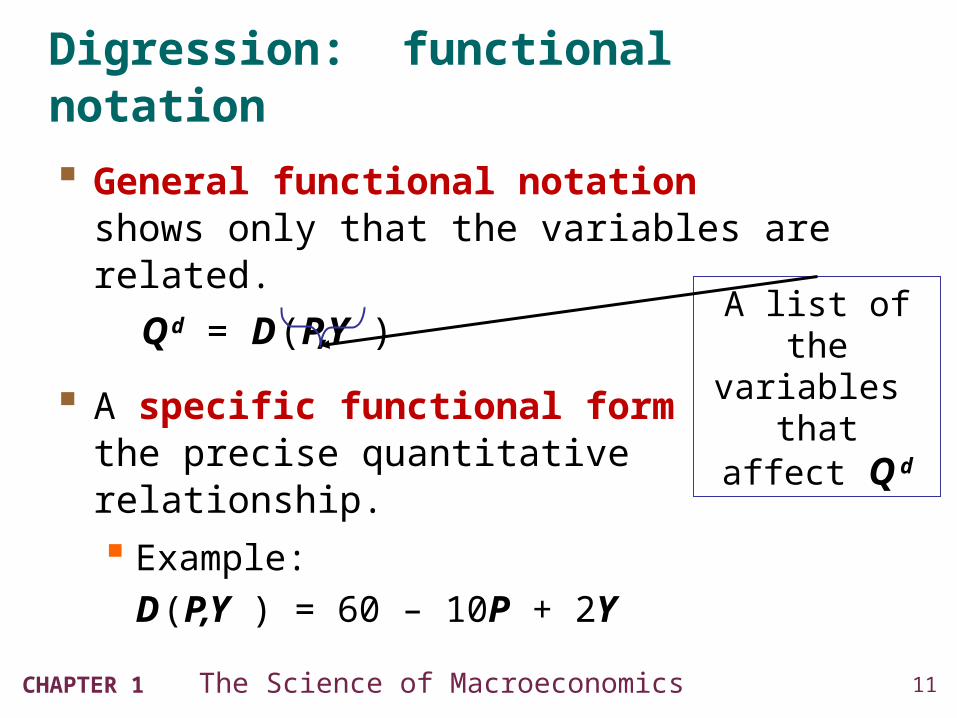
Digression: functional notation
General functional notation shows only that the variables are related.
Q d = D (P,Y )
A specific functional form shows the precise quantitative relationship.
Example:
D (P,Y ) = 60 – 10P + 2Y
A list of the variables
that affect Q d
12CHAPTER 1 The Science of Macroeconomics
The market for cars: Demand
Q Quantit
y of cars
P Price
of cars
D
The demand curve shows the relationship between quantity demanded and price, other things equal.
demand equation:
Q d = D (P,Y )
13CHAPTER 1 The Science of Macroeconomics
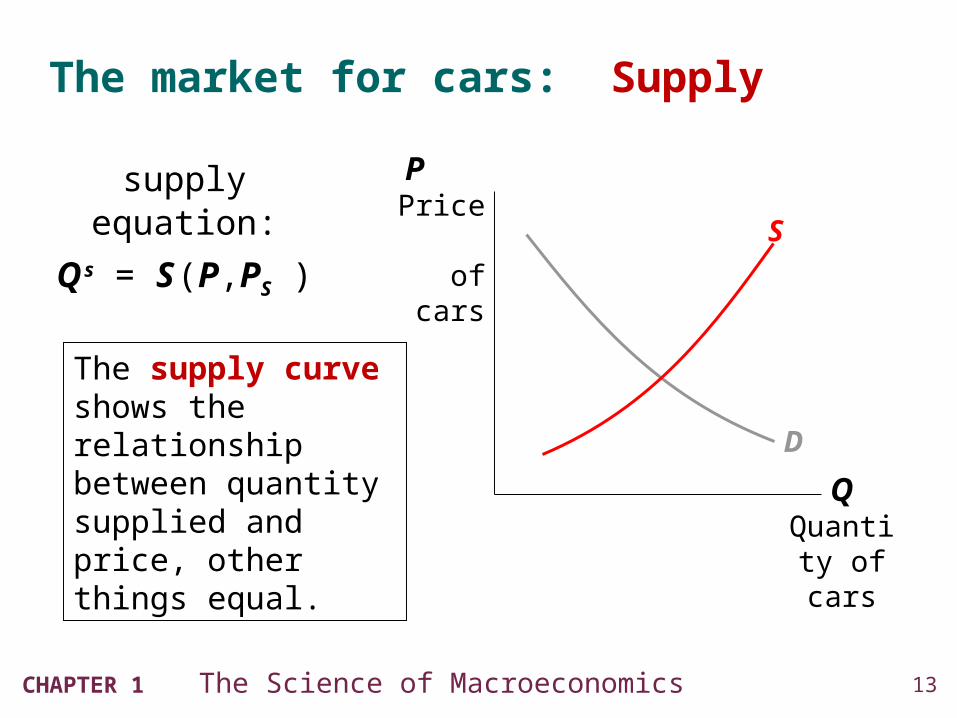
The market for cars: Supply
Q Quantit
y of cars
P Price
of cars
D
S
The supply curve shows the relationship between quantity supplied and price, other things equal.
supply equation:
Q s = S (P,PS )
14CHAPTER 1 The Science of Macroeconomics
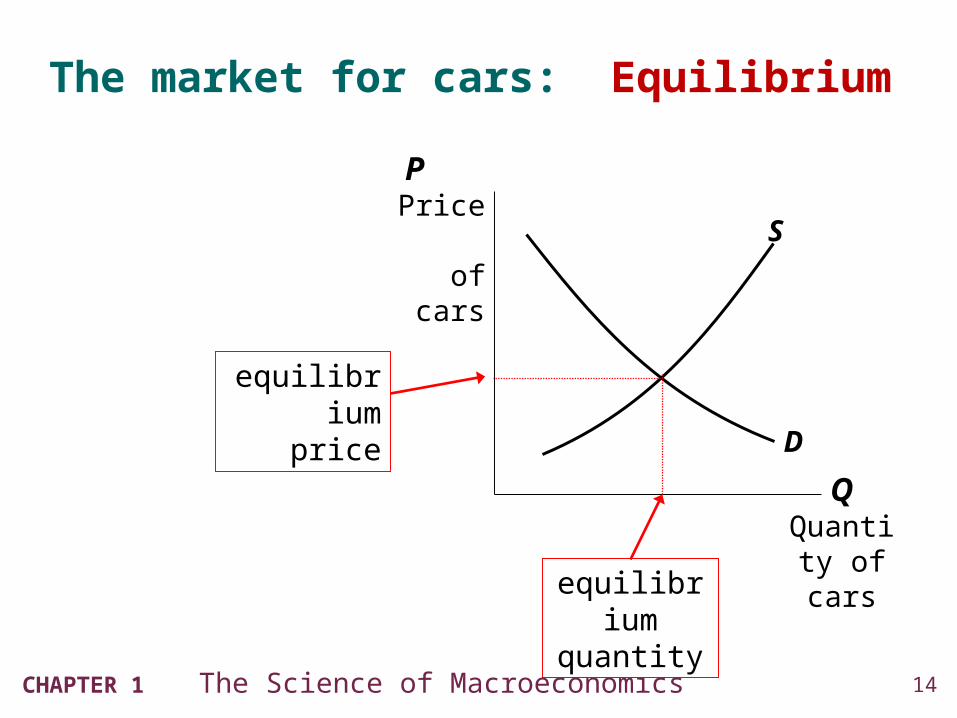
The market for cars: Equilibrium
Q Quantit
y of cars
P Price
of cars S
D
equilibrium price
equilibriumquantity
15CHAPTER 1 The Science of Macroeconomics
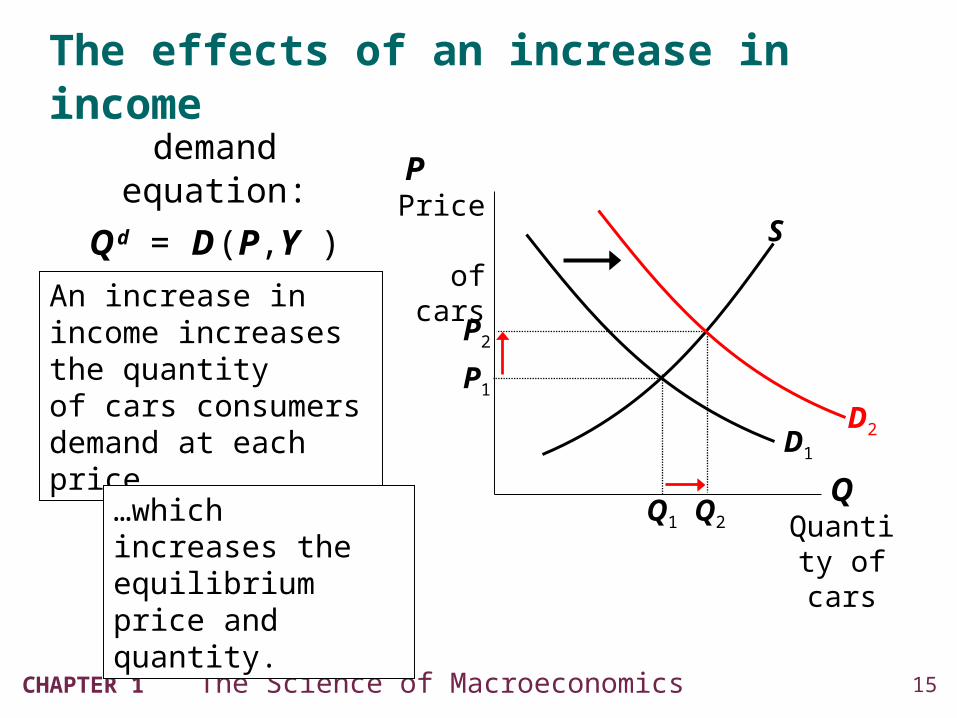
The effects of an increase in income
Q Quantit
y of cars
P Price
of cars S
D1
Q1
P1
An increase in income increases the quantity of cars consumers demand at each price…
…which increases the equilibrium price and quantity.
P2
Q2
D2
demand equation:
Q d = D (P,Y )
16CHAPTER 1 The Science of Macroeconomics
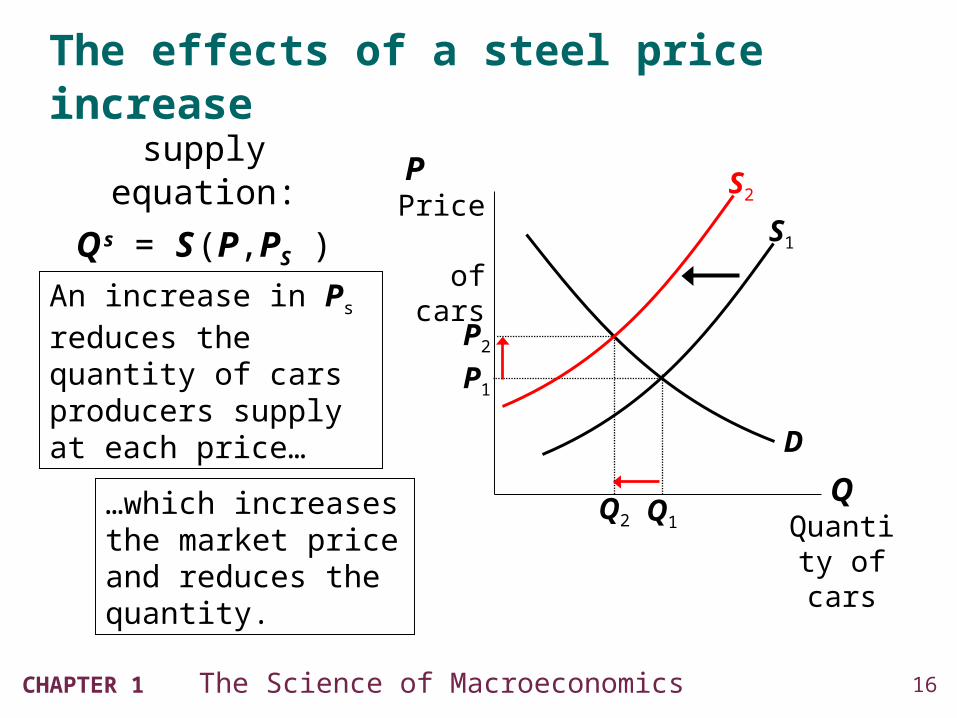
The effects of a steel price increase
Q Quantit
y of cars
P Price
of cars S1
D
Q1
P1
An increase in Ps reduces the quantity of cars producers supply at each price…
…which increases the market price and reduces the quantity.
P2
Q2
S2
supply equation:
Q s = S (P,PS )
17CHAPTER 1 The Science of Macroeconomics
Endogenous vs. exogenous variables The values of endogenous variables
are determined in the model.
The values of exogenous variables are determined outside the model: the model takes their values and behavior as given.
In the model of supply & demand for cars,
endogenous: P, Q d, Q
s
exogenous: Y, Ps
18CHAPTER 1 The Science of Macroeconomics
The use of multiple models
No one model can address all the issues we care about.
E.g., our supply-demand model of the car market… can tell us how a fall in aggregate income
affects price & quantity of cars. cannot tell us why aggregate income falls.
19CHAPTER 1 The Science of Macroeconomics
The use of multiple models
So we will learn different models for studying different issues (e.g., unemployment, inflation, long-run growth).
For each new model, you should keep track of its assumptions which variables are endogenous,
which are exogenous the questions it can help us understand,
those it cannot
20CHAPTER 1 The Science of Macroeconomics
Prices: flexible vs. sticky
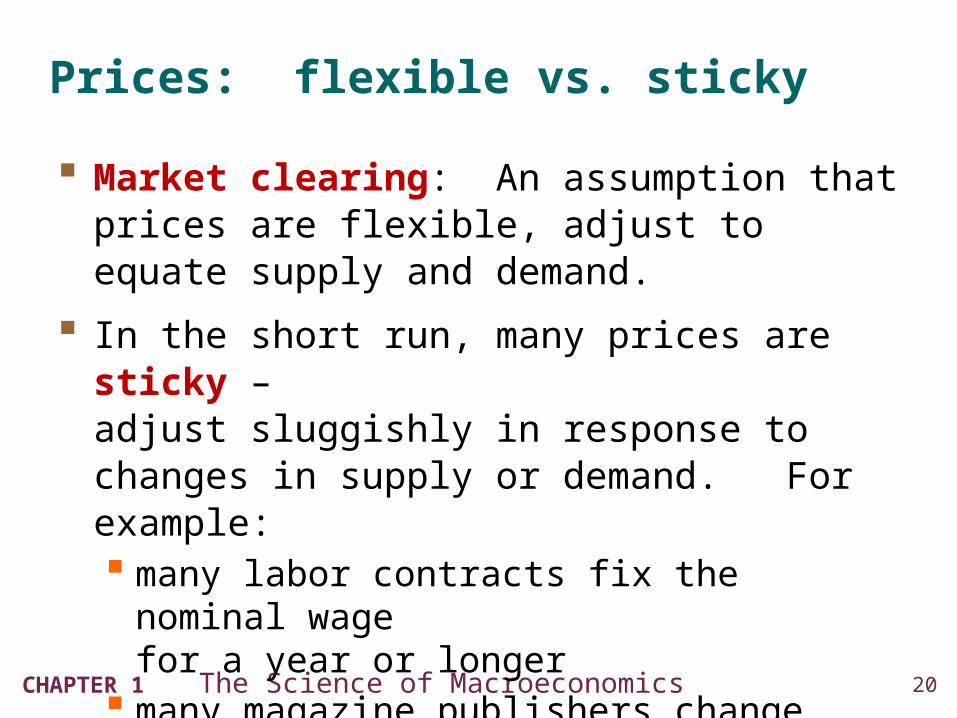
Market clearing: An assumption that prices are flexible, adjust to equate supply and demand.
In the short run, many prices are sticky – adjust sluggishly in response to changes in supply or demand. For example: many labor contracts fix the nominal wage
for a year or longer many magazine publishers change prices
only once every 3 to 4 years
21CHAPTER 1 The Science of Macroeconomics
Prices: flexible vs. sticky
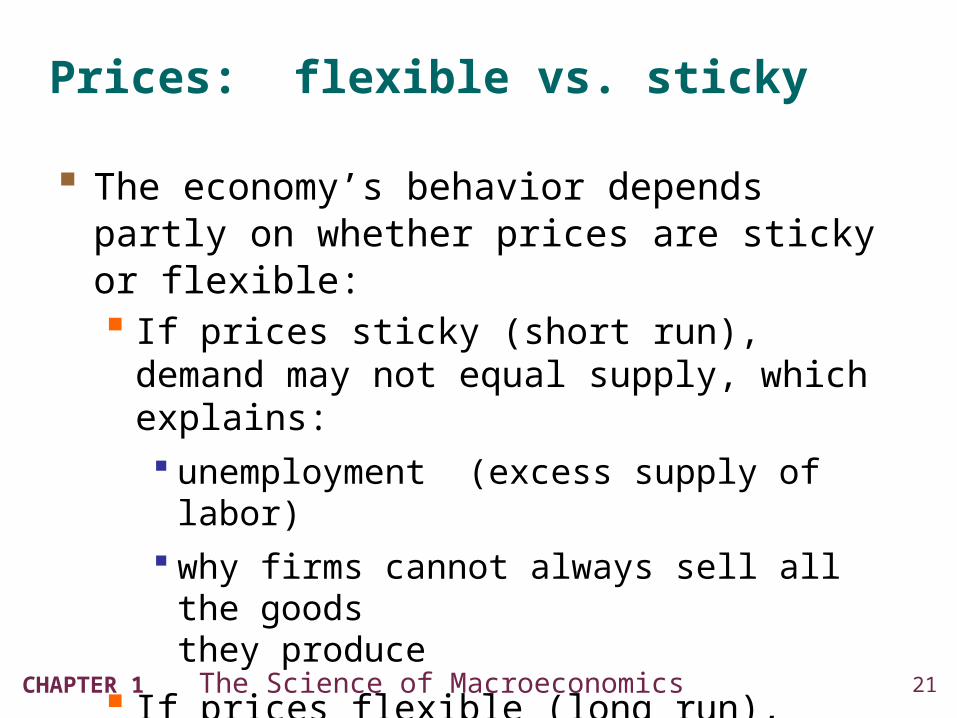
The economy’s behavior depends partly on whether prices are sticky or flexible: If prices sticky (short run),
demand may not equal supply, which explains: unemployment (excess supply of labor) why firms cannot always sell all the goods
they produce
If prices flexible (long run), markets clear and economy behaves very differently
22CHAPTER 1 The Science of Macroeconomics
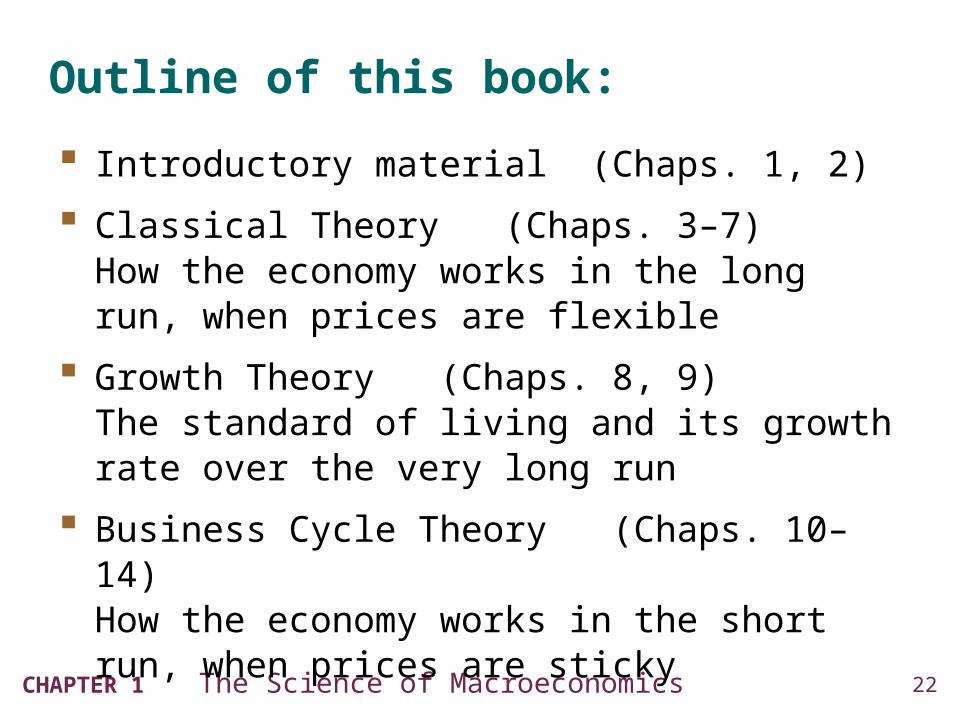
Outline of this book:
Introductory material (Chaps. 1, 2)
Classical Theory (Chaps. 3–7) How the economy works in the long run, when prices are flexible
Growth Theory (Chaps. 8, 9)The standard of living and its growth rate over the very long run
Business Cycle Theory (Chaps. 10–14)How the economy works in the short run, when prices are sticky
23CHAPTER 1 The Science of Macroeconomics
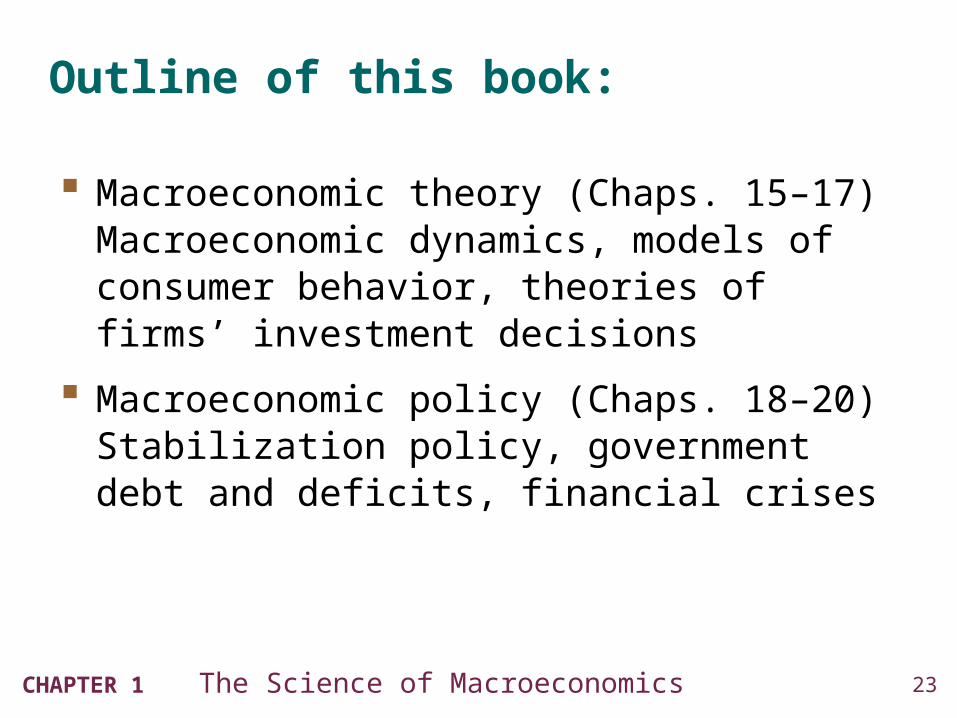
Outline of this book:
Macroeconomic theory (Chaps. 15–17)Macroeconomic dynamics, models of consumer behavior, theories of firms’ investment decisions
Macroeconomic policy (Chaps. 18–20)Stabilization policy, government debt and deficits, financial crises
C H A P T E R S U M M A R Y
Macroeconomics is the study of the economy as a whole, including growth in incomes changes in the overall level of prices the unemployment rate
Macroeconomists attempt to explain the economy and to devise policies to improve its performance.
24
C H A P T E R S U M M A R Y
Economists use different models to examine different issues.
Models with flexible prices describe the economy in the long run; models with sticky prices describe the economy in the short run.
Macroeconomic events and performance arise from many microeconomic transactions, so macroeconomics uses many of the tools of microeconomics.
25