Embed Size (px)
Citation preview
Abstract
The study seeks to explore the extent to which macroeconomic variables affect the stock marketbehavior in the emerging market of Malaysia in the post 1997 financial crisis period, usingthe latest time series econometrics technique to test for cointegration, namely, the Autoregres-sive Distributed Lag (ARDL) model. The estimation of results suggest that real effective ex-change rate, money supply, industrial production index, and federal funds rate seem to besuitable targets for the government to focus on, in order to stabilize the stock market and toencourage more capital flows into the economy. Changes in U.S. monetary policy as measuredby the changes in the federal funds rate seem to also have a significant direct impact on theMalaysian stock market behavior during the period of analysis. This implies that any changesin the U.S. monetary policy affect the Malaysian stock market.
Keywords: Macroeconomic variable; Stock market; Malaysia; ARDL
JEL Classification: C32, C53, G15
1. INTRODUCTION
The dynamic interactions between macroeconomic variables and stockmarket behavior have been well researched in the financial economics litera-ture. According to simple discounted present value model (Liljeblom andStenius, 1997; Ibrahim, 2002 and Ibrahim and Jusoh, 2001), stock prices aredetermined by the future cash flows to the firm and discounting rates.Changes in these factors which may be due to changes in macroeconomicvariables may in turn affect the stock market. In an open economy such as
449
MACROECONOMIC VARIABLES AND STOCK RETURNSIN MALAYSIA:AN APPLICATION OF THE ARDL BOUND TESTING APPROACH
ROSYLIN MOHD. YUSOF and M. SHABRI ABD. MAJID*
* Assistant Professors, Department of Economics, Kulliyyah of Economics and Manage-ment Sciences, International Islamic University Malaysia (IIUM).

the one in Malaysia, corporate cash flows are influenced by the changes inthe macroeconomic variables such as IPI, M3, changes in interest rate as wellas the exchange rate. However, in the past two decades growing efforts havebeen made by researchers to empirically calibrate these macroeconomic ef-fects. More studies are focused on developed markets such as the ones in theU.S., UK and the Japan. Examples of these studies are Fama (1981) and Chen(1991) for the US market, Hamao (1988) on the Japanese market, and Poonand Taylor (1992) on the UK market.
This paper extends the existing literature to address the question whetherlocal and foreign macroeconomic variables affect stock returns within thecontext of an emerging market. Emerging markets seem to have distin-guished features from those of the developed markets. Given the differentpolitical and economic structures, the risk and return profiles in these mar-kets seem to also differ. For instance, risks and returns in the emerging stockmarkets are found to be higher relative to the developed stock markets (Er-runza, 1983; Claessens et al., 1993; Harvey, 1995). In fact, in the recent years,more empirical evidences have been found, suggesting that emerging mar-kets are segmented from the developed markets (Goetzmann and Jorion,1999; Bilson et al., 2001). These studies support the view that emerging mar-kets now represent a feasible investment alternative for international in-vestors witnessing massive capital inflows into these markets.
Because the Kuala Lumpur Composite Index (KLCI) operates in differenteconomic, financial and political structures than the United States, the move-ment of stock prices may be different. It is possible that, given that the KLCIis of a smaller market capitalization than the U.S., it is more susceptible tospeculative activities and government interventions. From the investors’ per-ception, the question whether KLCI responds differently to macroeconomicvariables is of relevance.
The empirical question that we seek to explore is whether macroeconom-ic variables such as industrial production index (IPI), money supply M3, realeffective exchange rate (REER), interest rate (TBR) and Federal fund rates(FFR) are significant explanatory factors of stock market returns. According-ly, if these macroeconomic variables are significant and consistently priced inthe stock market returns, they should be cointegrated. Various methodolo-gies are employed to test the relationship between macroeconomic variablesand the stock market returns and more recent ones employ the time seriesanalysis within the VAR framework to test the presence of cointegrationamong the variables tested (Chen et al., 1986; Kwon and Shin, 1999; Ibrahim,1999; and Maysami and Koh, 2000).
The 1997 financial turmoil has directly affected the Malaysian stock mar-
SAVINGS AND DEVELOPMENT - No. 4 - 2007 - XXXI
450

ket. Many studies are conducted to examine the macroeconomic causes ofstock market behavior during the crisis. This also prompts researchers aswell as policy makers to re-examine the macroeconomic causes of stock mar-ket behavior during the post crisis period and to re-examine the transmissionmechanism by which the financial crisis may reinforce itself. In this paper weemploy a new estimation technique of ARDL approach to cointegration toexamine the long run stability between the macroeconomic variables andstock market returns in Malaysia for the 1997 post crisis period. A monthlydata, starting from May 1999 to February 2006, is used in the analysis.
The outline of this paper is as follows: section 2 presents a literature re-view; section 3 highlights the model specification and the estimation tech-nique; section 4 discusses the estimation results and finally, section 5 con-cludes the study.
2. LITERATURE REVIEW
The interactions between macroeconomic variables and stock prices havebeen extensively researched. For instance, Fama (1981) documents a signifi-cant relationship between stock returns and other macroeconomic variables,namely inflation, national output and industrial production. In their study,Nasseh and Strauss (2000) employ Johansen cointegration tests to investigatethe long-run relationship between stock prices and both domestic and inter-national economic activities in six European economies. They find that stockprice levels are significantly related to industrial production, short- andlong-term interest rates as well as foreign stock prices. Variance decomposi-tion methods support the strong explanatory power of macroeconomic vari-ables in contributing to the forecast variance of stock prices. Black and Fraser(2003) investigate deviations of U.S. stock prices from their value warrantedby expected growth in output. The time-varying risk model produces funda-mental prices that are closest to actual prices. The time-series characteristicsof deviations from fundamental value suggest that deviations are similarover different time horizons and observational frequency, and appear to bedriven by nonlinearities in the price–output relationship rather than irra-tional investor behaviour.
In addition, Theophano and Sunil (2006) examine the short run dynamicadjustments and the long run equilibrium relationships between selectedmacroeconomic variables, trading volume and stock returns in the emergingGreek stock market during the period 1990 to 1999. Empirical results showthat short run and long run equilibrium relationship exists between inflation,
R.M. YUSOF, M.S. ABD. MAJID - MACROECONOMIC VARIABLES AND STOCK RETURNS IN MALAYSIA
451

money supply and trading volume and the stock prices in the Athens stockexchange. No short run or long run equilibrium relationship is found be-tween the exchange rates and stock prices. The results of this research areconsistent with the theoretical arguments and practical developments thatoccurred in the Greek stock markets during the sample period. The results al-so imply that the market is informationally inefficient because publicly avail-able information on macroeconomic variables and trading volumes can bepotentially used in predicting stock prices. Taking the Korean economy as acase study, Kwon and Shin (2001) investigate whether current economic ac-tivities in the country can explain stock market returns by using a cointegra-tion test and a Granger causality test from a vector error correction model.They find that the Korean stock market reflects macroeconomic variables onstock price indices. The cointegration test and the vector error correctionmodel illustrate that stock price indices are cointegrated with a set of macro-economic variables–that is, the production index, exchange rate, trade bal-ance, and money supply–which provides a direct long-run equilibrium rela-tion with each stock price index. However, the stock price indices are not aleading indicator for economic variables; this is inconsistent with the previ-ous findings that the stock market rationally signals changes in real activities.
For ASEAN economies, Wongbangpo and Sharma (2002) investigate therole of selected macroeconomic variables, i.e., GNP, the consumer price index,the money supply, the interest rate, and the exchange rate on the stock pricesin five ASEAN countries (Indonesia, Malaysia, Philippines, Singapore, andThailand). The study observes long- and short-term relationships betweenstock prices and these macroeconomic variables. Moreover, the macroeco-nomic variables in these markets have bidirectional causality with the stockprices in the Granger sense. Since the stock prices interact with the keymacroeconomic variables in the short- and long-run, strategic governmenteconomic or financial policies can yield impressive gains in both the sectors.
The studies on the Malaysian economy on this topic have also been ex-tensively investigated (e.g., Habibullah, and Baharumshah, 1996; Habibullahet al., 1999; Ibrahim, 1999; and Ibrahim and Aziz, 2003). By employing theGranger non-causality test of Toda Yamamoto (1995), Habibullah et al. (1999)provide empirical evidence that KLSE stock prices has causal relationshipswith macroeconomic variables such as divisia money supply, national in-come, price level, interest rate and real effective exchange rate. Ibrahim(1999) investigates the dynamic interactions between seven macroeconomicvariables and the stock prices for an emerging market, Malaysia, using coin-tegration and Granger causality tests. The results strongly suggest informa-tional inefficiency in the Malaysian market. The bivariate analysis suggests
SAVINGS AND DEVELOPMENT - No. 4 - 2007 - XXXI
452

cointegration between the stock prices and three macroeconomic variables:consumer prices, credit aggregates and official reserves. From bivariate er-ror-correction models, we note the reactions of the stock prices to deviationsfrom the long run equilibrium. These results are confirmed when we extendthe analysis to multivariate settings. There is also evidence that the stockprices are Granger-caused by changes in the official reserves and exchangerates in the short run. Finally, Ibrahim and Aziz (2003) examine dynamiclinkages between stock prices and several macroeconomic variables in thecase of Malaysia using standard and well-accepted methods of cointegrationand vector autoregression. The findings of Ibrahim and Aziz (2003) were inline with Ibrahim’s (1999) earlier findings.
Looking at the above reviewed studies on the macroeconomic vari-ables–stock returns causal nexus, the studies have investigated both ad-vanced and emerging markets using different approaches. However, none ofthe studies reviewed above have investigated the dynamic interactions be-tween macroeconomic variables and stock returns adopting the ARDL, thelatest approach to cointegration during the post-1997 financial crisis periodin the Malaysian economy. This motivates the present study to adopt thenew estimation technique of ARDL approach to cointegration to examine thelong run stability between the macroeconomic variables and stock market re-turns in Malaysia during the post-1997 Asian financial turmoil.
3. MODEL SPECIFICATION AND ESTIMATION TECHNIQUES
Based on the ‘intuitive financial theory’ (Maysami and Koh, 2000, Gjerdeand Sættem, 1999), macroeconomic variables such as industrial productionindex (IPI), money supply M3, exchange rate and interest rate are hypothe-sized to affect stock market behavior. Uncovering this long run relationshipmay help gauge the predictability of the Malaysian equity market while pro-viding valuable information to investors as well as policymakers. The mon-ey supply–stock market nexus has been widely tested and debated due tothe belief that money supply changes have important and direct effects onstock prices through portfolio changes, and indirect effects through its im-pact on real consumption and investment activities.
Basically, the basis of our hypothesized model is the interrelationshipamong the four markets, i.e., the goods market, the money market, the labormarket and the security market. Following the literature in the analysis ofthe security market, this study excludes the labor market from the analysissince Walras’s law allows us to drop any one of these markets (Wongbangpo
R.M. YUSOF, M.S. ABD. MAJID - MACROECONOMIC VARIABLES AND STOCK RETURNS IN MALAYSIA
453

and Sharma, 2002). However, since Malaysia is an open economy, to examinethe international influence on the market we have included the U.S mone-tary policy variable as proxied by FFR. Following earlier studies (Chen et al.,1986; Mukherjee and Naka, 1995; Wongbangpo and Sharma, 2002; amongothers), the good market variable considered is IPI. The money market vari-ables considered are M3, TBR and FFR. The security market is representedby KLCI. Finally, as an external competitiveness measure, the REER is in-cluded in the model. We believe that for the trade oriented developingeconomies the exchange rate plays a significant role in the stock marketmovement. In short, these selected variables cover a wide range of macro-economic aspects. Thus, we explore the short- and long-run relationship be-tween the macroeconomic variables and stock market, by considering thefollowing two models:
lnKLCIt = a + b lnM3t + c lnIPIt + d lnREERt + e lnFFRt + εt (1)
lnKLCIt = a + b TBRt + c lnIPIt + d lnREERt + e lnFFRt + υt (2)
where KLCI is the Kuala Lumpur Composite Index; M3 is broad money sup-ply, TBR is Treasury Bill rates; IPI is industrial production index, REER is re-al effective exchange rate and FFR is Federal fund rates.
From the theoretical perspective, the effects of currency depreciation maybe positively or negatively related to stock prices. However, based on the in-tuitive financial theory (Maysami and Sim Koh, 2001; Gjerde and Saettem,1999), we hypothesize a positive relation between exchange rate and stockprices. Mukherjee and Naka (1995) and Wongbangpo and Sharma (2002)among others, indicate that both exchange rate levels and changes affect theperformance of a stock market. For an export dominated country, Mukherjeeand Naka (1995) suggest that currency depreciation will have a favorable im-pact on a domestic stock market. As the Malaysian Ringgit depreciatesagainst foreign currencies, products exported from Malaysia become cheaperin the world market. As a result, if the demand for these good is elastic, thevolume of exports from the country increases, which in turn causes highercash flows, profits and the stock prices of the domestic companies. The op-posite should happen, when the currency of the country appreciates againstforeign currencies.
According to the Monetary Portfolio Model (Rozeff, 1974), an increase ininterest rates raises the opportunity cost of holding cash and is likely to leadto a substitution effect between stock and other interest bearing securities.Thus, a decrease in interest rate, which may also be a result of an expansion-ary monetary policy, will increase the price of the stocks and subsequently
SAVINGS AND DEVELOPMENT - No. 4 - 2007 - XXXI
454

increase their returns. This study hypothesizes a negative relation betweeninterest rates and stock prices. The intuition behind this relationship isstraightforward. An increase in interest rates raises the opportunity cost ofholding cash and is likely to lead to a substitution effect between stock andother interest bearing securities. We also hypothesize that the FFR and stockprices will move in the opposite direction as interest rates do.
The Stock Valuation Model is generally concerned with the factors whichaffect the average stock price of all firms. From this valuation model, an in-crease in money supply leads to an increase in the expected dividends and inturn, increases the stock prices, assuming the interest rate remains un-changed. The effect of money supply on stock prices, however, can be posi-tive or negative. Since the rate of inflation is positively related to moneygrowth rate (Fama, 1981), an increase in the money supply may lead to anincrease in the discount rate and lower stock prices. However, this negativeeffect may be countered by the economic stimulus provided by moneygrowth, which would likely increase cash flows and stock prices (Mukherjeeand Naka, 1995).
Finally, following Geske and Roll (1983), Chen et al. (1986), Wongbangpoand Sharma (2002), we hypothesize a positive relation between stock pricesand industrial production index. The levels of real economic activity (prox-ied by IPI) will likely influence stock prices in the same direction, through itsimpact on corporate profitability: an increase in output may increase expect-ed future cash and, hence, raise stock prices, while the opposite effect wouldbe valid in a recession.
The Autoregressive Distributed Lag (ARDL) approach adopted in thisstudy was introduced by Pesaran et al. (1996). The ARDL has numerous ad-vantages. Unlike the most widely used method for testing cointegration –the residual-based Engle-Granger (1987) and maximum likelihood-based Jo-hansen (1988; 1991) and Johansen-Juselius (1990) tests, the ARDL approachcan be applied regardless of the stationary properties of the variables in thesamples and allows for inferences on long-run estimates, which is not possi-ble under the alternative cointegration procedure. In other words, this proce-dure can be applied irrespective of whether the series are I(0), I(1), or frac-tionally integrated (Pesaran and Pesaran, 1997 and Bahmani-Oskooee andNg, 2002), thus avoids problems resulting from non-stationary time seriesdata (Laurenceson and Chai, 2003).
Another advantage of this approach is that the model takes sufficientnumbers of lags to capture the data generating process in a general-to-specif-ic modeling framework (Laurenceson and Chai, 2003). The ARDL methodestimates (p+1)k number of regressions in order to obtain optimal lag-length
R.M. YUSOF, M.S. ABD. MAJID - MACROECONOMIC VARIABLES AND STOCK RETURNS IN MALAYSIA
455
for each variable, where p is the maximum lag to be used and k is the num-ber of variables in the equation. The model can be selected using the modelselected criteria like Adjusted R2, Akaike Information Criteria (AIC) andSchwartz-Bayesian Criteria (SBC). SBC is known as the parsimonious model(selecting the smallest lag-length), whereas AIC and adjusted R2 are knownfor selecting the maximum relevant lag-length. This study reports the mod-els based on these three-criteria. Finally, the ARDL approach provides robustresults for a smaller sample size of cointegration analysis. Since the sampleof our study is small, this provides additional motivation for the study toadopt this approach.
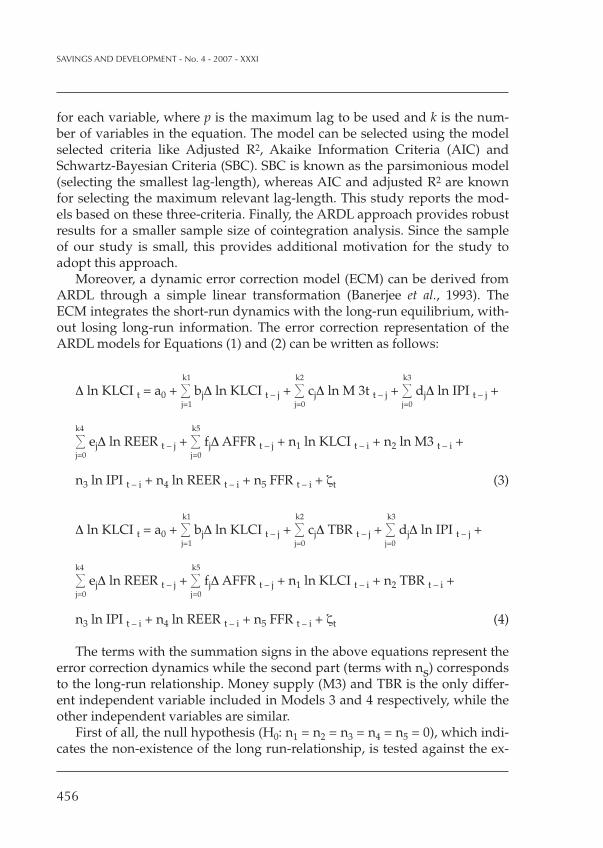
Moreover, a dynamic error correction model (ECM) can be derived fromARDL through a simple linear transformation (Banerjee et al., 1993). TheECM integrates the short-run dynamics with the long-run equilibrium, with-out losing long-run information. The error correction representation of theARDL models for Equations (1) and (2) can be written as follows:
k1 k2 k3
Δ ln KLCI t = a0 + � bjΔ ln KLCI t – j + � cjΔ ln M 3t t – j + � djΔ ln IPI t – j +j=1 j=0 j=0
k4 k5
� ejΔ ln REER t – j + � fjΔ AFFR t – j + n1 ln KLCI t – i + n2 ln M3 t – i +j=0 j=0
n3 ln IPI t – i + n4 ln REER t – i + n5 FFR t – i + ζt (3)
k1 k2 k3
Δ ln KLCI t = a0 + � bjΔ ln KLCI t – j + � cjΔ TBR t – j + � djΔ ln IPI t – j +j=1 j=0 j=0
k4 k5
� ejΔ ln REER t – j + � fjΔ AFFR t – j + n1 ln KLCI t – i + n2 TBR t – i +j=0 j=0
n3 ln IPI t – i + n4 ln REER t – i + n5 FFR t – i + ζt (4)
The terms with the summation signs in the above equations represent theerror correction dynamics while the second part (terms with ns) correspondsto the long-run relationship. Money supply (M3) and TBR is the only differ-ent independent variable included in Models 3 and 4 respectively, while theother independent variables are similar.
First of all, the null hypothesis (H0: n1 = n2 = n3 = n4 = n5 = 0), which indi-cates the non-existence of the long run-relationship, is tested against the ex-
SAVINGS AND DEVELOPMENT - No. 4 - 2007 - XXXI
456

istence of a long-run relationship. The calculated F-statistics of the null hy-pothesis of no cointegration is compared with the critical value tabulated byNarayan (2004). If the computed F-statistic falls above the upper bound criti-cal value, the null hypothesis of no cointegration is rejected. Likewise, if thetest statistic falls below a lower bound, the null hypothesis cannot be reject-ed. Finally, if it falls inside the critical value band, the result would be incon-clusive. Once cointegration is confirmed, the long-run relationship betweenstock market and macroeconomic variables using the selected ARDL modelsare estimated. The last step of ARDL is to estimate the associated ARDL er-ror correction models. Finally, to ascertain the goodness of fit of the selectedARDL model, the diagnostic and the stability tests are conducted. The struc-tural stability test is conducted by employing the cumulative sum of recur-sive residuals (CUSUM) and the cumulative sum of squares of recursiveresiduals (CUSUMSQ).
4. ESTIMATION RESULTS
Equations (1) and (2) are estimated for Malaysia using monthly data overthe period 1999:05 to 2006:02. In the process of testing for cointegration, it isimportant that we determine the order of lags on the first differenced vari-ables. Bahmani-Oskooee and Bohl (2000) suggest that the results of this firststep are usually sensitive to the order of VAR. We therefore impose lag or-ders of 1-12 on the first difference of each variable and compute the F-statis-tics for the joint significance of lagged levels of variables. The computed F-statistics for each order of lags, together with critical values proposed byNarayan (2004), are reported in Table 1. As evident in Table 1, the computedF-statistics for Model (with M3) are significant at 90% for lag orders 4, 5, 6and 11. However, for Model 2 (with TBR), only the lag order of 9 is found tobe significant. For Model 1 we employ the lag order of 6 due to its highest F-statistics value, while lag order of 9 is employed for Model 2.
In the second part of the analysis, we use the determined lag orders toestimate Equations (3) and (4) according to the appropriate lag length criteriasuch as adjusted R-squared, Akaike’s Information Criteria (AIC) andSchwartz-Bayesian Criteria (SBC). Based on the results evident in Table 2, thecointegration test indicates that a set of macroeconomic variables namely, M3,IPI, REER, and FFR (Model 1) and TBR, IPI, REER and FFR (Model 2) arecointegrated with the stock market index in Malaysia over the period ofanalysis. Individually, only IPI and TBR are found insignificant for Model 1and 2, respectively. Combining both models based on different lag-length cri-
R.M. YUSOF, M.S. ABD. MAJID - MACROECONOMIC VARIABLES AND STOCK RETURNS IN MALAYSIA
457

teria, we found that only TBR is not significant in the long run. However, ashighlighted by Kwon and Shin (1999), a cointegration relation between stockprice index and any single macroeconomic variable is not expected, as thestock returns are in fact, a linear function of some macroeconomic variables.
This finding seems to be consistent (at least for three variables) with thestudy of Kwon and Shin (1999) on the Korean stock market. For the periodJanuary 1980 to December 1992, Kwon and Shin (1999) find that stock mar-ket indexes are cointegrated with a set of macroeconomic variables; namely,the foreign exchange rate, the trade balance, money supply and productionindex. Meanwhile, somewhat similar findings are reported for the Singaporestock market. Mookerjee and Yu (1997) find that stock prices are cointegratedwith money supply (both M1 and M2) and foreign exchange reserves. Animportant implication derived is that these markets (Malaysian, Korean andSingapore) are sensitive to a different set of macroeconomic variables com-pared to more mature markets such as the US and Japanese ones. The U.Sand Japanese stock markets are found to be more sensitive to inflationaryvariables such as a change in unexpected inflation, expected inflation, risk
SAVINGS AND DEVELOPMENT - No. 4 - 2007 - XXXI
458
Order of Lag Model 1: Model 2:
1 2.9617 2.7064
2 2.3717 2.3239
3 2.1881 2.3938
4 3.5532*** 2.9341
5 3.5160*** 2.1281
6 3.5551*** 2.3463
7 1.6383 1.6757
8 2.2285 3.1633
9 2.5524 3.2785***
10 0.95451 1.3458
11 3.2865*** 1.7352
12 0.56551 1.7490
Table 1. F-Statistics for Testing the Existence of a Long-Run Relationship
Note: The relevant critical value bounds are given in Appendices A1-A3 for Case II: with a restricted inter-cept and no trend; number of regressor = 4 (Narayan (2004). They are 3.608 – 4.860 at the 99% significancelevel, 2.725 – 3.718 at the 95% significance level and 2.320 – 3.232 at the 90% significance level. ** and ***denotes that F-Statistics falls above the 95% and 90% upper bound, respectively.

premium and term structure (Burmeister and Wall, 1986; Chen et al., 1986;Hamao, 1988; Chen, 1991). This further implies that the investment percep-tion in the Malaysian market is different from that of more mature marketsand that different strategies may be required in managing the portfolio ofMalaysian stocks.
As hypothesized, money supply M3 is found to be positively related tothe changes in stock prices. An increase in the growth of money supply in-creases a firm’s cash flow thereby increases the stock price (Mukherjee andNaka, 1995). Among the many macroeconomic variables, the money-stockmarket nexus has been widely researched because money supply changeshave direct effects through portfolio changes, as well as through their indi-rect effects on real economic activity (Habibullah et al., 1999). Most of thesestudies provide evidence that money supply and the stock market are in-deed related. Examples of these studies include Lin (1993), Habibullah andBaharumshah (1996).
For what concerns the stock price and exchange rate, the present studyfinds a negative relationship between the variables. This supports the viewthat when a currency depreciates, our exports are cheaper and this in turncauses an increase in the firm’s profitability and therefore the value of thestock, while domestic exporters have incentive to raise the Ringgit prices astheir products become cheaper in foreign currencies. This indicates that theeffect of fluctuating Ringgit value on corporate profits in Malaysia could betransmitted either through the domestic currency price or the foreign curren-cy price. Existing studies on the effects of exchange rate and stock pricesseem to indicate mixed results. For Malaysia, Ibrahim and Wan Yusof (2001)reports a negative net effect of the exchange rate on the stock prices. Similarresults are also documented for Korean stock prices (Kwon and Shin, 1999)and the U.S market (Kim and Davidson, 1996; and Kim, 2003),1 while Mook-erjee and Yu (1997) report consistent finding with our study where the net ef-fect of the exchange rate on stock prices is positive (for both the expectedand the unanticipated exchange rates).
For FFR as in Models 1 and 2 (Table 2), it has a positive relation to stockmarket indexes. This finding echoes the study on Singapore stock market(Maysami and Koh, 2000) and other markets like Japan and US (Bulmashand Trivoli, 1991 and Mukherjee and Naka, 1995). The Singapore stock mar-ket is found to have a positive relationship with short term interest rates and
R.M. YUSOF, M.S. ABD. MAJID - MACROECONOMIC VARIABLES AND STOCK RETURNS IN MALAYSIA
459
1 For a more comprehensive and excellent discussion on the total effects of exchange rate onstock prices, please refer to Kim (2003; pp. 4-5).

is negatively related to long term interest rates. As explained by Mukherjeeand Naka (1995), long term interest rates seem to be a better proxy for thenominal risk free component of the discount rate in Stock Valuation Models.Conversely Bulmash and Trivoli (1991) suggest that the long term interestrate is a proxy for expected inflation that is incorporated in the discount rate.For Hong Kong, however, Mok (1993) finds that interest rates and stock re-turns are independent, while Habibullah et al. (1999) report a significant rela-tionship between interest rates and stock returns for Malaysian stock marketfor the period before 1997 financial crisis.
Based on Model 2 (Table 2), the IPI is found to have positive effect on thestock market at 5% significance level. This should be expected, given thatstock prices should serve as a barometer of the health of the economy. Ac-cordingly, changes in industrial production may affect the firm’s expectedfuture cash flows and, in turn, affect stock prices.
SAVINGS AND DEVELOPMENT - No. 4 - 2007 - XXXI
460
Table 2. Long-Run Coefficient Estimates of Stock Market
Model Selection Criterion
Model 1: Model 2:
Adjusted R2 AIC SBC Adjusted R2 AIC SBC(0,2,5,0,4) (0,2,5,0,4) (0,0,0,0,0) (4,5,6,8,8) (4,6,6,8,8) (0,0,0,0,0)
lnM31.5540** 1.5540** .49436(2.1597) (2.1597) (1.2812)
– – –
TBR – – –.014946 -.011684 -.094150(.19485) (-.15181) (-.85433)
lnIPI-1.3189 -1.3189 -.62547 .88523** .86763** .16497
(-1.6690) (-1.6690) (-1.2095) (2.3314) (2.4262) (.48477)
lnREER-1.3766*** -1.3766*** -1.4087** -.51960 -.53179 -.60610(-1.7150) (-1.7150) (-1.9515) (-.61486) (-.66835) (-.62419)
FFR.053641* .053641* .012447 .056971* .057450* 0064501(3.0374) (3.0374) (1.0203) (2.7901) (2.9890) .(.44448)
Constant-1.5909 -1.5909 9.5293*** 4.6729 4.8769 8.9015
(-.22832) (-.22832) (1.8361) (.84560) (.93631) (1.5933)
Note: Figures inside the parenthesis are the value of t-ratios. *, ** and *** denotes significance levels at 1%,5% and 10%, respectively.
Regressors
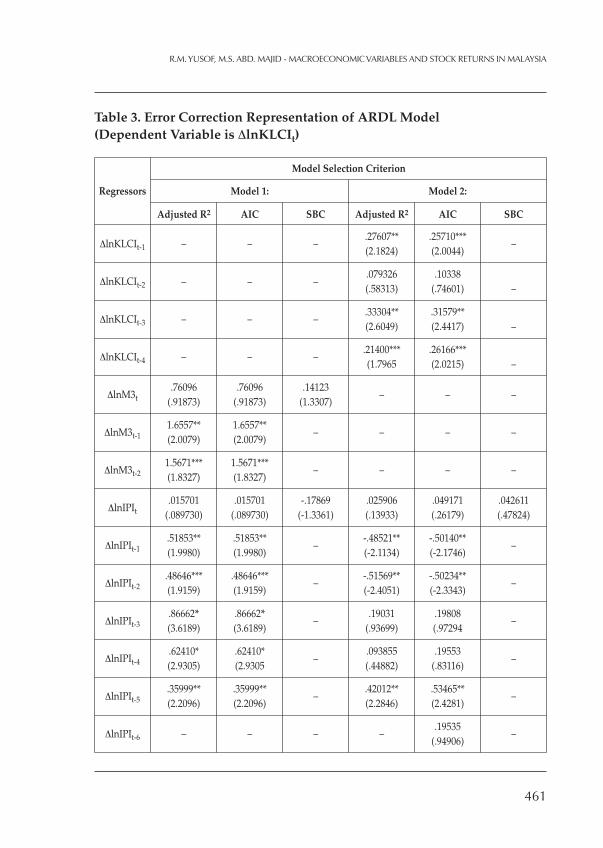
Table 3. Error Correction Representation of ARDL Model(Dependent Variable is ΔlnKLCIt)
R.M. YUSOF, M.S. ABD. MAJID - MACROECONOMIC VARIABLES AND STOCK RETURNS IN MALAYSIA
461
Model 1: Model 2:
Model Selection Criterion
Adjusted R2 AIC SBC Adjusted R2 AIC SBC
ΔlnKLCIt-1 – – –.27607** .25710***
–(2.1824) (2.0044)
ΔlnKLCIt-2 – – –.079326 .10338(.58313) (.74601) –
ΔlnKLCIt-3 – – –.33304** .31579**(2.6049) (2.4417) –
ΔlnKLCIt-4 – – –.21400*** .26166***(1.7965 (2.0215) –
ΔlnM3t.76096 .76096 .14123
(.91873) (.91873) (1.3307)– – –
ΔlnM3t-11.6557** 1.6557**(2.0079) (2.0079)
– – – –
ΔlnM3t-21.5671*** 1.5671***(1.8327) (1.8327)
– – – –
ΔlnIPIt.015701 .015701 -.17869 .025906 .049171 .042611
(.089730) (.089730) (-1.3361) (.13933) (.26179) (.47824)
ΔlnIPIt-1.51853** .51853** -.48521** -.50140**(1.9980) (1.9980)
–(-2.1134) (-2.1746)
–
ΔlnIPIt-2.48646*** .48646*** -.51569** -.50234**(1.9159) (1.9159)
–(-2.4051) (-2.3343)
–
ΔlnIPIt-3.86662* .86662* .19031 .19808(3.6189) (3.6189)
–(.93699) (.97294
–
ΔlnIPIt-4.62410* .62410* .093855 .19553(2.9305) (2.9305
–(.44882) (.83116)
–
ΔlnIPIt-5.35999** .35999** .42012** .53465**(2.2096) (2.2096)
–(2.2846) (2.4281)
–
ΔlnIPIt-6 – – – –.19535
(.94906)–
Regressors

SAVINGS AND DEVELOPMENT - No. 4 - 2007 - XXXI
462
Table 3. Continued
Model 1: Model 2:
Model Selection Criterion
Adjusted R2 AIC SBC Adjusted R2 AIC SBC
ΔTBRt – – –-.069854*** -.07087*** -.024319
(-1.9222) (-1.9463) (-.84385)
ΔTBRt-1 – – –.0028913 .0065848.054421 (.12342)
–
ΔTBRt-2 – – –-.070390 -.054239(-1.3225 (-.96927)
–
ΔTBRt-3 – – –-.0068984 -.010536(-.13598) (-.20678)
–
ΔTBRt-4 – – – -.024255 -.0076849(-.50585) (-.15039)
–
ΔTBRt-5 – – –.061796 .061330(1.4627) (1.4493)
–
ΔTBRt-6 – – –.069839*** .073530***
(1.9353) (2.0227)–
ΔlnREERt-.38181*** -.38181*** -.40247*** .37831 .30956 -.15656(-1.6724) (-1.6724) (-1.8156) (.57089) (.46367) (-.59278)
ΔlnREERt-1 – – –-.76757 .69905
(-.87500) (-.79298)–
ΔlnREERt-2 – – –-.20849 -.37448
(-.23947) (-.42106)–
ΔlnREERt-3 – – –.31249 .47054
(.34729) (.51344)–
ΔlnREERt-4 -– – –-.74547 -.85333
(-.92324) (-1.0449)–
ΔlnREERt-5 – – –-1.8003** -1.7741**(-2.1617) (-2.1258)
–
ΔlnREERt-6 – – –-.55710 -.68818
(-.75258) (-.91252)–
ΔlnREERt-7 – – –-1.2779*** -1.2619***(-1.8401) (-1.8137)
–
Regressors

Table 3. Continued
R.M. YUSOF, M.S. ABD. MAJID - MACROECONOMIC VARIABLES AND STOCK RETURNS IN MALAYSIA
463
Model 1: Model 2:
Model Selection Criterion
Adjusted R2 AIC SBC Adjusted R2 AIC SBC
ΔlnREERt-8 – – –.86253 .87946
(1.2448) (1.2669)–
ΔFFRt.12540* .12540* .14576* .16308* .16323* .12324*(3.0108) (3.0108) (3.8742) (3.1198) (3.1179) (3.1114)
ΔFFRt-1.029216 .029216 .029216 .089375(.63307) (.63307
–(1.4112) (1.5348)
–
ΔFFRt-2-.016602 -.016602 .091407 .081974(-.31898) (-.31898)
–(1.4403) (1.2742)
–
ΔFFRt-3-.051666 .051666 -.048498 -.034448(-1.0221) (-1.0221)
–(-.82208) (-.56554
–
ΔFFRt-4-.12114** -.12114** -.047739 -.065115(-2.574) (-2.574)
–(-.93182) (-1.1952)
–
ΔFFRt-5 – –– -.0094567 -.0090844
(-.18393) (-.17641)–
ΔFFRt-6 – – –-.024644 -.026178(-.49313) (-.52273)
–
ΔFFRt-7 – – –-.10524** -.11983**(-2.3010 (-2.4800)
–
ΔFFRt-8 – – –-.11986** -.12237**(-2.4486) (-2.4924)
–
Constant-.44124 -.44124 2.7225*** 2.8205 3.1334 2.2992
(-.23408) (-.23408) (1.6578) (.85207) (.94049) (1.3623)
ECt-1-.27736* -.27736* -.28569* -.60359* -.64251* -.25830*(-3.4363) (-3.4363) (-3.8066) (-4.8809) (-4.9247) (-3.3056)
Adjusted R2 .36713 .36713 .21711 .51143 .50991 .15819
F-Statistics 3.9067 3.9067 5.3597 3.2047 3.1328 3.9060
DW-Statistics 1.9193 1.9193 1.8133 2.0426 1.9675 1.8257
Note: Figures inside the parenthesis are the value of t-ratios. *, ** and *** denotes significance levels at 1%,5% and 10%, respectively.
Regressors

We further estimate the error correction representations selected by Ad-justed R-squared, AIC and SBC for both of our models. The results are pre-sented in Table 3. The long run coefficients generated in Table 3 are used togenerate the error correction terms for the two models. The adjusted R-squared are 0.37 (R-Squared), 0.37 (AIC) and 0.22 (SBC) respectively forModel 1. For Model 2, the adjusted R-squared are 0.51 (R-Squared), 0.51(AIC) and 0.16 (SBC) respectively. As indicated in Table 3, the error correc-tion representations carry negative signs and are highly significant for bothmodels based on all the lag length criteria. This therefore substantiates ourearlier findings that M3, IPI, REER, TBR and FFR are cointegrated with stockreturns as provided by the F-test. Furthermore, the speed of adjustment forall the models is rather fast, ranging from 26 to 65 percent. This indicatesthat the last period disequilibrium is, on average, corrected by about 26 to 65percent in the following month.
Finally, we examine the stability of the long run coefficients together withthe short run dynamics based on Pesaran and Pesaran (1997) and therefore
SAVINGS AND DEVELOPMENT - No. 4 - 2007 - XXXI
464
Figure 1. Plots of CUSUM and CUSUMSQ Statistics for Coefficient Stability(Model 1)

we apply CUSUM and CUSUMSQ (proposed by Brown et al., 1975). Thetests are applied to all the six models in Tables 2 and 3. The CUSUM test ba-sically uses the cumulative sum of recursive residuals based the first set of nobservations and is updated recursively and then plotted against the breakpoints. If the plot of CUSUM remains within the critical bounds at 5% signif-icance level (represented by clear and straight lines drawn at 5%, the null hy-pothesis that all the coefficients and the error correction model are stablecannot be rejected. However, if the two lines are crossed, the null hypothesisof coefficient constancy can be rejected at 5%. The same analysis applies forCUSUMSQ test, which is based on the squared recursive residuals.
Figures 1 and 2 show the graphical representations of CUSUM andCUSUMSQ plot applied error correction model based on the Adjusted R-squared criterion. Neither the CUSUM nor CUSUMSQ indicate evidence ofany structural instability for the models that we have tested. The Durbin-Watson (D-W) statistics also indicate that there is no problem of autocorrela-tion for all models tested.
R.M. YUSOF, M.S. ABD. MAJID - MACROECONOMIC VARIABLES AND STOCK RETURNS IN MALAYSIA
465
Figure 2. Plots of CUSUM and CUSUMSQ Statistics for Coefficient Stability(Model 2)

5. CONCLUSION
The study examines both the short- and long-run dynamics between themacroeconomic variables and stock market behavior in Malaysia during thepost 1997 financial crisis. Based on the analysis, the inclusion of money sup-ply M3, IPI, TBR, REER and FFR enhance the predictability measure of theMalaysian stock market.
Money supply M3, IPI, and REER seem to be suitable targets for the gov-ernment to focus on, in order to stabilize the stock market and encouragemore capital flows into the capital market. Changes in U.S. monetary policy,as measured by the changes in the FFR, seem also to have a significant directimpact on the Malaysian stock market behavior during the period of analy-sis. This implies that any changes in the US monetary policy may affect theMalaysian stock market. As a small open economy, Malaysia remains sus-ceptible to external influence like the changes in the US economy. Thismay be perceived as a channel through which the stock market shocks ofmore developed markets are being transmitted to an emerging market likeMalaysia.
The results of this study are limited to the post 1997 financial crisis perioduntil the beginning of the year 2006 for a small open economy, Malaysia. In-corporating a longer sample period and other macroeconomic variables thatmay potentially affect stock market might enhance further analyses.
References
Bahmani-Oskooee M. and M.T. Bohl, 2000, “German monetary unification and thestability of the German M3 money demand function”, Economics Letters, 66, pp.203-208.
Bahmani-Oskooee M. and R.C.W. Ng, 2002, “Long-run demand for money in HongKong: An application of the ARDL model”, International Journal of Business andEconomics, 1(2), pp. 147-155.
Banerjee A., J.J. Dolado, J.W. Galbraith and D. F. Hendry, 1993, Cointegration, Error-Correction and the Econometric analysis of Non-stationary Data, United Kingdom: Ox-ford University Press.
Bilson, C.M., T.J. Brailsford and V.J. Hooper, 2001, “Selecting macroeconomic vari-ables as explanatory factors of emerging stock market returns”, Pacific-BasinFinance Journal, 9, pp. 401-426.
Black A. and P. Fraser, 2003, “U.S. stock prices and macroeconomic fundamentals”,International Review of Economics & Finance. 12(3), pp. 345-367.
SAVINGS AND DEVELOPMENT - No. 4 - 2007 - XXXI
466

Brown R.L., J. Durbin and J.M. Evans, 1975, “Techniques for testing the constancy ofregression relations over time”, Journal of the Royal Statistical Society, 37, pp. 149-192.
Bulmash S. and G. Trivoli, 1991, “Time-lagged interactions between stock prices andselected variables”, The Journal of Portfolio Management, pp. 61-67.
Burmeister, E. and K.D. Wall, 1986, “The arbitrage pricing theory and macroeconomicfactor measures”, Finance Review, 21, pp. 1-20.
Chen N.F., 1991, “Financial investment opportunities and the macroeconomy”, Jour-nal of Finance, 46, pp. 529-554.
Chen N.F., R. Roll and S. Ross, 1986, “Economics forces and the stock market”, Journalof Business, 59(3), pp. 383-403.
Claessens, S., S. Dasgupta and J. Glen, 1993, “Return behaviour in emerging stockmarkets”, World Bank Economic Review, 9, pp. 131-152.
Engle R.F. and C.W.J. Granger, 1987, “Cointegration and error correction: representa-tion, estimation and testing”, Econometrica, 55(2), pp. 251-276.
Errunza V., 1983, “Emerging markets: A new opportunity for improving global port-folio performance”, Financial Analysis Journal, 39, pp. 51-58.
Fama E.F., 1981, “Stock returns, real activity, inflation, and money”, The AmericanEconomic Review, 71(4), pp. 545-565.
Geske R. and R. Roll, 1983, “The fiscal and monetary linkage between stock returnsand inflation”, Journal of Finance, 38, pp. 7-33.
Gjerde, Ø. and F. Sættem, 1999, “Causal relations among stock returns and macroeco-nomic variables in a small, open economy”, Journal of International Financial Mar-kets, Institutions & Money, 9, pp. 61-74.
Goetzmann W.N. and P. Jorion, 1999, “Re-emerging markets”, Journal of Financial andQuantitative Analysis, 34, pp. 1-32.
Habibullah, M. and A.Z. Baharumshah, 1996, “Money, output and stock prices inMalaysia: An application of the cointegration tests”, International Economic Journal,10 (2), pp. 121-130.
Habibullah M., A.Z. Baharumshah, A. Mohamed and W.A.S. Wan Ngah, 1999, “Stockmarket and economic activity: A causal analysis”, Proceeding of the Annual FEPSeminar on the Malaysian Economy and Management: Into the Next Millennium. De-partment of Economics, Universiti Putra Malaysia.
Harvey C.R., 1995, “Predictable risk and return in emerging markets”, Review ofFinancial Studies, 8, pp. 773-816.
Hamao Y., 1988, “An empirical examination of the arbitrage pricing theory: UsingJapanese data”, Japan World Economy, 1, pp. 45-61.
Ibrahim M., 1999, “Macroeconomic variables and stock prices in Malaysia: An empir-ical analysis”, Asian Economic Journal, 13(2), 219, 223.
R.M. YUSOF, M.S. ABD. MAJID - MACROECONOMIC VARIABLES AND STOCK RETURNS IN MALAYSIA
467

Ibrahim M., 2002, “Volatility interactions between stock returns and macroeconomicvariables: Malaysian evidence”, Savings and Development, 26(2), pp. 483-194.
Ibrahim M. and W.S. Wan Yusof, 2001, “Macroeconomics variables, exchange rate andstock price: A Malaysian perspective”, IIUM Journal of Economics and Management,9(2), pp. 141-163.
Ibrahim I. and M.A. Jusoh, 2001, “The Causes of Stock Market Volatility in Malaysia”,Proceedings of the Malaysian Finance Association Third Annual Symposium, Interna-tional Islamic University Malaysia.
Ibrahim M. and H. Aziz, 2003, “Macroeconomic variables and the Malaysian equitymarket”, Journal of Economic Studies, 30(1), pp. 6-22.
Johansen S., 1991, “Estimation and hypothesis testing of cointegrating vectors inGaussian vector autoregressive models”, Econometrica, 55, pp. 251-276
Johansen S., 1988, “Statistical analysis of cointegration vectors”, Journal of EconomicDynamics and Control, 12, pp. 231-54.
Johansen S and K. Juselius, 1990, “Maximum likelihood estimation and inferenceon cointegration – with application to the demand for money”, Oxford Bulletin ofEconomics and Statistics, 52(2), pp. 169-210.
Kwon C.S. and T.S. Shin, 1999, “Cointegration and causality between macroeconomicvariables and stock market returns”, Global Finance Journal, 10(1), pp. 71-81.
Laurenceson J and J.C.H. Chai, 2003, Financial Reform and Economic Development inChina, Edward Elgar, Cheltenham, UK.
Liljeblom E. and M. Stenius, 1997, “Macroeconomic volatility and stock marketvolatility: empirical evidence on Finnish data”, Applied Financial Economics, 7, pp.419-426.
Lin S.M., 1993, “Stock returns and money supply: A comparison among three Asiannewly industrialized countries”, Proceeding of the Annual FEP Seminar on theMalaysian Economy and Management: Into the Next Millennium, Department of Eco-nomics, Universiti Putra Malaysia.
Maysami R.C. and T.S. Koh, 2000, “A vector error correction model of the Singaporestock market”, International Review of Economics and Finance, 9, pp. 79-96.
Mookerjee R. and Q. Yu, 1997, “Macroeconomic variables and stock prices in a smallopen economy: The case of Singapore”, Pacific - Basin Finance Journal, 5(3), pp.377-388.
Mok H.M.K., 1993, “Causality of interest rate, exchange rate and stock prices at stockmarket open and close in Hong Kong”, Asia Pacific Journal of Management, 10, pp.123-143.
Mukherjee T.K. and A. Naka, 1995, “Dynamic relations between macroeconomic vari-ables and the Japanese stock market: an application of a vector error-correctionmodel”, The Journal of Financial Research, 18 (2), pp. 223-237.
SAVINGS AND DEVELOPMENT - No. 4 - 2007 - XXXI
468

Narayan P.K., 2004, “Reformulating critical values for the bounds f-statistics ap-proach to cointegration: an application to the tourism demand model for Fiji”,Discussion Paper, No. 02/04, Department of Economics, Monash University.
Nasseh A. and J. Strauss, 2000, “Stock prices and domestic and international macro-economic activity: A cointegration approach”, The Quarterly Review of Economicsand Finance, 40(2), pp. 229-245.
Pesaran M.H. and Pesaran B., 1997, “Working with Microfit 4.0: Interactive Econo-metrics Analysis”, Oxford University Press, UK.
Pesaran M.H., Y. Shin, R.J. Smith, 1996, “Testing for the existence of a long-run rela-tionship”, DAE Working Paper, No. 9622, Department of Applied Economics, Uni-versity of Cambridge.
Poon S.H. and S.J. Taylor, 1992, “Stock returns and volatility: an empirical study ofthe U.K. stock market”, Journal of Banking and Finance, 16, pp. 37-59.
Rozeff M.S., 1974, “Money and stock prices: market efficiency and the lag in effect ofmonetary policy”, Journal of Financial Economics, 1, pp. 245-302.
Theophano P. and P. Sunil, 2006, “Economic variables and stock market returns: Evi-dence from the Athens stock exchange”, Applied Financial Economics, 16(13), pp.993-105.
Wongbangpo P. and S.C. Sharma, 2002, “Stock market and macroeconomic funda-mental dynamic interactions: ASEAN-5 countries”, Journal of Asian Economics,13(1), pp. 27-51.
Résumé
L’étude se concentre sur les effets des variables macroéconomiques sur la perfor-mance du marché des capitaux après la crise financière de 1997, en utilisant le mo-dèle ARDL. Les résultats suggèrent que le taux d’échange effectif réel, l’offre de mon-naie, l’index de production industrielle et le taux sur les fonds fédéraux semblent descibles pour le gouvernement afin de promouvoir la stabilisation du marché des capi-taux et d’encourager des flux ultérieurs de capital. De même, les changements de lapolitique monétaire des Etats-Unis ont aussi un impact direct sur les marché des ca-pitaux de Malaisie.
R.M. YUSOF, M.S. ABD. MAJID - MACROECONOMIC VARIABLES AND STOCK RETURNS IN MALAYSIA
469