Embed Size (px)
Citation preview
Macroeconomic Update i
NEPALVOLUME. 6, NO.1
April 2018
MACROECONOMICUPDATE


NEPALVOLUME. 6, NO. 1
April 2018
MACROECONOMICUPDATE

iv Macroeconomic Update
© 2018 Asian Development Bank, Nepal Resident Mission
All rights reserved. No part of this publication may be reproduced, stored in a retrieval system, or transmitted, in any form or by any means, without the prior written permission of the Asian Development Bank (ADB). ADB does not guarantee the accuracy of the data included in this publication and accepts no responsibility for any consequences of their use.
This issue of the Nepal Resident Mission (NRM) Macroeconomic Update was prepared by the following team with overall guidance from Mukhtor Khamudkhanov, Country Director, NRM and Sharad Bhandari, Principal Economist, NRM. Anjan Panday, Senior Programs Officer, NRM, Tadateru Hayashi, Senior Economist and Masato Nakane, Economist of Regional Cooperation and Operations Coordination Division, South Asia Department, reviewed the draft and provided comments and suggestions.
Manbar Singh Khadka, Economics Officer, NRMNeelina Nakarmi, Economics Analyst, NRM
Supported by: Sangeeta Gurung, Senior Operations Assistant, NRM
The views expressed in the Macroeconomic Update are those of the authors and do not necessarily reflect the views of the ADB, or its Board of Directors, or its member governments.
Asian Development Bank Nepal Resident Mission Metro Park Building, Lazimpat Post Box 5017 Kathmandu, Nepal Tel +977 1 4005120 Fax +977 1 4005137 [email protected] www.adb.org/nepal www.facebook.com/adbnrm/

Macroeconomic Update v
CONTENTS
MACROECONOMIC UPDATE PageExecutive Summary viiA. Real Sector 1B. Fiscal Sector 6C. Monetary Sector 7D. External Sector 12
ISSUE FOCUSAgriculture development with commercial farming in Nepal 15
BOXES Box 1: A success story of contract farming of potatoes in India 17Box 2: Sakhejung tea processing house –emerging practices in Nepal 18Box 3: A success story of AMUL, a dairy cooperative movement in India 19Box 4: Transitioning to agricultural value chains 21Box 5: Sharing the risks of agribusinesses development in the highlands of Nepal 22
APPENDICES Appendix 1: Country Economic Indicators 26Appendix 2: Country Poverty and Social Indicators 27

vi Macroeconomic Update
ABBREVIATIONS
BFI = banks and financial institutions
GDP = gross domestic product
M2 = broad money
Mt/Ha = metric ton per hectare
NRB = Nepal Rastra Bank
SDG = sustainable development goals
y-o-y = year-on-year
NOTEi. The fiscal year (FY) of the Government ends on 15 July. FY before a calendar year denotes the
year in which the fiscal year ends, e.g., FY2018 ends on 15 July 2018.
ii. In this report, “$” refers to United States dollar and NPR refers to Nepali rupee.

Macroeconomic Update vii
1. Nepal’s economy is anticipated to grow at a slower pace of 4.9% in FY2018 from 6.9% in FY2017 weighed down by floods of August 2017 and the erosion of base effect. This is a slight upward revision of the 4.7% growth forecast published in the September edition of Macroeconomic Update 2017, reflecting somewhat better-than-expected harvest despite floods in mid-August. Preliminary data from the Ministry of Agricultural, Land Management and Cooperatives show that paddy production this fiscal year will fall to 5.1 million tons, a decrease of 1.5% from a year earlier. The production of other summer crops like maize and millet are expected to increase in FY2018 compared to the previous year. Even with increased capacity utilization of industries, industrial growth is set to be lower in FY2018 from the high rate in FY2017, largely due to low investment in the manufacturing sub-sector for years owing to political instability and structural bottlenecks. The services sector will however remain buoyant given the expansion of wholesale and retail trade, financial intermediation and travel and tourism sub-sectors.
2. On the demand side, substantive growth in government expenditures and a moderate uptick in investment will drive growth in FY2018. The construction needs particularly for establishing provincial and local governments, the acceleration of post-earthquake reconstruction, and planned disbursement of relief grants to earthquake victims will induce growth. Government expenditures have increased significantly this fiscal year partly for local, provincial and parliamentary elections. Additionally, the government has apportioned fiscal transfer of NPR 232.2 billion (about 8.0% of GDP) to local and provincial governments under the federal structure of governance. Private investment has increased in construction, hotel and hydropower.
3. GDP growth of 5.5% is envisaged for FY2019. This higher forecast hinges on the assumption of normal monsoon and acceleration of ongoing mega projects. Notably, the Upper Tamakoshi Hydropower Project of 456 megawatt will likely be added to the national grid by FY2019, ending the country’s reliance on power import at least during the rainy season. Expectations are high that both the quality and quantum of infrastructure projects will accelerate in FY2019. Downside risks to outlook in FY2019 centers on limited experience and capacity especially in provincial and local governments and challenges to smooth implementation of federalism. Budget deficit may widen owing to an increased spending and weak revenue mobilization capacity of newly constituted local and provincial governments.
Executive Summary
Macroeconomic Update vii
viii Macroeconomic Update
Current account deficit may widen as exports and tourism receipts do not sufficiently compensate for weaker remittance growth.
4. Average annual inflation is expected to rise moderately to 5.5% in FY2018 from 4.5% in FY2017. This is below the inflation target of 7.0% set by Nepal Rastra Bank, the central bank. Inflation as of mid-February 2018 moderated on the back of modest oil prices, ease in the supply of goods, and subdued inflation in India-the major trading partner to whose currency the Nepali rupee is pegged. It will nonetheless likely inch up in the remaining months of FY2018 as base effects erode and government expenditures increase with the fiscal transfers provided to meet spending needs of provincial and local governments and the planned disbursement of relief grants to earthquake victims. The average annual inflation will likely edge up to 6.0% in FY2019, lower than the average inflation of 8.1% for FY2013-FY2017, assuming a normal harvest, a modest increase in oil prices and subdued inflation in India.
5. Capital expenditures as of mid-February 2018 surged by 26.9% year-on-year, but execution at 19.7% remained far short of allocation. Despite introducing budget implementation reforms, poor execution of capital expenditures continued in the first seven months of FY2018. Lack of project readiness and coordination among implementing agencies, frequent transfer of key project staff, weak contract management and procedural hurdles related to land acquisition and forest clearance are some of the major underlying factors hindering project implementation. Assuming a 72% execution rate (average for FY2012-FY2017) of capital expenditures in FY2018, capital spending will likely hover around 8.0% of GDP against a target of 11.5% of GDP. Recurrent expenditures, on the other hand, was high with its year-on-year growth of 46.3% and execution at 45.4% in the first seven months of FY2018.
6. Revenue collection increased by about 21.0% year-on-year in the first seven months of FY2018 compared to a year earlier period. It increased primarily on higher import growth. Revenue collection as of mid-February 2018 stood at NPR 384.6 billion about 53.0% of the total revenue target for FY2018. Customs duties, VAT and income tax are the largest contributors to revenue generation. Data from Nepal Rastra Bank show a budget deficit of NPR 26.4 billion as of mid-February 2018, down from a surplus of NPR 17.9 billion in the corresponding period a year earlier. The increased recurrent expenditure compounded by election expenses and fiscal transfers widened the budget deficit. Though the Fiscal Policy for FY2018 envisaged a budget deficit of about 11.0% of GDP, the
viii Macroeconomic Update

Macroeconomic Update ix
deficit will likely be lower as capital expenditures fall short of allocation. The government’s total external debt as of mid-FY2018 is NPR 436.5 billion (15.0% of GDP), up from NPR 402 billion in the corresponding period a year earlier. The total internal borrowing significantly increased to NPR 394.5 billion, or 13.5% of GDP, in the first half of FY2018 from NPR 232.2 billion, or 8.9% of GDP, in the year earlier period. Domestic borrowing has surged in FY2018 to meet fiscal transfers to local and provincial governments, an indication that public debt to GDP for FY2018 will likely be higher than an average of 29.2% for FY2012-FY2017.
7. Import growth has outpaced export growth leading to a widening trade deficit. Merchandise exports increased by 19.2% year-on-year to $ 523.7 million in the first seven months of FY2018, marginally lower than the 19.8% rate in the corresponding period a year earlier. Exports of cattle feed, vegetable ghee, thread, jute goods and readymade garments increased in the fiscal year through mid-February 2018. This reflects increased agro-processing and manufacturing output from better management of electricity supply. The complete reversal of disruption in trade between Nepal and India also supported Nepal’s merchandise exports to India, People’s Republic of China and other countries. Nonetheless, Nepal’s export competitiveness has long suffered from inadequate infrastructure, lack of a competitive structure in key markets, high customs duties levied on imports of raw materials for manufacturing products, limited product diversification, low productivity, inadequate quality, non-tariff measures and appreciation of real effective exchange rate. Merchandise imports increased by 23.9% year-on-year to $ 6.3 billion in mid-February 2018, up from $ 5.1 billion in mid-February 2017 on the back of remittance income and recovery in domestic demand. Imports particularly of vehicles and spare parts and petroleum products have surged through mid-February 2018. Consequently, merchandise trade deficit as of mid-February 2018 widened to $ 5.8 billion, a growth of 24.4% from the corresponding period a year earlier.
8. External sector stability is vulnerable over the medium-term with slow remittance growth and rising trade deficit. A sluggish rise in remittance income, higher trade deficit and a fall in net income in the first seven months of FY2018 widened the current account deficit to $ 1374.1 million, significantly up from a deficit of $ 99.2 million in the corresponding period a year earlier. Though foreign investment has increased notably in cement, hydro and hotels since FY2017, its share of GDP remains below 1.0%. The current account deficit and weak capital inflows contributed to an overall balance of payments deficit of $ 178.0 million in mid-February
Macroeconomic Update ix

x Macroeconomic Updatex Macroeconomic Update
2018 compared to a surplus of $ 344.0 million in the year earlier period. Gross foreign exchange reserves at $ 10.2 billion as of mid-February 2018 is sufficient to cover near 10 months of goods and services.
9. This edition of Macroeconomic Update’s Issue Focus sheds light on the importance of agricultural commercialization in Nepal and the need for its effective implementation by addressing legal, institutional, financial and infrastructural barriers. With about one-third share of GDP, agriculture continues to provide livelihood to two-thirds of the country’s population, but mostly at a subsistence level. Nepal today is largely a food deficient country evident in growing imports of agriculture and livestock products. Even the export performance of potentially competitive agro-products is discouraging. The inability to enhance agricultural productivity commensurate with growing population has fueled agricultural trade deficit. Productivity has stagnated owing to limits on the adoption of improved technology, poor market linkages, infrastructure bottlenecks, and quality issues.
10. Commercialized agriculture via contract and cooperative farming methods can be one of the major sources of revenue generation for the country if practiced on a wider scale. It will not only help generate local employment but also meet domestic demand with improved crop and livestock production and promote export potential of niche agro products. Nepal has a revealed comparative advantage on several high-value, low-volume cash crops such as ginger, cardamom, tea and lentils. But, maintaining their quality standards while increasing production level remains crucial for raising farm revenue. Access to credit, availability of farm inputs, adoption of modern technologies and timely completion of major infrastructure projects such as Sikta Irrigation Project are equally important for facilitating commercial agriculture in Nepal.

Macroeconomic Update 1
MACROECONOMIC UPDATEA. Real Sector
I. Economic performance in FY20171. Nepal’s economy grew by an estimated 6.9% in FY2017 from a low growth of 0.01% in FY2016 (Figure 1). The base year effect reflecting gradual recovery from the 2015 earthquakes and normalization of trade since February 2016, better management of electricity supply, and a favorable monsoon leading to better harvest improved economic performance in FY2017. The agriculture sector, which accounts for nearly one-third of nation’s gross domestic product (GDP), grew by 5.3% in FY2017, up from 0.03% in FY2016. The above average monsoon and timely availability of farm inputs such as seeds and fertilizers along with the expansion of irrigation facilities helped increase agriculture output.1 Consequently, paddy production increased to 5.2 million tons in FY2017, up from 4.3 million tons in FY2016.
1 Economic Survey 2016/17, Ministry of Finance.
Figure 1: Supply-side contributions to GDP growth (% points)
R= revised; P= provisionalSource: Central Bureau of Statistics; NRM staff estimates

2 Macroeconomic Update
2. The industry sector, which accounts for slightly more than one-tenth of GDP, grew by 10.9% in FY2017 after falling by 6.3% in FY2016. The sector revived on the back of trade normalization. Construction activities expanded considerably with the ease in the supply of goods and availability of raw materials. The electricity output increased with higher generation of hydro power along with power purchase from India. The increased availability of electricity created an enabling environment for manufacturing sub-sector to expand by 9.7% in FY2017 after contracting by 8.0% in the preceding year.
3. The services sector, which accounts for slightly more than half of GDP, expanded by 6.9% in FY2017, up from 2.1% in FY2016 for several reasons. First, the record arrival of tourists reaching pre-earthquake levels favored hotel, restaurant, travel and communication sub-sectors. Second, banks and financial institutions (BFIs) expanded their outreach increasing savings and credit accounts across the country. Third and notably, normalization of trade and subsequent increase in wholesale and retail trade further led to services’ sector growth.
4. On the demand side, strong consumption prevailed in FY2017 buoyed by remittance income. Consumption expenditures dominated spending to account for nearly 90.0% of GDP in FY2017, albeit down from 96.2% of GDP a year earlier (Figure 2). Fixed investment grew by 27.2%, to account for 33.8% of GDP in FY2017, up from 28.8% of GDP in the preceding year.2 Private investment increased markedly in construction, hotel, hydropower and aviation.
Figure 2: Share of GDP by expenditure
Source: Central Bureau of Statistics
2 In real terms

Macroeconomic Update 3
With increased purchase of capital goods, construction materials, telecommunication equipment and devices, imports substantially surged while export growth faltered in FY2017. This led to a widening merchandise trade deficit resulting in a negative contribution to growth in FY2017.
II. Economic prospects for FY2018 and FY2019
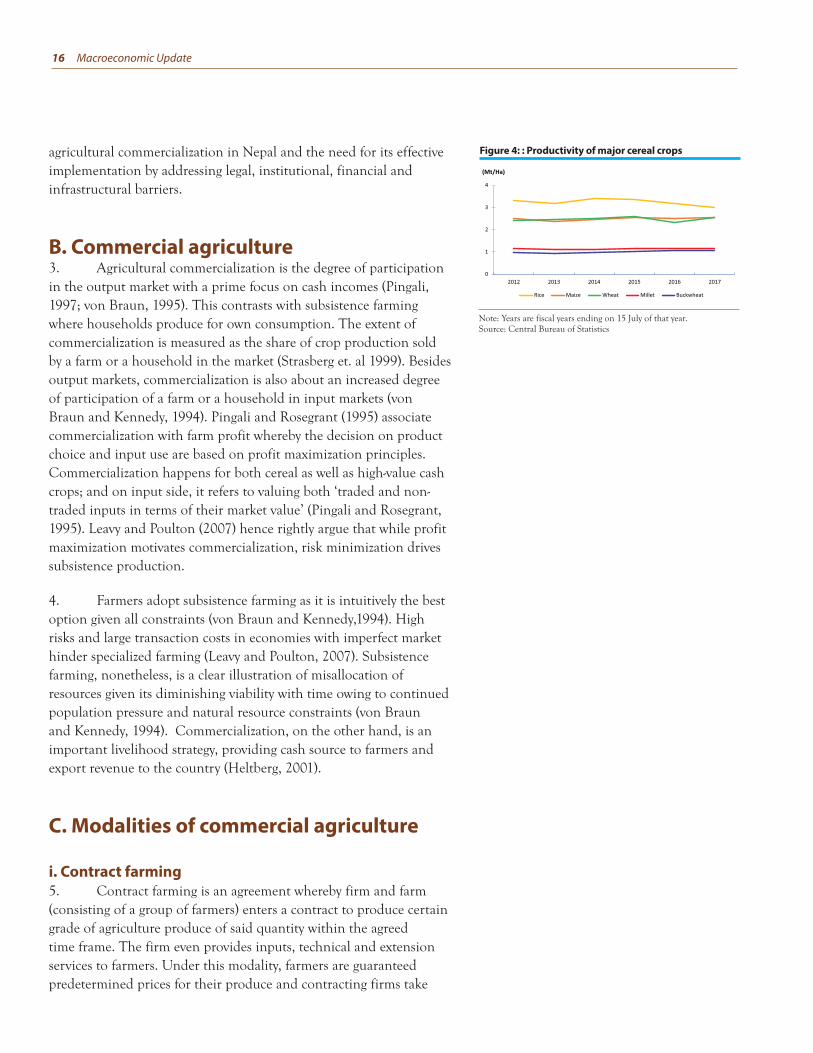
5. The economy is forecast to grow at a slower pace of 4.9% in FY2018 weighed down by floods in mid-August and the erosion of base effect (Figure 3). This is a slight upward revision of the 4.7% growth forecast published in the September edition of Macroeconomic Update 2017 reflecting somewhat better-than-expected harvest despite floods in mid-August in the southern belt of Nepal.3 As per the Ministry of Agricultural, Land Management and Cooperatives, paddy production this fiscal year will fall by 1.5% from a year earlier to 5.1 million tons, owing to floods of August 2017. Winter crops may also suffer because of meager rainfall during the season.4 The production of other summer crops like maize and millet are nonetheless expected to increase in FY2018 compared to a year earlier (Figure 4). Overall, agriculture output is expected to modestly grow by 3.0% in FY2018, down from a growth of 5.3% in FY2017.
6. Industrial output will grow modestly in FY2018 compared to a year earlier. The construction sub-sector will expand given the need for physical infrastructure such as office buildings particularly in provincial and local governments and continued momentum in post-earthquake reconstruction.5 So far, 79 archeological heritage sites have been completely restored, and the renovation of 111 archeological heritage sites is ongoing. Out of 7,500 schools damaged by the earthquakes, 2,898 schools have been completely reconstructed, and 1,458 schools are being reconstructed.6 Manufacturing output will slightly increase with the availability of raw materials and better management of electricity supply. This is evident with enhanced capacity utilization of industries from an average of 48.2% in FY2016 to 57.3% in FY2017.7 Besides increased import of electricity, its domestic generation will also increase with the addition of various small and medium-sized hydropower plants to the national grid by the end of FY2018 (Table1).The passage of several bills such as Industrial Enterprise
3 See Macroeconomic Update Nepal Volume 5, No. 2 September 2017.4 Current Macroeconomic and Financial Situation of Nepal, based on seven months’ data, 2017/18, Nepal Rastra Bank (NRB).5 Out of 767,705 eligible households for housing grants, 685,969 have already received their first tranche of personal housing grants. The second and third tranche of housing
grants are being distributed in the most affected 14 districts, and the distribution of the first tranche of housing grants is near completion in the least affected 17 districts (National Reconstruction Authority and Mid-year review of FY2018 budget).
6 National Reconstruction Authority.7 Economic Activities Study Report 2073-74, NRB.
Figure 3: GDP forecast (% points)
Source: Central Bureau of Statistics; NRM staff estimates
Figure 4: Major crops production (million tons)
Source: Ministry of Agricultural, Land Management and Cooperatives

4 Macroeconomic Update
Act, Labor Act, and Special Economic Zone Act along with the successful completion of local, provincial and parliamentary elections may boost investors sentiment favoring manufacturing sub-sector. Nonetheless, industrial growth is set to be lower in FY2018 from the high rate in FY2017 due to low investment in the manufacturing sub-sector for years owing to political instability and structural bottlenecks.
7. The services sector will likely grow by 5.5% in FY2018, down from 6.9% in FY2017. The growth in services sector will come from expansion of wholesale and retail trade, financial intermediation and travel and tourism sub-sectors. With the implementation of fiscal decentralization in the new federal set-up, economic activities will likely increase across local and provincial units expanding rural, semi-urban and urban markets. This will help expand wholesale and retail trade across the country. Similarly, BFIs have been mandated to open bank branch in every local unit that does not have a financial institution. Commercial banks have so far opened branch units in 374 local levels, and they are committed to opening branch offices in other local levels.10 To further promote financial inclusion, the BFIs have been promised financial incentives for opening branch offices in remote areas of the country.11 Such initiatives are expected to boost financial intermediation in FY2018 and more in FY2019. Further, tourists’ arrivals have been increasing in FY2018 partly as a reflection of imminent political stability and sustained peace in the country.12
8. On the demand side, substantive growth in government expenditures and a moderate uptick in investment will drive growth in FY2018. The construction needs particularly in provincial and local governments, the acceleration of post-earthquake reconstruction, and planned disbursement of relief grants to earthquake victims will induce growth. Government expenditures have increased significantly
8 It includes power generation of both Nepal Electricity Authority and private sector.9 It is expected that a total of 180.53 MW hydropower projects will be added to the national grid by FY2018 (Department of Electricity Development).10 Current Macroeconomic and Financial Situation of Nepal and Mid-year review of Monetary Policy 2017/18, NRB.11 BFIs will be provided interest-free credit amounting to NPR 10 million for a year for every 2,500 bank accounts opened for Nepali nationals who do not yet
have bank accounts. Further, the facility of interest free credit amounting to NPR 10 million for a fixed period to BFIs has been extended given that they open branch offices outside district headquarters of several remote districts across the country. For details, please see Monetary Policy 2018.
12 A total of 940,218 tourists arrived in Nepal in 2017, an increase of 25% over the previous year (Ministry of Culture, Tourism and Civil Aviation).
Table 1: Electricity demand and supply
Item FY2014 FY2015 FY2016 FY2017 FY2018P
Installed capacity (MW)8 787 787 856 972.4 1,152.99
Peak demand (MW) 1,201 1,292 1,385 1,444.1 1,508
Deficit (MW) 414 505 529 471.7 355.1
MW = megawattSource: Annual Report 2016; Annual Report 2017, Nepal Electricity Authority

Macroeconomic Update 5
13 The third phase of local level election was held on 18th September 2017. Federal parliament and provincial assemblies’ elections were held in two phases- on 26th November and 7th December 2017.The Ministry of Finance had apportioned NPR 25 billion, nearly 1% of GDP, for holding parliamentary and provincial level elections including the third phase of local level election.
14 The government has identified cement industry as one of the priority sectors. For details, please see <http://www.newbusinessage.com/MagazineArticles/view/1686>
this fiscal year partly for local, provincial and parliamentary elections.13 Additionally, the government had apportioned fiscal transfer of NPR 232.2 billion, about 8.0% of GDP, to provincial and local units under the federal structure of governance. Private investment has increased in hydropower and cement industries,where the country has been persistently doing well in terms of bridging the domestic gap. Nearly 80.0% of demand in cement is met via domestic industries and the rest imported from India. About 70.0% of clinker, the major input for cement production, is produced internally.14 However, the surge in interest rates since early 2017 to mid-February 2018 have made loans costlier likely crowding out private investment. Public investment surged by 26.9% year-on-year (y-o-y) in the first seven months of FY2018. Private consumption growth will remain subdued with a moderate rise in remittance income following a decline in the out-migration to major destination countries. Trade deficit is expected to further widen in FY2018 with rising imports of oil and non-oil products.
9. GDP growth of 5.5% is envisaged for FY2019. This higher forecast hinges on the assumption of normal monsoon and acceleration of ongoing mega projects. Notably, the Upper Tamakoshi Hydropower Project of 456 megawatt will likely be added to the national grid by FY2019, ending the country’s reliance on power import at least during rainy season. Similarly, expectations are high that both the quality and quantum of infrastructure projects will accelerate in FY2019. Downside risks to outlook in FY2019 centers on limited experience and capacity specially in provincial and local governments and challenges to smooth implementation of federalism. Budget deficit may widen with increased spending and weak revenue mobilization capacity of newly constituted local and provincial governments. Current account deficit may also widen as exports and tourism receipts do not sufficiently compensate for weaker remittance growth.

6 Macroeconomic Update
B. FISCAL SECTOR
I. Expenditure performance10. Capital expenditures surged by 26.9% y-o-y as of mid-February 2018, but execution at 19.7% remained far short of allocation (Figure 5). Despite introducing budget implementation reforms, poor execution of capital expenditures continued in the first seven months of FY2018.15 Lack of project readiness and coordination among implementing agencies, frequent transfer of key project staff, weak contract management and procedural hurdles related to land acquisition and forest clearance are some of the key reasons hindering project implementation. As such, the mid-February budget utilization for FY2018 is no different from past fiscal years. This lower-than-planned capital expenditure implies that spending will typically bunch towards the last quarter of FY2018, undermining the quality of capital projects. Assuming a 72.0%16 execution rate of capital expenditures in FY2018, capital spending will likely hover around 8.0% of GDP against a target of 11.5% of GDP (Figure 6).
11. Recurrent expenditures was high with its year-on-year growth of 46.3% and execution at 45.4% in the first seven months of FY2018 (Figure 7). The budget for FY2018 had allocated NPR 232.2 billion (28.9% of the recurrent expenditure) as fiscal transfer to local and provincial governments. The expenditure will continue to increase for the rest of FY2018 with the continued implementation of the federal system of governance.17
II. Revenue performance12. Revenue collection increased by about 21.0% y-o-y in the first seven months of FY2018. The revenue mobilization as of mid-February 2018 was NPR 384.6 billion, which is nearly 53.0% of the total revenue (tax and non-tax) target for FY2018 (Figure 8). This is in line with 52.4% of the total revenue mobilized in the first seven months of FY2017. The revenue collection has primarily increased on higher import growth. Custom duties, VAT and income tax are the largest contributors to revenue generation, and their share of total revenue collection as of mid-February 2018 stood at 19.0%, 28.4% and 21.0% respectively (Figure 9).
15 This is an average execution rate for FY2012-FY2017. 16 Ministry of Finance has already disbursed NPR 150 billion out of NPR 225.05 billion to local governments under fiscal equalization and conditional grant basis. The budget set
aside fiscal transfer of NPR 7.1 billion for provincial governments in FY2018, but this amount will substantially increase in FY2019 and beyond. 17 The Civil Servants Adjustment Act 2017 allows civil servants to opt for voluntary retirement if they have reached 50 years of age and served 20 years in office. They will be
entitled to seven years’ pension in lump sum along with other retirement benefits. About 10,000 staff have applied for voluntary retirement. To meet this provision, the government will need an additional NPR 30 billion (White Paper on Current Economic Situation of the Country, 2018, Ministry of Finance).
Figure 6: Capital expenditure (% of GDP)
Source: Ministry of Finance; Financial Comptroller General Office; NRM staff estimates
Figure 7: Budget execution (%)
Source: Ministry of Finance; Financial Comptroller General Office
Figure 5: Capital expenditure and execution (%)
Source: Ministry of Finance, Budget speech for various years; Financial Comptroller General Office

Macroeconomic Update 7
III. Budget balance13. The budget as of mid-February 2018 is in deficit by NPR 26.4 billion, down from a surplus of NPR 17.9 billion in the corresponding period of FY2017.18 An increased recurrent expenditure compounded by election expenses and fiscal transfers widened the budget deficit. The fiscal policy for FY2018 envisaged a budget deficit of 10.6% of GDP, the deficit will likely be lower as capital expenditures fall short of allocation.
IV. Public debt14. The government’s total external public debt as of mid-FY2018 is NPR 436.5 billion(15.0% of GDP), up from NPR 402 billion in the corresponding period a year earlier. The total internal borrowing significantly increased to NPR 394.5 billion, or 13.5% of GDP, in the first half of FY2018 from NPR 232.2 billion,or 8.9% of GDP, in the year earlier period. Domestic borrowing has surged in FY2018 to meet fiscal transfers to local and provincial governments, an indication that public debt to GDP for FY2018 will likely be higher than the average of 29.2% for FY2012-FY2017. Public debt will probably increase from FY2019 onwards to meet fiscal transfers to both provincial and local governments.19 Expenditure needs of both local and provincial governments will rise with higher recurrent and capital spending.20 But, the sources of revenue generation will be limited given the small-sized economy, further constrained by inadequate capacity of resource mobilization particularly at provincial and local levels. This will likely lead to more borrowing from both internal and external sources to meet the widening fiscal gap.
C. MONETARY SECTOR
I. Inflation15. Average annual inflation moderated to 4.5% in FY2017, down from 9.9% a year earlier. Inflation, particularly food inflation, moderated significantly in FY2017 mainly on the back of increased agriculture output. Inflation averaged 3.7% in the first seven months of FY2018, below the 5.5% out turn in the corresponding period a year earlier (Figure 10). Inflation, however, inched up to 5.0% (y-o-y) in mid-February 2018 from 3.3% a year earlier period. Food inflation, that accounts for 44.0% of the consumer price basket, edged up to
18 Data on government budgetary operation on cash basis from NRB.19 The current apportioned fiscal transfer to provincial governments is nominal and is largely meant for setting up office buildings and purchasing vehicles as the provincial
governments have been recently formed after the conclusion of elections in mid-FY2018. 20 This is contingent on budget utilization, particularly of the capital budget.
Figure 8: Seven-month’s revenue mobilization and FY2018 target
Source: Nepal Rastra Bank and Budget Speech for FY2018
Figure 9 : Composition of total revenue (%)
Source: Nepal Rastra Bank

8 Macroeconomic Update
4.0% in mid-February 2018 after falling by 0.2% in the year earlier period (Figure 11). But, the CPI of non-food and services moderated to 5.8% in mid-February FY2018, down from 6.1% in the year earlier period (Figure 12). Overall, inflation moderated in the first seven months of FY2018 on the back of modest oil prices, ease in the supply of goods, and subdued inflation in India21 -the main trading partner to whose currency the Nepali rupee is pegged.
II. Inflation outlook for FY2018 and FY201916. Average annual inflation is expected to rise modestly to 5.5% in FY2018 from 4.5% in FY2017 (Figure 13). This is below the inflation target of 7.0% set by Nepal Rastra Bank, the central bank. Inflation as of mid-February 2018 has moderated owing to somewhat better-than-expected harvest, ease in the supply of goods, and subdued inflation in India. It will nonetheless likely inch up in the remaining months of FY2018 as base effects erode and government expenditures increase with the fiscal transfers provided to meet spending needs of provincial and local governments and the planned disbursement of relief grants to earthquake victims. The average annual inflation will however moderately edge up to 6.0% in FY2019, lower than the average inflation of 8.1% for FY2013-FY2017, assuming a normal harvest, a modest increase in oil prices, and subdued inflation in India.
III. Money supply 17. Broad money (M2) supply grew by 13.5% year-on-year as of mid-February 2018. It increased by 7.7% to NPR 2790.5 billion in the first seven months of FY2018, down from 9.5% in the year earlier period. M2 grew at a decelerating rate due to a fall in net foreign assets in the fiscal year through mid-February 2018 (Figure 14). Net Foreign Assets fell by about 2.0% through mid-February 2018, after rising by 3.9% in the year earlier period, owing to sluggish rise in remittance and huge trade deficit. Net domestic assets however increased by 13.8% in the first seven months of FY2018 to NPR 1785.7 billion. While net claims on government decreased by 57.2% to NPR 63.9 billion, claims on private sector increased by 14.1% to NPR 2278.1 billion in mid-February 2018.22
21 The average inflation wedge between Nepal and India was -0.6% during the seven months to mid-February 2018.22 This change is from mid-July 2017 to mid-February 2018.
Figure 11: Year-on-year food inflation (%)
Source: Nepal Rastra Bank
Figure 12: Year-on-year non-food inflation (%)
Source: Nepal Rastra Bank
Source: Nepal Rastra Bank; NRM staff estimates
Figure 13: Contribution to inflation (% points )
Figure 10: Year-on-year inflation (%)
Source: Nepal Rastra Bank

Macroeconomic Update 9
IV. Deposit and credit18. Deposit collection of BFIs increased at a slow pace on a sluggish growth of remittances and the inability of governments23 to utilize budget in the first seven months of FY2018. It grew by 6.8% in mid-February 2018, down from a growth of 8.9% in the year earlier period. While the deposit collection of development banks and finance companies increased by 14.3% and 5.1% respectively, that of commercial banks increased moderately by 5.5% (Figure 15). This is largely due to higher interest rates offered on deposits by development banks and finance companies vis-à-vis commercial banks. Further, deposits at development banks and finance companies grew sharply through the fiscal year in mid-February 2018 compared to a year earlier period. This may be due to a shift from investing in share market24 to depositing at BFIs (Figure 15).
19. Total credit disbursement (loans and advances) of BFIs moderately increased in the first seven months of FY2018. It grew by 14.7% in the fiscal year through mid-February 2018, up from 12.9% in the year earlier period (Figure 16). Loans and advances25 of commercial banks, development banks and finance companies increased by 14.4%, 15.7% and 4.8% respectively in mid-February FY2018 (Figure 16). The slow-paced increase in credit disbursement of commercial banks centers on higher lending rates by about 180 basis points (y-o-y) in mid-February 2018. Of the total sector wise credit, wholesale and retail traders constituted the biggest share at 22.2%, followed by production at 16.4%, construction at 10.6% and finance, insurance and fixed assets at 8.0% (Figure 17). Credit growth to real estate and hire purchase moderated in the first seven months of FY2018 compared to a year earlier period as Nepal Rastra Bank (NRB) had tightened credit to core capital-cum-deposit ratio and capped lending ratio to real estate sector at 25%.26 The real estate loan grew by 6.7% in the fiscal year through mid-February 2018 vis-à-vis growth of 16.3% in the year earlier period. Similarly, hire purchase credit increased by 8.4% in the fiscal year through mid-February 2018, significantly down from 32.9% a year earlier period.
23 It refers to all three tiers of government. As of mid FY2018, the local governments had spent only 31.5% of the total fiscal transfer (Mid-year review of FY2018 budget, Ministry of Finance).24 The NEPSE index has fallen from 1582.7 points in mid-July 2017 to 1380.3 points in mid-February 2018.25 It consists claims on government, non-financial government enterprises, financial enterprises and private sector including foreign bills purchased and discounted.26 See Note on NRB’s Monetary Policy for FY2018.
Source: Nepal Rastra Bank
Figure 14: Monetary sector (% change)
Source: Nepal Rastra Bank
Figure 15: Growth in deposit collection (% change)
Figure 16: Credit growth of BFIs (% change)
Source: Nepal Rastra Bank

10 Macroeconomic Update
V. Liquidity management20. NRB has actively intervened for liquidity management through monetary policy operations.27 The central bank injected net liquidity of NPR 90.4 billion, or 5.3% of GDP, into the economy via 14 days repo auction and outright purchase auction in the first seven months of FY2018. Whereas, NPR 42.38 billion liquidity was injected in the corresponding period a year earlier. The NRB also mopped up a total of NPR 130.25 billion (7.7% of GDP) in the fiscal year through mid-February 2018, up from NPR 101.1 billion in the year earlier period via open market operations.
VI. Interest rate21. With the implementation of interest rate corridor, the short-term interest rate volatility appears contained from December 2017 onwards.28 The idea is to maintain the interbank interest rates of commercial banks between 3.0% and 5.0%.The weighted average rate of 91-day treasury bills increased to 3.93% in mid-February FY2018 from 2.64% in mid-February FY2017 (Figure 18). Similarly, the weighted average interbank rate for commercial banks rose to 4.31% in mid-February 2018 from 4.13% in the corresponding period a year earlier (Figure 18). The weighted average interest rate spread of
27 Current Macroeconomic and Financial Situation of Nepal based on seven months’ data, 2017/18, NRB.28 NRB introduced interest rate corridor in FY2017 and has been continued in FY2018 albeit with some changes. The two-week repo or policy rate is fixed at 5%, and the two-week
floor rate at 3%. Previously, both the policy and floor rates were determined based on weighted average interbank rate of commercial banks. Standing Liquidity Facility rate or the ceiling is fixed at 7%.
Figure 18: : Weighted average rates
Source: Nepal Rastra Bank
Figure 17: : Sector wise total lending of BFIs
Source: Nepal Rastra Bank

Macroeconomic Update 11
commercial banks at 5.52% in mid-February FY2018 is in line with the NRB’s goal of containing the interest rate spread at 5% (Figure 19). However, the interest rates began inching up since early 2017 to mid-February 2018, making loans costlier and probably crowding out private investment.
Figure 19: Weighted avg rates (commercial banks)
Source: Nepal Rastra Bank

12 Macroeconomic Update
Figure 21. Top five imports ($ million)
Source: Nepal Rastra Bank
D. EXTERNAL SECTOR
I. Exports22. Merchandise exports increased by 19.2% (y-o-y) to $ 523.7 million in the first seven months of FY2018, marginally lower than the 19.8% rate in the corresponding period a year earlier. Exports of cattle feed, vegetable ghee, thread, jute goods and readymade garments increased in the fiscal year through mid-February 2018. This reflects increased agro-processing and manufacturing output from better management of electricity supply. The complete reversal of disruption in trade between Nepal and India also supported Nepal’s merchandise exports to India, People’s Republic of China, and other countries. Nonetheless, Nepal’s export competitiveness has long suffered from inadequate infrastructure, lack of a competitive structure in key markets, high customs duties levied on imports of raw materials for manufacturing products, limited product diversification, low productivity, inadequate quality, non-tariff measures and appreciation of real effective exchange rate. Though Special Economic Zone Act and Industrial Enterprise Act have been enacted to provide tax incentives and relaxation on custom duties for export-oriented manufacturing firms, their effective implementation remains to be seen. Nepal mainly exports primary products such as cardamom, juice, textiles, paper products, pashmina, woolen carpet and handicrafts (Figure 20).
II. Imports23. Merchandise imports increased by 23.9% (y-o-y) to $ 6.3 billion in the first seven months of FY2018 on the back of remittance income and recovery in domestic demand. Imports particularly of vehicles and spare parts and petroleum products have surged through mid-February 2018. Nepal mainly imports petroleum products, vehicle and spare parts, rice, electrical goods, machinery and parts and telecommunication equipments (Figure21).
Figure 20. Top five exports ($ million)
Source: Nepal Rastra Bank

Macroeconomic Update 13
24. Merchandise trade deficit widened on higher import growth and weak export competitiveness. The trade deficit as of mid-February 2018 stood at $ 5.8 billion, a growth of 24.4% from the corresponding period a year earlier (Figure 23).
III. Remittances25. Although out-migration for foreign employment has been declining, the US dollar value of workers’ remittances moderately increased in the first seven months of FY2018, reflecting appreciation of Nepali rupee against the US dollar. The workers’ remittance increased by 6.4% (y-o-y) to $ 3.9 billion29 in mid-February 2018, up from 3.1% in the year earlier period (Figure 22). The remittance growth will likely remain weak for the rest of FY2018 owing to a continued fall in the out-migration of workers particularly to Qatar and Saudi Arabia,30 the main destination countries for majority of migrant workers.
IV. Balance of payments26. External sector stability is vulnerable over the medium-term with slow remittance growth and rising trade deficit. A sluggish rise in remittance income, higher trade deficit and a fall in net income in the first seven months of FY2018 widened the current account deficit to $ 1374.1 million, significantly up from a deficit of $ 99.2 million in the corresponding period a year earlier. Net income balance posted a deficit of $ 29.8 million in the fiscal year through mid-February 2018 after a surplus of $ 100.8 million in the year earlier period.31 FDI rose from a low base by 97.4% (y-o-y) to $ 139.7 million through mid-February 2018. Though foreign investment has increased notably in cement, hydro and hotels since FY2017, its share of GDP remains below 1.0%. The current account deficit and weak capital inflows contributed to an overall balance of payments deficit of $ 178.0 million in mid-February 2018 compared with a surplus of $ 344.0 million in the year earlier period (Figure 23). Gross foreign exchange reserves at $ 10.2 billion as of mid-February 2018 is sufficient to cover imports of about 10 months of goods and services (Figure 24).
29 This figure is slightly different than the one reported by NRB because of the difference in the exchange rate used for computing in dollar terms.30 This is largely due to slower growth in oil-producing main destination countries. For details, see: South Asia Regional Update, IMF, January 2018.31 Dividend repatriation of NCELL Pvt. Ltd. along with other foreign banks and hydropower companies led to a deficit of net income balance in the first
seven months of FY2018.
Figure 22 : Number of migrants and remittance inflows
Source: Department of Foreign Employment; Nepal Rastra Bank
Source: Nepal Rastra Bank
Figure 23 : External sector (US$ million)

14 Macroeconomic Update
V. Exchange rate
27. Nominal exchange rate of Nepali rupee against the US dollar appreciated by 6.1% (y-o-y) from mid-February 2017 to mid-February 2018 in line with the appreciation of Indian currency to which the Nepali rupee is pegged (Figure 24). The inflow of remittance income in recent years has induced demand for non-tradeable sector vis-à-vis tradable sector, leading to higher inflation in Nepal than in its trade partners. This, in turn, has appreciated the real effective exchange rate,32 hampering export competitiveness of agriculture and manufactured output.
32 Nepal: Recent Macro-Economic Developments, IMF.
Source: Nepal Rastra Bank
Figure 24 : Exchange rate and gross international reserves
NPR/$

Macroeconomic Update 15
ISSUE FOCUS*
Agriculture development with commercial farming in Nepal
A. Agriculture development in Nepal1. With about one-third share of GDP, agriculture continues to provide livelihood to two-thirds of the country’s population, but mostly at a subsistence level.1 Land fragmentation is high resulting in an average farm holding of only 0.68 hectares (CBS, 2013). In the 1970’s and up to FY1987, Nepal used to export substantial quantities of rice.2 But today, Nepal is largely a food deficient country evident in growing imports of agriculture and livestock products (Figure1; Figure 2). Even the export performance of potentially competitive agro-products is discouraging (Figure 3). The country’s agricultural trade balance3 is negative since 2002 (Poudel, 2007). The inability to enhance agricultural productivity commensurate with growing population has fueled agricultural trade deficit. The productivity has stagnated owing to limits on the adoption of improved technology, poor market linkages, infrastructure bottlenecks, and quality issues, among others. The country’s rice4 productivity at 3.39 metric tons per hectare (Mt/Ha) is well below that of People’s Republic of China and Bangladesh at 6.75 Mt/Ha and 4.42 Mt/Ha respectively.5
2. Low and stagnant farm productivity is a serious concern. To boost farm productivity and raise farmers’ income, top-most priorities have been accorded to agriculture in various plan periods. With a vision of promoting mass scale and quality production, agribusiness promotion policy was enacted a decade ago in 2007. The Trade Policy, 2009; Fourteenth Three-year Plan, FY2017-FY2019; and Agriculture Development Strategy, 2015-2035 - all have prioritized commercialization of agriculture for increasing farm production and productivity. Nonetheless, neither farm productivity nor export of potentially competitive agro-products has increased (Figure 3; Figure 4). The policy implementation paralysis in the absence of legal framework compounded by input-supply bottlenecks and poor infrastructure have held back commercialization of agriculture in Nepal. This issue focus highlights the importance of
* This section was written by Manbar Singh Khadka and Arun Rana, both from NRM, ADB.1 As per the Agriculture Census 2011, the production of 60% of the farmers is insufficient to meet their annual household consumption.2 Rice Development Program in Nepal. Available online at: http://www.fao.org/docrep/v6017t/V6017T04.htm3 Agricultural commercialization is inherently tied to export promotion and providing a revenue base to the country. Had Nepal embarked on the path of commercialization, the
scenario would have been different. 4 It is the major cereal grain of Nepal.5 Based on 2014 statistics. Available online at <http://ricepedia.org>
Source: Nepal Rastra Bank
Figure 1: Trade of food and live animals (in USD million)
Source: Nepal Rastra Bank
Figure 2: Trade of animal and vegetable oil and fats (in USD million)
Note: Years are fiscal years ending on 15 July of that year.Source: Nepal Rastra Bank. 2018. Current Macroeconomic and Financial Situation for various years. http://www.nrb.org.np
Figure 3: Export growth rate of competitive agro commodities
16 Macroeconomic Update
agricultural commercialization in Nepal and the need for its effective implementation by addressing legal, institutional, financial and infrastructural barriers.
B. Commercial agriculture3. Agricultural commercialization is the degree of participation in the output market with a prime focus on cash incomes (Pingali, 1997; von Braun, 1995). This contrasts with subsistence farming where households produce for own consumption. The extent of commercialization is measured as the share of crop production sold by a farm or a household in the market (Strasberg et. al 1999). Besides output markets, commercialization is also about an increased degree of participation of a farm or a household in input markets (von Braun and Kennedy, 1994). Pingali and Rosegrant (1995) associate commercialization with farm profit whereby the decision on product choice and input use are based on profit maximization principles. Commercialization happens for both cereal as well as high-value cash crops; and on input side, it refers to valuing both ‘traded and non-traded inputs in terms of their market value’ (Pingali and Rosegrant, 1995). Leavy and Poulton (2007) hence rightly argue that while profit maximization motivates commercialization, risk minimization drives subsistence production.
4. Farmers adopt subsistence farming as it is intuitively the best option given all constraints (von Braun and Kennedy,1994). High risks and large transaction costs in economies with imperfect market hinder specialized farming (Leavy and Poulton, 2007). Subsistence farming, nonetheless, is a clear illustration of misallocation of resources given its diminishing viability with time owing to continued population pressure and natural resource constraints (von Braun and Kennedy, 1994). Commercialization, on the other hand, is an important livelihood strategy, providing cash source to farmers and export revenue to the country (Heltberg, 2001).
C. Modalities of commercial agriculture
i. Contract farming5. Contract farming is an agreement whereby firm and farm (consisting of a group of farmers) enters a contract to produce certain grade of agriculture produce of said quantity within the agreed time frame. The firm even provides inputs, technical and extension services to farmers. Under this modality, farmers are guaranteed predetermined prices for their produce and contracting firms take
Figure 4: : Productivity of major cereal crops
Note: Years are fiscal years ending on 15 July of that year.Source: Central Bureau of Statistics

Macroeconomic Update 17
FritoLay, a subsidiary of PepsiCo group company established its first potato chips plant in India in 1987. Later, two more plants were established in the country. To operate these plants, the company needed nearly 100,000 metric ton of processed grade potatoes every year. Although India produces about 25 million tons of potatoes a year, it was difficult for the company to meet the requirement of processed grade potatoes. The company then ventured into contract farming of potatoes in West Bengal, Maharashtra, Punjab, Jharkhand and Karnataka of India. More than 14,000 farmers began cultivating potatoes over 12,000 acres under the contract farming modality. The company engaged with farm cooperatives and farmer groups for
producing the desired quality and quantity of potatoes within the agreed time frame. It distributed advanced generation standard of seed tubers to farmers and provided extension services for meeting high quality standards. The company provided farm inputs at reduced rates and facilitated the availability of crop loan and insurance at subsidized rates. Quality standards were periodically checked and transportation of graded and packaged produce from farm gate was arranged. The farmers received fixed price for their produce as agreed in the contract. The company on the other hand was able to meet its requirement of consistent supply of high quality input. This modality resulted in a win-win situation for both the company and farmers.
Box 1: A success story of contract farming of potatoes in India
Source: Dutta et al. (2016)
care of market access. This approach enables mass production of high quality produce, meeting the requirement of agro-processing firms. The system has been successfully practiced in Africa and neighboring countries India and Pakistan; but in Nepal, contract farming has not evolved in the absence of legislation and technical know-how. In India, a wide variety of products ranging from seed to potato, rice, poultry and dairy products are produced under contract farming modality (Rehber, 2007; see Box 1).
6. In Nepal, despite the formulation of agribusiness promotion policy, the agribusiness promotion bill has not been enacted yet. Trade policy 2009 endorsed contract and cooperative farming for increasing production and meeting export potential, but legislation on contract farming has not been formalized yet. In the absence of legislation, commercial farming has not trodden a definitive course. For instance, the draft Agribusiness Promotion Bill has provisions for setting up large scale agriculture production zones and a separate fund for agribusiness promotion, among others.6 Besides regulatory hurdles, infrastructure bottlenecks have impeded market accessibility, affecting the commercialization process. Other aspects hindering agricultural commercialization are poor mechanization, lack of better market information on price, quality and standards.
7. Contract farming has been successfully practiced7 in Nepal albeit on a smaller scale (see Box 2). The Agro Enterprise Centre of the Federation of Nepalese Chamber of Commerce and Industry first introduce contract farming of tomato, mandarin orange and banana in eastern region of Nepal (Poudel, n.d.). Lately, Seed
6 Draft Agribusiness Promotion Bill.7 Though contract farming Act has not been enacted, contract farming has been included in the
National Agriculture Policy - 2061 (Poudel, n.d.).

18 Macroeconomic Update
Entrepreneurs’ Association of Nepal has been promoting contract farming of vegetable seeds to meet the domestic demand for improved seeds (MoAC and IFAD, 2011). A recent study shows that farmers participating in contract farming of ginger in Nepal earn about 58% higher net profits compared to non-participating ginger farmers (Kumar et al., 2016). They also find that contract farming positively impacts the adoption of food safety measures at farm-level. But, its propagation on a wider scale will largely center on passing the legislation. Contract farming has failed in the absence of regulatory and legal environment and poor enforcement in various parts of the world (Prowse, 2012). Farmers participating in contract farming may engage in side-selling of both inputs and final produce, and the firm’s monopsony power may depress producer prices (Prowse, 2012). Such risks can be minimized via a simple registration with a legal firm signed by both the parties, whereby the contract shall adhere to the legal framework either at the national or regional level (Prowse, 2012).
ii. Cooperative farming8 Cooperative farming initiative entails bringing ‘small farmers together as owners of land and as laborers thereby attaining an adequate scale with the appropriate technology and effective management and marketing services for modern farming practices’ (Parsons, 1965). The cooperative movement is advocated as a major vehicle for agricultural commercialization and rural development (Torgerson et al.,1997). Small-holder farmers benefit from farmer cooperatives as they help lower the cost of farm inputs by purchasing in bulk quantities from the supplier. They also help acquire better
Sakhejung Hill Range Tea Processing Pvt. Limited, located in Ilam district of eastern Nepal, has been producing and marketing high quality orthodox tea. Privately owned and operated, the company procures tea leaves from three farmer groups and a cooperative affiliated with 200 smallholder tea farmers. The company was initially supported by the ADB-financed Commercial Agriculture Development Project, which provided 50% of the investment cost of establishing a small-scale processing facility. The company has since grown and currently produces around 20 metric tons of various grades of orthodox tea of which about 50% is exported to Taiwan and the rest sold in the domestic market. A private certification company, CERES has certified Sakhejung tea as an organic, fair trade. The Sakhejung Tea Processing Ltd. has realized that it is
worth spending an annual certification fee of about Euro 3,500 to access foreign markets. Tea farmers have received a premium on their leaves. Even the tea-pickers supplying to Sakhejung Tea House have received almost twice as much as other tea-pickers in the district. This model demonstrates that business-to-business linkages can work even in the absence of a legislative framework on contract farming or product certification. The model is gradually expanding across the tea sector and can well be adopted for other commodities across Nepal. The key challenges however faced by such small businesses are access to market information, prices, and the availability of new technologies. Nepal Tea and Coffee Development Board, Nepal Tea Association and concerned stakeholders can play facilitative roles in mitigating this gap.
Box 2: Sakhejung tea processing house –emerging practices in Nepal
Source: Staff field observation

Macroeconomic Update 19
prices for farm produce of their members by selling large quantities of produce with regularity. The Cooperative Act of 1992 in Nepal led to formation of several types of cooperatives including agriculture and dairy cooperatives. Milk cooperatives spread out in 33 districts supply over 60 million liters of milk annually, collected from more than 75 thousand milk producers, to Dairy Development Corporation, the state-owned enterprise.8 DDC today boasts of having state-of-the-art dairy plants, cheese manufacturing plants, milk chilling plants, thanks to successfully operating milk cooperatives in Nepal.
9 Nevertheless, the overall desired outcome of invigorating commercial farming on a wider scale has not been satisfactory (Poudel, 2007). Cooperatives have largely suffered from inadequate capital and monitoring further worsened by poor managerial and technical capabilities (Poudel, 2007). Poor infrastructure including transport and storage facilities, limited market information and regulatory and institutional hurdles have constricted the growth of cooperative farming in Nepal.9 In neighboring India, the dairy cooperative movement has helped transform socio-economic condition of the rural poor (see Box 3). Similarly, Indian Farmers Fertilizer Cooperative Limited is another largest cooperative societies in India primarily involved in the manufacture and distribution of fertilizers.10
10 Identifying cooperative as one of the major pillars of economic development, a new Cooperative Act 2017 has been enacted replacing the previous one. This new Act aims at implementing good governance practices in the cooperative societies. For instance, the Act provisions harsher penalties for embezzlement of cooperative fund.11 Consumer cooperatives and other types of cooperatives are barred
Anand Milk Union Limited (AMUL), a dairy cooperative movement in India is credited for initiating the White Revolution that made India the world’s largest producer of milk and milk products. This brand name is marketed and managed by Gujarat Cooperative Milk Marketing Federation, a cooperative society that has a joint ownership of around 2.6 million milk producers in Gujarat, India. Gujarat Cooperative Milk Marketing Federation procures, processes and markets milk and milk products from
the village, district and state levels. The district units of the cooperative provide livestock services related to feed and veterinary care along with training and education. This state level apex body of milk cooperative organization in Gujarat has not only catered consumers’ needs by providing quality milk and milk products but also provided high returns to dairy farmers. This model has helped raise the income of small and medium farmers.
Box3: A success story of AMUL, a dairy cooperative movement in India
Source: <http://www.sankalpindia.net/the-solution-amul>
8 Details available at: <http://www.dairydev.com.np/list/Introduction/4/0/36>9 Details available at: <https://borgenproject.org/cooperative-farmers-in-nepal/>10 Details available at: <http://www.iffco.in/content/index/about-us>11 Details available at: <https://www.thenews.coop/109690/sector/banking-and-insurance/new-law-nepalese-co-operatives/>

20 Macroeconomic Update
from providing savings and credit facilities. Such facility is exclusive to only savings and credit cooperatives.
11 With appropriate research and extension support and national strategy on land consolidation and farm-size along with good governance, cooperative movement in Nepal can be revitalized for farmer empowerment and rural development. As of January 2018, the total number of cooperatives stand at 34,512 with most being savings and credit and multi-purpose followed by agriculture, dairy and consumer cooperatives. About 60,517 people are employed and an approximately 6.3 million people are affiliated with the cooperatives in Nepal (Department of Cooperatives, 2017).
iii. Agribusiness development initiatives12 The government of Nepal has initiated agribusiness promotion with the support from donor communities. Some of the notable projects are the High Mountain Agribusiness and Livelihood Improvement (HIMALI) project and Raising Incomes of Small and Medium Farmers (RISMF) project under the assistance of ADB, the High Value Agriculture Project under the assistance of International Fund for Agricultural Development, and the Project for Agriculture Commercialization and Trade under the assistance of the World Bank. These projects essentially provide matching grants to eligible cooperatives, farmers’ groups, and private entrepreneurs for primary production, technology support, value chain development, post-harvest facilities, and facilitate market linkages (see Box 4). Project for Agriculture Commercialization and Trade also facilitates export promotion of agriculture produce by enhancing farmers’ abilities to comply with Sanitary and Phytosanitary requirements as per the World Trade Organization standards (World Bank, 2014). While the grant amount and modalities of financing vary across projects, they essentially absorb some of the risks associated with entrepreneurship via grant provision (see Box 5). The projects have shown potential farmers a path to agribusiness. However, perennial issues related to short-supply of farm inputs, market accessibility, SPS and certification issues pertaining to food standards persist that need to be systematically dealt by the governments in consultation with the private sector.
13 Further, as projects supported by donors near completion, their sustainability remains a big challenge. The discontinuation of good practices will risk the sustainability of commercial farming. For instance, the farm entrepreneurs will need technical and financial support over time. Extension services, market linkages and value

Macroeconomic Update 21
upgradation will be needed to sustain their agribusinesses. Access to credit and the availability of farm inputs and modern technologies should be prioritized for agribusiness expansion. This is where the local and provincial governments can play effective roles by designing appropriate plans and policies aligned with government of Nepal’s Agriculture Development Strategy. The central bank has already mandated banks and financial institutions (BFIs) to open branch offices at local levels that are still devoid of financial institutions. The bank has urged commercial banks to extend 10% of their total credit to agriculture sector. Such and other supportive mechanisms should be institutionalized. Capacity of Agriculture Inputs Limited to address the short-supply of farm inputs particularly fertilizers should be enhanced. Favorable environment should be created with the right kind of policies to attract private sector in the supply of farm inputs. Customs duty concessions on the import of majority of agriculture inputs should be provided. Farm produce collection centers and haat-bazars should be well managed. Expansion of rural roads and rural electrification crucial for market outreach should be expedited.
iv. Concluding remarksa. The Fourteenth Three-year Plan (FY2017-FY2019) and the Fiscal
Policy for FY2018 have considered sustainable development goals (SDGs) while allocating resources (National Planning Commission, 2017). While SDG 1 is about reducing poverty, SDG 2 is about raising farm incomes. To meet these two important goals by 2030, Nepal must solidly embark on commercial farming. This will help raise farm income and alleviate poverty as evident with success stories of HIMALI and such other projects in selected districts of the country.
The ADB-financed Raising Incomes of Small and Medium Farmers (RISMF) project of the government of Nepal has been focusing on the development of agricultural value chains in potato, banana, lentils and honey in ten districts of provinces 6 and 7. Proposals were invited from agricultural cooperatives, agribusinesses and farmer groups in a phased manner allowing the project to provide investment for developing various components of value chains in the above-mentioned commodities. Because of project intervention in the honey value chain, entrepreneurs now produce queen bees for starting new colonies, prepare artificial combs
for a quick establishment of bee colonies, produce and sell processed honey through farmer groups. Similarly, in the case of banana and potato value chains, investments have been made in tissue culture to produce genetically superior planting material, construction of cold storage facilities and food processing centers. In the lentil value chain, investment in seed processing has increased the availability of high quality seeds. The project has also facilitated the establishment of ‘value chain platforms’, a network of all the actors within the value chain to encourage business-to-business linkages and marketing.
Box 4: Transitioning to agricultural value chains
Source: Staff field observation

22 Macroeconomic Update
b. Commercial agriculture can be one of the major sources of revenue generation for the country if practiced on a wider scale. Agribusiness will help generate local employment, meet domestic demand with improved crop and livestock production and promote export potential of niche agro products. Nepal has a revealed comparative advantage on several high-value, low-volume cash crops such as ginger, cardamom, tea and lentils. Agribusiness holds an immense potential given the duty-free access for Nepal’s agricultural products to India as well as the recent uptick in international demand for Nepal’s organic products. But, maintaining their quality standards while increasing production level remains crucial for raising farm revenue.
c. With increased road connectivity over time, market accessibility for rural farmers has improved. For instance, a 72 km Beni-Jomsom road connecting Mustang to Pokhara and the 47 km Kagbeni-Jaite road have provided a reliable and economical market access for apples of Mustang district.12 The recently built Karnali Highway has provided market access to farmers from remote villages of Jumla district.13 Such infrastructure developments make farm produce cost-effective enabling the promotion of commercial agriculture.
d. The ongoing construction of Postal Highway across the Terai region and Mid-Hill Highway running from east to west are expected to provide great impetus to market linkages. Similarly, irrigation facilities have expanded lately and some of the major
12 For details, please see: <http://nepaliheadlines.com/road-link-boon-to-commercial-apple-farming-in-mustang/>13 For details, please see: <http://www.myrepublica.com/news/24550/>
The ADB-financed High Mountain Agribusiness and Livelihood Improvement (HIMALI) project provides partial grants of up to 80% of the total investment cost for starting or scaling up agribusinesses in ten remote mountain districts of Nepal. The project supports farm and livestock production agribusiness including agro-processing enterprises. The project has so far financed 640 agribusinesses across Nepal’s highlands. Agribusinesses are owned and operated by private entrepreneurs and are registered with the tax office, cooperatives, while companies are registered under the Company Act. The grants have encouraged prospective
entrepreneurs to initiate agribusinesses which they had previously not attempted due to high risk of doing business in remote highlands. A structural change towards market-oriented agriculture along with the adoption of new technologies and farming methods are the effects of project intervention. However, there are challenges too. Most of the new entrepreneurs have poor managerial and marketing skills and limited access to finance. And agribusinesses have not been able to supply produce beyond the immediate local markets due to limited production.
Box 5: Sharing the risks of agribusinesses development in the highlands of Nepal
Source: Staff field observation

Macroeconomic Update 23
irrigation projects such as Sikta and Rani Jamara Kulariya, if completed in a timely manner, will greatly facilitate the scope of commercial agriculture.
e. When agribusiness becomes lucrative, the current practice of land fragmentation leading to an increased proportion of small-holder farmers will be discouraged. The formation of farmers’ groups either under cooperative or contract farming modalities will support land consolidation.
f. Commercial farming if promoted on a wider scale can limit the current exodus of youths to Gulf countries for foreign employment. This will in turn help negate Nepal’s growing reliance on remittances for external sector stability.
g. In sum, commercial farming is indispensable for scaling up production of not only competitive agro-products, but also traditional crops such as rice. This will be instrumental in minimizing the current agricultural trade deficit. Further with commercial farming, value chain development will flourish leading to realization of farm to fork approach. And agro-processing firms will grow thereby strengthening agro-industrial base.

24 Macroeconomic Update
ReferencesCentral Bureau of Statistics (CBS) (2013). Summary of Agriculture
Census 2011.
Department of Cooperatives, Ministry of Agricultural, Land Management and Cooperatives (2017). Cooperative Statistics 2017.
Dutta, A., Dutta, A., and Sengupta, S. (2016). “A case Study of Pepsico Contract Farming for Potatoes.” IES Management College and Research Centre, Mumbai, Bandra.
Heltberg, R. (2001). “Commercialization and specialisation in Mozambican Agriculture.” mimeo, Institute of Economics, University of Copenhagen, 2 January.
Kumar, A., Roy, D., Tripathi, G., Joshi, P.K., and Adhikari, R. (2016). “Can Contract Farming Increase Farmers’ Income and Enhance Adoption of Food Safety Practices? Evidence from Remote Areas of Nepal.” IFPRI Discussion Paper 01524.
Leavy, J. and Poulton C. (2007). “Commercialization in Agriculture.” Ethiopian Journal of Economics, Volume XVI, No 1.
MOAC and IFAD (2011). “High Value Agriculture Project in Hill and Mountain Areas (HVAP): A report on Value chain analysis of vegetable seeds in Nepal and Mountain Areas.”
National Planning Commission (NPC), (2017). Fourteenth Three-year Plan (FY2017-FY2019). Kathmandu, Nepal.
Parsons, K. H. (1965). “The Tunisian Program for Cooperative Farming.” Land Economics, Vol. 41, No. 4, pp. 303-316.
Pingali, P. L. (1997). “From subsistence to commercial production systems: the transformation of Asian agriculture”. American Journal of Agricultural Economics 79(2): 628-634.
Pingali, P. L, and M.W. Rosegrant. (1995). Agricultural Commercialization and diversification: processes and policies. Food Policy 20 (3) 171-185.
Poudel, D.D. (2007). “Farmer Cooperatives for Food Self-sufficiency, Agricultural Commercialization and the Socio-economic Development of Nepal.” Proceedings of Unfolding Futures: Nepalese Economy, Society and Politics.

Macroeconomic Update 25
Poudel, K. L. (n.d.). “Contract Farming and its Prospective in Nepal.” Agro Enterprise Centre/ Federation of Nepalese Chamber of Commerce and Industry, Kathmandu. Available online at: <http://www.fao.org/fileadmin/user_upload/contract_farming/presentations/Contract_farming_in_Nepal.pdf>
Prowse, M. (2012). “Contract farming in developing countries: a review.” Agence Francaise de Development (AFD).
Rehber, E. (2007). Contract Farming: Theory and Practice. ICFAI University Press, Hyderabad, India.
Strasberg Paul J., T.S. Jayne, T Yamano, J Nyoro, D Karanja, and J Strauss. (1999). “Effects of Agricultural Commercialization on Food Crop Input Use and Productivity in Kenya.” MSU International Development Working Paper No. 71, 1999.
Torgerson, R. E., B. J. Reynolds, and T.W. Gray (1997). “Evolution of Cooperative thought, theory and purpose.” University of Wisconsin Center of Cooperatives.
Von Braun, (1995). “Agricultural Commercialization: impacts on income, nutrition and implications for policy.” Food Policy 20 (3): 87-202.
Von Braun, J. & Kennedy, E. (eds.) (1994). “Commercialization of Agriculture, Economic Development and Nutrition”. John Hopkins Press, Baltimore, MD.
World Bank (2014). “Nepal: Agriculture Commercialization and Trade.” Available online at: <http://www.worldbank.org/en/results/2014/04/11/nepal-agriculture-commercialization-and-trade>

26 Macroeconomic Update
GDP = gross domestic product; P = provisionalNote: FY2017 starts on 16 July 2016 andends on 15 July 2017.
a Based on FY2017 National Accounts Statistics. Central Bureau of Statisticsb Refers to gross fixed investmentand does not include change in stocksc Based on FY2017annualdata. Nepal Rastra Bank d Based on FY2017preliminary annual data. Financial Comptroller General Office e Includes cash balance of previous yearf Based on FY2016annual data. Financial Comptroller General Office
Sources: Ministry of Finance. FY2018 Budget Speech. Kathmandu; Nepal Rastra Bank. 2017. Macroeconomic Situation. Kathmandu; Central Bureau of Statistics. April 2017. FY2017Na-tional Accounts Statistics. Kathmandu;Central Bureau of Statistics. 2014. National Population and Housing Census 2011 (Population Projection 2011 – 2031). Kathmandu; Financial Comptroller General Office.
ItemFiscal Year
2013 2014 2015 2016 2017PA. Income and Growth 1. GDP per Capita ($, current) 709.4 725.5 766.9 745.4 851.4 a
2. GDP Growth (%, in basic prices) 3.8 5.7 3.0 0.01 6.9 a
a. Agriculture 1.1 4.5 1.1 0.03 5.3 a
b. Industry 2.7 7.1 1.4 (6.3) 10.9 a
c. Services 5.7 6.2 4.6 2.1 6.9 a
B. Saving and Investment (current and market prices, % of GDP) 1. Gross Domestic Investmentb 22.6 23.5 28.0 28.8 33.8 2. Gross National Saving 40.7 45.7 44.1 40.0 43.8
C. Money and Inflation 1. Consumer Price Index ( average annual % change) 9.9 9.1 7.2 9.9 4.5 c
2. Total Liquidity (M2) (annual % change) 16.4 19.1 19.9 19.5 15.5 c
D. Government Finance (% of GDP) 1. Revenue and Grants 19.5 20.6 20.8 23.2 24.7d
2. Expenditure and Onlending 18.8 20.0 21.8 23.7 30.2 d
3. Overall Fiscal Surplus (Deficit)e 0.8 0.9 (0.7) (0.3) (5.4) d
E. Balance of Payments 1. Merchandise Trade Balance (% of GDP) (27.2) (30.3) (31.1) (30.3) (34.5) c
2. Current Account Balance (% of GDP) 3.4 4.6 5.1 6.2 (0.4) c
3. Merchandise Export ($) Growth (annual % change) (2.9) 5.1 (3.9) (28.8) 12.1 c
4. Merchandise Import ($) Growth (annual % change) 10.9 13.9 8.0 (7.1) 37.1 c
5. Remittances (% of GDP) 25.6 27.7 29.0 29.6 26.8 c
F. External Payments Indicators1. Gross Official Reserves ($ million) 5,613.7 6,938.6 8,147.7 9,736.8 10,495.1 c
Months of current year’s imports of goods) 10.1 10.0 11.2 14.1 11.4 c
2. External Debt Service (% of exports of goods and services) 9.5 8.9 8.1 9.9f 10.8 3. Total External Debt (% of GDP) 19.7 17.7 16.1 17.3f 15.9
G. Memorandum Items 1. GDP (current prices, NRs billion) 1,695.0 1,964.5 2,130.2 2,247.4 2,599.2 a
2. Exchange Rate (NRs/$, average) 87.7 98.0 99.2 106.1 105.9 c
3. Population (million) 27.3 27.6 28.0 28.4 28.8
Appendix 1: Country Economic Indicators

Macroeconomic Update 27
ItemPeriod
1990s 2000s Latest YearA. POPULATION INDICATORS1. Population (million) 18.5 (1991) 23.2 (2001) 28.4 (2016)2. Population growth (annual % change) 2.1 2.2 1.4 (2016)
B. Social Indicators1. Fertility rate (births/woman) 5.1 (1996) 3.6 (2004) 2.3 (2016)2. Maternal mortality ratio (per 100,000 live births) 539.0 (1996) 281 (2006) 239.0 (2016)3. Infant mortality rate (below 1 year/1,000 live births) 82.0 (1991) 48.0 (2006) 32.0 (2016)4. Life expectancy at birth (years) 55.0 (1991) 62.0 (2001) 70.0 (2015)
a. Female 54.0 (1991) 63.0 (2001) 71.0 (2015)b. Male 55.0 (1991) 62.0 (2001) 68.0 (2015)
5. Adult literacy (%) 35.6 (1996) 48.0 (2004) 64.0 (2016)a. Female 19.4 (1996) 33.8 (2004) 54.2 (2016)b. Male 53.5 (1996) 64.5 (2004) 75.3 (2016)
6. Primary school gross enrollment (%) 57.0 (1996) 72.0 (2004) 133.6 (2016)7. Secondary school gross enrollment (%) 43.8 (2001) 54.4 (2004) 79.0 (2016)8. Child malnutrition (% below 5 years old) 57.0 36.0 (2016)9. Population below poverty line (international, %) 68.0 (1996) 53.1 (2003) 24.82 (2011)10. Population with access to safe water (%) 45.9 82.5 (2006) 95.0 (2016)11. Population with access to sanitation (%) 22.0 (1995) 24.5 (2006) 62.0 (2016)12. Public education expenditure (% of GDP) 2.0 2.9 (2005) 4.4 (2016)13. Human development index 0.341 0.429 (2005) 0.558 (2015)14. Rank/total number of countries 152/173 136/177 (2003) 144/188 (2015)15. Gender-related development index 0.33 (1995) 0.511 (2003) 0.925 (2015)16. Rank/total number of countries 148/163 (1995) 106/140 (2003) 144/188 (2015)
C. Poverty Indicators1. Poverty incidence 42 (1996) 31 (2004) 25.16 (2011)2. Proportion of poor to total population
a. Urban 23.0 (1996) 9.55 (2004) 15.46 (2011)b. Rural 44.0 (1996) 34.62 (2004) 27.43 (2011)c. Mountain 57.0 (1996) 32.6 (2004) 42.77 (2011)d. Hills 40.7 (1996) 34.5 (2004) 24.32 (2011)e. Terai 40.3 (1996) 27.6 (2004) 23.44 (2011)
3. Poverty gap 11.75 (1996) 7.55 (2004) 5.43 (2011)4. Poverty severity index 4.67 (1996) 2.7 (2004) 1.81 (2011)5. Inequality (Theil Index) … … …6. Multidimensional poverty index1 … … 0.116 (2015)
… = not available, GDP = gross domestic product,
Sources: Central Bureau of Statistics. 2012. National Population and Housing Census 2011. Kathmandu; Central Bureau of Statistics. 2014. National Population and Housing Census 2011 (Population Projection 2011-2031). Kathmandu;Central Bureau of Statistics. 2016. Annual Household Survey 2015/16. Kathmandu; Ministry of Health. 2017. Nepal Demographic and Health Survey 2016. Kathmandu;United Nations Development Programme. 2017. Human Development Report 2016. New York; Central Bureau of Statistics. 2011. Poverty in Nepal (2010/11). Kathmandu; Ministry of Finance. 2016. Budget Speech of FY2016/17. Kathmandu; World Bank. World Development Indicators database. https://data.worldbank.org/ (accessed 13 February 2018).
1 UNDP replaced Human Poverty Index with Multidimensional Poverty Index from Human Development Report 2011.
Appendix 2: Country Poverty and Social Indicators

28 Macroeconomic Update
ASIAN DEVELOPMENT BANK6 ADB Avenue, Mandaluyong City1550 Metro Manila, Philippineswww.adb.org
ADB NEPAL RESIDENT MISSIONMetro Park Building, LazimpatPost Box 5017, Kathmandu, [email protected]/nepalwww.facebook.com/adbnrm/


![Presentation on update of macroeconomic framework for negotiations 2[1]](https://img.pdfslide.us/doc/110x75/546beea4b4af9f892c8b4ea8/presentation-on-update-of-macroeconomic-framework-for-negotiations-21.jpg)