Embed Size (px)
Citation preview
Resource Pack for the Economics Curriculum (Secondary 4-6)
Macroeconomic Effects of External
Shocks on Hong Kong:
The Case of the Great Recession
Personal, Social and Humanities Education Section
Curriculum Development Institute
Education Bureau 2014
1
Background This resource pack is published to support teachers in guiding students to explore
and apply economic concepts to authentic cases. The aims of carrying out these
activities are to enhance students’ learning of economics as well as facilitate their
appreciation of the wide application of economics to their daily life.
The Education Bureau has invited Professor Michael Fung, the Executive Director of
the Aviation Policy and Research Centre, Business School of CUHK to develop this
resource pack. The pack first outlines the background of the global financial crises
broke out in 2008 and its impacts on Hong Kong economy. It then followed by
economic analyses based on macroeconomic data and economic concepts e.g.
aggregate demand & aggregate supply model. Analytical questions and suggested
answers in the last section are designed to direct students’ search for deeper
understanding of the relevant economic concepts.
If you have any comments and suggestions on the resource pack, please send them
to
Chief Curriculum Development Officer (Personal, Social and Humanities Education)
Curriculum Development Institute
Education Bureau
Room 1319, 13/F., Wu Chung House
213 Queen’s Road East
Wanchai, Hong Kong
Fax.: 25735299
E-mail: [email protected]
2
Macroeconomic Effects of External Shocks on Hong Kong: The Case of the
Great Recession
I. Background and timeline of events
The U.S. Subprime financial crisis was trigged by a series of events in 2008. In
March, the Bear Sterns Company Inc. collapsed because two of its hedge funds
failed. Then, the Federal Reserve Board (FRB) injected short term liquidity to
support the financial sector. The market had been stabilized for a while but the
crisis worsened when Lehman Brothers went bankrupt in mid-September. Even
worse, the collapse of Lehman Brothers exerted immense pressure on American
International Group (AIG) for it had to pay short term debts. Again, FRB
injected capital to prevent further collapse of AIG. In December, General Motors,
Chrysler and Ford requested urgent financial assistance from the US government.
As the US economy was still in the recession, FRB decided to adopt “quantitative
easing” and “operation twist” to stimulate the economic growth.
Year Date Issue
2008 March 24 FRB New York financed JP Morgan and Co. to acquire The
Bear Stearns Company Inc.
July 30 President Bush signed the Housing and Economic Recovery Act
2008 to stabilize the conditions of Fannie Mac and Freddie Mac.
September 15 Lehman Brothers filed Chapter 11 for bankruptcy protection.
September 16 AIG needed to be bailed out by borrowing up to $85 billion from
the Federal Reserve Bank of New York.
September 29 The US House of Representatives voted against a bill submitted
by the Treasury Department for authorization of purchasing
troubled assets from financial institutions.
December 19 President Bush decided to bail out General Motors, Chrysler and
Ford for $17.4 billion through the US Treasury Department.
3
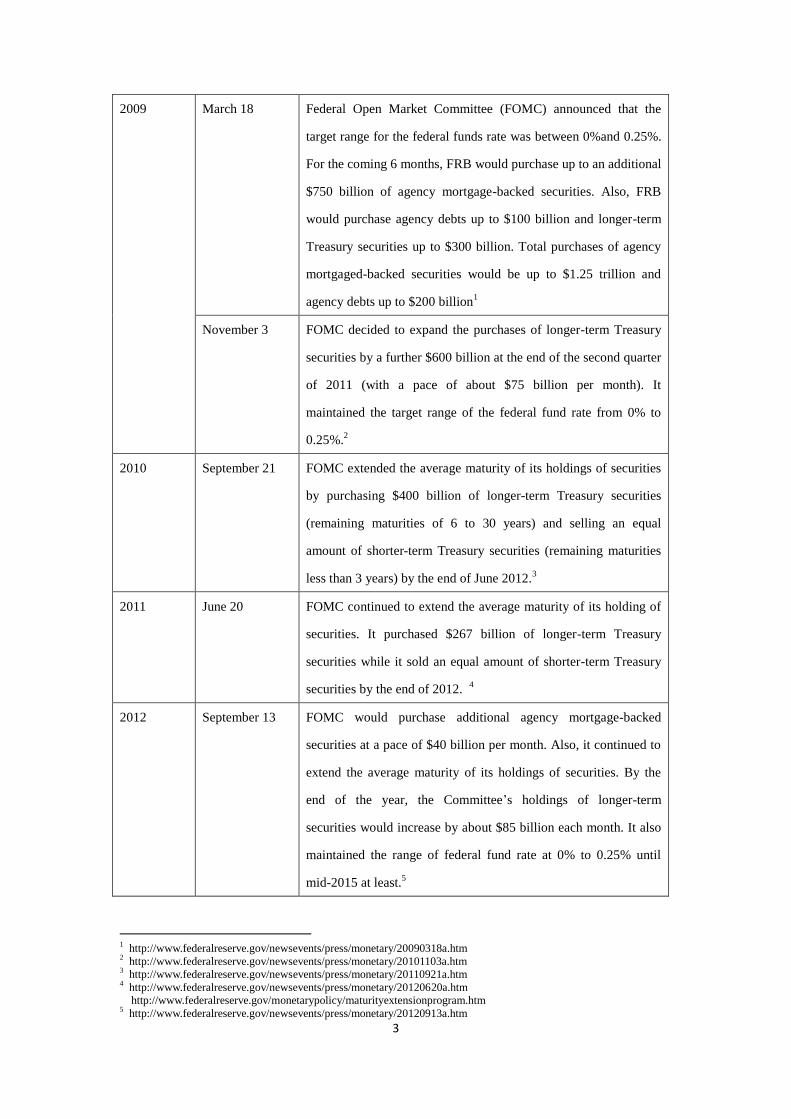
2009 March 18 Federal Open Market Committee (FOMC) announced that the
target range for the federal funds rate was between 0%and 0.25%.
For the coming 6 months, FRB would purchase up to an additional
$750 billion of agency mortgage-backed securities. Also, FRB
would purchase agency debts up to $100 billion and longer-term
Treasury securities up to $300 billion. Total purchases of agency
mortgaged-backed securities would be up to $1.25 trillion and
agency debts up to $200 billion1
November 3 FOMC decided to expand the purchases of longer-term Treasury
securities by a further $600 billion at the end of the second quarter
of 2011 (with a pace of about $75 billion per month). It
maintained the target range of the federal fund rate from 0% to
0.25%.2
2010 September 21 FOMC extended the average maturity of its holdings of securities
by purchasing $400 billion of longer-term Treasury securities
(remaining maturities of 6 to 30 years) and selling an equal
amount of shorter-term Treasury securities (remaining maturities
less than 3 years) by the end of June 2012.3
2011 June 20 FOMC continued to extend the average maturity of its holding of
securities. It purchased $267 billion of longer-term Treasury
securities while it sold an equal amount of shorter-term Treasury
securities by the end of 2012. 4
2012 September 13 FOMC would purchase additional agency mortgage-backed
securities at a pace of $40 billion per month. Also, it continued to
extend the average maturity of its holdings of securities. By the
end of the year, the Committee’s holdings of longer-term
securities would increase by about $85 billion each month. It also
maintained the range of federal fund rate at 0% to 0.25% until
mid-2015 at least.5
1 http://www.federalreserve.gov/newsevents/press/monetary/20090318a.htm
2 http://www.federalreserve.gov/newsevents/press/monetary/20101103a.htm
3 http://www.federalreserve.gov/newsevents/press/monetary/20110921a.htm
4 http://www.federalreserve.gov/newsevents/press/monetary/20120620a.htm
http://www.federalreserve.gov/monetarypolicy/maturityextensionprogram.htm 5 http://www.federalreserve.gov/newsevents/press/monetary/20120913a.htm
4
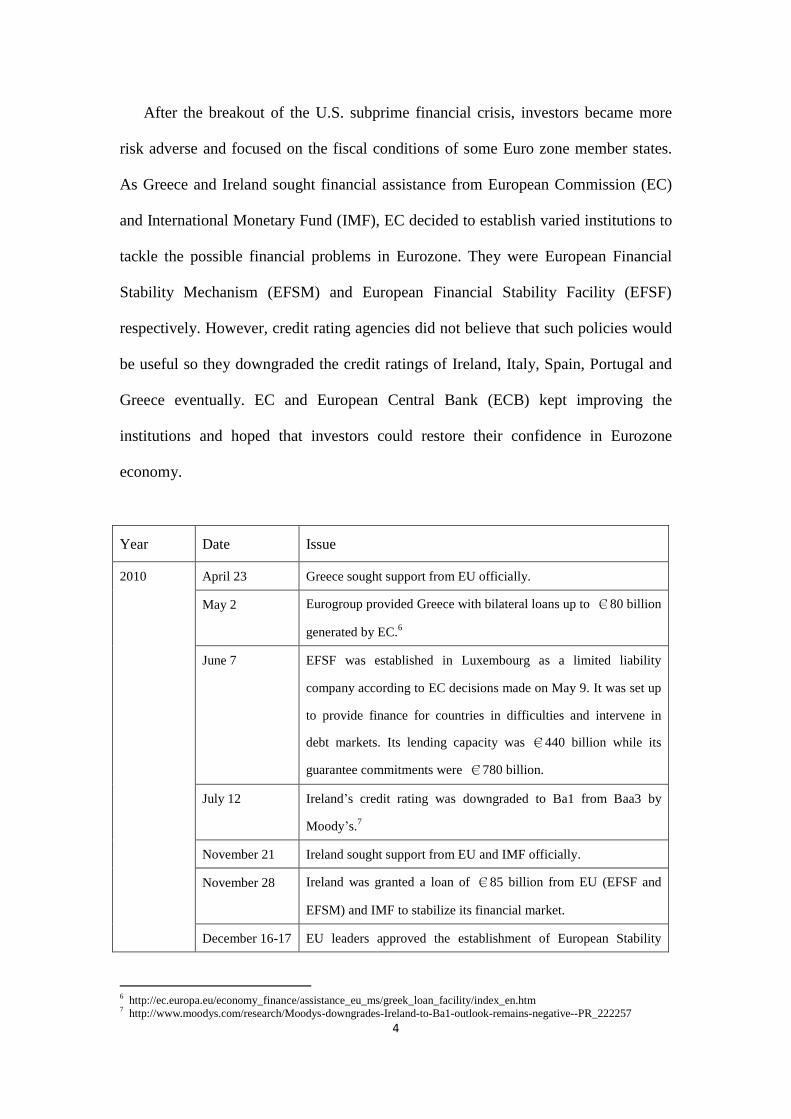
After the breakout of the U.S. subprime financial crisis, investors became more
risk adverse and focused on the fiscal conditions of some Euro zone member states.
As Greece and Ireland sought financial assistance from European Commission (EC)
and International Monetary Fund (IMF), EC decided to establish varied institutions to
tackle the possible financial problems in Eurozone. They were European Financial
Stability Mechanism (EFSM) and European Financial Stability Facility (EFSF)
respectively. However, credit rating agencies did not believe that such policies would
be useful so they downgraded the credit ratings of Ireland, Italy, Spain, Portugal and
Greece eventually. EC and European Central Bank (ECB) kept improving the
institutions and hoped that investors could restore their confidence in Eurozone
economy.
Year Date Issue
2010 April 23 Greece sought support from EU officially.
May 2 Eurogroup provided Greece with bilateral loans up to €80 billion
generated by EC.6
June 7 EFSF was established in Luxembourg as a limited liability
company according to EC decisions made on May 9. It was set up
to provide finance for countries in difficulties and intervene in
debt markets. Its lending capacity was €440 billion while its
guarantee commitments were €780 billion.
July 12 Ireland’s credit rating was downgraded to Ba1 from Baa3 by
Moody’s.7
November 21 Ireland sought support from EU and IMF officially.
November 28 Ireland was granted a loan of €85 billion from EU (EFSF and
EFSM) and IMF to stabilize its financial market.
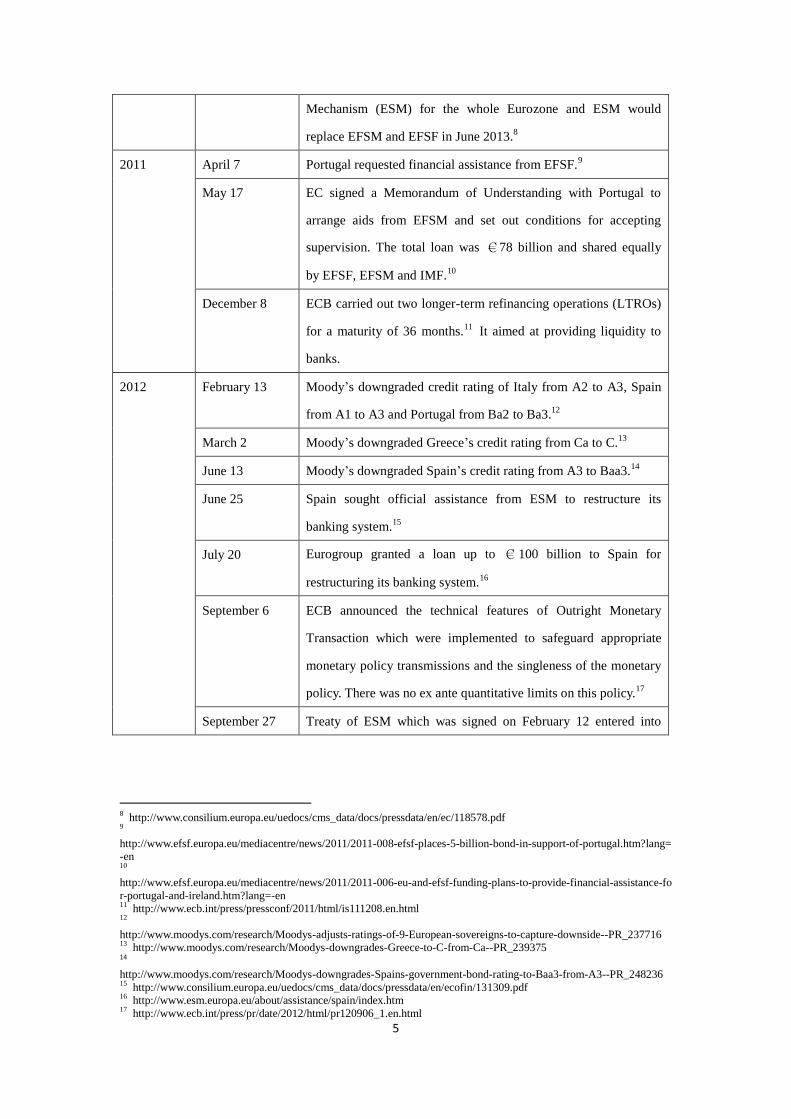
December 16-17 EU leaders approved the establishment of European Stability
6 http://ec.europa.eu/economy_finance/assistance_eu_ms/greek_loan_facility/index_en.htm
7 http://www.moodys.com/research/Moodys-downgrades-Ireland-to-Ba1-outlook-remains-negative--PR_222257
5
Mechanism (ESM) for the whole Eurozone and ESM would
replace EFSM and EFSF in June 2013.8
2011 April 7 Portugal requested financial assistance from EFSF.9
May 17 EC signed a Memorandum of Understanding with Portugal to
arrange aids from EFSM and set out conditions for accepting
supervision. The total loan was €78 billion and shared equally
by EFSF, EFSM and IMF.10
December 8 ECB carried out two longer-term refinancing operations (LTROs)
for a maturity of 36 months.11
It aimed at providing liquidity to
banks.
2012 February 13 Moody’s downgraded credit rating of Italy from A2 to A3, Spain
from A1 to A3 and Portugal from Ba2 to Ba3.12
March 2 Moody’s downgraded Greece’s credit rating from Ca to C.13
June 13 Moody’s downgraded Spain’s credit rating from A3 to Baa3.14
June 25 Spain sought official assistance from ESM to restructure its
banking system.15
July 20 Eurogroup granted a loan up to €100 billion to Spain for
restructuring its banking system.16
September 6 ECB announced the technical features of Outright Monetary
Transaction which were implemented to safeguard appropriate
monetary policy transmissions and the singleness of the monetary
policy. There was no ex ante quantitative limits on this policy.17
September 27 Treaty of ESM which was signed on February 12 entered into
8 http://www.consilium.europa.eu/uedocs/cms_data/docs/pressdata/en/ec/118578.pdf
9
http://www.efsf.europa.eu/mediacentre/news/2011/2011-008-efsf-places-5-billion-bond-in-support-of-portugal.htm?lang=
-en 10
http://www.efsf.europa.eu/mediacentre/news/2011/2011-006-eu-and-efsf-funding-plans-to-provide-financial-assistance-fo
r-portugal-and-ireland.htm?lang=-en 11
http://www.ecb.int/press/pressconf/2011/html/is111208.en.html 12
http://www.moodys.com/research/Moodys-adjusts-ratings-of-9-European-sovereigns-to-capture-downside--PR_237716 13
http://www.moodys.com/research/Moodys-downgrades-Greece-to-C-from-Ca--PR_239375 14 http://www.moodys.com/research/Moodys-downgrades-Spains-government-bond-rating-to-Baa3-from-A3--PR_248236 15
http://www.consilium.europa.eu/uedocs/cms_data/docs/pressdata/en/ecofin/131309.pdf 16
http://www.esm.europa.eu/about/assistance/spain/index.htm 17
http://www.ecb.int/press/pr/date/2012/html/pr120906_1.en.html
6
force as German government had ratified the treaty after the court
judgement. 18
II. Data response questions and suggested solutions
“The financial upheavals in many ASEAN countries during July and August,
and in North-East Asia during November and December, sent successive shock waves
across the region, extending into the major global financial centres. Delay in taking
credible action to deal with the roots of the problem in certain countries deepened and
prolonged the pain beyond anything one could have expected. Hong Kong could not
avoid the contagion effect. The turmoil induced a major speculative attack on the
Hong Kong dollar, tight liquidity at the banks, higher local interest rates and a severe
setback in the local stock market. Although our currency link and the financial sector
as a whole stood firm throughout the turmoil, business suffered and the economy took
a significant downturn towards the year end.”19
(The Budget 1998-99)
“Since the onset of the financial tsunami, a number of economies have
introduced expansionary fiscal measures and eased their monetary policies, resulting
in a surge in global liquidity. Large amounts of capital have been attracted into Asia,
including Hong Kong, in a short period of time, stimulating investment activities in
the asset markets.”20 (The Budget 2010-11)
“As Hong Kong is a small and open economy subject to external constraints, it
is inappropriate for us to solve the unemployment and poverty problems through
large-scale redistribution of wealth.”21
(The Budget 2010-11)
Hong Kong is a small and very open economy, which means that its economic
18
http://www.europarl.europa.eu/webnp/webdav/site/myjahiasite/users/fboschi/public/esm%20tscg/art.%20136%20ESM%
20fiscal%20compact%20ratprocess.pdf 19
The Budget 1998-99, http://www.budget.gov.hk/1998/english/eindex.htm 20
The Budget 2010-11, http://www.budget.gov.hk/2010/eng/budget06.html 21
Ibid, http://www.budget.gov.hk/2010/eng/budget62.html
7
activity does not affect world prices, it is free from capital controls, and it is closely
linked to external financial markets. Foreign capital can enter and leave the city freely
without any restrictions22
. Hong Kong is thus open to external shocks over which it
has little control.
The global financial crisis has led to a slowing down of almost all economies
since 2007. Hong Kong is no exception; the city’s economy is closely connected with
that of the rest of the world in terms of trade and capital flows, so it was in turn
dragged into recession. The following sections will investigate how this recent crisis
and external shocks affect Hong Kong’s economy in different ways.
1. Business Cycles in the U.S., China, and Hong Kong
We will begin by looking at what Gross Domestic Product (GDP) is, according to the
Hong Kong Census and Statistics Department.
GDP is a measure of the total value of production of all resident producing units
of an economy in a specific period (typically a year or a quarter), before deducting the
consumption of fixed capital.
Changes in ‘volume measure of GDP’ (also referred to as changes in real terms)
reflect changes in the volumes of goods and services produced or purchased from one
period to another.
Conceptually, changes over time in the GDP at current prices can be factored
into two components, reflecting (i) changes in the prices of goods and services
produced or purchased, and (ii) changes in their volumes. To measure the volume
22
Abel and Bernanke (2001), p.8.
8
growth of GDP and its components, the effect of price changes has to be eliminated.
The year-on-year change in the volume measure of GDP gives a measure of the ‘real’
growth of an economy. 23
(a) Define the term “Growth rate of real GDP.”
Answer: It is the percentage change in real GDP in terms of years or quarters.
(b) What is the meaning of a negative rate of real GDP growth?
Answer: The economy is contracting.
(c) What is the meaning of a positive rate of real GDP growth?
Answer: The economy is expanding.
23
Hong Kong Census and Statistics Department (2012),
http://www.censtatd.gov.hk/hkstat/sub/sc250.jsp
9
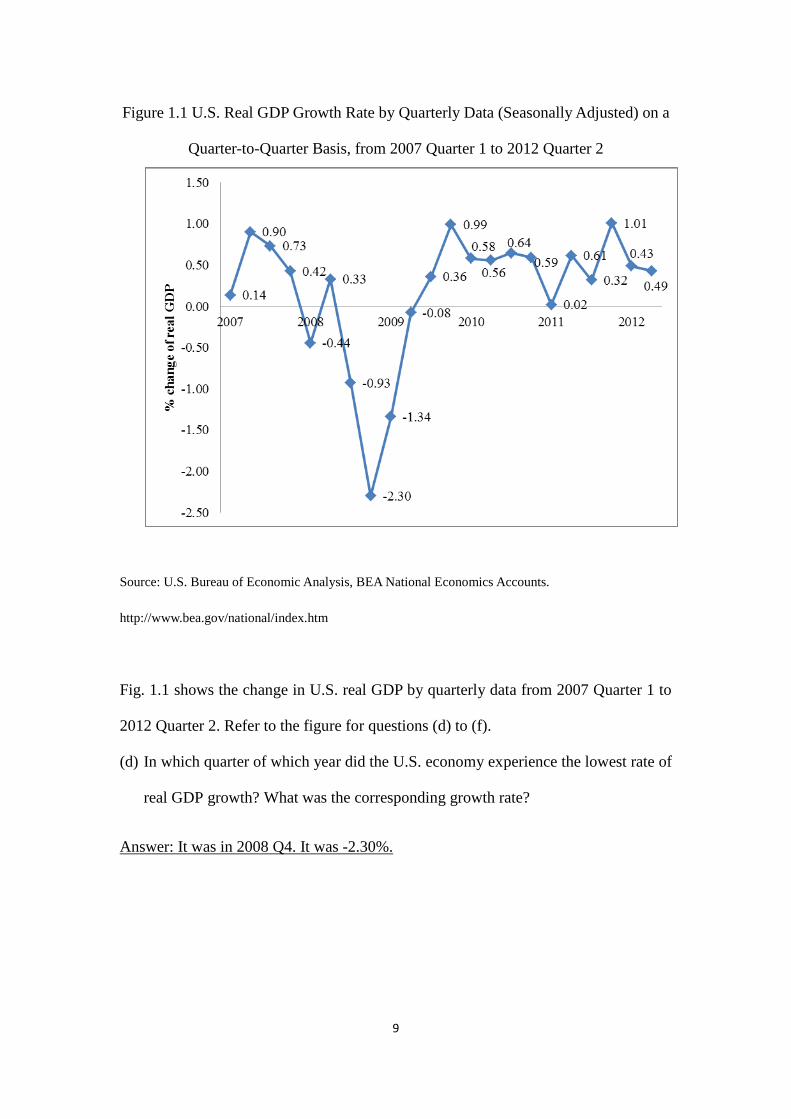
Figure 1.1 U.S. Real GDP Growth Rate by Quarterly Data (Seasonally Adjusted) on a
Quarter-to-Quarter Basis, from 2007 Quarter 1 to 2012 Quarter 2
Source: U.S. Bureau of Economic Analysis, BEA National Economics Accounts.
http://www.bea.gov/national/index.htm
Fig. 1.1 shows the change in U.S. real GDP by quarterly data from 2007 Quarter 1 to
2012 Quarter 2. Refer to the figure for questions (d) to (f).
(d) In which quarter of which year did the U.S. economy experience the lowest rate of
real GDP growth? What was the corresponding growth rate?
Answer: It was in 2008 Q4. It was -2.30%.
10
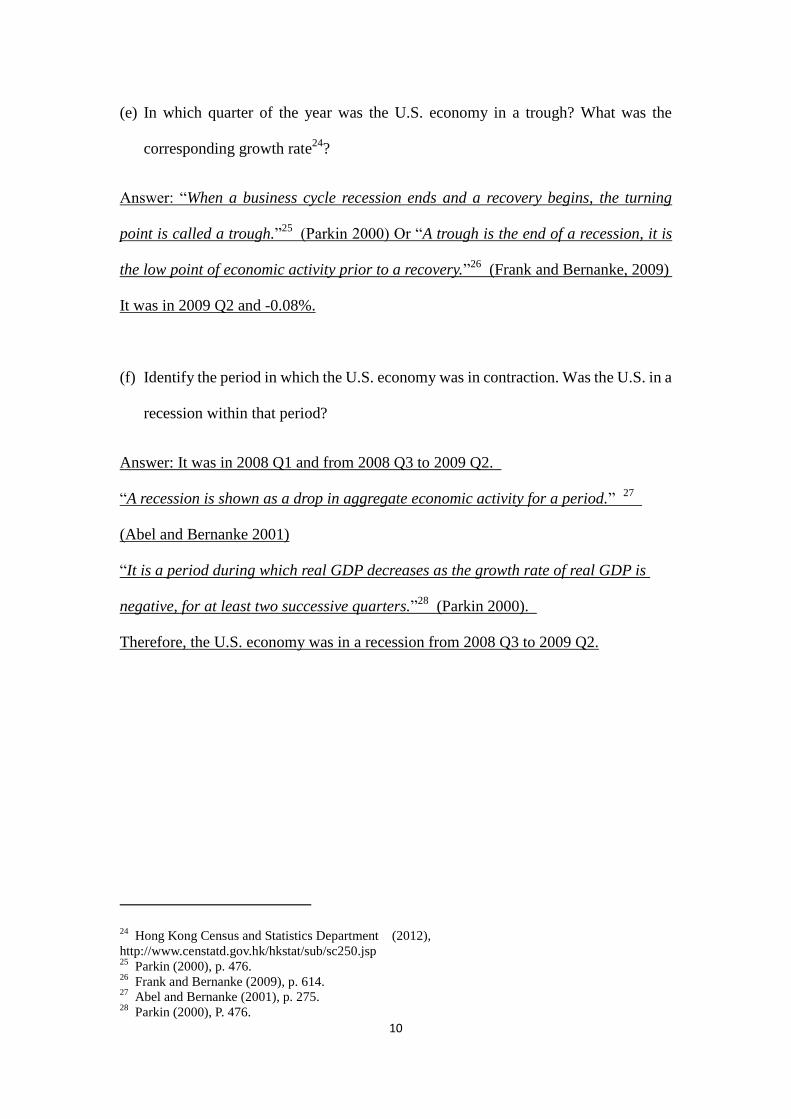
(e) In which quarter of the year was the U.S. economy in a trough? What was the
corresponding growth rate24
?
Answer: “When a business cycle recession ends and a recovery begins, the turning
point is called a trough.”25
(Parkin 2000) Or “A trough is the end of a recession, it is
the low point of economic activity prior to a recovery.”26
(Frank and Bernanke, 2009)
It was in 2009 Q2 and -0.08%.
(f) Identify the period in which the U.S. economy was in contraction. Was the U.S. in a
recession within that period?
Answer: It was in 2008 Q1 and from 2008 Q3 to 2009 Q2.
“A recession is shown as a drop in aggregate economic activity for a period.” 27
(Abel and Bernanke 2001)
“It is a period during which real GDP decreases as the growth rate of real GDP is
negative, for at least two successive quarters.”28
(Parkin 2000).
Therefore, the U.S. economy was in a recession from 2008 Q3 to 2009 Q2.
24
Hong Kong Census and Statistics Department (2012),
http://www.censtatd.gov.hk/hkstat/sub/sc250.jsp 25
Parkin (2000), p. 476. 26
Frank and Bernanke (2009), p. 614. 27
Abel and Bernanke (2001), p. 275. 28
Parkin (2000), P. 476.
11
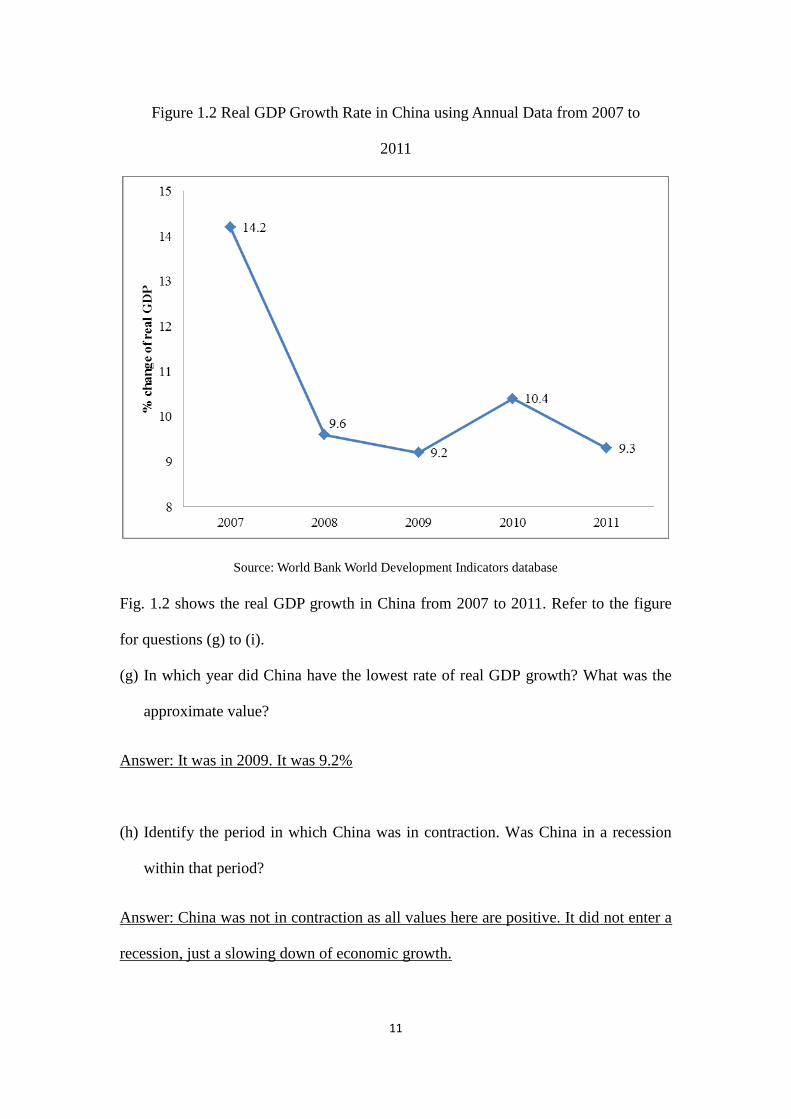
Figure 1.2 Real GDP Growth Rate in China using Annual Data from 2007 to
2011
Source: World Bank World Development Indicators database
Fig. 1.2 shows the real GDP growth in China from 2007 to 2011. Refer to the figure
for questions (g) to (i).
(g) In which year did China have the lowest rate of real GDP growth? What was the
approximate value?
Answer: It was in 2009. It was 9.2%
(h) Identify the period in which China was in contraction. Was China in a recession
within that period?
Answer: China was not in contraction as all values here are positive. It did not enter a
recession, just a slowing down of economic growth.
12
(i) Compare Fig 1.2 to Fig. 1.1. Is there any correlation between the changes in these
two economies?
Answer: Yes, the real GDP growth rates of both economies fell sharply in 2008.
However, the U.S. was in a recession while China’s economy slowed down.
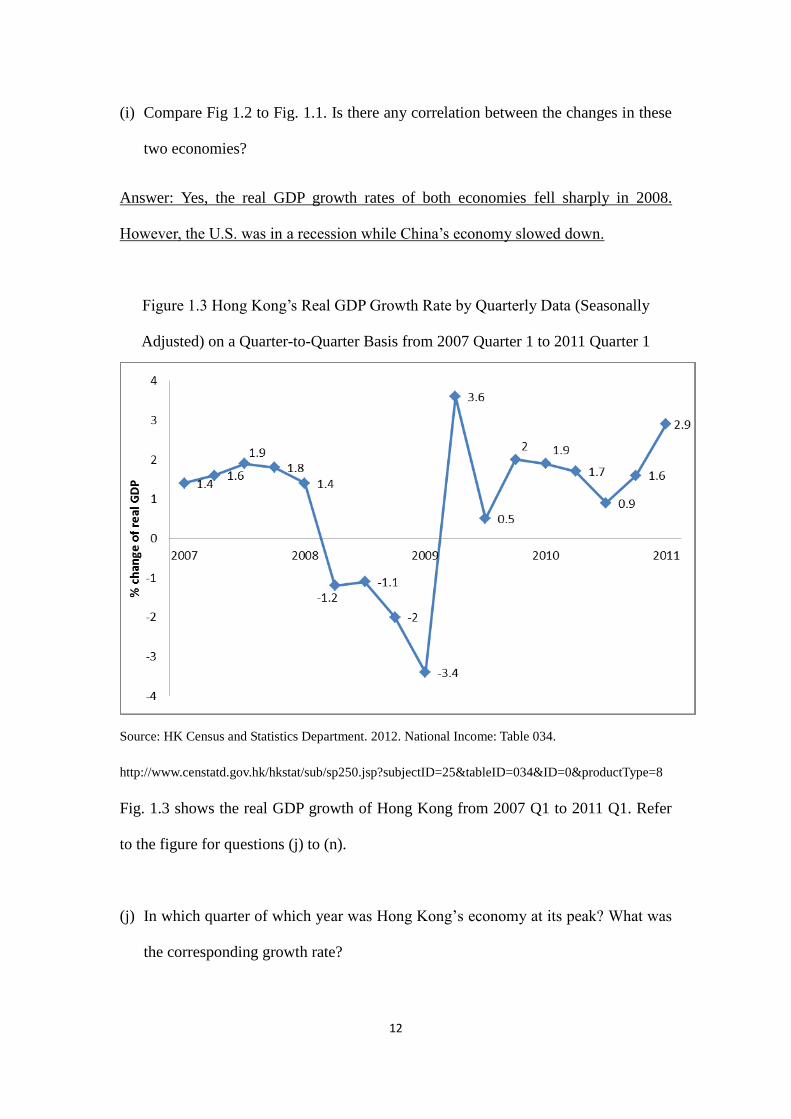
Figure 1.3 Hong Kong’s Real GDP Growth Rate by Quarterly Data (Seasonally
Adjusted) on a Quarter-to-Quarter Basis from 2007 Quarter 1 to 2011 Quarter 1
Source: HK Census and Statistics Department. 2012. National Income: Table 034.
http://www.censtatd.gov.hk/hkstat/sub/sp250.jsp?subjectID=25&tableID=034&ID=0&productType=8
Fig. 1.3 shows the real GDP growth of Hong Kong from 2007 Q1 to 2011 Q1. Refer
to the figure for questions (j) to (n).
(j) In which quarter of which year was Hong Kong’s economy at its peak? What was
the corresponding growth rate?
13
Answer: “When a business cycle expansion ends and a recession begins, the turning
point is called a peak.”29
(Parkin 2000) Or “A peak is the beginning of a recession,
the high point of economic activity prior to a recovery.”30
(Frank and Bernanke 2009)
It was in 2008 Q1. It was 1.4%
(k) In which quarter of which year was Hong Kong’s real GDP growth at its lowest rate?
What was the corresponding growth rate?
Answer: It was in 2009 Q1. It was -3.4%.
(l) In which quarter of which year was Hong Kong in a trough? What was the
corresponding growth rate?
Answer: It was in 2009 Q1. It was -3.4%.
(m) Identify the period in which Hong Kong was in contraction. Was Hong Kong in a
recession within that period?
Answer: The contraction period started in 2008 Q2 and ended in 2009 Q1. Yes, as the
negative real GDP growth rates had continued for four quarters.
(n) Compare Fig. 1.3 to Fig. 1.1 and Fig. 1.2. Describe any correlated changes among
these three economies.
Answer: All economies worsened in 2008 as their real GDP growth rates fell sharply.
The real GDP growth rates rose again in 2010.
29
Parkin (2000), p. 476. 30
Frank and Bernanke (2009), p. 614.
14
2. Financial Markets of the U.S. and Hong Kong
After the crisis began, the U.S. stock market crashed heavily, as investors were
pessimistic about the U.S. economy.
There are several major international stock market indices. In the U.S., the
Dow Jones Index is the most important domestic index. Hong Kong has the Hang
Seng Index. What actually is a stock market index?
A stock market index is a method of measuring the value of a section of the
stock market and computed from the prices of selected stocks (sometimes a weighted
average). It is a tool used by investors and financial managers to describe the market,
and to compare the return on specific investments.31
Stock market indices are used as leading indicators.
Leading indicators are indicators that usually change before the economy as
a whole changes. They are therefore useful as short-term predictors of the economy.
Stock market returns are a leading indicator: the stock market usually begins to
decline before the economy as a whole declines and usually begins to improve before
the general economy begins to recover from a slump.32
31
Wikipedia (2012), http://en.wikipedia.org/wiki/Stock_market_index 32
Wikipedia (2012), http://en.wikipedia.org/wiki/Economic_indicator
15
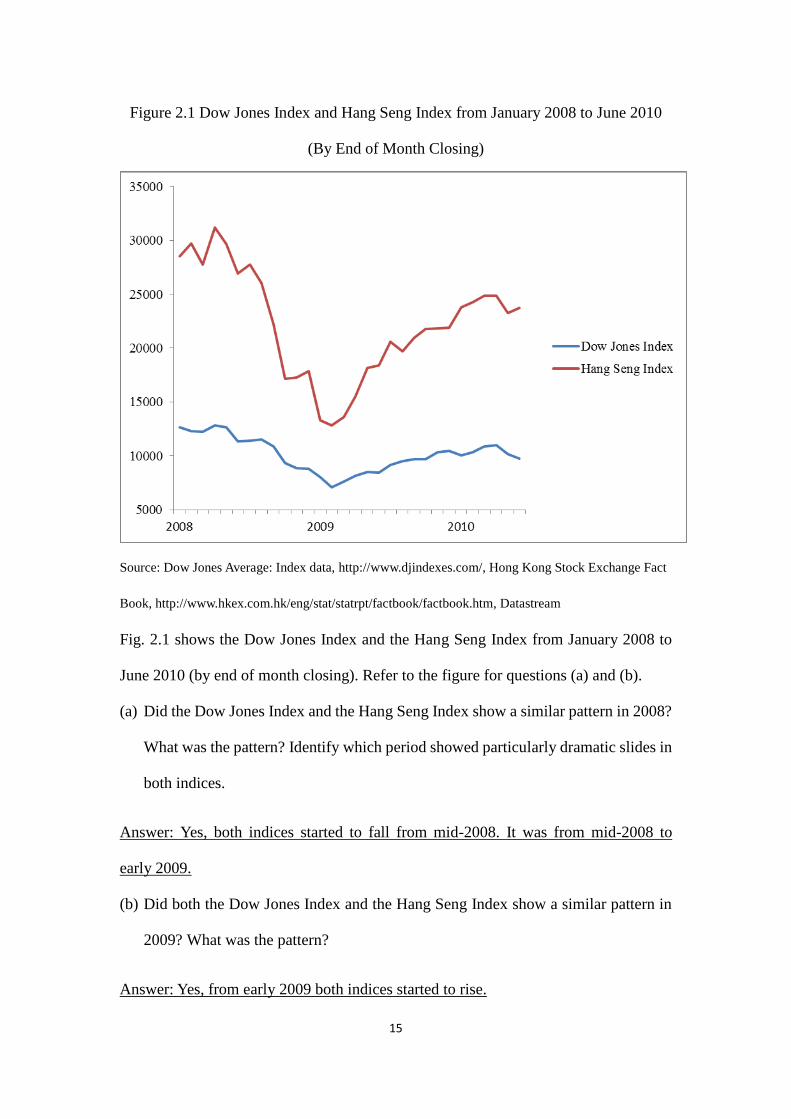
Figure 2.1 Dow Jones Index and Hang Seng Index from January 2008 to June 2010
(By End of Month Closing)
Source: Dow Jones Average: Index data, http://www.djindexes.com/, Hong Kong Stock Exchange Fact
Book, http://www.hkex.com.hk/eng/stat/statrpt/factbook/factbook.htm, Datastream
Fig. 2.1 shows the Dow Jones Index and the Hang Seng Index from January 2008 to
June 2010 (by end of month closing). Refer to the figure for questions (a) and (b).
(a) Did the Dow Jones Index and the Hang Seng Index show a similar pattern in 2008?
What was the pattern? Identify which period showed particularly dramatic slides in
both indices.
Answer: Yes, both indices started to fall from mid-2008. It was from mid-2008 to
early 2009.
(b) Did both the Dow Jones Index and the Hang Seng Index show a similar pattern in
2009? What was the pattern?
Answer: Yes, from early 2009 both indices started to rise.
16
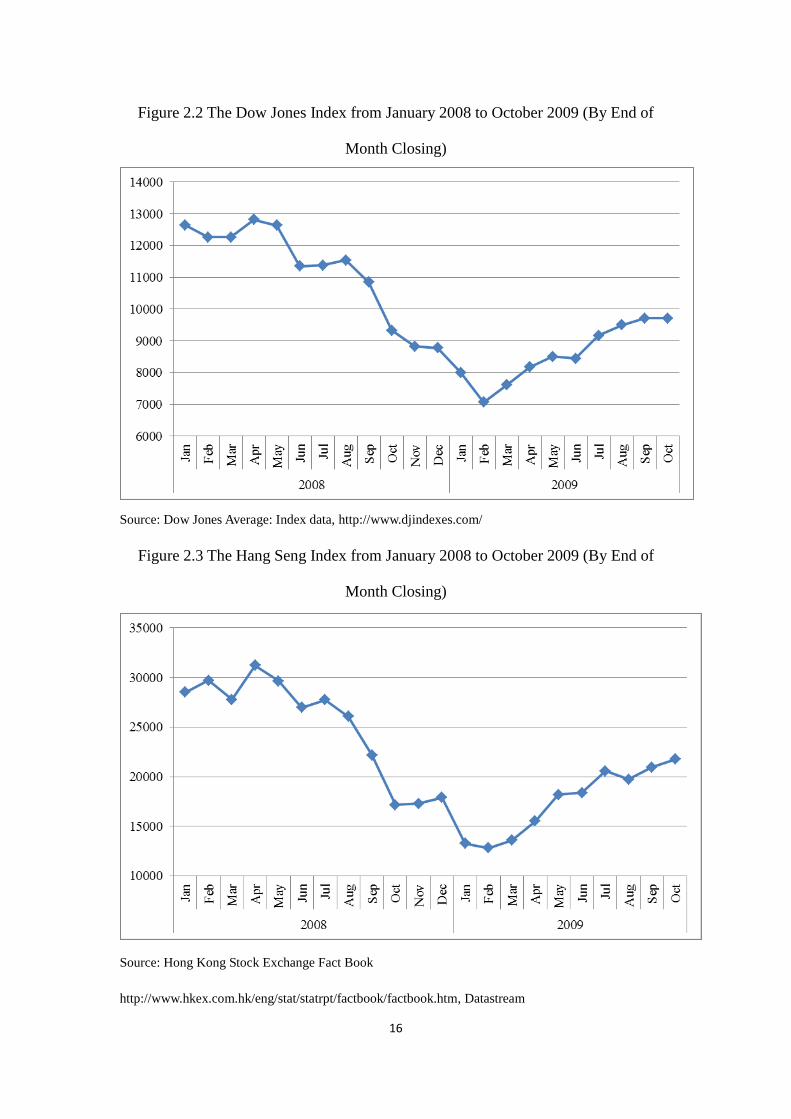
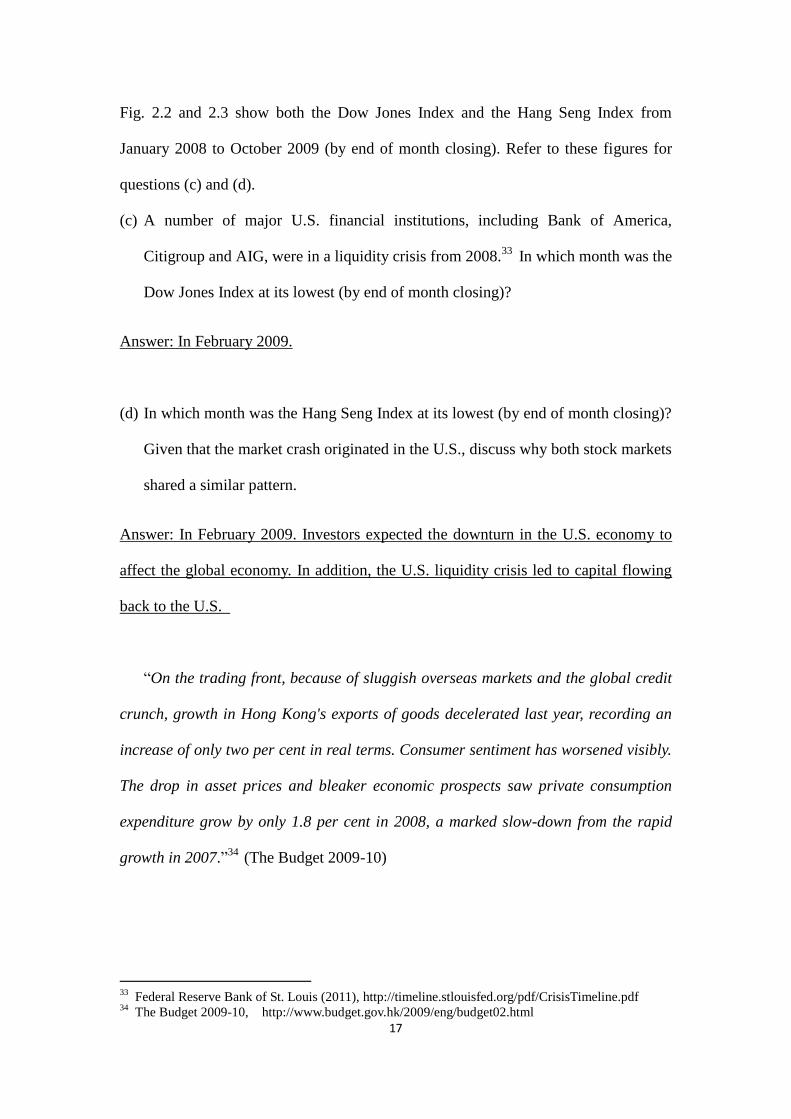
Figure 2.2 The Dow Jones Index from January 2008 to October 2009 (By End of
Month Closing)
Source: Dow Jones Average: Index data, http://www.djindexes.com/
Figure 2.3 The Hang Seng Index from January 2008 to October 2009 (By End of
Month Closing)
Source: Hong Kong Stock Exchange Fact Book
http://www.hkex.com.hk/eng/stat/statrpt/factbook/factbook.htm, Datastream
17
Fig. 2.2 and 2.3 show both the Dow Jones Index and the Hang Seng Index from
January 2008 to October 2009 (by end of month closing). Refer to these figures for
questions (c) and (d).
(c) A number of major U.S. financial institutions, including Bank of America,
Citigroup and AIG, were in a liquidity crisis from 2008.33
In which month was the
Dow Jones Index at its lowest (by end of month closing)?
Answer: In February 2009.
(d) In which month was the Hang Seng Index at its lowest (by end of month closing)?
Given that the market crash originated in the U.S., discuss why both stock markets
shared a similar pattern.
Answer: In February 2009. Investors expected the downturn in the U.S. economy to
affect the global economy. In addition, the U.S. liquidity crisis led to capital flowing
back to the U.S.
“On the trading front, because of sluggish overseas markets and the global credit
crunch, growth in Hong Kong's exports of goods decelerated last year, recording an
increase of only two per cent in real terms. Consumer sentiment has worsened visibly.
The drop in asset prices and bleaker economic prospects saw private consumption
expenditure grow by only 1.8 per cent in 2008, a marked slow-down from the rapid
growth in 2007.”34
(The Budget 2009-10)
33
Federal Reserve Bank of St. Louis (2011), http://timeline.stlouisfed.org/pdf/CrisisTimeline.pdf 34
The Budget 2009-10, http://www.budget.gov.hk/2009/eng/budget02.html
18
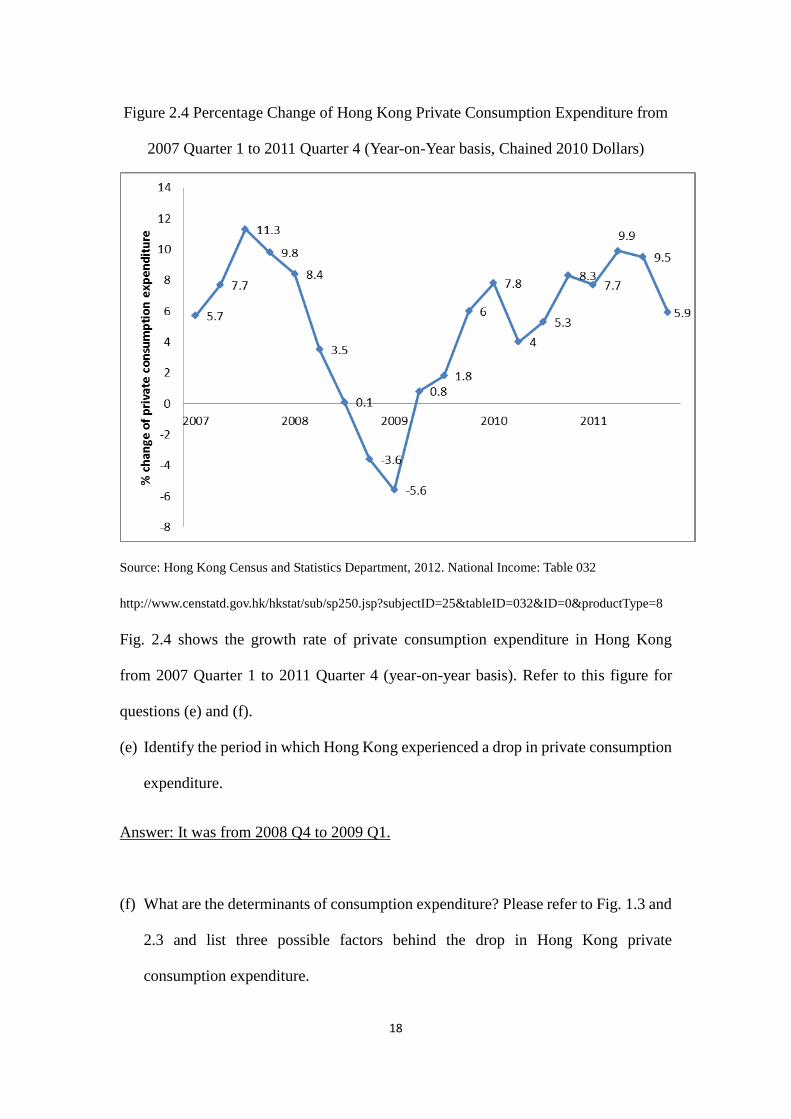
Figure 2.4 Percentage Change of Hong Kong Private Consumption Expenditure from
2007 Quarter 1 to 2011 Quarter 4 (Year-on-Year basis, Chained 2010 Dollars)
Source: Hong Kong Census and Statistics Department, 2012. National Income: Table 032
http://www.censtatd.gov.hk/hkstat/sub/sp250.jsp?subjectID=25&tableID=032&ID=0&productType=8
Fig. 2.4 shows the growth rate of private consumption expenditure in Hong Kong
from 2007 Quarter 1 to 2011 Quarter 4 (year-on-year basis). Refer to this figure for
questions (e) and (f).
(e) Identify the period in which Hong Kong experienced a drop in private consumption
expenditure.
Answer: It was from 2008 Q4 to 2009 Q1.
(f) What are the determinants of consumption expenditure? Please refer to Fig. 1.3 and
2.3 and list three possible factors behind the drop in Hong Kong private
consumption expenditure.
19
Answer: Disposable income (income after tax), the tax rate, and wealth (financial
assets or other fixed assets) are all possible determinants of consumption expenditure.
35 (Blanchard 2009)
Fig. 1.3: The recession may lead to a drop in income.
Fig. 2.3: The stock market crash produced a negative wealth effect and a pessimistic
outlook in Hong Kong.
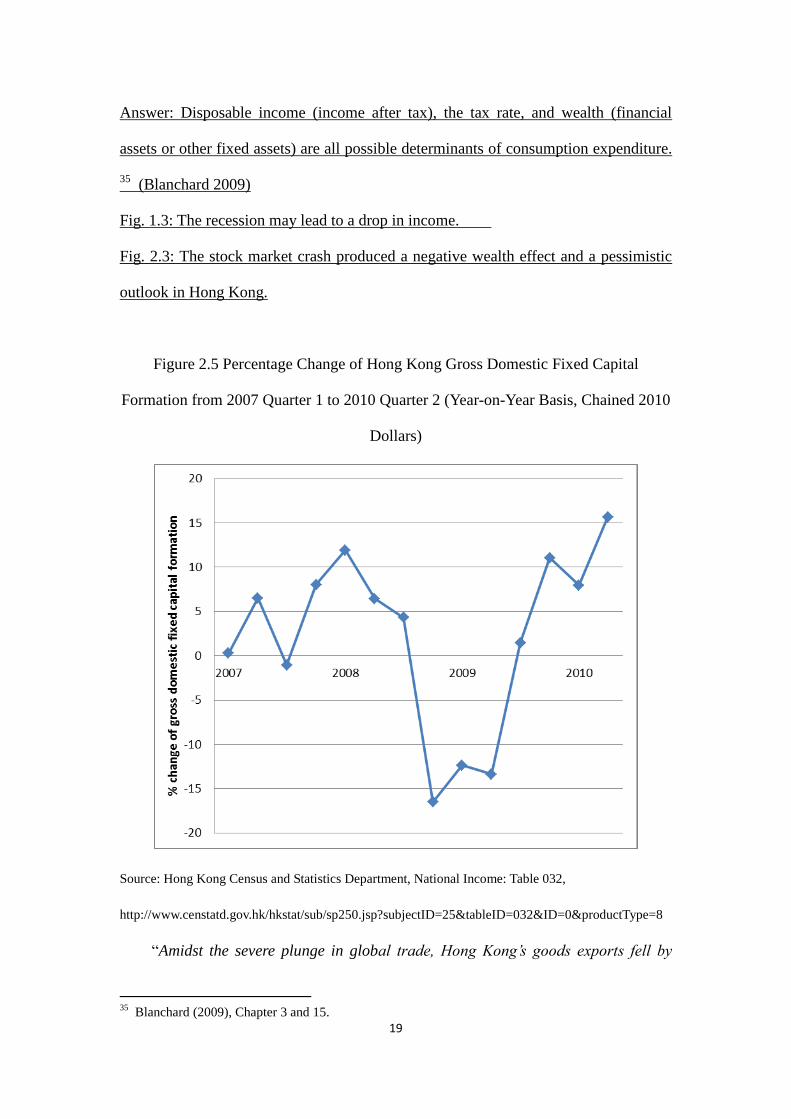
Figure 2.5 Percentage Change of Hong Kong Gross Domestic Fixed Capital
Formation from 2007 Quarter 1 to 2010 Quarter 2 (Year-on-Year Basis, Chained 2010
Dollars)
Source: Hong Kong Census and Statistics Department, National Income: Table 032,
http://www.censtatd.gov.hk/hkstat/sub/sp250.jsp?subjectID=25&tableID=032&ID=0&productType=8
“Amidst the severe plunge in global trade, Hong Kong’s goods exports fell by
35
Blanchard (2009), Chapter 3 and 15.
20
12.6 per cent in real terms in 2009, the biggest annual drop on record. For investment,
gross domestic fixed capital formation dipped by 2.2 per cent for the whole year.”36
(The Budget 2010-11)
Gross domestic fixed capital formation is one of the components used in the
expenditure approach when we calculate the GDP of Hong Kong. This item includes
construction output, real estate developers’ margin, costs of ownership transfer,
machinery and equipment, computer software and changes in inventories.37
Fig. 2.5 shows the growth rate of fixed capital formation in Hong Kong from 2007
quarter 1 to 2010 quarter 2 (year-on-year basis). Refer to this Figure for questions (g)
and (h).
(g) Identify the period in which Hong Kong experienced a contraction in its fixed
capital formation.
Answer: It was in 2007 Q3 and from 2008 Q4 to 2009 Q2.
(h) What are the determinants of investment? Please refer to Fig. 2.3 and give one
possible factor behind the contraction in Hong Kong gross domestic fixed capital
formation.
Answer: Income, interest rate, real interest rate/expected inflation rate, expected
profits, depreciation of assets and the current level of profits are possible determinants
of investment. 38
(Blanchard 2009)
Fig. 2.3: Pessimism in the market would deter the public from making investments.
36
The Budget 2010-11, http://www.budget.gov.hk/2010/eng/budget02.html 37
Census and Statistics Department (2011), p.113-114. 38
Blanchard (2009), Chapter 3 and 16.
21
We have illustrated how the financial crisis sent a shock to the stock markets and the
real economy. Now we can draw inferences using the AS-AD framework.
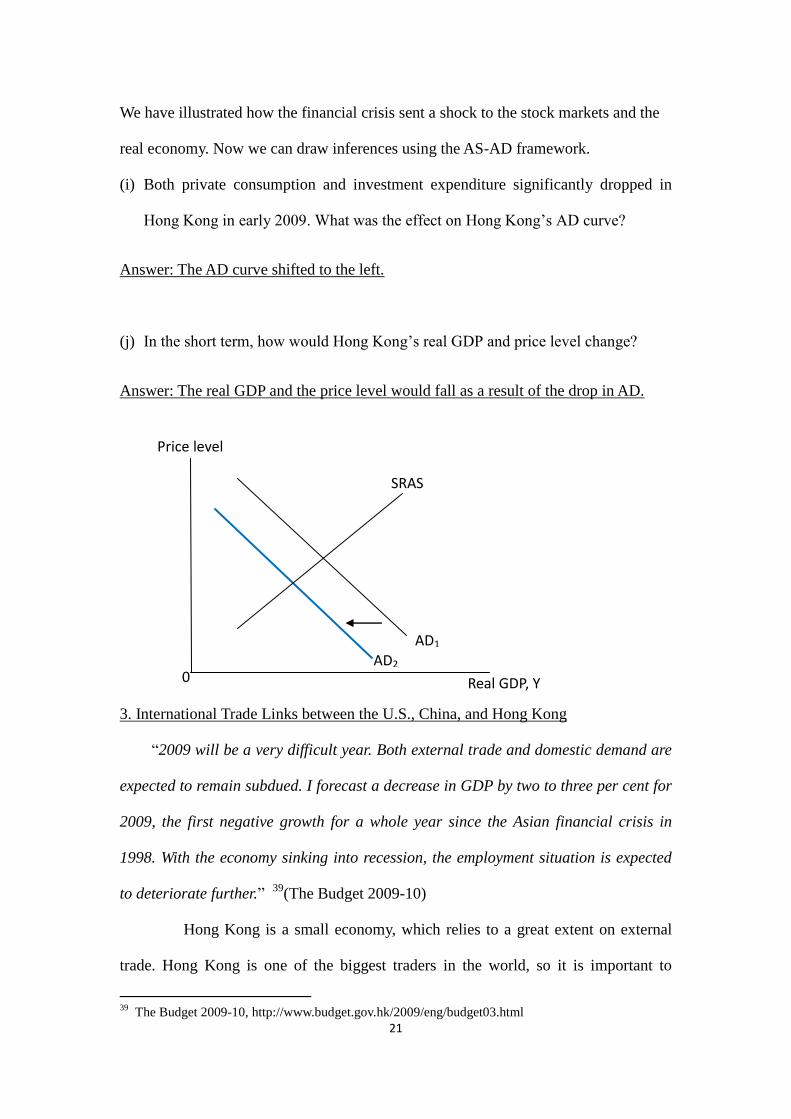
(i) Both private consumption and investment expenditure significantly dropped in
Hong Kong in early 2009. What was the effect on Hong Kong’s AD curve?
Answer: The AD curve shifted to the left.
(j) In the short term, how would Hong Kong’s real GDP and price level change?
Answer: The real GDP and the price level would fall as a result of the drop in AD.
3. International Trade Links between the U.S., China, and Hong Kong
“2009 will be a very difficult year. Both external trade and domestic demand are
expected to remain subdued. I forecast a decrease in GDP by two to three per cent for
2009, the first negative growth for a whole year since the Asian financial crisis in
1998. With the economy sinking into recession, the employment situation is expected
to deteriorate further.” 39
(The Budget 2009-10)
Hong Kong is a small economy, which relies to a great extent on external
trade. Hong Kong is one of the biggest traders in the world, so it is important to
39
The Budget 2009-10, http://www.budget.gov.hk/2009/eng/budget03.html
AD1 AD2
SRAS
Price level
Real GDP, Y 0
22
explore how trade affects our city.
Trading activities include imports, exports and re-exports. What are re-exports?
Re-exports of goods refer to products which have previously been imported into
Hong Kong and which are re-exported without having undergone in Hong Kong a
manufacturing process which has changed permanently the shape, nature, form or
utility of the product.40
The Hong Kong Trade Development Council has stated that Hong Kong is a
major trading partner of China:
“Hong Kong has been handling a significant portion of the Chinese
mainland’s expanding external trade. In 2011, about 14% of the Chinese mainland’s
exports (US$258 billion) and 13% of imports (US$220 billion) were handled via
Hong Kong and 61.6% of Hong Kong’s total re-exports were originated from the
Chinese mainland.”41
(Hong Kong Trade Development Council 2012)
(a) Give two reasons why Hong Kong maintains its position as an important
international trade center for China.
Answer: High-quality services provided by the airport and container port in Hong
Kong; it is a free port, and has a free trade policy: “The free trade policy means Hong
Kong maintains no barriers on trade. Thus, Hong Kong does not charge tariff on
importation or exportation of goods. Import and export licensing is also kept to a
minimum.”42
(Trade and Industry Department, 2012)
40
Hong Kong Census and Statistics Department (2012),
http://www.censtatd.gov.hk/hkstat/sub/sc40.jsp 41
Hong Kong Trade Development Centre (2012),
http://hong-kong-economy-research.hktdc.com/business-news/article/Hong-Kong-Industry-Profiles/Im
port-and-Export-Trade-Industry-in-Hong-Kong/hkip/en/1/1X000000/1X006NJK.htm 42
Trade and Industry Department (2012) ,
23
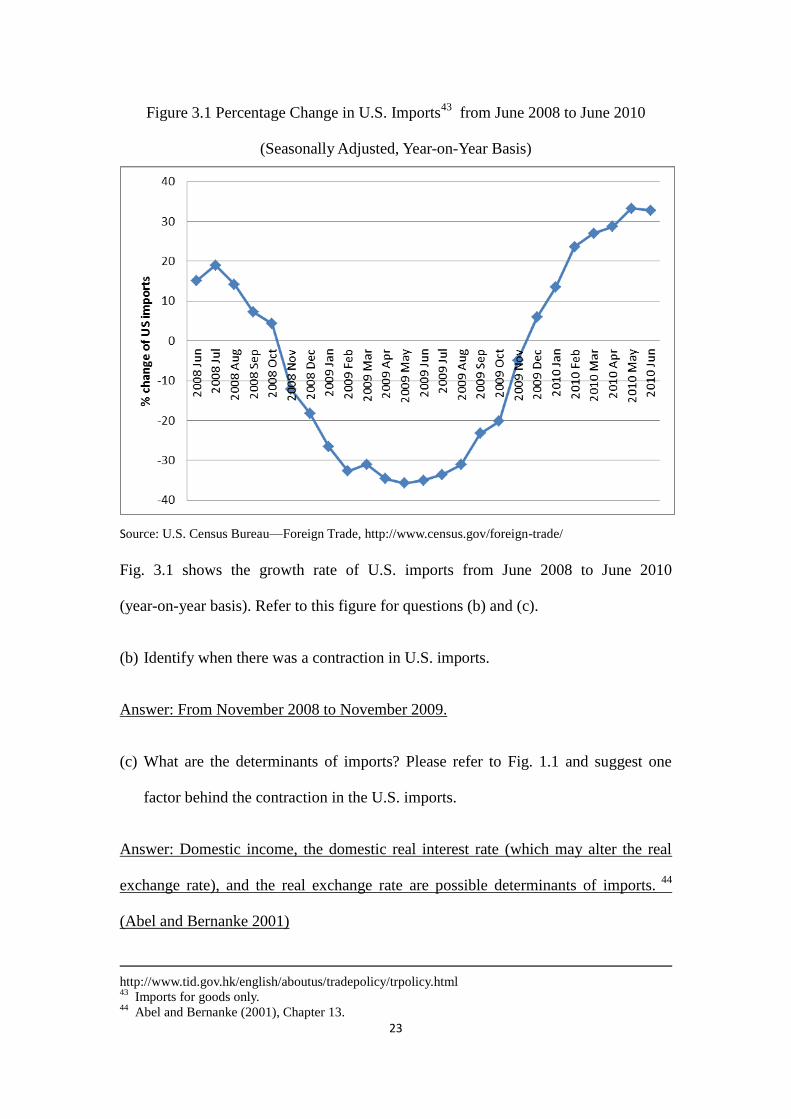
Figure 3.1 Percentage Change in U.S. Imports43
from June 2008 to June 2010
(Seasonally Adjusted, Year-on-Year Basis)
Source: U.S. Census Bureau—Foreign Trade, http://www.census.gov/foreign-trade/
Fig. 3.1 shows the growth rate of U.S. imports from June 2008 to June 2010
(year-on-year basis). Refer to this figure for questions (b) and (c).
(b) Identify when there was a contraction in U.S. imports.
Answer: From November 2008 to November 2009.
(c) What are the determinants of imports? Please refer to Fig. 1.1 and suggest one
factor behind the contraction in the U.S. imports.
Answer: Domestic income, the domestic real interest rate (which may alter the real
exchange rate), and the real exchange rate are possible determinants of imports. 44
(Abel and Bernanke 2001)
http://www.tid.gov.hk/english/aboutus/tradepolicy/trpolicy.html 43
Imports for goods only. 44
Abel and Bernanke (2001), Chapter 13.
24
Fig. 1.1: The U.S. was in a recession so Americans had cut their consumption. There
was less demand for all imports.
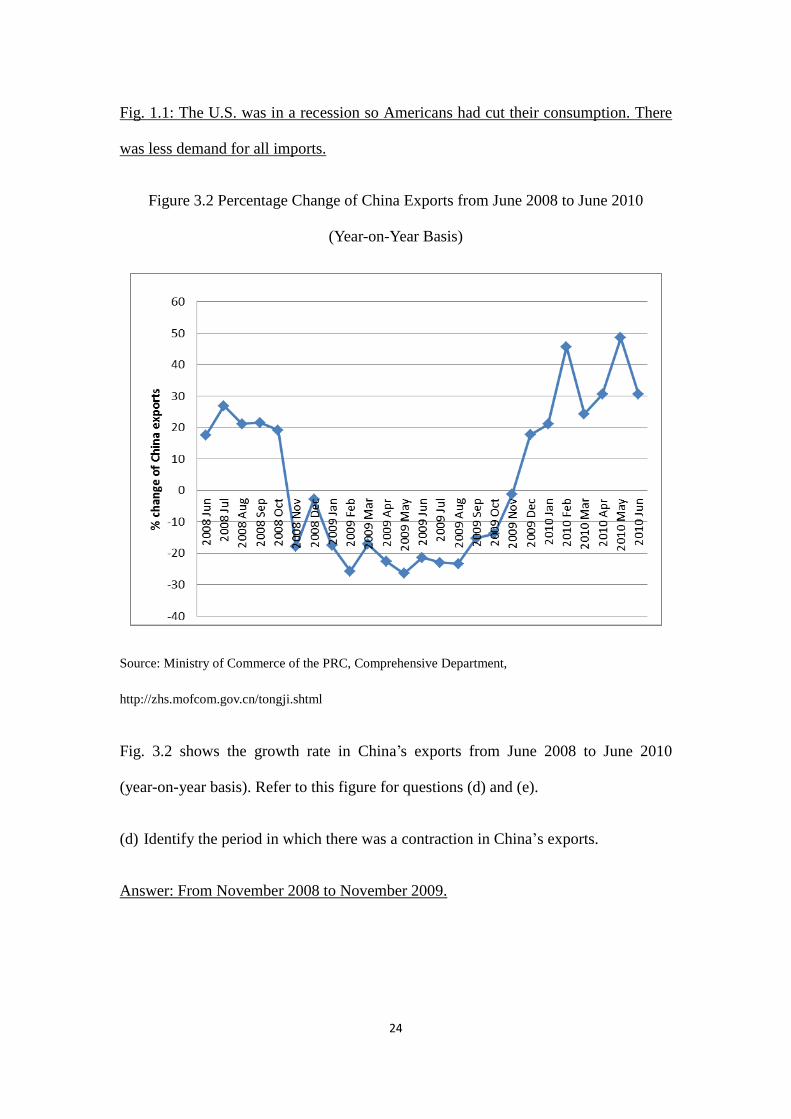
Figure 3.2 Percentage Change of China Exports from June 2008 to June 2010
(Year-on-Year Basis)
Source: Ministry of Commerce of the PRC, Comprehensive Department,
http://zhs.mofcom.gov.cn/tongji.shtml
Fig. 3.2 shows the growth rate in China’s exports from June 2008 to June 2010
(year-on-year basis). Refer to this figure for questions (d) and (e).
(d) Identify the period in which there was a contraction in China’s exports.
Answer: From November 2008 to November 2009.
25
(e) What are the determinants of exports? Please refer to Fig. 1.1 and the answer you
gave to (c). Given that China is one of the main trading partners of the U.S., give
one factor behind the contraction in China’s exports.
Answer: Foreign countries’ income, the real interest rate, and the real exchange rate
are possible determinants of exports. 45
(Abel and Bernanke 2001)
Fig. 1.1: U.S. GDP fell. This means that Americans spent less on all imports
(including Chinese ones) so China exported less.
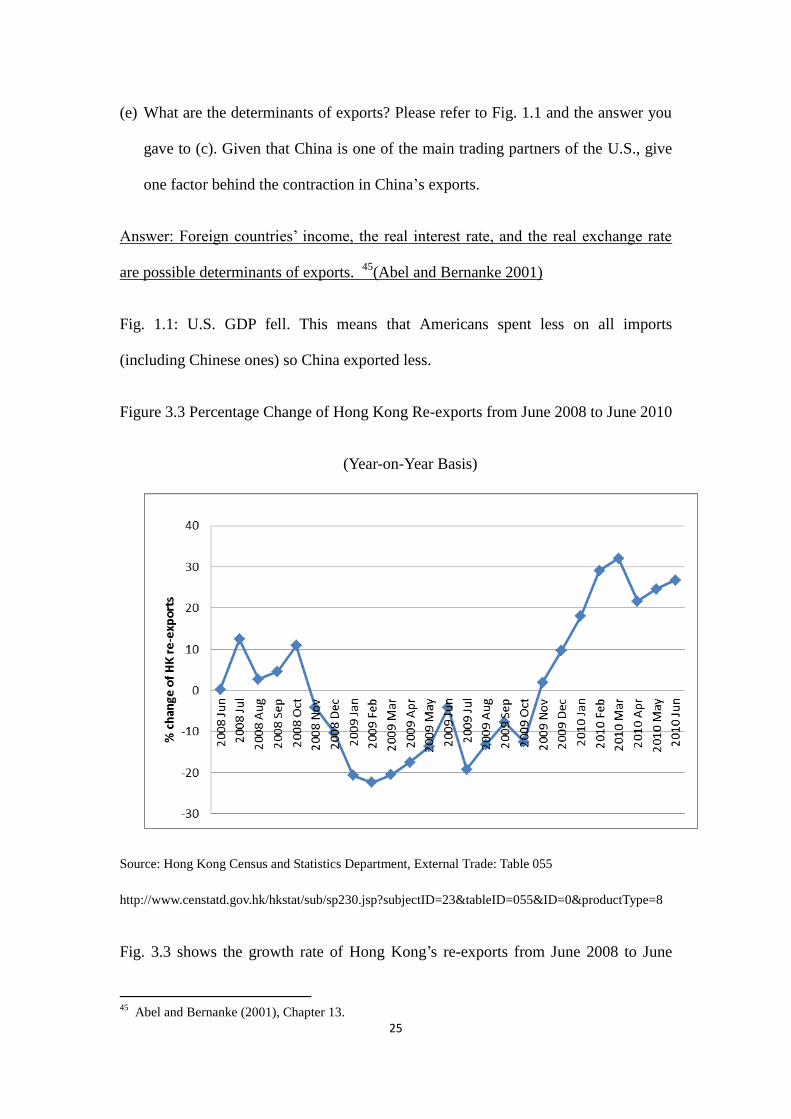
Figure 3.3 Percentage Change of Hong Kong Re-exports from June 2008 to June 2010
(Year-on-Year Basis)
Source: Hong Kong Census and Statistics Department, External Trade: Table 055
http://www.censtatd.gov.hk/hkstat/sub/sp230.jsp?subjectID=23&tableID=055&ID=0&productType=8
Fig. 3.3 shows the growth rate of Hong Kong’s re-exports from June 2008 to June
45
Abel and Bernanke (2001), Chapter 13.
26
2010 (year-on-year basis). Refer to this figure for questions (f) and (g).
(f) Identify the period in which there was a contraction in Hong Kong’s re-exports.
Answer: From November 2008 to October 2009.
(g) Refer to Fig. 1.1 and your answers in (b), (d) and (f). Do you observe a similar
pattern? Suggest why Hong Kong’s re-exports may have been affected by the U.S.
economic downturn.
Answer: Yes. U.S. imports, China’s exports and Hong Kong’s re-exports fell between
late 2008 to late 2009 as the U.S. economy deteriorated. Americans spent less on
imports so China exported less. As most of Hong Kong’s re-exports came from China,
trading activities in Hong Kong were significantly affected.
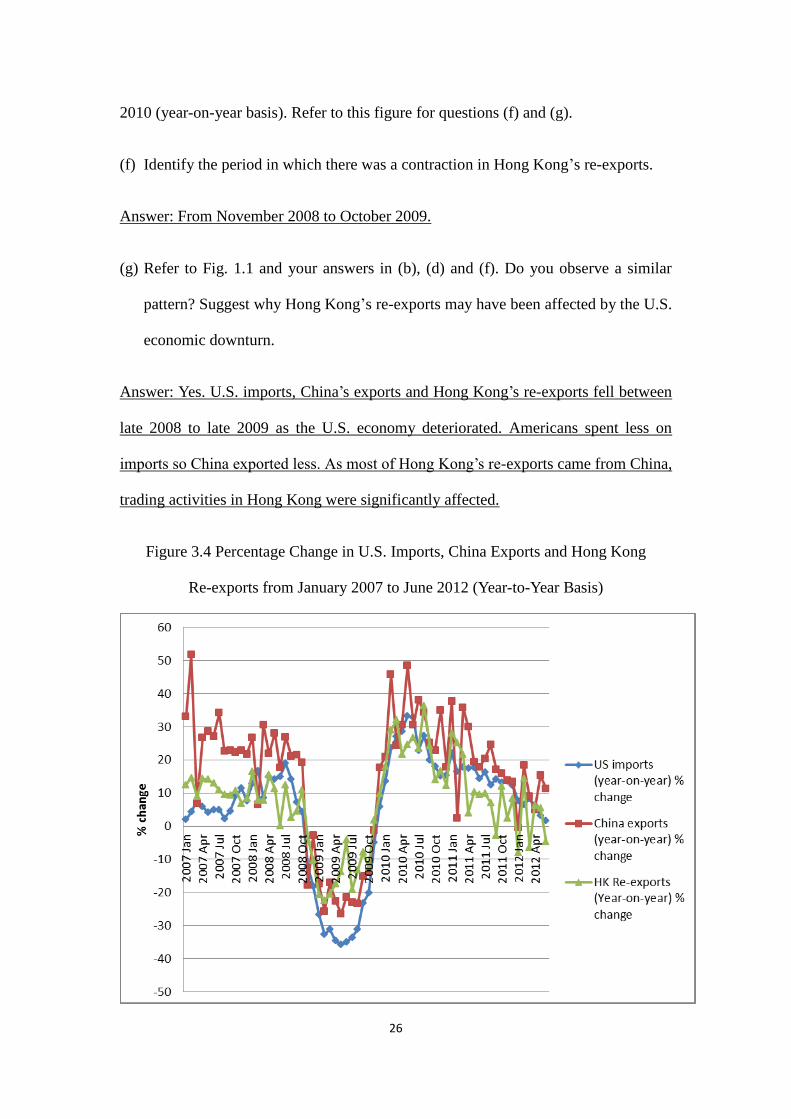
Figure 3.4 Percentage Change in U.S. Imports, China Exports and Hong Kong
Re-exports from January 2007 to June 2012 (Year-to-Year Basis)
27
Source: U.S. Census Bureau—Foreign Trade, http://www.census.gov/foreign-trade/, Ministry of
Commerce of the PRC, Comprehensive Department, http://zhs.mofcom.gov.cn/tongji.shtml, Hong
Kong Census and Statistics Department, External Trade: Table 055,
http://www.censtatd.gov.hk/hkstat/sub/sp230.jsp?subjectID=23&tableID=055&ID=0&productType=8
Fig. 3.4 shows the percentage change in U.S. imports, China’s exports, and Hong
Kong’s re-exports from January 2007 to June 2012. Refer to this figure for question
(h).
(h) Did the growth rates of U.S. imports, China’s exports, and Hong Kong’s re-exports
show a similar pattern from December 2009 to March 2010? What was the pattern?
Refer to Fig. 1.1 and suggest one reason behind the pattern.
Answer: Yes, they were growing at that time. As the U.S. economy was improving,
the U.S. could import more goods from China. Hong Kong could thus help China to
transfer goods to the U.S. at that time.
“I am cautiously optimistic about Hong Kong's economic prospects for 2010.
The global economy has not yet regained its vigour. There remain a number of
uncertainties and potential pitfalls in the external environment. While the European
and the US economies have returned to positive growth, their labour markets have yet
to improve and their financial systems are still impaired. These economies may have
undergone fundamental changes in their economic structures, and that will affect our
future export performance.” 46
(The Budget 2010-11)
“Being the largest of all the pillar industries, trading and logistics accounted
46
The Budget 2010-11, http://www.budget.gov.hk/2010/eng/budget03.html
28
for 24.1 per cent of our GDP and employed nearly 790 000 people in 2009. With Asia
becoming the engine powering the global economy after the financial tsunami and the
Mainland accelerating economic growth and expanding domestic demand, new
development frontiers have been opened for the trading and logistics industry.”
47(The Budget 2011-12)
“Further reinforcing Hong Kong’s position as an international and regional
transport hub is vital to our economic development. With the improvement in the
external economic environment, the throughput of both sea and air cargoes registered
significant growth last year. In 2010, the passenger volume and cargo tonnage of the
Hong Kong International Airport reached an all-time high of over 50 million and
4 million respectively. We will continue to invest in transport infrastructure projects
and optimise our highly efficient multimodal transport services, with a view to
promoting the development of air, sea and land transport and logistics.”48
(The
Budget 2011-12)
There are other auxiliary services related to Hong Kong’s external trade, such as
logistics and trading services, provided by certain import and export trading firms.
These have different roles in Hong Kong economy.
What is logistics?
Logistics refers to the process of planning, implementing and controlling the
movement and storage of goods (including raw materials, goods in progress and
finished goods), services and related information from the point of origin to the point
47
The Budget 2011-12, http://www.budget.gov.hk/2011/eng/budget32.html 48
Ibid.
29
of consumption. The activities include freight transport, freight forwarding, storage,
postal and courier services.49
What are trading firms? How are they contributing to our economy?
“Hong Kong’s import and export trading firms are active in sourcing various
types of goods, including raw materials, machinery and parts, and a wide range of
consumer goods. There are three main types of sourcing activities: (1) sourcing goods
produced in Hong Kong; (2) sourcing goods from around the region for re-exports;
and (3) sourcing goods from one country to be shipped directly to a third country
without touching Hong Kong ground.”50
(Hong Kong Trade Development Council
2012)
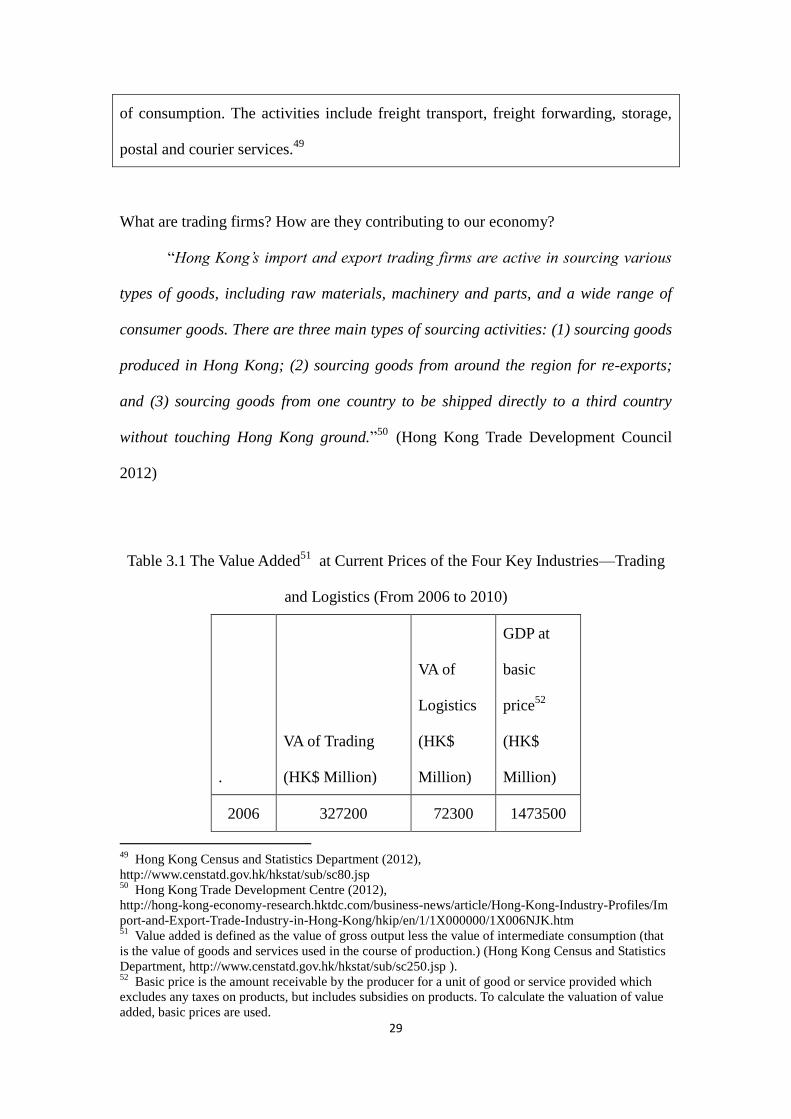
Table 3.1 The Value Added51
at Current Prices of the Four Key Industries—Trading
and Logistics (From 2006 to 2010)
.
VA of Trading
(HK$ Million)
VA of
Logistics
(HK$
Million)
GDP at
basic
price52
(HK$
Million)
2006 327200 72300 1473500
49
Hong Kong Census and Statistics Department (2012),
http://www.censtatd.gov.hk/hkstat/sub/sc80.jsp 50
Hong Kong Trade Development Centre (2012),
http://hong-kong-economy-research.hktdc.com/business-news/article/Hong-Kong-Industry-Profiles/Im
port-and-Export-Trade-Industry-in-Hong-Kong/hkip/en/1/1X000000/1X006NJK.htm 51
Value added is defined as the value of gross output less the value of intermediate consumption (that
is the value of goods and services used in the course of production.) (Hong Kong Census and Statistics
Department, http://www.censtatd.gov.hk/hkstat/sub/sc250.jsp ). 52
Basic price is the amount receivable by the producer for a unit of good or service provided which
excludes any taxes on products, but includes subsidies on products. To calculate the valuation of value
added, basic prices are used.
30
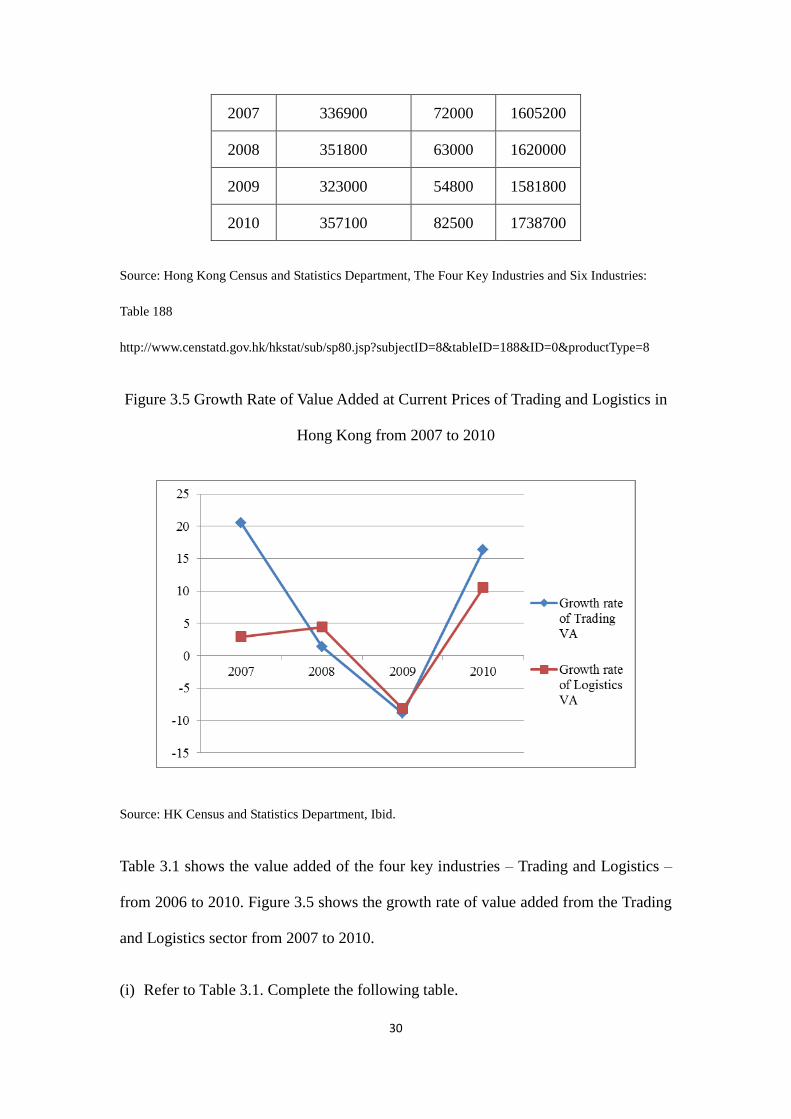
2007 336900 72000 1605200
2008 351800 63000 1620000
2009 323000 54800 1581800
2010 357100 82500 1738700
Source: Hong Kong Census and Statistics Department, The Four Key Industries and Six Industries:
Table 188
http://www.censtatd.gov.hk/hkstat/sub/sp80.jsp?subjectID=8&tableID=188&ID=0&productType=8
Figure 3.5 Growth Rate of Value Added at Current Prices of Trading and Logistics in
Hong Kong from 2007 to 2010
Source: HK Census and Statistics Department, Ibid.
Table 3.1 shows the value added of the four key industries – Trading and Logistics –
from 2006 to 2010. Figure 3.5 shows the growth rate of value added from the Trading
and Logistics sector from 2007 to 2010.
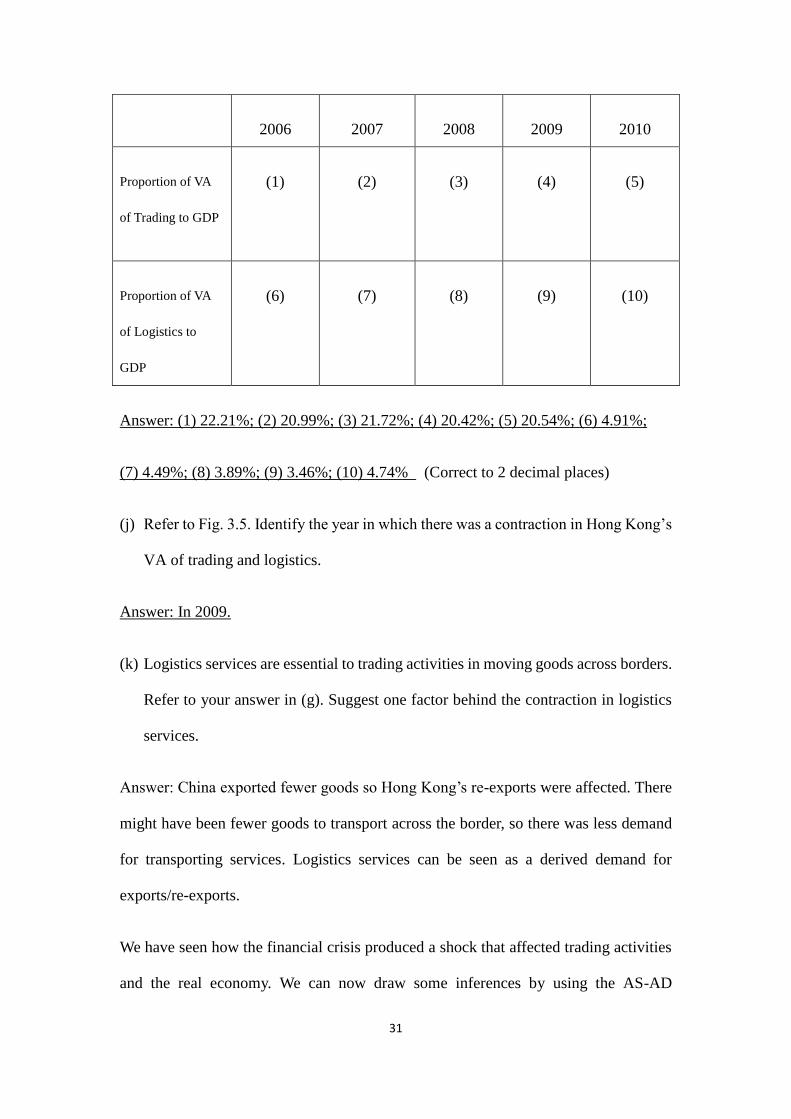
(i) Refer to Table 3.1. Complete the following table.
31
2006 2007 2008 2009 2010
Proportion of VA
of Trading to GDP
(1) (2) (3) (4) (5)
Proportion of VA
of Logistics to
GDP
(6) (7) (8) (9) (10)
Answer: (1) 22.21%; (2) 20.99%; (3) 21.72%; (4) 20.42%; (5) 20.54%; (6) 4.91%;
(7) 4.49%; (8) 3.89%; (9) 3.46%; (10) 4.74% (Correct to 2 decimal places)
(j) Refer to Fig. 3.5. Identify the year in which there was a contraction in Hong Kong’s
VA of trading and logistics.
Answer: In 2009.
(k) Logistics services are essential to trading activities in moving goods across borders.
Refer to your answer in (g). Suggest one factor behind the contraction in logistics
services.
Answer: China exported fewer goods so Hong Kong’s re-exports were affected. There
might have been fewer goods to transport across the border, so there was less demand
for transporting services. Logistics services can be seen as a derived demand for
exports/re-exports.
We have seen how the financial crisis produced a shock that affected trading activities
and the real economy. We can now draw some inferences by using the AS-AD
32
framework.
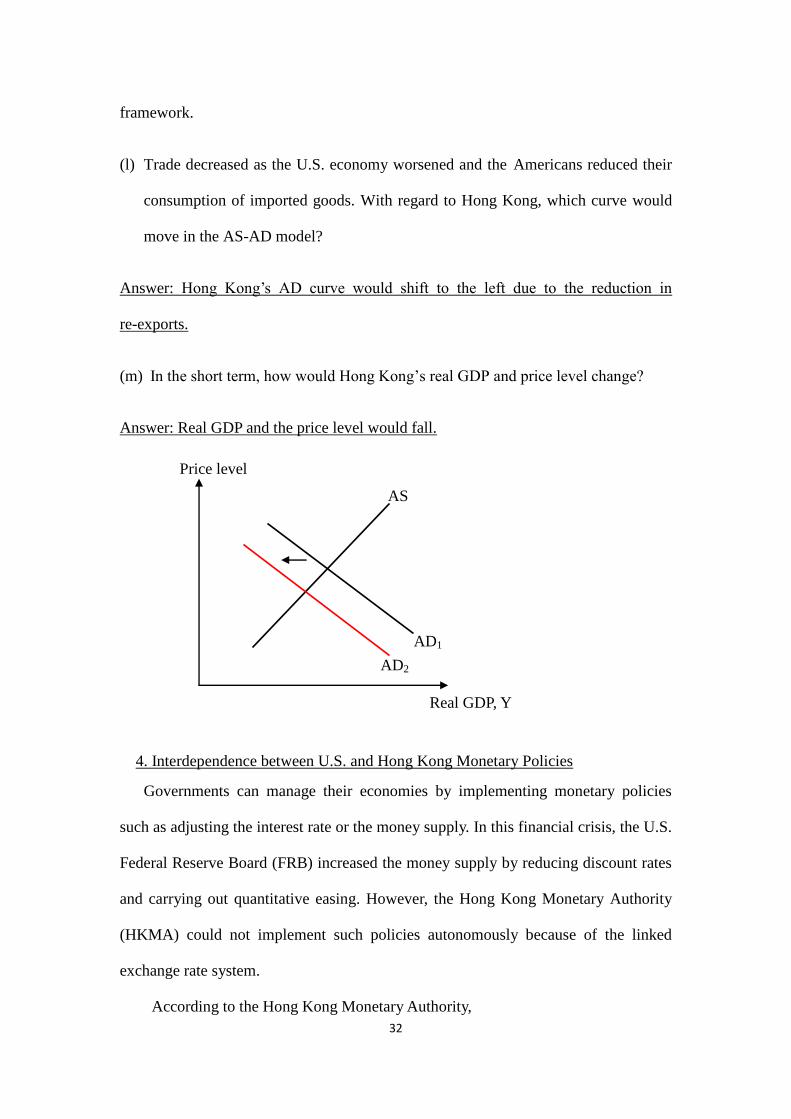
(l) Trade decreased as the U.S. economy worsened and the Americans reduced their
consumption of imported goods. With regard to Hong Kong, which curve would
move in the AS-AD model?
Answer: Hong Kong’s AD curve would shift to the left due to the reduction in
re-exports.
(m) In the short term, how would Hong Kong’s real GDP and price level change?
Answer: Real GDP and the price level would fall.
4. Interdependence between U.S. and Hong Kong Monetary Policies
Governments can manage their economies by implementing monetary policies
such as adjusting the interest rate or the money supply. In this financial crisis, the U.S.
Federal Reserve Board (FRB) increased the money supply by reducing discount rates
and carrying out quantitative easing. However, the Hong Kong Monetary Authority
(HKMA) could not implement such policies autonomously because of the linked
exchange rate system.
According to the Hong Kong Monetary Authority,
AD2
AD1
Price level
Real GDP, Y
AS
33
[A] linked exchange rate system is a currency board system, which requires both
the stock and flow of the monetary base to be fully backed by foreign reserves. This
means that any change in the monetary base is fully matched by a corresponding
change in foreign reserves at a fixed exchange rate. … Under the currency board
system, it is interest rates rather than the exchange rate which adjust to inflows or
outflows of funds.
…The expansion of or contraction in the monetary base [i.e. US dollar
in HK] causes interest rates for the domestic currency to fall or rise respectively,
creating the monetary conditions that automatically counteract the original capital
movement, while the exchange rate remains stable.53
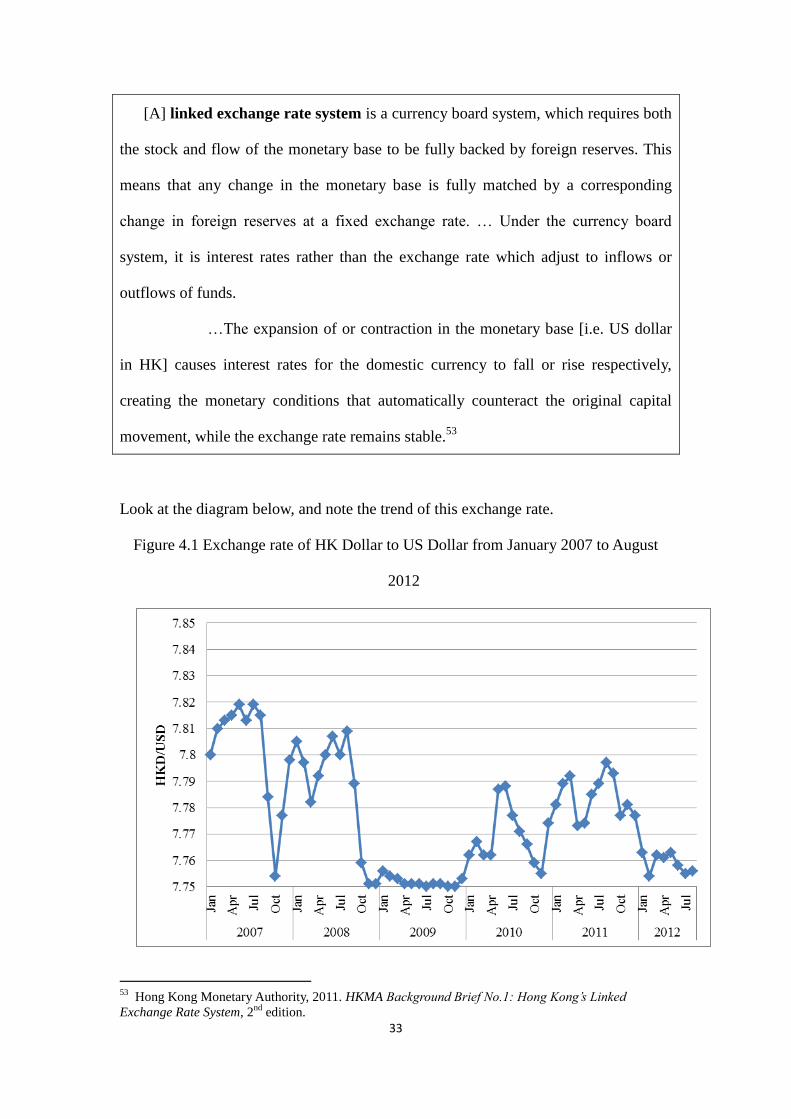
Look at the diagram below, and note the trend of this exchange rate.
Figure 4.1 Exchange rate of HK Dollar to US Dollar from January 2007 to August
2012
53
Hong Kong Monetary Authority, 2011. HKMA Background Brief No.1: Hong Kong’s Linked
Exchange Rate System, 2nd
edition.
34
Source: Hong Kong Census and Statistics Department, Public Accounts, Money and Finance.
http://www.censtatd.gov.hk/hkstat/sub/sp110.jsp?subjectID=56&tableID=124&ID=0&productType=8
Fig. 4.1 shows the exchange rate of HKD-USD from January 2007 to August 2012.
Refer to this figure for questions (a) and (b).
(a) Did the HKD-USD exchange rate move beyond the range of 7.75 to 7.85?
Answer: No.
(b) “…The overriding objective of Hong Kong’s monetary policy is currency
stability. This is defined as a stable external exchange value of Hong Kong’s
currency, in terms of its exchange rate in the foreign exchange market against the
U.S. dollar, within a band of HK$7.75 – 7.85 to US$1.”
Quoted from the website of Hong Kong Monetary Authority—Monetary Stability Chapter of Annual Report
http://www.hkma.gov.hk/media/eng/publication-and-research/annual-report/2011/09_Monetary_Stability.pdf
From this mandate, do you think that HKMA did a proper job from January 2007
to August 2012?
Answer: Yes.
“As Hong Kong is an externally-oriented economy with a linked exchange rate
system, we cannot use interest rate as a tool to contain inflation and are therefore
relatively passive in this respect.”54
(The Budget 2011-12)
Apart from fully backed foreign reserves, the linked exchange rate has a
particular feature that should be noticed. Interest rates are used to adjust the
movements of capital back and forth from Hong Kong. When there is an interest rate
differential, investors may put their money where the interest rate is higher. Note the
dates of the announcements from the Federal Reserve Board (FRB) and the HKMA
when they reduced the interest rates.
54
The Budget 2011-12, http://www.budget.gov.hk/2011/eng/budget16.html
35
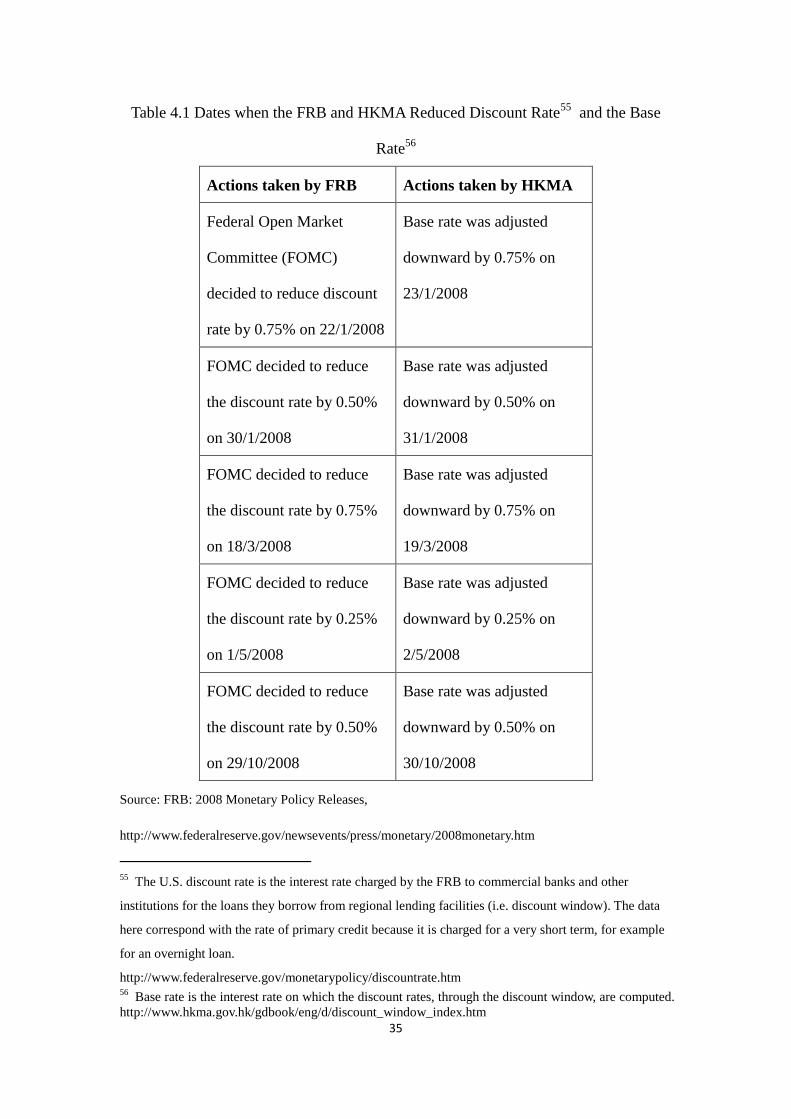
Table 4.1 Dates when the FRB and HKMA Reduced Discount Rate55
and the Base
Rate56
Actions taken by FRB Actions taken by HKMA
Federal Open Market
Committee (FOMC)
decided to reduce discount
rate by 0.75% on 22/1/2008
Base rate was adjusted
downward by 0.75% on
23/1/2008
FOMC decided to reduce
the discount rate by 0.50%
on 30/1/2008
Base rate was adjusted
downward by 0.50% on
31/1/2008
FOMC decided to reduce
the discount rate by 0.75%
on 18/3/2008
Base rate was adjusted
downward by 0.75% on
19/3/2008
FOMC decided to reduce
the discount rate by 0.25%
on 1/5/2008
Base rate was adjusted
downward by 0.25% on
2/5/2008
FOMC decided to reduce
the discount rate by 0.50%
on 29/10/2008
Base rate was adjusted
downward by 0.50% on
30/10/2008
Source: FRB: 2008 Monetary Policy Releases,
http://www.federalreserve.gov/newsevents/press/monetary/2008monetary.htm
55
The U.S. discount rate is the interest rate charged by the FRB to commercial banks and other
institutions for the loans they borrow from regional lending facilities (i.e. discount window). The data
here correspond with the rate of primary credit because it is charged for a very short term, for example
for an overnight loan.
http://www.federalreserve.gov/monetarypolicy/discountrate.htm 56
Base rate is the interest rate on which the discount rates, through the discount window, are computed.
http://www.hkma.gov.hk/gdbook/eng/d/discount_window_index.htm
36
HKMA Press Releases By Year 2008,
http://www.hkma.gov.hk/eng/key-information/press-releases/2008/, HKMA Monthly Statistical
Bulletin Table 7.3.3 Daily figures,
http://www.hkma.gov.hk/eng/market-data-and-statistics/monthly-statistical-bulletin/table.shtml#section7
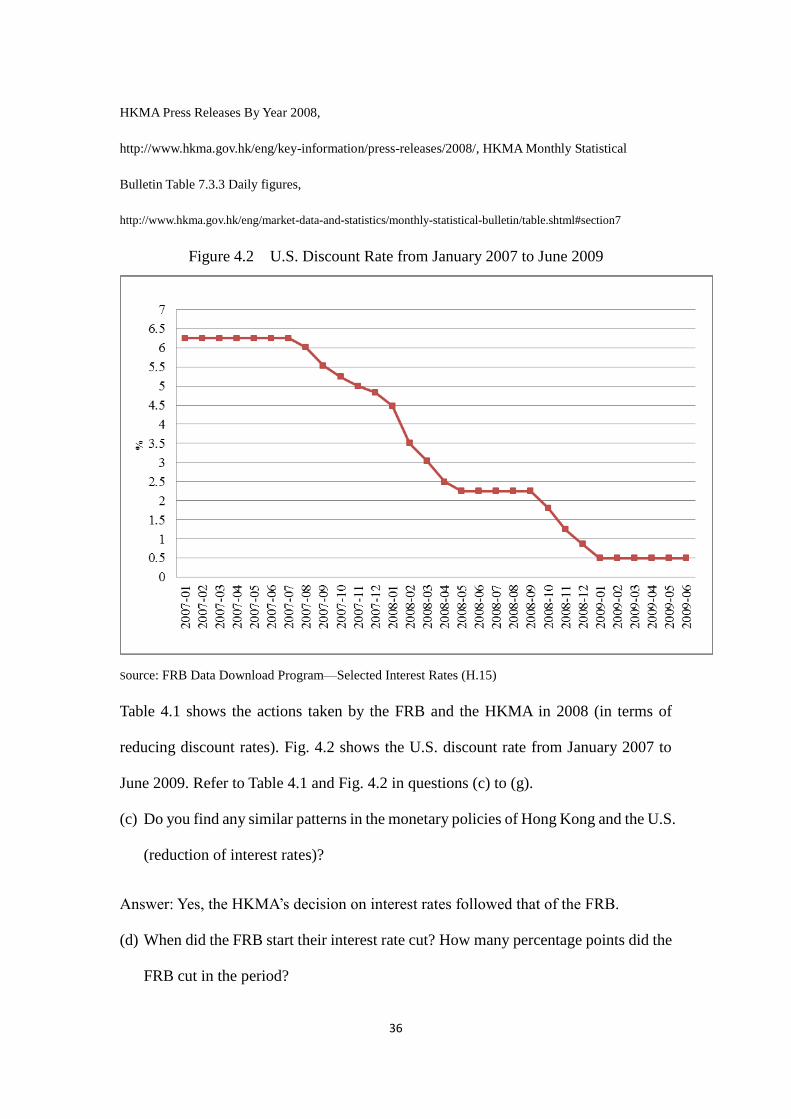
Figure 4.2 U.S. Discount Rate from January 2007 to June 2009
Source: FRB Data Download Program—Selected Interest Rates (H.15)
Table 4.1 shows the actions taken by the FRB and the HKMA in 2008 (in terms of
reducing discount rates). Fig. 4.2 shows the U.S. discount rate from January 2007 to
June 2009. Refer to Table 4.1 and Fig. 4.2 in questions (c) to (g).
(c) Do you find any similar patterns in the monetary policies of Hong Kong and the U.S.
(reduction of interest rates)?
Answer: Yes, the HKMA’s decision on interest rates followed that of the FRB.
(d) When did the FRB start their interest rate cut? How many percentage points did the
FRB cut in the period?
37
Answer: In August 2008. The discount rate dropped from 6.25% to 0.5%, so it was by
6.2 percentage points.
(e) If the HKMA does not follow the U.S. discount rate when setting interest rates,
what will happen to the linked exchange rate?
Answer: Capital will flow to the area with a higher interest rate, which may lead to
the breakdown of the linked exchange rate system.
(f) Refer to Fig. 1.3. Do you think that the cuts in interest rates were able to stop Hong
Kong from entering recession in 2008 to 2009?
Answer: No. Hong Kong’s real GDP growth rate still fell.
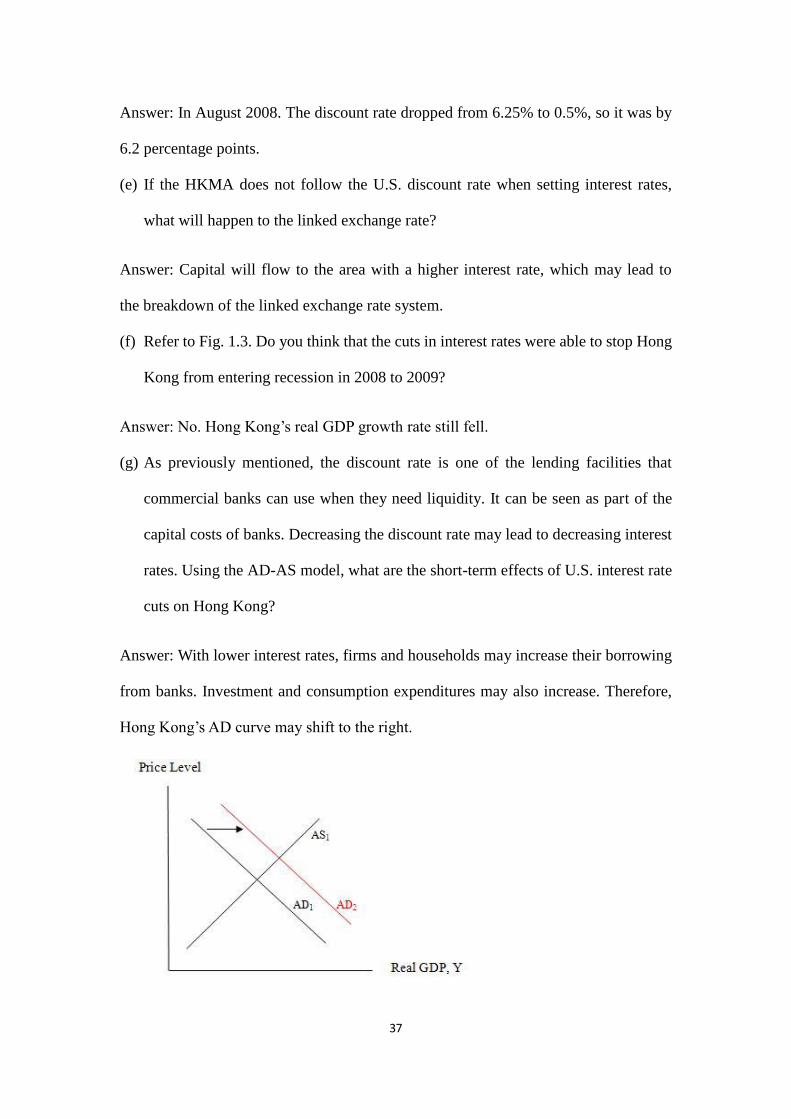
(g) As previously mentioned, the discount rate is one of the lending facilities that
commercial banks can use when they need liquidity. It can be seen as part of the
capital costs of banks. Decreasing the discount rate may lead to decreasing interest
rates. Using the AD-AS model, what are the short-term effects of U.S. interest rate
cuts on Hong Kong?
Answer: With lower interest rates, firms and households may increase their borrowing
from banks. Investment and consumption expenditures may also increase. Therefore,
Hong Kong’s AD curve may shift to the right.
38
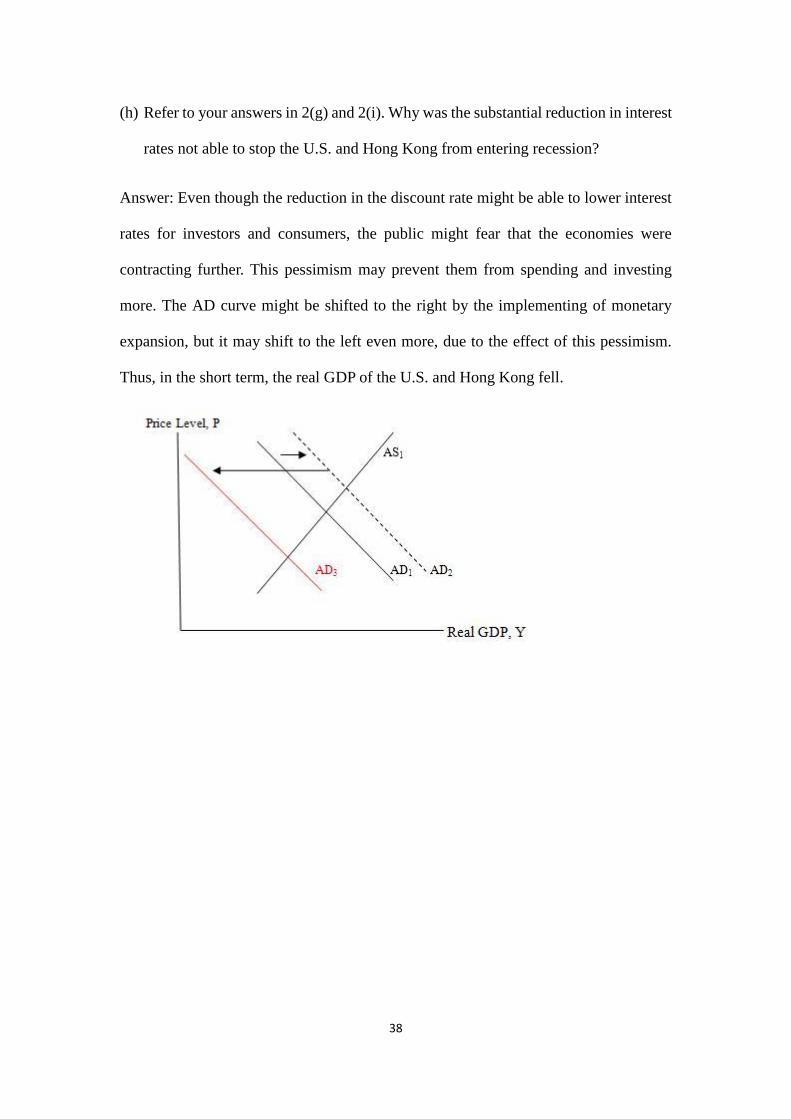
(h) Refer to your answers in 2(g) and 2(i). Why was the substantial reduction in interest
rates not able to stop the U.S. and Hong Kong from entering recession?
Answer: Even though the reduction in the discount rate might be able to lower interest
rates for investors and consumers, the public might fear that the economies were
contracting further. This pessimism may prevent them from spending and investing
more. The AD curve might be shifted to the right by the implementing of monetary
expansion, but it may shift to the left even more, due to the effect of this pessimism.
Thus, in the short term, the real GDP of the U.S. and Hong Kong fell.
39
5. External Shocks and Inflation in Hong Kong
The required reserve ratio57
, also known as reserve deposit ratio, is the ratio of
reserves held by banks to the public’s deposits in banks. This ratio is set by central
bank and banks have to hold this minimum fraction of deposits as reserves. 58
When the ratio increases (decreases), the money multiplier will decrease (will
increase) and it can reduce (increase) the money supply for any level of the monetary
base.
The People’s Bank of China (PBoC) relaxed its monetary policies due to the
deteriorating external economic environment of late 2008. It relied on the downward
adjustment of the reserve requirement ratios of large financial institutions to increase
credit, and thus the money supply. 59
57
Required reserve ratio is also known as legal reserve ratio. 58
Abel and Bernanke (2001), p. 536. 59
Monetary Policy Department, The People’s Bank of China,
http://www.pbc.gov.cn/publish/zhengcehuobisi/609/index.html
40
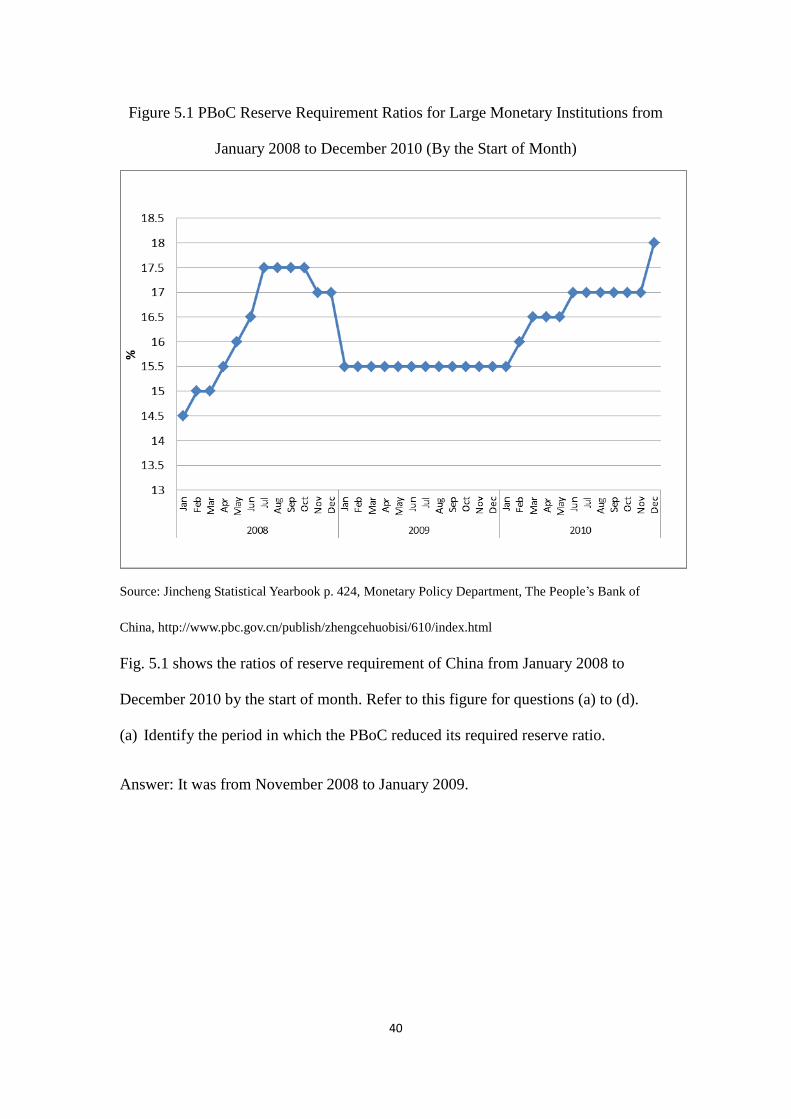
Figure 5.1 PBoC Reserve Requirement Ratios for Large Monetary Institutions from
January 2008 to December 2010 (By the Start of Month)
Source: Jincheng Statistical Yearbook p. 424, Monetary Policy Department, The People’s Bank of
China, http://www.pbc.gov.cn/publish/zhengcehuobisi/610/index.html
Fig. 5.1 shows the ratios of reserve requirement of China from January 2008 to
December 2010 by the start of month. Refer to this figure for questions (a) to (d).
(a) Identify the period in which the PBoC reduced its required reserve ratio.
Answer: It was from November 2008 to January 2009.
41
As China was increasing its money supply, we can now investigate the implications of
that on inflation.
According to the Quantity Theory of Money, MV=PQ,
where P represents price level, and V represents velocity of money.60
This is equal to
a nominal GDP divided by the nominal money stock, where M represents the nominal
money stock, and Q represents the real GDP.
(b) If the money supply increases, what will happen to the price level in the long term,
when all other things (such as velocity of money and real GDP) are constant?
Answer: The growth rate of the price level is exactly equal to the growth rate of the
money supply.
(c) If the price level keeps on rising, what is it?
Answer: It is the inflation.
Table 5.1 The Growth Rate of China’s M1 and M2 in October 2008 and December
2009
M1 (RMB100
Million)
M2 (RMB100
Million)
October, 2008 157194.36 453133.32
December, 2009 221445.81 610224.52
Growth rate of M1 or M2 40.87% 34.67%
Source: Statistics and Analysis Department, The People’s Bank of China (2009, 2010)
(d) For the Chinese inflation rate, what can be predicted by using QTM?
Answer: An increase in the money supply may lead to an increase in the price level.
60
Velocity of money measures how often the money stock “turns over” each period, it can be altered
by financial innovation. (Abel and Bernanke 2001, p. 257.)
42
“I note that commodity prices have generally rebounded and that food prices in
the Mainland have also risen. If the US dollar exchange rate remains soft and these
price increases continue, it will add to imported inflation especially in the latter part
of the year which in turn may impose a heavier burden on Hong Kong people.” 61
(The Budget 2010-11)
“The soft US dollar and possible sustained increase in global food and
commodity prices will put more inflationary pressure on Hong Kong. On top of these,
the continued rise in the Mainland’s food prices and local rentals are expected to have
a more noticeable effect on our inflation this year.”62
(The Budget 2011-12)
Inflation rate is usually measured by the percentage change of the
consumer price index (CPI). What are consumer price indices? There are two
definitions to be considered for Hong Kong and for China.
In Hong Kong,
Composite Consumer Price Index (CPI) measures the changes over time in the
price level of consumer goods and services generally purchased by households. The
year-on-year rate of change in the CPI is widely used as an indicator of the inflation
affecting consumers.63
In China,
Consumer Price Index (CPI) reflects the trend and the degree of changes in
prices of consumer goods and services purchased by urban and rural residents. It is a
composite index which is derived from the urban consumer price index and the rural
consumer price index. [The] consumer price index can be used to analyze the impact
61
The Budget 2010-11, http://www.budget.gov.hk/2010/eng/budget03.html 62
The Budget 2011-12, http://www.budget.gov.hk/2011/eng/budget04.html 63
Hong Kong Census and Statistics Department, 2011. Annual Report on the Consumer Price Index 2011, p. 2-3.
43
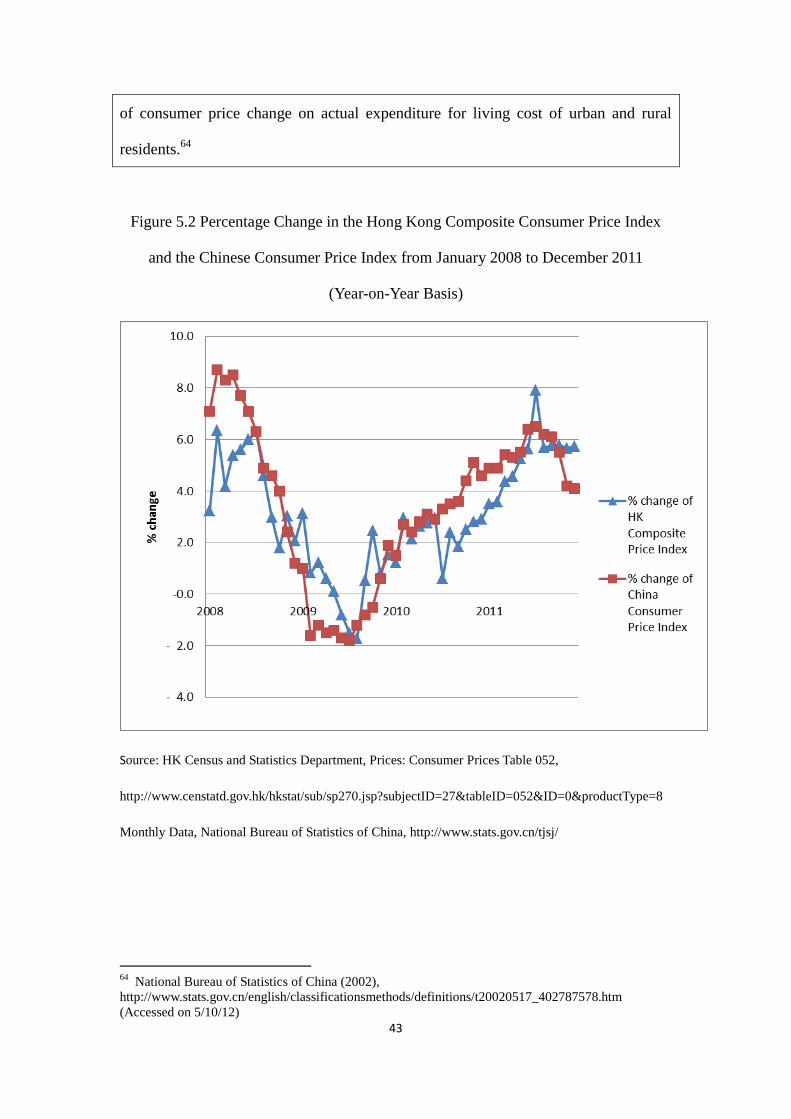
of consumer price change on actual expenditure for living cost of urban and rural
residents.64
Figure 5.2 Percentage Change in the Hong Kong Composite Consumer Price Index
and the Chinese Consumer Price Index from January 2008 to December 2011
(Year-on-Year Basis)
Source: HK Census and Statistics Department, Prices: Consumer Prices Table 052,
http://www.censtatd.gov.hk/hkstat/sub/sp270.jsp?subjectID=27&tableID=052&ID=0&productType=8
Monthly Data, National Bureau of Statistics of China, http://www.stats.gov.cn/tjsj/
64
National Bureau of Statistics of China (2002),
http://www.stats.gov.cn/english/classificationsmethods/definitions/t20020517_402787578.htm
(Accessed on 5/10/12)
44
Fig. 5.2 shows the percentage changes in the Hong Kong Composite Price Index and
the Chinese Consumer Price Index. The sampling period is from January 2008 to
December 2011 (year-on-year basis). Refer to this figure and answer the questions
below.
(e) What does the percentage change in such indices mean?
Answer: It represents a change in price level. If the price level is increasing (is
decreasing) over a period of time, this is inflation (deflation).
(f) Did the Hong Kong and Chinese CPIs show a similar pattern between June 2009
and August 2009? What was the pattern?
Answer: Yes, it was decreasing. China had a deflation from February to October 2009
while Hong Kong had a deflation from June to August 2009.
(g) Did the Hong Kong and Chinese CPIs show a similar pattern between November
2009 and December 2011? What was the pattern?
Answer: Yes, it was increasing. There was inflation in China and Hong Kong.
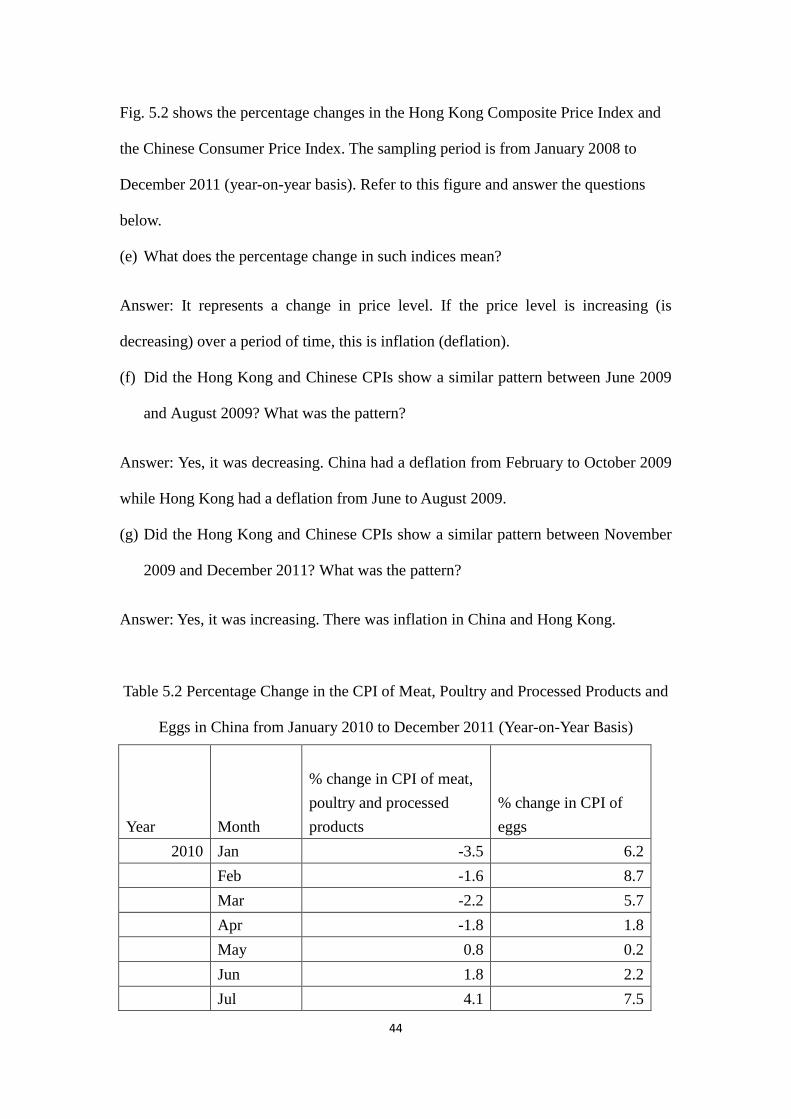
Table 5.2 Percentage Change in the CPI of Meat, Poultry and Processed Products and
Eggs in China from January 2010 to December 2011 (Year-on-Year Basis)
Year Month
% change in CPI of meat,
poultry and processed
products
% change in CPI of
eggs
2010 Jan -3.5 6.2
Feb -1.6 8.7
Mar -2.2 5.7
Apr -1.8 1.8
May 0.8 0.2
Jun 1.8 2.2
Jul 4.1 7.5
45
Aug 5.4 9.6
Sep 5.4 9.9
Oct 6.8 10.5
Nov 9.9 17.6
Dec 10.2 19
2011 Jan 10.9 19
Feb 13.3 18.4
Mar 17.3 13.5
Apr 21.4 13.8
May 24.3 18.9
Jun 32.3 22.1
Jul 13.6 19.7
Aug 29.3 16.3
Sep 28.4 14.2
Oct 26.1 12.6
Nov 19.6 4.4
Dec 16.6 1.2
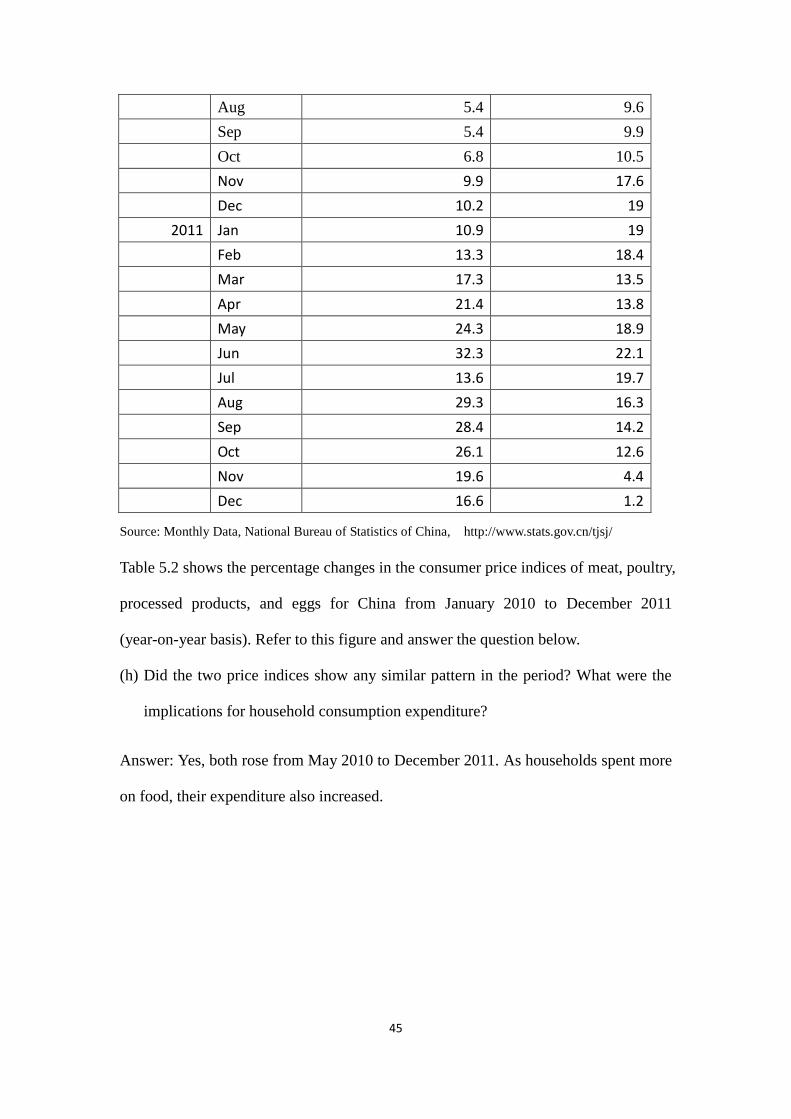
Source: Monthly Data, National Bureau of Statistics of China, http://www.stats.gov.cn/tjsj/
Table 5.2 shows the percentage changes in the consumer price indices of meat, poultry,
processed products, and eggs for China from January 2010 to December 2011
(year-on-year basis). Refer to this figure and answer the question below.
(h) Did the two price indices show any similar pattern in the period? What were the
implications for household consumption expenditure?
Answer: Yes, both rose from May 2010 to December 2011. As households spent more
on food, their expenditure also increased.
46
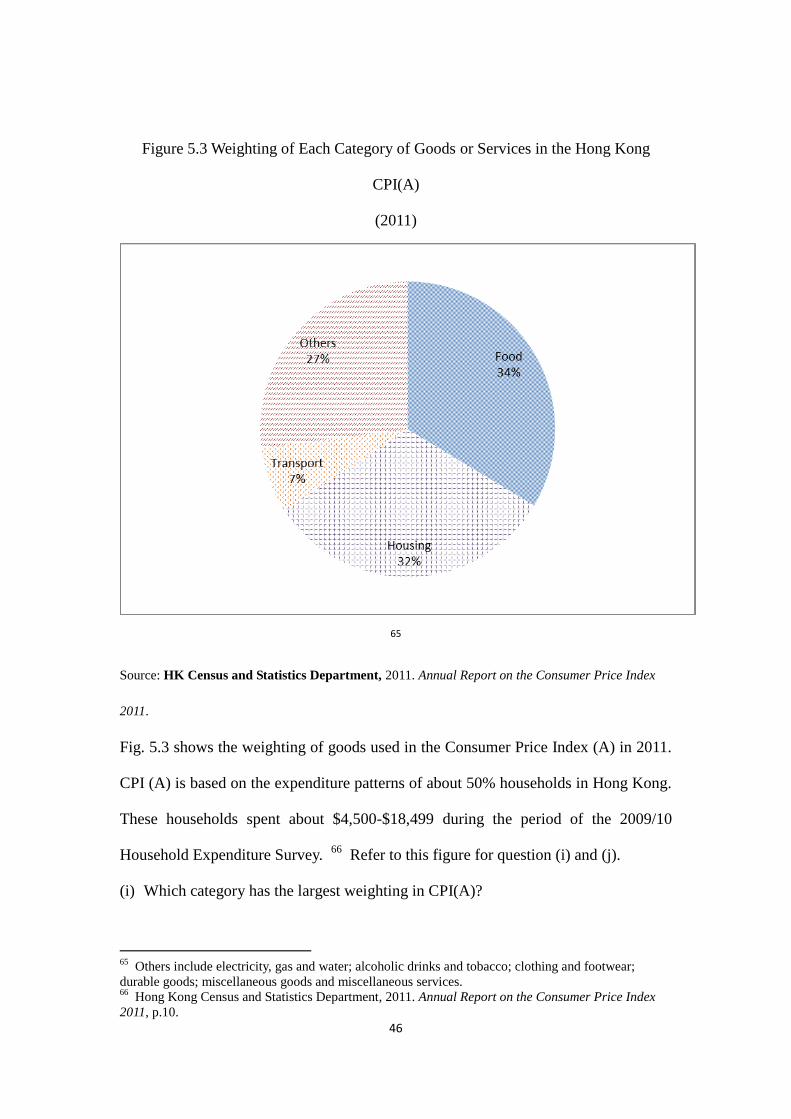
Figure 5.3 Weighting of Each Category of Goods or Services in the Hong Kong
CPI(A)
(2011)
65
Source: HK Census and Statistics Department, 2011. Annual Report on the Consumer Price Index
2011.
Fig. 5.3 shows the weighting of goods used in the Consumer Price Index (A) in 2011.
CPI (A) is based on the expenditure patterns of about 50% households in Hong Kong.
These households spent about $4,500-$18,499 during the period of the 2009/10
Household Expenditure Survey. 66
Refer to this figure for question (i) and (j).
(i) Which category has the largest weighting in CPI(A)?
65
Others include electricity, gas and water; alcoholic drinks and tobacco; clothing and footwear;
durable goods; miscellaneous goods and miscellaneous services. 66
Hong Kong Census and Statistics Department, 2011. Annual Report on the Consumer Price Index
2011, p.10.
47
Answer: Food, at 34% in the weighting.
(j) Hong Kong mainly imports fresh food items from China. Refer to Fig. 5.2 and
Table 5.2. Please provide an explanation to your answer in 5(g).
Answer: Hong Kong has imported many foodstuffs from China. Increasing prices of
foodstuffs in China may lead to an increase in Hong Kong’s CPI.
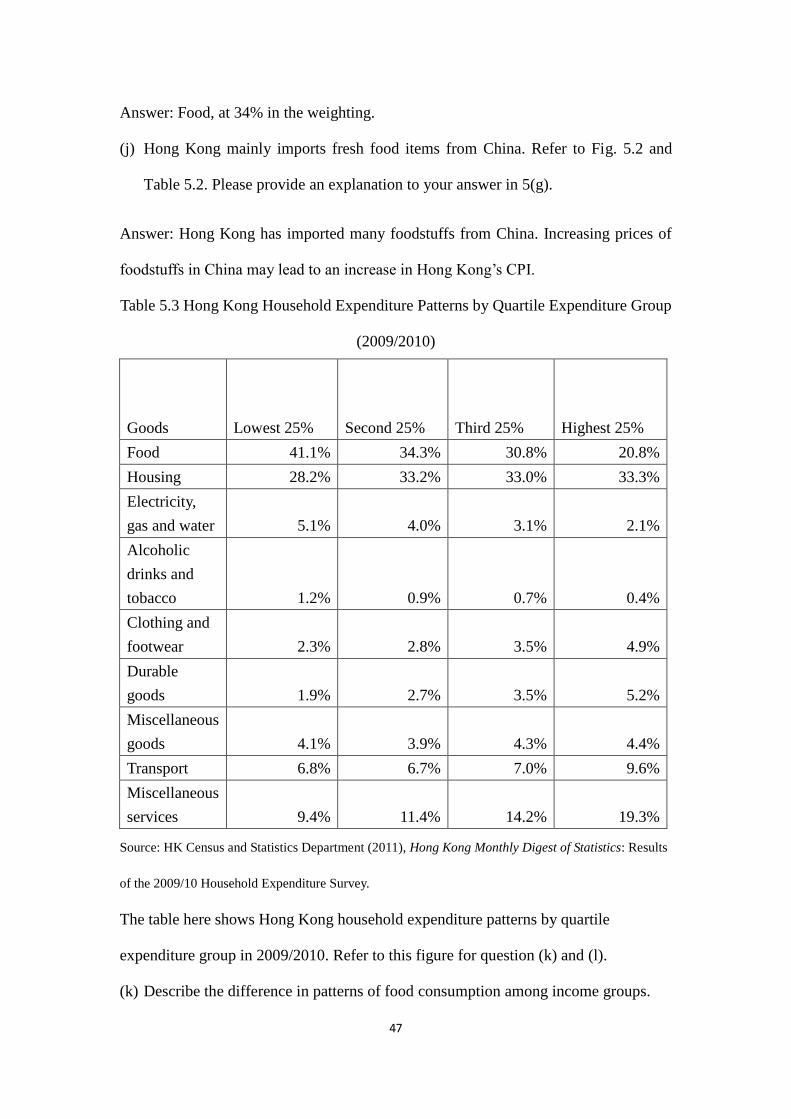
Table 5.3 Hong Kong Household Expenditure Patterns by Quartile Expenditure Group
(2009/2010)
Goods Lowest 25% Second 25% Third 25% Highest 25%
Food 41.1% 34.3% 30.8% 20.8%
Housing 28.2% 33.2% 33.0% 33.3%
Electricity,
gas and water 5.1% 4.0% 3.1% 2.1%
Alcoholic
drinks and
tobacco 1.2% 0.9% 0.7% 0.4%
Clothing and
footwear 2.3% 2.8% 3.5% 4.9%
Durable
goods 1.9% 2.7% 3.5% 5.2%
Miscellaneous
goods 4.1% 3.9% 4.3% 4.4%
Transport 6.8% 6.7% 7.0% 9.6%
Miscellaneous
services 9.4% 11.4% 14.2% 19.3%
Source: HK Census and Statistics Department (2011), Hong Kong Monthly Digest of Statistics: Results
of the 2009/10 Household Expenditure Survey.
The table here shows Hong Kong household expenditure patterns by quartile
expenditure group in 2009/2010. Refer to this figure for question (k) and (l).
(k) Describe the difference in patterns of food consumption among income groups.
48
Answer: The higher the income group, the lower the proportion of food expenditure.
(l) Suppose that the prices of fresh food items in China increase by a large amount.
Which group will be affected most? Why?
Answer: The lowest 25% will be most affected because they have the largest
expenditure share on food consumption.
“In the face of surging food prices, we will continue to diversify the sources of
our food imports. This year, one of the key policy directions of the Mainland is to
contain inflation and manage inflation expectations. Hong Kong will be able to fight
inflation more effectively if the Mainland’s inflation is brought under control.” 67
(The Budget 2011-12)
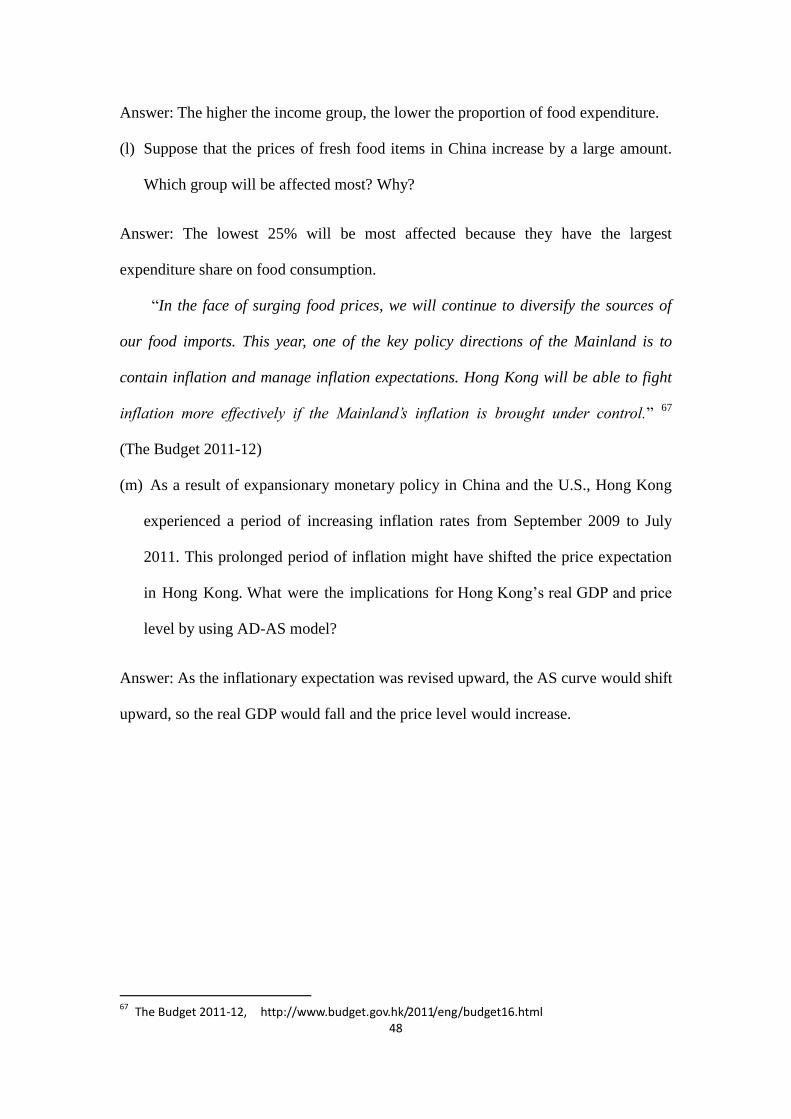
(m) As a result of expansionary monetary policy in China and the U.S., Hong Kong
experienced a period of increasing inflation rates from September 2009 to July
2011. This prolonged period of inflation might have shifted the price expectation
in Hong Kong. What were the implications for Hong Kong’s real GDP and price
level by using AD-AS model?
Answer: As the inflationary expectation was revised upward, the AS curve would shift
upward, so the real GDP would fall and the price level would increase.
67
The Budget 2011-12, http://www.budget.gov.hk/2011/eng/budget16.html
49
(c) Suggested references materials for teachers and students’ further exploration
Webpages
1. Board of Governors of the Federal Reserve System
http://www.federalreserve.gov/
2. European Central Bank: Key dates of the financial crisis
http://www.ecb.int/ecb/html/crisis.en.html
3. European Commissioner: Economic and Financial Affairs—Financial Assistance
in EU Member States
http://ec.europa.eu/economy_finance/assistance_eu_ms/index_en.htm
4. European Council: Eurozone Governance Key Events
http://european-council.europa.eu/eurozone-governance/keyevents
5. European Financial Stability Facility FAQ
http://www.efsf.europa.eu/attachments/faq_en.pdf
6. European Stability Mechanism Factsheet
http://www.esm.europa.eu/pdf/ESM%20Factsheet.pdf
7. Hong Kong Census and Statistics Department. External Trade: Concepts and
Methods.
http://www.censtatd.gov.hk/hkstat/sub/sc40.jsp
50
8. Hong Kong Census and Statistics Department. The Four Key Industries and the Six
Industries—Concepts and Methods.
http://www.censtatd.gov.hk/hkstat/sub/sc80.jsp
9. Hong Kong Census and Statistics Department. National Income—Concepts and
Methods.
http://www.censtatd.gov.hk/hkstat/sub/sc250.jsp
10. Hong Kong Trade Development Council Research
http://hong-kong-economy-research.hktdc.com/
11. Hong Kong Trade Development Centre. 2012. Import and Export Trade in Hong
Kong.
http://hong-kong-economy-research.hktdc.com/business-news/article/Hong-Kong-
Industry-Profiles/Import-and-Export-Trade-Industry-in-Hong-Kong/hkip/en/1/1X
000000/1X006NJK.htm
12. International Monetary Fund: World Economic Outlook
http://www.imf.org/external/ns/cs.aspx?id=29
13. National Bureau of Statistics of China
http://www.stats.gov.cn/english/
14. The US Federal Reserve Education
http://www.federalreserveeducation.org/
15. The 1998-99 Budget. http://www.budget.gov.hk/1998/english/eindex.htm
16. The 2011-12 Budget. http://www.budget.gov.hk/2011/eng/speech.html
17. The 2010-11 Budget. http://www.budget.gov.hk/2010/eng/speech.html
18. The 2009-10 Budget. http://www.budget.gov.hk/2009/eng/speech.html
19. The 2008-09 Budget. http://www.budget.gov.hk/2008/eng/speech.html
20. The 2009-10 Policy Address: Breaking New Ground Together.
http://www.policyaddress.gov.hk/09-10/eng/index.html
51
21. The Federal Reserve Bank of St. Louis. 2011. The Financial Crisis: A Timeline of
Events and Policy Actions.
http://timeline.stlouisfed.org/
22. The People’s Bank of China
http://www.pbc.gov.cn/
23. Trade and Industry Department. 2012. Hong Kong’s Trade Policy.
http://www.tid.gov.hk/english/aboutus/tradepolicy/trpolicy.html
Books, Research Reports and Journal Articles
1. Abel, Andrew B. and Ben S. Bernanke. 2001. Macroeconomics (4th Edition).
New York: Addison Wesley Longman, Inc.
2. Blanchard, Olivier. 2009. Macroeconomics (5th Edition). Upper Saddle River:
Pearson Education, Inc.
3. Hong Kong Census and Statistics Department, 2011. Annual Report on the
Consumer Price Index 2011.
4. Hong Kong Census and Statistics Department. 2011. Gross Domestic Product
(Yearly) (2011 Edition).
5. Hong Kong Monetary Authority, 2011. HKMA Background Brief No.1: Hong
Kong’s Linked Exchange Rate System, 2nd edition.
6. Mishhkin, Fredric S. 2010. “Over the Cliff: From the Subprime to the Global
Financial Crisis.” NBER Working Paper no. 16609
http://www.nber.org/papers/w16609.pdf?new_window=1
7. Parkin, Michael. 2000. Economics (5th Edition). Addison-Wesley Publishing
Company Inc.
8. Posner, Richard A. 2009. A Failure of Capitalism: The Crisis of ’08 and the
Descent into Depression. Cambridge: Harvard University Press.
52
9. Frank, Robert H. and Ben S. Benanke. 2009. Principles of Economics (4th
Edition). New York: McGraw-Hill Irwin. P.614.
10. Wyplosz, Charles. 2010. “The Eurozone in the Current Crisis.” ADBI Working
Paper Series no. 207, Asian Development Bank Institute.
http://www.adbi.org/working-paper/2010/03/26/3643.eurozone.current.crisis/