Embed Size (px)
Citation preview
MACROECONOMIC EFFECTS OF BUDGET DEFICITS IN UGANDA:
A VAR-VECM APPROACH
MUSA MAYANJA LWANGA JOSEPH MAWEJJE
JUNE 2014
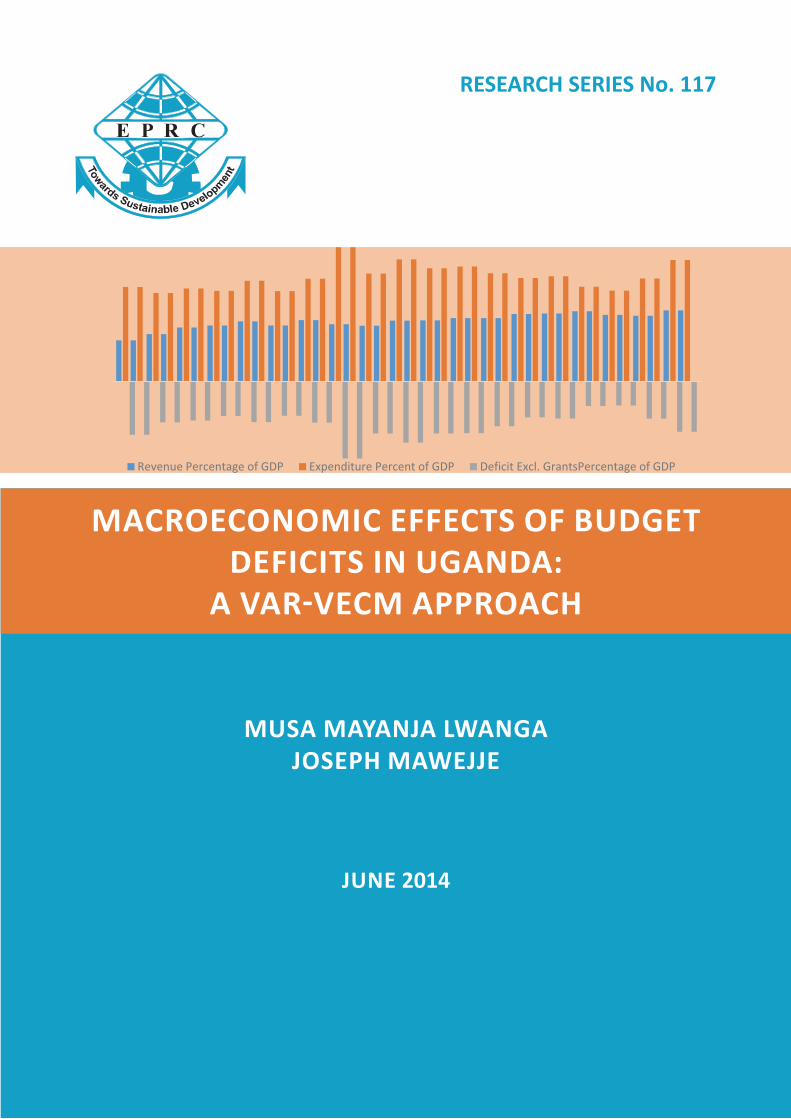
RESEARCH SERIES No. 117

RESEARCH SERIES No. 117
MACROECONOMIC EFFECTS OF BUDGET DEFICITS IN UGANDA:
A VAR-VECM APPROACH
MUSA MAYANJA LWANGA JOSEPH MAWEJJE
JUNE 2014
Copyright © Economic Policy Research Centre (EPRC)
The Economic Policy Research Centre (EPRC) is an autonomous not-for-profit organization established in 1993 with a mission to foster sustainable growth and development in Uganda through advancement of research –based knowledge and policy analysis. Since its inception, the EPRC has made significant contributions to national and regional policy formulation and implementation in the Republic of Uganda and throughout East Africa. The Centre has also contributed to national and international development processes through intellectual policy discourse and capacity strengthening for policy analysis, design and management. The EPRC envisions itself as a Centre of excellence that is capable of maintaining a competitive edge in providing national leadership in intellectual economic policy discourse, through timely research-based contribution to policy processes.
Disclaimer: The views expressed in this publication are those of the authors and do not necessarily represent the views of the Economic Policy Research Centre (EPRC) or its management.
Any enquiries can be addressed in writing to the Executive Director on the following address:
Economic Policy Research CentrePlot 51, Pool Road, Makerere University CampusP.O. Box 7841, Kampala, UgandaTel: +256-414-541023/4Fax: +256-414-541022Email: [email protected]: www.eprc.or.ug
iECONOMIC POLICY RESEARCH CENTRE - EPRC
Macroeconomic Effects of Budget Deficits in Uganda: A VAR-VECM Approach
ABSTRACT
This paper investigates the relationship between budget deficits and selected macroeco-nomic variables for the period 1999 to 2011 using Vector Error Correction Model (VECM), pairwise granger causality test and variance decomposition techniques. Results indicate that the variables under study are cointegrated and thus have a long run relationship. Results based on the VECM reveal unidirectional causal relationships running from budget deficits (BD) to current account balance (CAB), inflation to BD and BD to lending interest rates. But the results show no causal relationship between gross domestic product (GDP) and budget deficits in Uganda. The Pairwise Granger Causality test results reveal unidirectional causal relationships running from budget deficit to current account, BD to GDP, inflation to BD, and a bi-directional causal relationship between the current account balance and GDP. Variance decomposition results show that, variances in the current account balance and GDP are mostly explained by the budget deficit followed by lending interests while variance in lend-ing interest rates is mostly explained by inflation followed by GDP, variance in the Inflation is mostly explained by variance in lending interest rates followed by the current account bal-ance. The results from the study clearly show that budget deficits in Uganda are responsible for widening current account deficit and raising interest rates. Fiscal and monetary policy actions are therefore needed to contain and reduce the deficit in order to minimize its ef-fect on the current account and lending interest rates. Such actions should aim at increasing Uganda’s tax revenue collection by adopting efficient and effective methods of tax collec-tion. Such policies should see a reduction in the informal sector which has proved difficult to tax and a reduction in ineffective tax exemptions. Government should improve and heighten its efforts in combating tax evasion and corruption which undermine its tax collection ef-forts.
Keywords: Budget Deficits, macroeconomic performance, VAR, Uganda JEL Classification: C5, E6, H5
ii ECONOMIC POLICY RESEARCH CENTRE - EPRC
Macroeconomic Effects of Budget Deficits in Uganda: A VAR-VECM Approach
TABLE OF CONTENTS
ABSTRACT i
1.0 INTRODUCTION 1 1.1 Background of the Study 2
2.0 LITERATURE REVIEW 5 2.1 Theoretical Literature 5 2.2 Empirical Literature 6
3.0. METHODOLOGY, DATA AND EMPIRICAL MODEL 9 3.1 Methodology 9 3.2. The Empirical Model 11 3.2 Empirical Strategy 11 3.3 Data and Time Series Properties 12
4.0 RESULTS AND DISCUSSION 12 4.1 Estimated Results 14 4.2 Pairwise Granger Causality Test Results 15 4.3 Variance Decomposition Analysis 15
5.0 CONCLUSION AND POLICY IMPLICATIONS 18
REFERENCES 20
ANNEXES 22Annex 1: Data Description and Sources 22Annex 2: Summary Statistics, using the observations 1999:1 - 2011:2 22Annex 3: Time series plots of level variables 23Annex 4: Correlation coefficients, using the observations 1999:1 - 2011:2, 5% critical value (two-tailed) = 0.2787 for n = 50 23Annex 5: VAR Lag Order Selection Criteria, Endogenous variables: LBD LCAB LGDP LLIR INFLATION 24Annex 7: VAR Residual Normality Tests, Orthogonalization: Cholesky (Lutkepohl), Null Hypothesis: residuals are multivariate normal 24Annex 8: VAR Residual Serial Correlation LM Tests, Null Hypothesis: no serial correlation at lag order h 25
EPRC RESEARCH SERIES 26
1ECONOMIC POLICY RESEARCH CENTRE - EPRC
Macroeconomic Effects of Budget Deficits in Uganda: A VAR-VECM Approach
1.0 INTRODUCTION
The relationship between budget deficits and other macroeconomic variables repre-sents one of the most widely debated top-ics amongst economists and policy makers in both developed and developing countries (Aisen and Hauner, 2008, Georgantopoulos and Tsamis, 2011). It’s widely believed that huge budget deficits have adverse macro-economic effects such as high interest rates, current account deficits, inflation etc. (Bern-heim, 1989).
In the last five years, the ratio of the bud-get deficit to GDP has risen from about 4.6 percent in 2007 to over 9.5 percent in 2011. This trend is also observed in the growth government debt. Total external debt has increased from about 1785 million US dol-lars in 2007 to over 3109 million US dollars in2011. This growth in budget deficit spend-ing is worrying especially its effect on other macroeconomic variables. The continuously widening current account deficit, high in-terest rates and inflation are believed to be partly due to government’s budget deficit spending (Mugume and Obwona, 1998). Despite this general knowledge, there is no recent empirical evidence about Uganda that links the budget deficits and other mac-roeconomic variables.
Thus, this study attempts to examine the relationship between the budget deficit and other macroeconomic variables using a VAR-VECM econometric approach. This is aimed at deriving substantive empirical evi-dence on the impact of budget deficits on key macroeconomic variables. The findings will inform both fiscal and monetary policy in Uganda. The findings will further enrich
the existing literature on the relationship of budget deficit and other macroeconomic variables by providing new evidence from a least developed country. The importance of this study is paramount since it covers a period which includes some of the most im-portant economic, political and social trans-formations that led to a more open and lib-eralised Ugandan economy.
We employ Vector Error Correction Model (VECM), pairwise granger causality test and variance decomposition techniques to examine the relationship between budget deficits and selected macroeconomic vari-ables (Gross Domestic Product (GDP), Lend-ing Interest Rates (LIR), Current Account Balance (CAB) and Inflation) using quarterly data from 1999 to 2011. VECM results re-veal unidirectional causal relationships run-ning from budget deficits to CAB, inflation to BD and BD to lending interest rates. But the results show no causal relationship be-tween GDP and budget deficits in Uganda. The Pairwise Granger Causality test results reveal unidirectional causal relationships running from budget deficit to current ac-count, BD to GDP, inflation to BD, and a bi-directional causal relationship between the current account balance and GDP. Variance decomposition results show that, variances in the current account balance and GDP are mostly explained by the budget deficit fol-lowed by lending interests while variance in lending interest rates is mostly explained by inflation followed by GDP, variance in the Inflation is mostly explained by variance in lending interest rates followed by the cur-rent account balance. The results from the study clearly show that budget deficits in Uganda are responsible for widening current account deficit and raising interest rates.
2 ECONOMIC POLICY RESEARCH CENTRE - EPRC
Macroeconomic Effects of Budget Deficits in Uganda: A VAR-VECM Approach
The paper is organised as follows. Section one provides the introduction and back-ground of the study, section two presents both the theoretical and empirical literature while section three presents the theoretical framework, methodology and data. Section four presents the study results and discus-sions. The final section contains conclusions and policy recommendations.
1.1 Background of the Study
Like any other least developed country, Uganda faces budgetary constraints largely due to its low resource base in terms low in-comes, low savings and a low tax base. In order to meet her development needs, the government requires more resources than it collects to finance its expenditure.
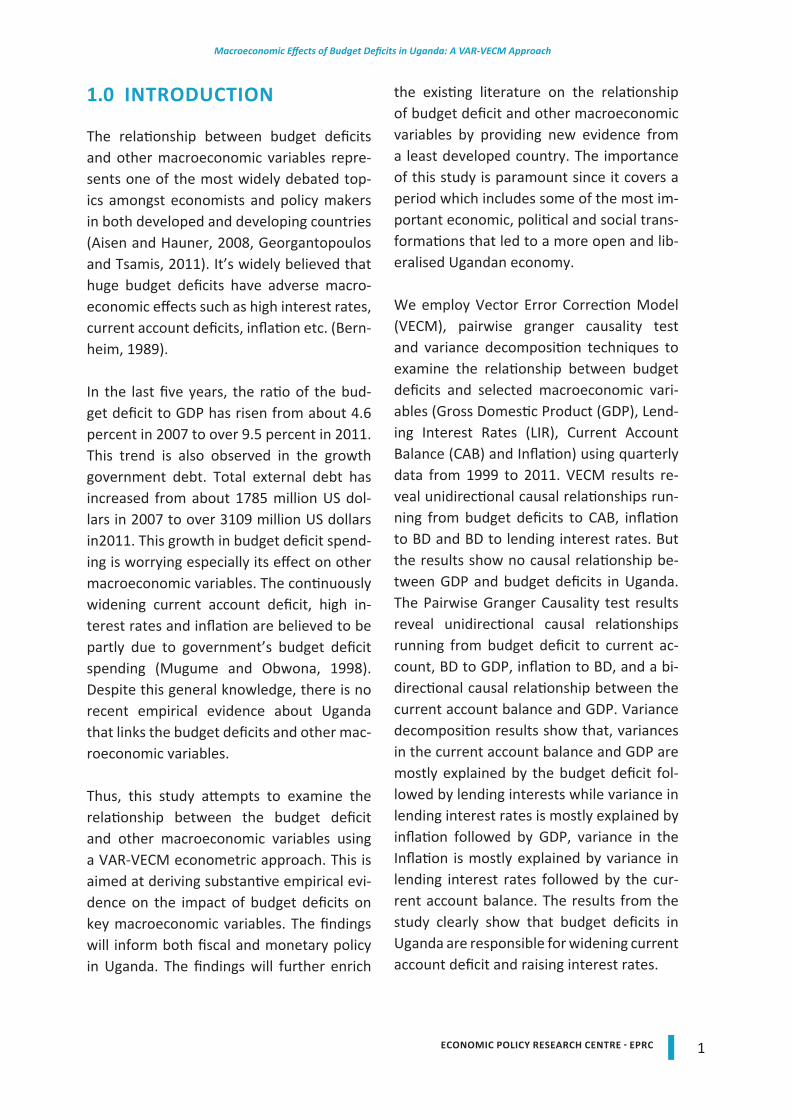
Available data shows that for the past two decades government expenditure has con-tinuously exceeded government revenue. The ratio of government expenditure to GDP has risen from about 18 percent of GDP in 1992/93 to about 23 percent of GDP in 2010/11, while the ratio of government
revenue to GDP has increased from about 8 percent to 13 percent during this period (Figure 1). This signifies a financing gap of about 10 percent of GDP in 2010/11 that has to be filled by other sources like borrow-ing and foreign aid.
Budget deficits can be financed through a number of ways which include govern-ment borrowing domestically (mainly used in countries with developed domestic fi-nancial systems), government borrowing from international sources, minting money by the central bank (monetary financing) and through foreign aid from donor govern-ments and agencies. The effects of budgets deficits on the economy largely depend on the financing sources (Mugume and Ob-wona, 1998; Adam and Bevan, 2005; IMF, 1995). If the deficit is financed by borrow-ing from the domestic banking system, the likely adverse impacts will be an increase in the domestic interest rates and the crowd-ing out of private borrowers (Easterly and Schmidt-Hebbel, 1993).
Figure 1: Government Revenue and Expenditure as % of GDP
Source: Ministry of Finance Planning and Economic Development, Uganda (MoFPED) (2012)
3ECONOMIC POLICY RESEARCH CENTRE - EPRC
Macroeconomic Effects of Budget Deficits in Uganda: A VAR-VECM Approach
If the deficit is financed by direct borrowing from the central bank/ money creation from the central bank (monetary financing of the budget deficit), it is highly likely that a huge deficit financed this way may lead to infla-tion (IMF, 1995).
In the case of financing deficit using exter-nally borrowed funds, the likely adverse ef-fects will be the appreciation of the exchange rate resulting from the inflow of foreign ex-change which will affect the performance of exports leading to the deterioration of the current account balance. It also leads to the growth in the country’s external debt stock which could result into a debt crisis. (East-erly and Schmidt-Hebbel, 1993; IMF, 1995).Financing the deficit through foreign aid could also have its own negative effects on other macroeconomic variables. This chan-nel of financing could create effects similar to the Dutch disease1. This happens if wind-fall of resources denoted in foreign currency (foreign aid) lead to the appreciation of the exchange rate making the country’s exports less competitive or lead to resources mov-ing away from the production of tradables
to the production of non-tradables. (Herr and Priewe, 2005; Brownbridge and Mute-bile, 2007).
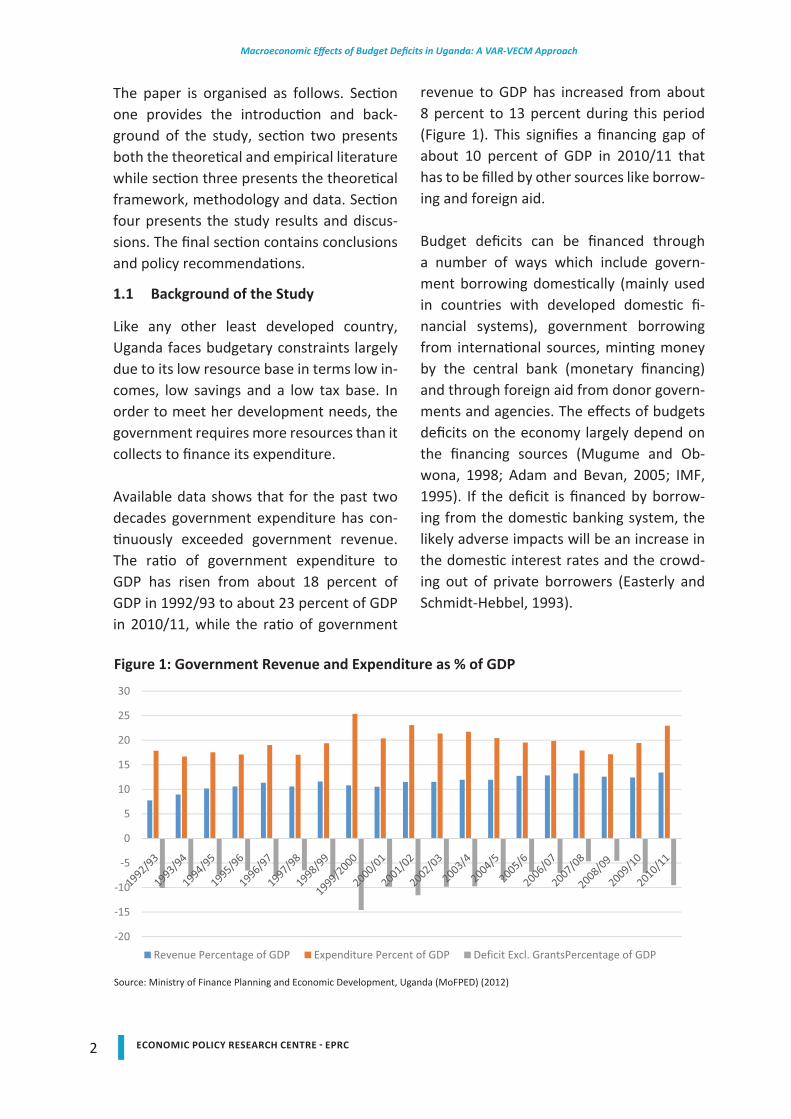
In Uganda the deficit is financed from both external and internal sources with external sources financing the largest proportion (figure 2). External financing is largely in form loans and grants. Grants come in form of budget or project support from bilateral and multilateral donor governments and agencies. Domestic sources include mainly bank financing and the sale of government securities.
The figure 2 shows that domestic financ-ing of the deficit has generally been lower than foreign financing apart from the year 1999/2000 and after 2009/10. From 2008/9 domestic financing of the budget deficit surges and rises above the external financ-ing. This surge in domestic financing may be explained by the increased spending result-ing from international financial crisis and the financing of the 2010/11 parliamentary and presidential elections.
The result of the increasing budget defi-
Figure 2: Comparing Domestic and External Deficit Financing (SHS Billions)
Source: MoFPED (2012)
4 ECONOMIC POLICY RESEARCH CENTRE - EPRC
Macroeconomic Effects of Budget Deficits in Uganda: A VAR-VECM Approach
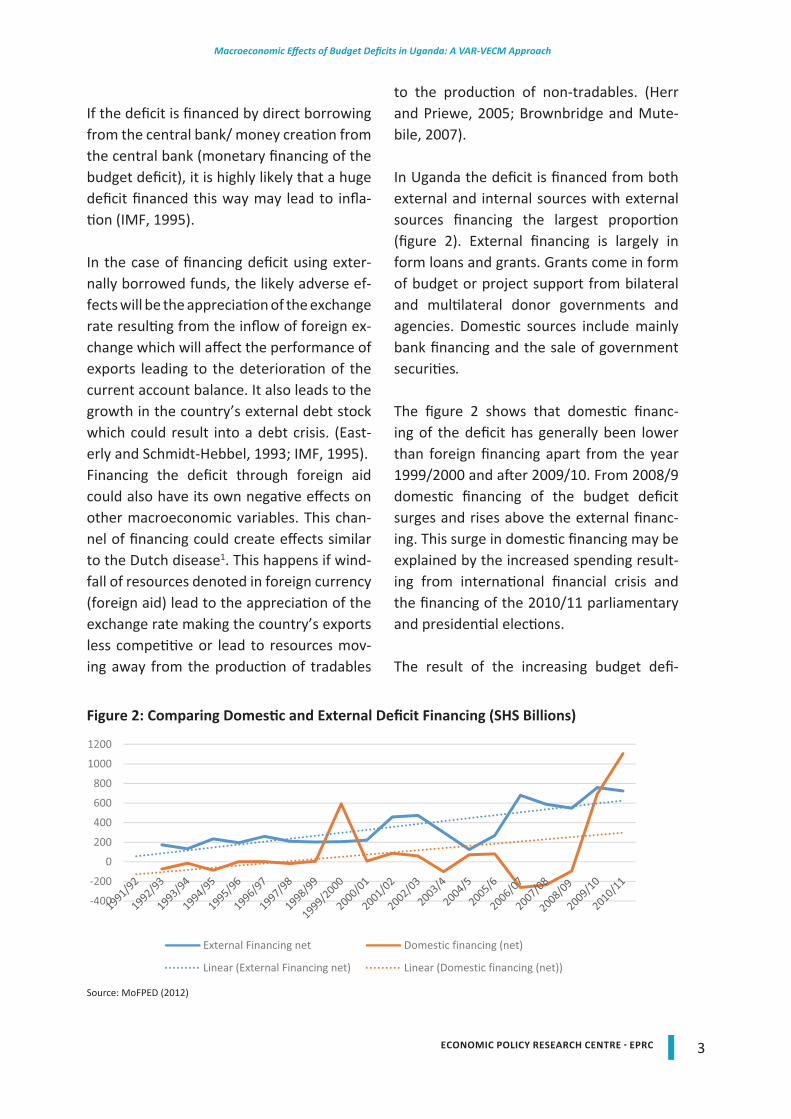
cit expenditure from the external financ-ing channel can be seen from the increase in Uganda’s external debt stock which has more than doubled from about 1,280 mil-lion dollars in 2006/08 to about 3,109 mil-lion US dollars in 2011/12. (Figure 4).
Figure 3 shows that Uganda carried a large stock of external debt of about 4,464 mil-lion US dollars up to 2006. Owing to debt forgiveness through the High Indebted Poor Countries initiative (HIPC) and the Multi-lateral Debt Relief Initiative (MDRI), Uganda’s external debt stock was reduced to manageable levels of about 1,280 million US in 2006/07. However, due to increasing government expenditure, Uganda’s exter-nal debt stock has steadily been rising ever since.
Effects of the budget deficit can also depend on the type of the sectors the government decides to spend on. For example, budget deficits can have positive macroeconom-ic effects in the long run if it is used to fi-nance extra capital spending that leads to an increase in the stock of national assets. Increased spending on the transport and power infrastructure improves the supply-
side capacity of the economy promoting long-run growth; for example, increased government investment in education and health can bring positive effects on labour productivity and employment. However, wasteful spending such as excessive gov-ernment expenditure on official travels and conferences might not contribute much to economic growth and development.
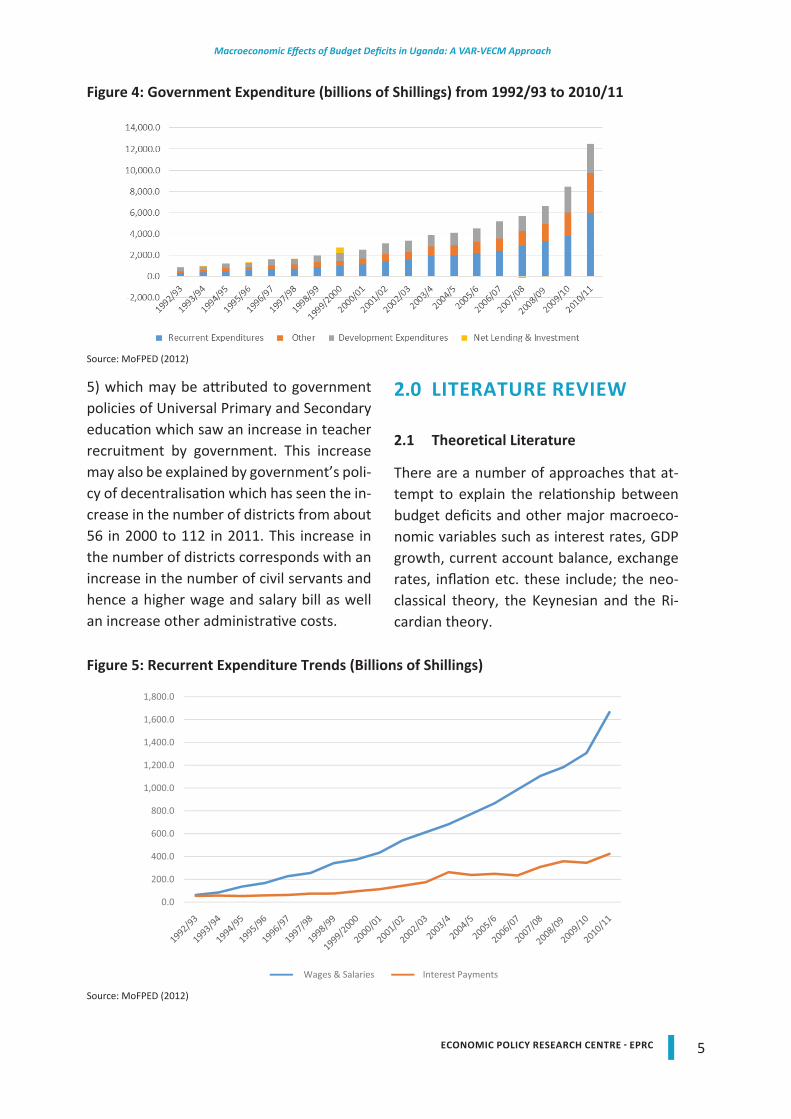
In Uganda government expenditure can be broken down into; (1) Recurrent Expendi-tures which includes wages and salaries, interest payments, transfers to the Uganda Revenue Authority, (2) Development expen-diture both external and domestic, (3) Lend-ing and investment and; (4) Other expendi-tures which include, pensions, defence, oth-er recurrent ministries and district recurrent expenditures.
From Figure 4 we see that the recurrent and development expenditures were almost equal from the early 1990s to 2000. Howev-er, the gap between the two has consistent-ly been widening since 2001. The increase in recurrent expenditure above development expenditure is due to an increase in gov-ernment wages and salary payment (figure
Figure 3: Total External Debt Stock (end of Period) Millions US Dollars
Source: Bank of Uganda (2012)
5ECONOMIC POLICY RESEARCH CENTRE - EPRC
Macroeconomic Effects of Budget Deficits in Uganda: A VAR-VECM Approach
5) which may be attributed to government policies of Universal Primary and Secondary education which saw an increase in teacher recruitment by government. This increase may also be explained by government’s poli-cy of decentralisation which has seen the in-crease in the number of districts from about 56 in 2000 to 112 in 2011. This increase in the number of districts corresponds with an increase in the number of civil servants and hence a higher wage and salary bill as well an increase other administrative costs.
2.0 LITERATURE REVIEW
2.1 Theoretical Literature
There are a number of approaches that at-tempt to explain the relationship between budget deficits and other major macroeco-nomic variables such as interest rates, GDP growth, current account balance, exchange rates, inflation etc. these include; the neo-classical theory, the Keynesian and the Ri-cardian theory.
Figure 4: Government Expenditure (billions of Shillings) from 1992/93 to 2010/11
Source: MoFPED (2012)
Source: MoFPED (2012)
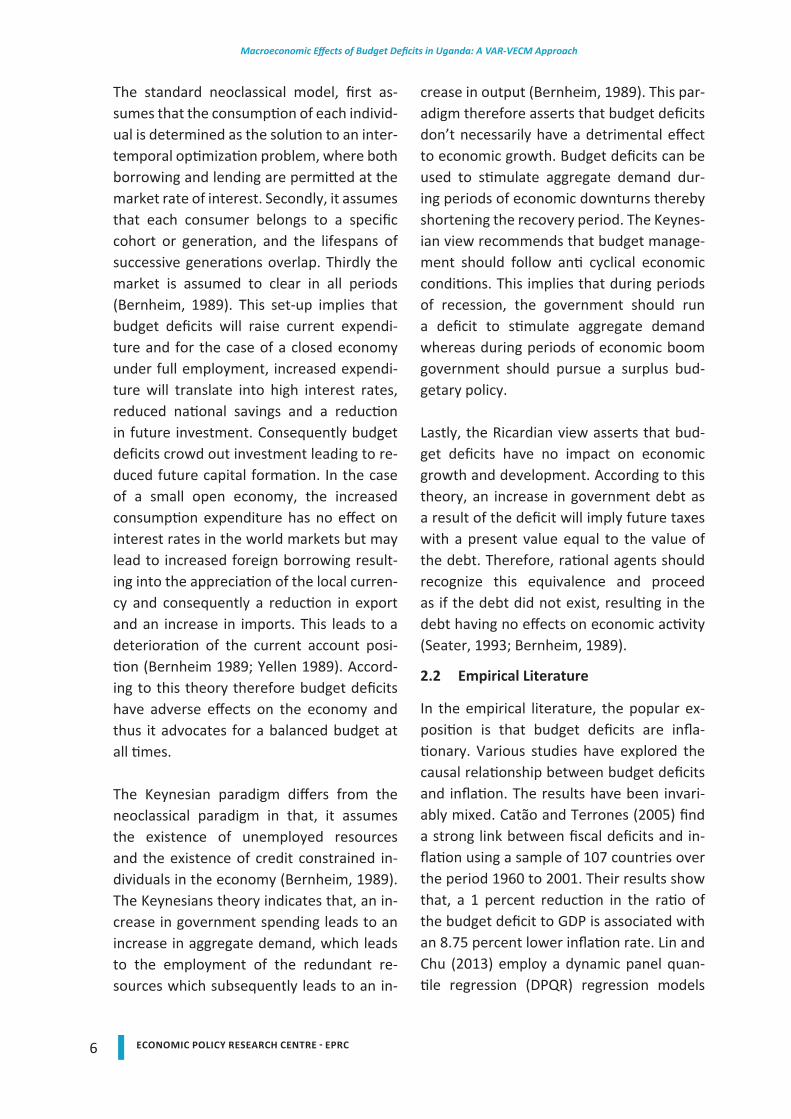
Figure 5: Recurrent Expenditure Trends (Billions of Shillings)
6 ECONOMIC POLICY RESEARCH CENTRE - EPRC
Macroeconomic Effects of Budget Deficits in Uganda: A VAR-VECM Approach
The standard neoclassical model, first as-sumes that the consumption of each individ-ual is determined as the solution to an inter-temporal optimization problem, where both borrowing and lending are permitted at the market rate of interest. Secondly, it assumes that each consumer belongs to a specific cohort or generation, and the lifespans of successive generations overlap. Thirdly the market is assumed to clear in all periods (Bernheim, 1989). This set-up implies that budget deficits will raise current expendi-ture and for the case of a closed economy under full employment, increased expendi-ture will translate into high interest rates, reduced national savings and a reduction in future investment. Consequently budget deficits crowd out investment leading to re-duced future capital formation. In the case of a small open economy, the increased consumption expenditure has no effect on interest rates in the world markets but may lead to increased foreign borrowing result-ing into the appreciation of the local curren-cy and consequently a reduction in export and an increase in imports. This leads to a deterioration of the current account posi-tion (Bernheim 1989; Yellen 1989). Accord-ing to this theory therefore budget deficits have adverse effects on the economy and thus it advocates for a balanced budget at all times.
The Keynesian paradigm differs from the neoclassical paradigm in that, it assumes the existence of unemployed resources and the existence of credit constrained in-dividuals in the economy (Bernheim, 1989). The Keynesians theory indicates that, an in-crease in government spending leads to an increase in aggregate demand, which leads to the employment of the redundant re-sources which subsequently leads to an in-
crease in output (Bernheim, 1989). This par-adigm therefore asserts that budget deficits don’t necessarily have a detrimental effect to economic growth. Budget deficits can be used to stimulate aggregate demand dur-ing periods of economic downturns thereby shortening the recovery period. The Keynes-ian view recommends that budget manage-ment should follow anti cyclical economic conditions. This implies that during periods of recession, the government should run a deficit to stimulate aggregate demand whereas during periods of economic boom government should pursue a surplus bud-getary policy.
Lastly, the Ricardian view asserts that bud-get deficits have no impact on economic growth and development. According to this theory, an increase in government debt as a result of the deficit will imply future taxes with a present value equal to the value of the debt. Therefore, rational agents should recognize this equivalence and proceed as if the debt did not exist, resulting in the debt having no effects on economic activity (Seater, 1993; Bernheim, 1989).
2.2 Empirical Literature
In the empirical literature, the popular ex-position is that budget deficits are infla-tionary. Various studies have explored the causal relationship between budget deficits and inflation. The results have been invari-ably mixed. Catão and Terrones (2005) find a strong link between fiscal deficits and in-flation using a sample of 107 countries over the period 1960 to 2001. Their results show that, a 1 percent reduction in the ratio of the budget deficit to GDP is associated with an 8.75 percent lower inflation rate. Lin and Chu (2013) employ a dynamic panel quan-tile regression (DPQR) regression models
7ECONOMIC POLICY RESEARCH CENTRE - EPRC
Macroeconomic Effects of Budget Deficits in Uganda: A VAR-VECM Approach
following the ARDL regime to examine the extent to which fiscal deficits are inflation-ary in 91 countries between 1960 and 2006. Their findings show that fiscal deficits are inflationary only in high inflation countries. This finding is consistent with earlier work by De Haan and Zelhosrt (1990). Easterly and Schmidt-Hebbel (1993), analyse data from a sample of 10 countries and find strong evi-dence that over the medium term, money financing of the deficit leads to higher infla-tion, while debt financing leads to higher real interest rates or increased repression of financial markets. Makochekanwa (2008), finds a significant positive impact of budget deficit on inflation in Zimbabwe for the peri-od 1980 to 2005. He also finds a stable long run relationship between the budget deficit, exchange rate, GDP and inflation.
On the other hand, Ndashau (2012) uses Granger causality techniques, augmented by vector error correction modelling, to highlight the existence of a causality effect from inflation to budget deficits scaled by the money base. However, the effect of bud-get deficits on inflation was not statistically significant. Georgantopoulos and Tsamis, (2011), investigate the casual link between budget deficit and other macroeconomic variables (Consumer Price Index (CPI), Gross Domestic Product (GDP) and Nominal Effec-tive Exchange Rate) for Greece during the period 1980-2009. Their findings reveal no link between the budget deficit and CPI but they find casual links between budget defi-cit and GDP and Nominal Effective Exchange Rate.
Mugume and Obwona (1998) examined the interaction between fiscal deficits and other macro-level variables for Uganda in the post reform period. Their results show
that the unsustainability of the budget defi-cit has implications for public, external and monetary sectors. In particular, they found a negative relationship between fiscal defi-cits and economic growth. Also they reveal that fiscal deficit is linked to inflation, ex-change rate depreciation and the widening of current account deficit. On the other, Odhiambo et al. (2013), find a positive re-lationship between budget deficits and eco-nomic growth in Kenya for the period 1970 to 2007. Buscemi and Yallwe, (2012) using GMM technique, find that fiscal deficit re-sults are significant and positively correlated to economic growth and saving in China, In-dia and South Africa. However, the authors reveal that real interest rates are negatively and significantly correlated with economic growth and saving. The main conclusion by the authors is that, fiscal deficit affects the economic growth and saving through the means financing the deficit. Addition-ally, Keho (2010), investigates the causal relationship between budget deficits and economic growth for seven West African countries over the period 1980-2005. The author finds mixed results1 with three out of the seven countries showing no evidence of causality, one showing a unidirectional cau-sality running from deficit to growth and the rest showing two-way causality between budget deficits and economic growth.
Basu and Datta (2005), studied the impact of the fiscal deficit on India’s external accounts since the mid-1980s. They find no evidence to support neither the twin deficit nor the Ricardian hypothesis. The twin deficit hy-pothesis asserts that a budget deficit causes
1 Benin, Burkina Faso and Mali showed no evidence of causal-ity between deficit and growth, Niger showed a unidirectional causality running from deficit to growth while Benin, Burkina Faso and Mali showed a two-way causality between deficit and growth.
8 ECONOMIC POLICY RESEARCH CENTRE - EPRC
Macroeconomic Effects of Budget Deficits in Uganda: A VAR-VECM Approach
a trade deficit/current account deficit and the Ricardian Equivalence Hypothesis (REH) that rejects any possible relationship be-tween these two deficits. They find no coin-tegration between the two deficits hence disqualifying the twin deficit hypothesis and no cointegration between the savings rate and the fiscal deficit-GDP ratio which ne-gates the REH in Indian circumstances. Also their findings show that ratios of trade defi-cit, fiscal deficit and net savings randomly maintain the national income identity and that a high fiscal deficit for the case of India has been sustained by a simultaneous and independent increase in the savings ratio. On the other hand, Akbostancı and Tunç (2002), confirm the twin deficit hypothesis using an error correction model on data from Turkey for the period 1987 to 2001. They conclude that budget deficit do affect the trade deficit. This is consisted with findings from Baharumshah, etal. (2006) who con-firm the twin deficits hypothesis for 4 ASE-AN countries (Indonesia, Malaysia, the Phil-ippines and Thailand). Baharumshah, etal. (2006) discover an indirect causal relation-ship running from budget deficit to higher interest rates, and higher interest rates lead to the appreciation of the exchange rate and this leads to the widening of current account deficit. Brownbridge and Mutebile (2007) analyse the impact of an increase in the fis-cal deficit on macroeconomic policy man-agement and the fiscal sustainability. They argue that aid funded deficits may have ef-fects akin to the Dutch disease through the appreciation of the exchange rate with ad-verse effects for export sector competitive-ness. Vuyyuri and Seshaiah (2004), study the interaction of budget deficit with other macroeconomic variables (Nominal effec-tive exchange rate, GDP, Consumer Price Index and money supply) for India, using
Cointegration approach and Variance Error Correction Models (VECM) for the period 1970-2002. They find the variables to be cointegrated. Also they find a bi-directional causality between budget deficit and nomi-nal effective exchange rates. But they find no significant relationship between budget deficit and GDP, Money supply & consumer price index. They also observe that the GDP Granger causes budget deficit.
Aisen and Hauner (2008), find a significant and positive relationship between budget deficits and interest rates using a panel da-taset of 60 advanced and emerging econo-mies. They also find that the effects of bud-get deficits on interest rates varied by coun-try group and period. Their findings show that the effects were larger and more robust in the emerging markets and in later periods than in the advanced economies and in ear-lier periods. They further found that the ef-fect of budget deficits on interest rates de-pends on interaction terms and is only sig-nificant under one of several conditions such as if one size of the deficits, source of deficit financing (mostly domestically financed), or interact with high domestic debt; financial openness is low; interest rates are liberal-ized; or financial depth is low. Uwilingiye and Gupta, (2007), investigate the direction of temporal causality between budget defi-cit and interest rate for South Africa using quarterly and annual data for the period of 1961 to 2005, find that budget deficit Granger causes interest rate in the quarter-ly data. However, for the annual data, they find no causal relationship between the budget deficit and the Treasury bill rate. The two variables are positively cointegrated for both data frequency. Similarly Bonga-Bonga (2011), investigates the extent of the effects of the systematic and surprise changes in
9ECONOMIC POLICY RESEARCH CENTRE - EPRC
Macroeconomic Effects of Budget Deficits in Uganda: A VAR-VECM Approach
budget deficits on the long-term interest rate in South Africa using vector autoregres-sive (VAR) techniques. He finds a positive re-lationship between the budget deficits and long-term interest rates. On the other hand, Akinboade (2004), using the LSE approach and Granger-causality methods, finds no re-lationship between the budget deficit and interest rates in South Africa.
In conclusion, the review of empirical lit-erature on the relationship between bud-get/fiscal deficits and other macroeco-nomic variables gives quite mixed results with some studies showing no relationship between budget deficits and other macro-economic variable, some confirming that indeed budget deficits affect all or some macroeconomic variable and not others. This emphasizes the discussion in section 1 which pointed out that the effects of bud-get deficits on the economy depend on the financing source and the expenditure patterns. This implies that the relationship between budget deficits and other macro-economic variables is case/country specific and depends on a number of conditions like source of deficit financing and expenditure pattern, size of the deficit etc.
3.0. METHODOLOGY, DATA AND EMPIRICAL MODEL
3.1 Methodology
In modelling the relationship between bud-get deficits and the macro - economy, we follow the seminal work of Bernheim (1989) who considered and critiqued three theo-ries, namely: the neoclassical theory, the Keynesian and the Ricardian theory noted earlier. Generally, economic theory pro-vides two alternative hypotheses that can
explain the relationship between budget deficits and the economy. First, the twin deficit hypothesis that asserts that a bud-get deficit causes a trade deficit/current ac-count deficit. Secondly the Ricardian Equiv-alence Hypothesis (REH), which rejects any possible relation between these two deficits (Suparna and Debabrata, 2005). The twin deficit hypothesis can be derived from the National accounting identity of an open economy given by the following ex-pression.
)( MXGICY −+++= (1)
From equation 1, Y represents National In-come or GDP, I is investment, C is private consumption, G is government spending and X-M stands for net exports (exports minus imports). In the case of a closed economy the National accounting model is defined by the following expression.
TSCY ++= (2)
From equation 2, Y represents National In-come or GDP, C is private consumption, S is savings, and T is taxes.
To model the relationship between budget deficits and selected macroeconomic vari-able, we proceed by subtracting equation 1 from 2, which yields equation 3 given as;
)()()( MXGTIS −=−+− (3)
From equation 3, assuming an economy is already at optimum output where Y is fixed, this implies that if the deficit (T-G) increases, and savings (S) remains the same, then ei-ther investment (I) must fall (crowding out effect), or net exports (X-M) must fall, which will cause a trade deficit. From equation 3 it
10 ECONOMIC POLICY RESEARCH CENTRE - EPRC
Macroeconomic Effects of Budget Deficits in Uganda: A VAR-VECM Approach
can be observed that that effect of the deficit will depend on the source of financing i.e., if the deficit is financed by external sources, the current account balance will deteriorate and if its financed domestically it may cause a crowding out effect in an economy at or near full employment.
Following the Keynesian theory, an increase in budget deficit could lead to an increase in output and, therefore, an increase in in-come. Increased incomes could increase the demand for imports thereby creating or widening the trade balance. Further still, the deterioration of the current account balance could manifest from an increase in interest rates resulting to fiscal deficit by raising the level of aggregate demand. An increase in domestic interest could induce an increase in capital inflow resulting into the apprecia-tion of the domestic currency. The apprecia-tion of the exchange rate will have adverse effect on the exports thereby affecting the current account balance. On the other hand, the Ricardian equivalence Hypothesis (REH) rejects the twin deficit hypothesis and as-serts that there is no causal link between fis-cal deficit and the current account deficits.
Following Catão and Terrones (2005) we posit that government spending, G, is fi-nanced by the extent of domestic tax collec-tion, T, such that
tt TG = (4)
Equation 4 assumes that Governments run balanced budgets. In reality, however, gov-ernment tax revenues quite often may not be sufficient to finance Government expen-diture as is the case in Uganda. In such cir-cumstances, government expenditure may be financed by issuance of bonds (B), reduc-
tion of international asset holdings (A) or by printing money (M). Governments also receive grants, but these are excluded from our discussion because they are usually not reliable as they are granted on the basis of donor discretion.
ttttt MABTG ++=− (5)
Equation 5 can be modified, following the work of Catão and Terrones (2005) who modelled the Government budget deficit as
tt
ttt
Gtt
t
Gt A
PMMGBT
RB
+−
+−+= ++ 1*1
(6)
In Equation 5 above, GtB is Government net
assets at time t, tM is the currency in circu-lation, tT is tax revenue, tG is Government expenditure and R* is the international real Interest rate.
Re-arranging the equation above yields the budget deficit defined by equation 7 below
tt
ttGt
t
Gt
tt AP
MMB
RB
TG +−
+=+− ++ 1*1 (7)
The left hand side of Equation 7 is the total government deficit and it includes the bud-get deficit tt TG − and the real net Govern-ment assets. The right hand side comprises the means of financing the budget deficit that include Government debt instruments such as bonds
GtB , real money supply,
t
tt
PMM −+1 and
reserves, tA .
Equation 7 above can be expressed as a gen-eral equation in 8 below:
),,( ttGttt AMBfTG =− (8)
11ECONOMIC POLICY RESEARCH CENTRE - EPRC
Macroeconomic Effects of Budget Deficits in Uganda: A VAR-VECM Approach
If we express equation 8 above in a VAR framework we can allow budget deficits to influence and be influenced by other mac-roeconomic variables. This study expands this theoretical framework using a VECM approach to investigate the relationship be-tween fiscal deficits, inflation, lending rates, current account balance and Gross Domes-tic Product, and investigate the general rela-tionship using the following expression.
(9
3.2. The Empirical Model
We adopt an econometric methodology (Vector Error Model (VECM)), similar to one used by Georgantopoulos and Tsamis (2011) and Vuyyuri and Sesahiah (2004) when in-vestigating the Macroeconomic Effects of Budget Deficits in Greece and India re-spectively. We are interested in finding out whether a long-run relationship exists be-tween budget deficits the macroeconomic variables.
The VAR model is specified below,
(10)
From Equation 10, LBD is the natural log of Budget Deficit, LCAB is the natural log of Current Account Balance, LLIR is the natu-ral log of Lending Interest Rates, INFLATION represents Inflation and LGDP is the natural log of Gross Domestic Product.
We then estimate the Vector Error Correc-tion Model (VECM) for all the endogenous
variables in the model and use it to carry out tests such as Granger causality tests over the short and long run.
The VECM estimated equation is as follows,
(11)
From Equation 11, is a vector of exogenous variable (intercept).
3.2 Empirical Strategy
We start by determining the stationar-ity properties of the univariate time series to avoid spurious regressions. We use the Augmented Dickey-Fuller (ADF) (Dickey and Fuller, 1979) and the Phillip Perron (PP) tests to test for unit roots of the time series variables.
Once we have determined that the variables are non-stationary and are integrated of or-der 1 {I(1)} we then examine the time series for co-integration using the Johansen (1988) cointegration test. Cointegration analysis helps to identify long-run economic relation-ships between the variables. We then use the FPE: Final prediction error, AIC: Akaike information criterion, SC: Schwarz informa-tion criterion and the HQ: Hannan-Quinn information criterion criteria to determine the number of lags in the cointegration test (order of VAR) and then use the trace and maximal eigenvalue tests to determine the number of cointegrating vectors present. We then estimate the Vector Error Correc-tion Model (VECM) for all the endogenous
12 ECONOMIC POLICY RESEARCH CENTRE - EPRC
Macroeconomic Effects of Budget Deficits in Uganda: A VAR-VECM Approach
variables in the model and use it to carry out tests such as Granger causality tests over the short and long run.
Furthermore, we carry out pairwise granger causality and variance decomposition tests to further understand the interactions of the variables.
3.3 Data and Time Series Properties
This study employs quarterly data for the period 1999 to 2011. Fiscal Deficit (BD) data is obtained from the Ministry of Finance Planning and Economic Development (MoF-PED). Current account deficit (CAB), Infla-tion (INFLATION), Lending Interest Rates (LIR) statistics are obtained from the Bank of Uganda and Gross Domestic Product (GDP) figures are obtained from the Uganda Bu-reau of Statistics (Annex 1). The data in con-verted into natural logarithms.
From the summary statistics we note that the means of the variables are close to one another and the differences between the minimum and maximum values also appear to be very small affirming these small varia-tions. Most of the variables are not normally distributed, with Skewness below 1 and Kur-tosis is less than 3 (Annex 2).
Time series plots of level variables, reveal that over time the fiscal deficit has been widening, INFLATION, and LGDP generally exhibits upward trends, lending interest rates are generally stable, while the current account has been widening. LBD exhibits a widening trend implying that over time gov-ernment expenditure has been increasingly exceeding government revenue (Annex 3). Annex 4 shows the correlation matrix be-tween the variables with LBD being nega-
tively correlated with LLIR and positively correlated with INFLATION, LCAB and GDP.
4.0 RESULTS AND DISCUSSION
This section presents both the descriptive and empirical findings of the study. Table 1 presents the estimates of the Augmented Dickey – Fuller (ADF) and the Phillip-Perron (PP) tests in levels and in first differences of the data without an intercept or trend, with an intercept and trend, and with an inter-cept. The tests have been performed on the basis of 5 percent significance level, using the McKinnon Critical Values. Results show that at 1st differences all series are consis-tently stationary but at levels there a mixed pattern arises.
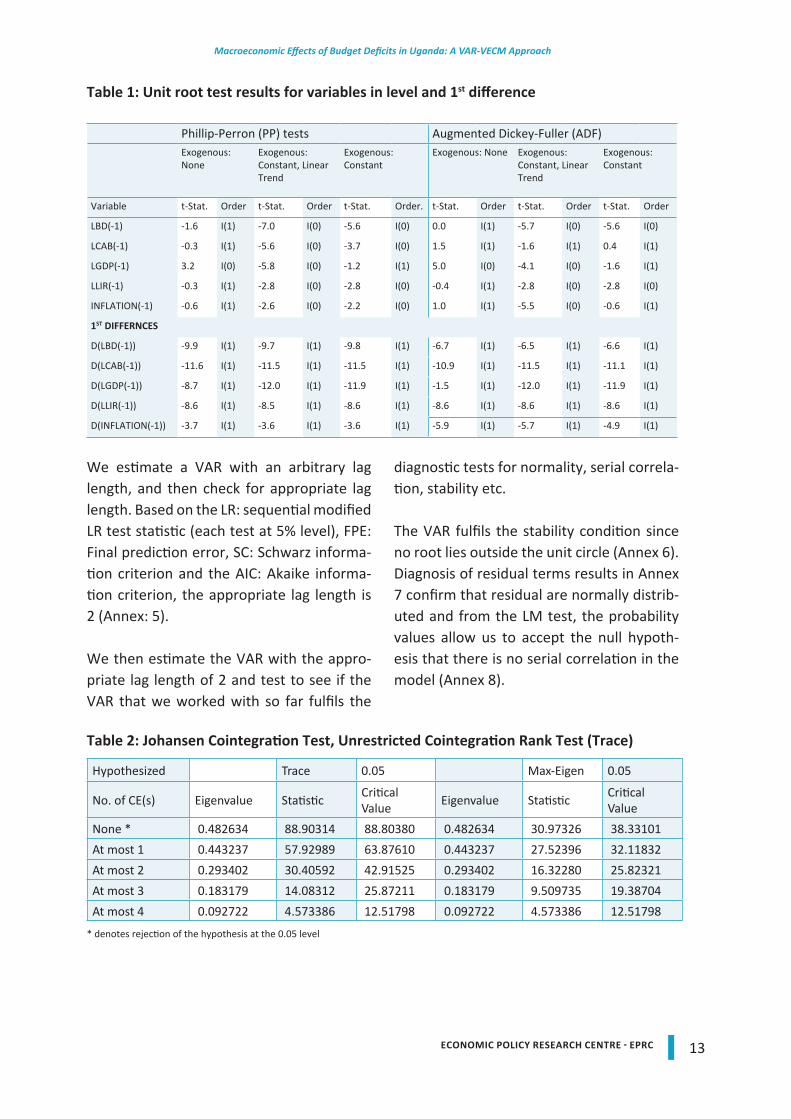
13ECONOMIC POLICY RESEARCH CENTRE - EPRC
Macroeconomic Effects of Budget Deficits in Uganda: A VAR-VECM Approach
Table 1: Unit root test results for variables in level and 1st difference
Phillip-Perron (PP) tests Augmented Dickey-Fuller (ADF)Exogenous: None
Exogenous: Constant, Linear Trend
Exogenous: Constant
Exogenous: None Exogenous: Constant, Linear Trend
Exogenous: Constant
Variable t-Stat. Order t-Stat. Order t-Stat. Order. t-Stat. Order t-Stat. Order t-Stat. Order
LBD(-1) -1.6 I(1) -7.0 I(0) -5.6 I(0) 0.0 I(1) -5.7 I(0) -5.6 I(0)
LCAB(-1) -0.3 I(1) -5.6 I(0) -3.7 I(0) 1.5 I(1) -1.6 I(1) 0.4 I(1)
LGDP(-1) 3.2 I(0) -5.8 I(0) -1.2 I(1) 5.0 I(0) -4.1 I(0) -1.6 I(1)
LLIR(-1) -0.3 I(1) -2.8 I(0) -2.8 I(0) -0.4 I(1) -2.8 I(0) -2.8 I(0)
INFLATION(-1) -0.6 I(1) -2.6 I(0) -2.2 I(0) 1.0 I(1) -5.5 I(0) -0.6 I(1)
1ST DIFFERNCES
D(LBD(-1)) -9.9 I(1) -9.7 I(1) -9.8 I(1) -6.7 I(1) -6.5 I(1) -6.6 I(1)
D(LCAB(-1)) -11.6 I(1) -11.5 I(1) -11.5 I(1) -10.9 I(1) -11.5 I(1) -11.1 I(1)
D(LGDP(-1)) -8.7 I(1) -12.0 I(1) -11.9 I(1) -1.5 I(1) -12.0 I(1) -11.9 I(1)
D(LLIR(-1)) -8.6 I(1) -8.5 I(1) -8.6 I(1) -8.6 I(1) -8.6 I(1) -8.6 I(1)
D(INFLATION(-1)) -3.7 I(1) -3.6 I(1) -3.6 I(1) -5.9 I(1) -5.7 I(1) -4.9 I(1)
We estimate a VAR with an arbitrary lag length, and then check for appropriate lag length. Based on the LR: sequential modified LR test statistic (each test at 5% level), FPE: Final prediction error, SC: Schwarz informa-tion criterion and the AIC: Akaike informa-tion criterion, the appropriate lag length is 2 (Annex: 5).
We then estimate the VAR with the appro-priate lag length of 2 and test to see if the VAR that we worked with so far fulfils the
diagnostic tests for normality, serial correla-tion, stability etc.
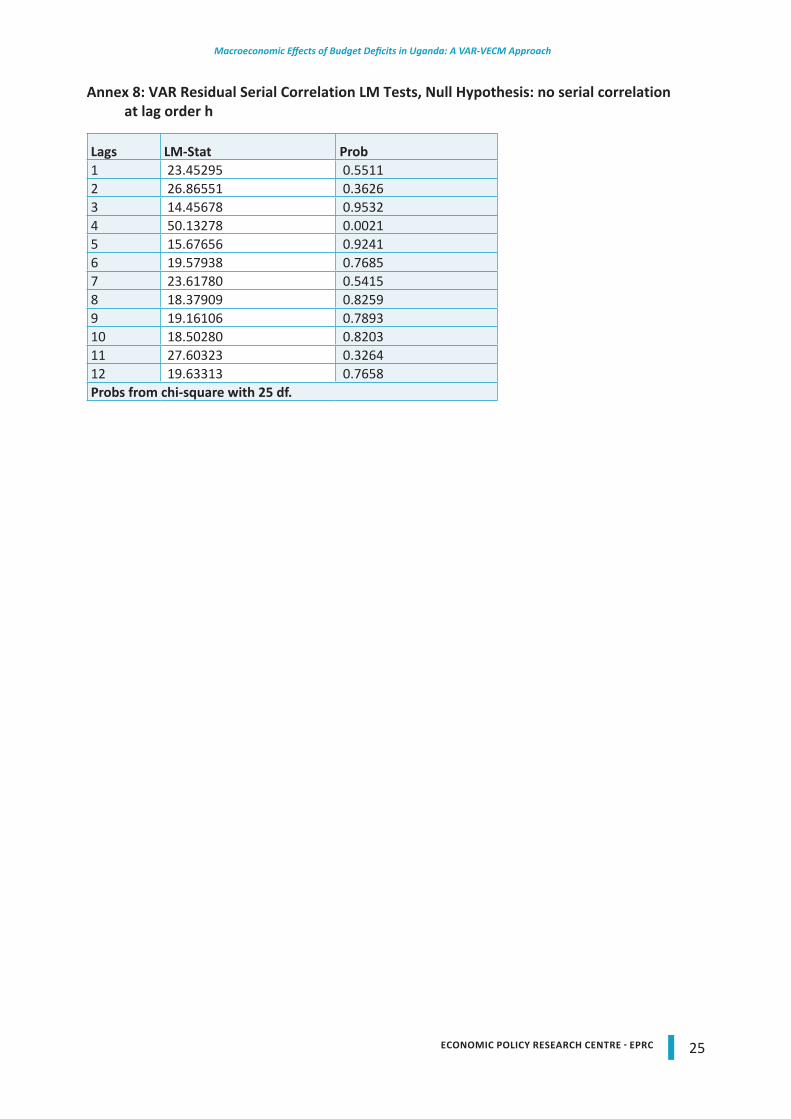
The VAR fulfils the stability condition since no root lies outside the unit circle (Annex 6). Diagnosis of residual terms results in Annex 7 confirm that residual are normally distrib-uted and from the LM test, the probability values allow us to accept the null hypoth-esis that there is no serial correlation in the model (Annex 8).
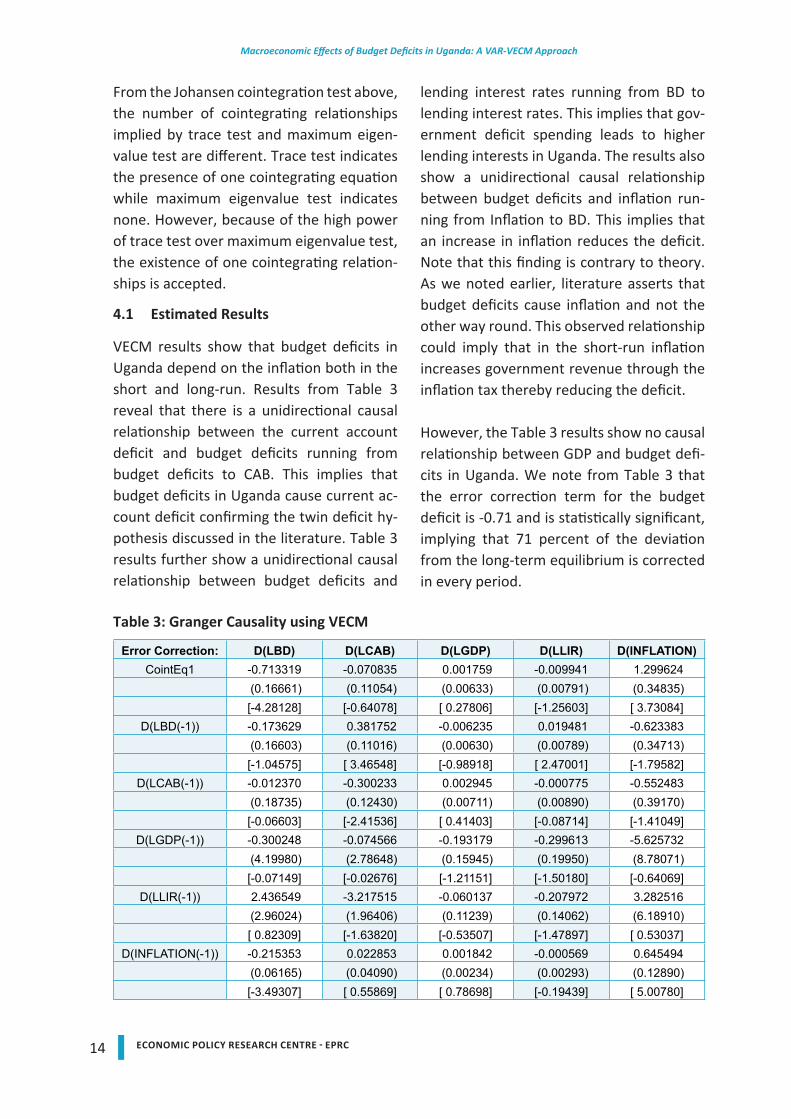
Table 2: Johansen Cointegration Test, Unrestricted Cointegration Rank Test (Trace)
Hypothesized Trace 0.05 Max-Eigen 0.05
No. of CE(s) Eigenvalue Statistic Critical Value Eigenvalue Statistic Critical
ValueNone * 0.482634 88.90314 88.80380 0.482634 30.97326 38.33101At most 1 0.443237 57.92989 63.87610 0.443237 27.52396 32.11832At most 2 0.293402 30.40592 42.91525 0.293402 16.32280 25.82321At most 3 0.183179 14.08312 25.87211 0.183179 9.509735 19.38704At most 4 0.092722 4.573386 12.51798 0.092722 4.573386 12.51798
* denotes rejection of the hypothesis at the 0.05 level
14 ECONOMIC POLICY RESEARCH CENTRE - EPRC
Macroeconomic Effects of Budget Deficits in Uganda: A VAR-VECM Approach
From the Johansen cointegration test above, the number of cointegrating relationships implied by trace test and maximum eigen-value test are different. Trace test indicates the presence of one cointegrating equation while maximum eigenvalue test indicates none. However, because of the high power of trace test over maximum eigenvalue test, the existence of one cointegrating relation-ships is accepted.
4.1 Estimated Results
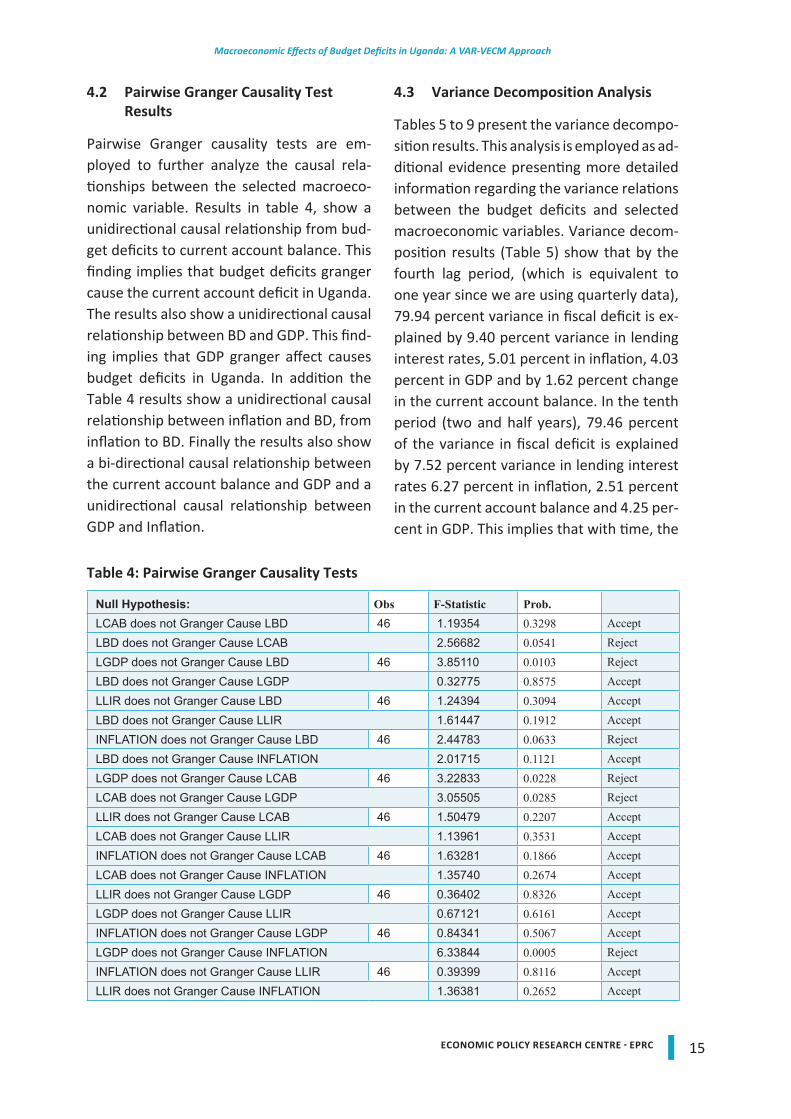
VECM results show that budget deficits in Uganda depend on the inflation both in the short and long-run. Results from Table 3 reveal that there is a unidirectional causal relationship between the current account deficit and budget deficits running from budget deficits to CAB. This implies that budget deficits in Uganda cause current ac-count deficit confirming the twin deficit hy-pothesis discussed in the literature. Table 3 results further show a unidirectional causal relationship between budget deficits and
lending interest rates running from BD to lending interest rates. This implies that gov-ernment deficit spending leads to higher lending interests in Uganda. The results also show a unidirectional causal relationship between budget deficits and inflation run-ning from Inflation to BD. This implies that an increase in inflation reduces the deficit. Note that this finding is contrary to theory. As we noted earlier, literature asserts that budget deficits cause inflation and not the other way round. This observed relationship could imply that in the short-run inflation increases government revenue through the inflation tax thereby reducing the deficit.
However, the Table 3 results show no causal relationship between GDP and budget defi-cits in Uganda. We note from Table 3 that the error correction term for the budget deficit is -0.71 and is statistically significant, implying that 71 percent of the deviation from the long-term equilibrium is corrected in every period.
Table 3: Granger Causality using VECM
Error Correction: D(LBD) D(LCAB) D(LGDP) D(LLIR) D(INFLATION)CointEq1 -0.713319 -0.070835 0.001759 -0.009941 1.299624
(0.16661) (0.11054) (0.00633) (0.00791) (0.34835)[-4.28128] [-0.64078] [ 0.27806] [-1.25603] [ 3.73084]
D(LBD(-1)) -0.173629 0.381752 -0.006235 0.019481 -0.623383 (0.16603) (0.11016) (0.00630) (0.00789) (0.34713)[-1.04575] [ 3.46548] [-0.98918] [ 2.47001] [-1.79582]
D(LCAB(-1)) -0.012370 -0.300233 0.002945 -0.000775 -0.552483 (0.18735) (0.12430) (0.00711) (0.00890) (0.39170)[-0.06603] [-2.41536] [ 0.41403] [-0.08714] [-1.41049]
D(LGDP(-1)) -0.300248 -0.074566 -0.193179 -0.299613 -5.625732 (4.19980) (2.78648) (0.15945) (0.19950) (8.78071)[-0.07149] [-0.02676] [-1.21151] [-1.50180] [-0.64069]
D(LLIR(-1)) 2.436549 -3.217515 -0.060137 -0.207972 3.282516 (2.96024) (1.96406) (0.11239) (0.14062) (6.18910)[ 0.82309] [-1.63820] [-0.53507] [-1.47897] [ 0.53037]
D(INFLATION(-1)) -0.215353 0.022853 0.001842 -0.000569 0.645494 (0.06165) (0.04090) (0.00234) (0.00293) (0.12890)[-3.49307] [ 0.55869] [ 0.78698] [-0.19439] [ 5.00780]
15ECONOMIC POLICY RESEARCH CENTRE - EPRC
Macroeconomic Effects of Budget Deficits in Uganda: A VAR-VECM Approach
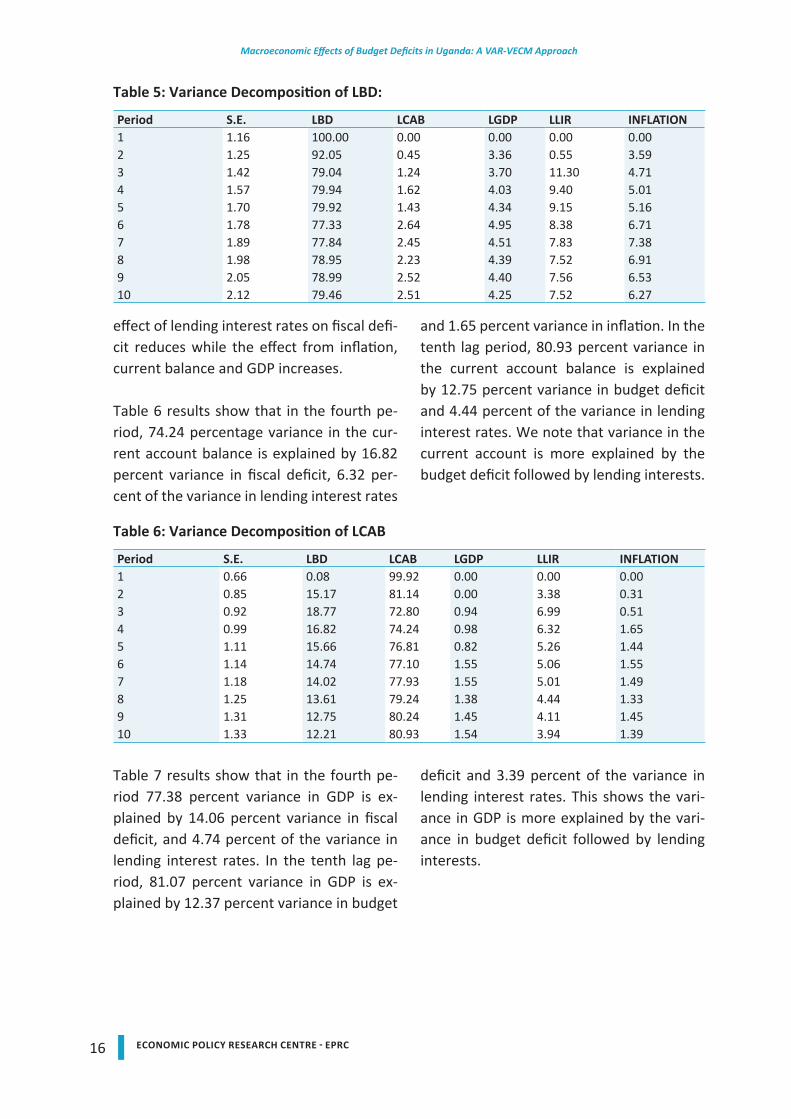
4.2 Pairwise Granger Causality Test Results
Pairwise Granger causality tests are em-ployed to further analyze the causal rela-tionships between the selected macroeco-nomic variable. Results in table 4, show a unidirectional causal relationship from bud-get deficits to current account balance. This finding implies that budget deficits granger cause the current account deficit in Uganda. The results also show a unidirectional causal relationship between BD and GDP. This find-ing implies that GDP granger affect causes budget deficits in Uganda. In addition the Table 4 results show a unidirectional causal relationship between inflation and BD, from inflation to BD. Finally the results also show a bi-directional causal relationship between the current account balance and GDP and a unidirectional causal relationship between GDP and Inflation.
4.3 Variance Decomposition Analysis
Tables 5 to 9 present the variance decompo-sition results. This analysis is employed as ad-ditional evidence presenting more detailed information regarding the variance relations between the budget deficits and selected macroeconomic variables. Variance decom-position results (Table 5) show that by the fourth lag period, (which is equivalent to one year since we are using quarterly data), 79.94 percent variance in fiscal deficit is ex-plained by 9.40 percent variance in lending interest rates, 5.01 percent in inflation, 4.03 percent in GDP and by 1.62 percent change in the current account balance. In the tenth period (two and half years), 79.46 percent of the variance in fiscal deficit is explained by 7.52 percent variance in lending interest rates 6.27 percent in inflation, 2.51 percent in the current account balance and 4.25 per-cent in GDP. This implies that with time, the
Table 4: Pairwise Granger Causality Tests
Null Hypothesis: Obs F-Statistic Prob. LCAB does not Granger Cause LBD 46 1.19354 0.3298 Accept
LBD does not Granger Cause LCAB 2.56682 0.0541 Reject
LGDP does not Granger Cause LBD 46 3.85110 0.0103 Reject
LBD does not Granger Cause LGDP 0.32775 0.8575 Accept
LLIR does not Granger Cause LBD 46 1.24394 0.3094 Accept
LBD does not Granger Cause LLIR 1.61447 0.1912 Accept
INFLATION does not Granger Cause LBD 46 2.44783 0.0633 Reject
LBD does not Granger Cause INFLATION 2.01715 0.1121 Accept
LGDP does not Granger Cause LCAB 46 3.22833 0.0228 Reject
LCAB does not Granger Cause LGDP 3.05505 0.0285 Reject
LLIR does not Granger Cause LCAB 46 1.50479 0.2207 Accept
LCAB does not Granger Cause LLIR 1.13961 0.3531 Accept
INFLATION does not Granger Cause LCAB 46 1.63281 0.1866 Accept
LCAB does not Granger Cause INFLATION 1.35740 0.2674 Accept
LLIR does not Granger Cause LGDP 46 0.36402 0.8326 Accept
LGDP does not Granger Cause LLIR 0.67121 0.6161 Accept
INFLATION does not Granger Cause LGDP 46 0.84341 0.5067 Accept
LGDP does not Granger Cause INFLATION 6.33844 0.0005 Reject
INFLATION does not Granger Cause LLIR 46 0.39399 0.8116 Accept
LLIR does not Granger Cause INFLATION 1.36381 0.2652 Accept
16 ECONOMIC POLICY RESEARCH CENTRE - EPRC
Macroeconomic Effects of Budget Deficits in Uganda: A VAR-VECM Approach
effect of lending interest rates on fiscal defi-cit reduces while the effect from inflation, current balance and GDP increases.
Table 6 results show that in the fourth pe-riod, 74.24 percentage variance in the cur-rent account balance is explained by 16.82 percent variance in fiscal deficit, 6.32 per-cent of the variance in lending interest rates
and 1.65 percent variance in inflation. In the tenth lag period, 80.93 percent variance in the current account balance is explained by 12.75 percent variance in budget deficit and 4.44 percent of the variance in lending interest rates. We note that variance in the current account is more explained by the budget deficit followed by lending interests.
Table 5: Variance Decomposition of LBD:
Period S.E. LBD LCAB LGDP LLIR INFLATION1 1.16 100.00 0.00 0.00 0.00 0.002 1.25 92.05 0.45 3.36 0.55 3.593 1.42 79.04 1.24 3.70 11.30 4.714 1.57 79.94 1.62 4.03 9.40 5.015 1.70 79.92 1.43 4.34 9.15 5.166 1.78 77.33 2.64 4.95 8.38 6.717 1.89 77.84 2.45 4.51 7.83 7.388 1.98 78.95 2.23 4.39 7.52 6.919 2.05 78.99 2.52 4.40 7.56 6.5310 2.12 79.46 2.51 4.25 7.52 6.27
Table 6: Variance Decomposition of LCAB
Period S.E. LBD LCAB LGDP LLIR INFLATION1 0.66 0.08 99.92 0.00 0.00 0.002 0.85 15.17 81.14 0.00 3.38 0.313 0.92 18.77 72.80 0.94 6.99 0.514 0.99 16.82 74.24 0.98 6.32 1.655 1.11 15.66 76.81 0.82 5.26 1.446 1.14 14.74 77.10 1.55 5.06 1.557 1.18 14.02 77.93 1.55 5.01 1.498 1.25 13.61 79.24 1.38 4.44 1.339 1.31 12.75 80.24 1.45 4.11 1.4510 1.33 12.21 80.93 1.54 3.94 1.39
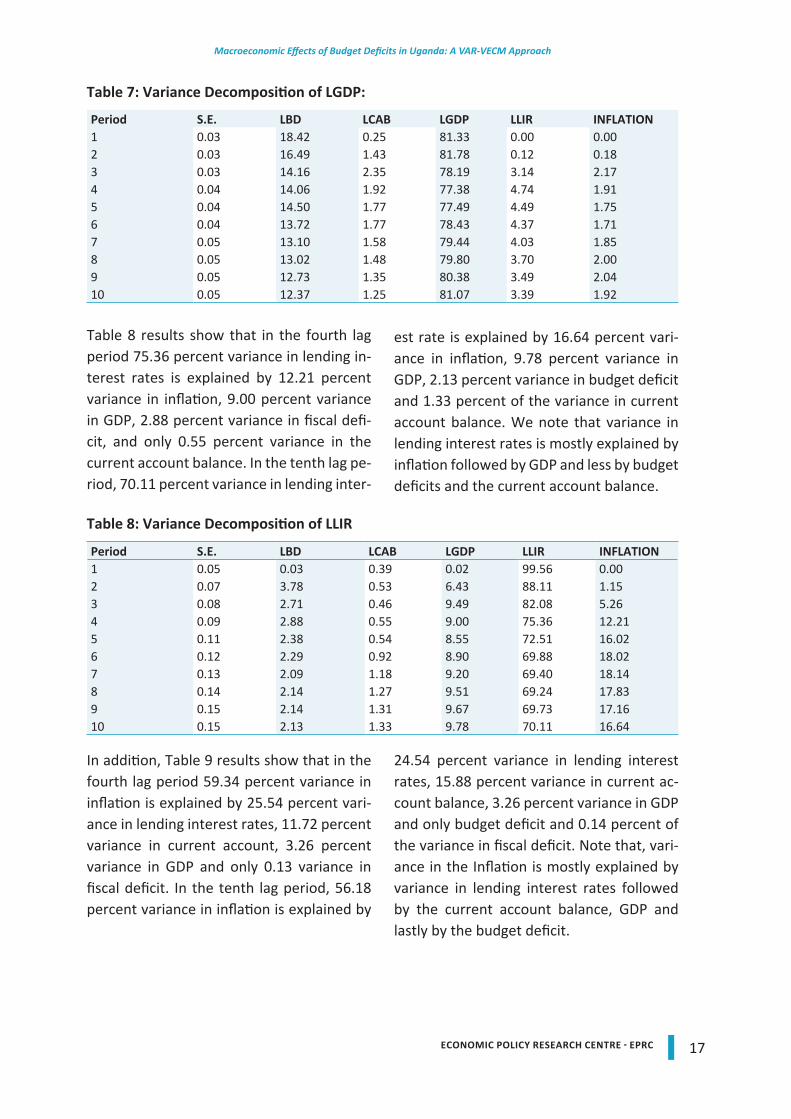
Table 7 results show that in the fourth pe-riod 77.38 percent variance in GDP is ex-plained by 14.06 percent variance in fiscal deficit, and 4.74 percent of the variance in lending interest rates. In the tenth lag pe-riod, 81.07 percent variance in GDP is ex-plained by 12.37 percent variance in budget
deficit and 3.39 percent of the variance in lending interest rates. This shows the vari-ance in GDP is more explained by the vari-ance in budget deficit followed by lending interests.
17ECONOMIC POLICY RESEARCH CENTRE - EPRC
Macroeconomic Effects of Budget Deficits in Uganda: A VAR-VECM Approach
Table 7: Variance Decomposition of LGDP:
Period S.E. LBD LCAB LGDP LLIR INFLATION1 0.03 18.42 0.25 81.33 0.00 0.002 0.03 16.49 1.43 81.78 0.12 0.183 0.03 14.16 2.35 78.19 3.14 2.174 0.04 14.06 1.92 77.38 4.74 1.915 0.04 14.50 1.77 77.49 4.49 1.756 0.04 13.72 1.77 78.43 4.37 1.717 0.05 13.10 1.58 79.44 4.03 1.858 0.05 13.02 1.48 79.80 3.70 2.009 0.05 12.73 1.35 80.38 3.49 2.0410 0.05 12.37 1.25 81.07 3.39 1.92
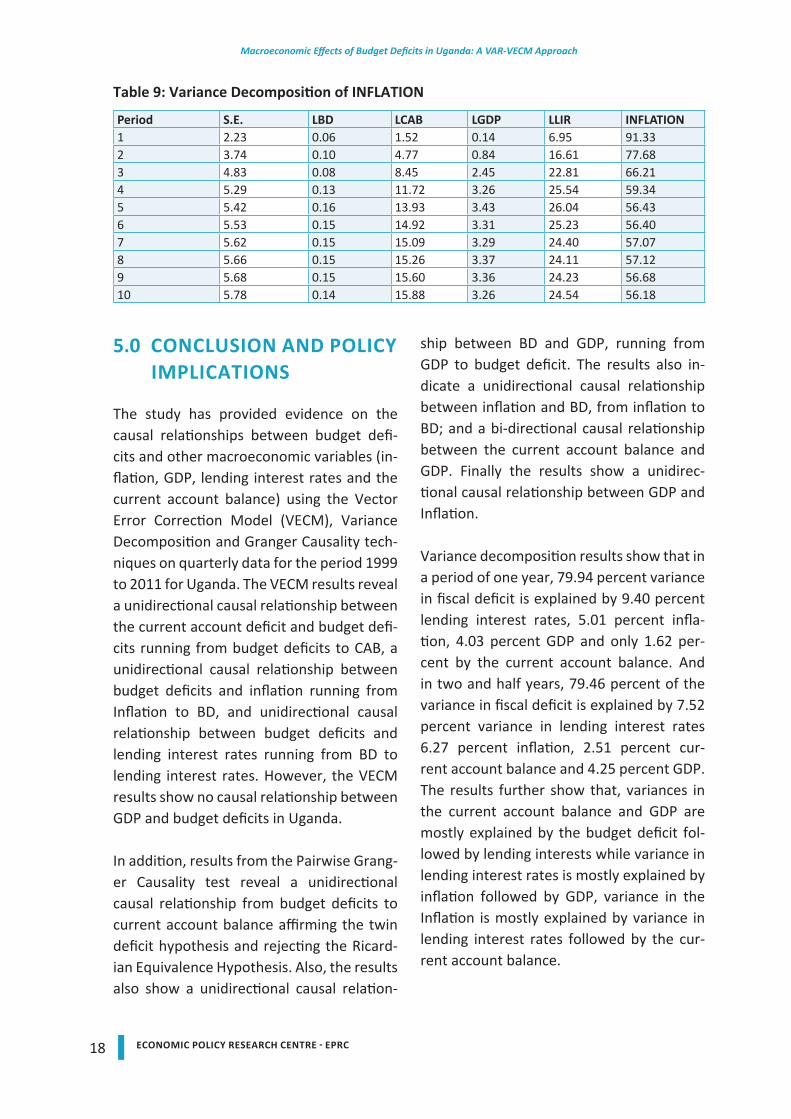
Table 8 results show that in the fourth lag period 75.36 percent variance in lending in-terest rates is explained by 12.21 percent variance in inflation, 9.00 percent variance in GDP, 2.88 percent variance in fiscal defi-cit, and only 0.55 percent variance in the current account balance. In the tenth lag pe-riod, 70.11 percent variance in lending inter-
est rate is explained by 16.64 percent vari-ance in inflation, 9.78 percent variance in GDP, 2.13 percent variance in budget deficit and 1.33 percent of the variance in current account balance. We note that variance in lending interest rates is mostly explained by inflation followed by GDP and less by budget deficits and the current account balance.
Table 8: Variance Decomposition of LLIR
Period S.E. LBD LCAB LGDP LLIR INFLATION1 0.05 0.03 0.39 0.02 99.56 0.002 0.07 3.78 0.53 6.43 88.11 1.153 0.08 2.71 0.46 9.49 82.08 5.264 0.09 2.88 0.55 9.00 75.36 12.215 0.11 2.38 0.54 8.55 72.51 16.026 0.12 2.29 0.92 8.90 69.88 18.027 0.13 2.09 1.18 9.20 69.40 18.148 0.14 2.14 1.27 9.51 69.24 17.839 0.15 2.14 1.31 9.67 69.73 17.1610 0.15 2.13 1.33 9.78 70.11 16.64
In addition, Table 9 results show that in the fourth lag period 59.34 percent variance in inflation is explained by 25.54 percent vari-ance in lending interest rates, 11.72 percent variance in current account, 3.26 percent variance in GDP and only 0.13 variance in fiscal deficit. In the tenth lag period, 56.18 percent variance in inflation is explained by
24.54 percent variance in lending interest rates, 15.88 percent variance in current ac-count balance, 3.26 percent variance in GDP and only budget deficit and 0.14 percent of the variance in fiscal deficit. Note that, vari-ance in the Inflation is mostly explained by variance in lending interest rates followed by the current account balance, GDP and lastly by the budget deficit.
18 ECONOMIC POLICY RESEARCH CENTRE - EPRC
Macroeconomic Effects of Budget Deficits in Uganda: A VAR-VECM Approach
5.0 CONCLUSION AND POLICY IMPLICATIONS
The study has provided evidence on the causal relationships between budget defi-cits and other macroeconomic variables (in-flation, GDP, lending interest rates and the current account balance) using the Vector Error Correction Model (VECM), Variance Decomposition and Granger Causality tech-niques on quarterly data for the period 1999 to 2011 for Uganda. The VECM results reveal a unidirectional causal relationship between the current account deficit and budget defi-cits running from budget deficits to CAB, a unidirectional causal relationship between budget deficits and inflation running from Inflation to BD, and unidirectional causal relationship between budget deficits and lending interest rates running from BD to lending interest rates. However, the VECM results show no causal relationship between GDP and budget deficits in Uganda.
In addition, results from the Pairwise Grang-er Causality test reveal a unidirectional causal relationship from budget deficits to current account balance affirming the twin deficit hypothesis and rejecting the Ricard-ian Equivalence Hypothesis. Also, the results also show a unidirectional causal relation-
ship between BD and GDP, running from GDP to budget deficit. The results also in-dicate a unidirectional causal relationship between inflation and BD, from inflation to BD; and a bi-directional causal relationship between the current account balance and GDP. Finally the results show a unidirec-tional causal relationship between GDP and Inflation.
Variance decomposition results show that in a period of one year, 79.94 percent variance in fiscal deficit is explained by 9.40 percent lending interest rates, 5.01 percent infla-tion, 4.03 percent GDP and only 1.62 per-cent by the current account balance. And in two and half years, 79.46 percent of the variance in fiscal deficit is explained by 7.52 percent variance in lending interest rates 6.27 percent inflation, 2.51 percent cur-rent account balance and 4.25 percent GDP. The results further show that, variances in the current account balance and GDP are mostly explained by the budget deficit fol-lowed by lending interests while variance in lending interest rates is mostly explained by inflation followed by GDP, variance in the Inflation is mostly explained by variance in lending interest rates followed by the cur-rent account balance.
Table 9: Variance Decomposition of INFLATION
Period S.E. LBD LCAB LGDP LLIR INFLATION1 2.23 0.06 1.52 0.14 6.95 91.332 3.74 0.10 4.77 0.84 16.61 77.683 4.83 0.08 8.45 2.45 22.81 66.214 5.29 0.13 11.72 3.26 25.54 59.345 5.42 0.16 13.93 3.43 26.04 56.436 5.53 0.15 14.92 3.31 25.23 56.407 5.62 0.15 15.09 3.29 24.40 57.078 5.66 0.15 15.26 3.37 24.11 57.129 5.68 0.15 15.60 3.36 24.23 56.6810 5.78 0.14 15.88 3.26 24.54 56.18
19ECONOMIC POLICY RESEARCH CENTRE - EPRC
Macroeconomic Effects of Budget Deficits in Uganda: A VAR-VECM Approach
Policy Considerations The results from the study clearly show that budget deficits in Uganda are responsible for widening the current account deficit and rising interest rates. An ever widening cur-rent account deficit is not desirable and it could be recipe for disaster if it reaches un-sustainable levels. A current account deficit is unsustainable if it cannot be financed on a lasting basis with market-based capital inflows, it’s not consistent with adequate growth, price stability and the country’s ability to service fully its external debt ob-ligations, (IMF, 1995). Similarly, high inter-est rates crowd out the private sector and thus negatively affect national savings and investment. It is therefore necessary for the government to reduce the size of the budget deficit to a level that won’t affect other mac-roeconomic variables through fiscal consoli-dation and boosting domestic production.
Fiscal consolidation is a policy aimed at re-ducing government deficits and debt accu-mulation. For Uganda the policy should fo-cus on both short term and long term mea-sures. In the short term the government should aim at gradually reducing the budget deficit (especially after the recent indica-tions from donors to suspend development aid), by raising domestic revenue mobiliza-tion. Uganda’s tax to GDP ratio has stagnat-ed between 11 and 13 percent since 1996 yet government spending has continued to grow. Financing of the growing expenditure has therefore been through foreign aid and government borrowing both externally and internally. This as we have noted, has had negative consequences. In order to miti-gate the above consequences, government should institute actions that increase its rev-enue collection. Such actions should aim at increasing Uganda’s tax revenue collection
by adopting efficient and effective methods of tax collection. Such measures include but are not limited to the following; 1. Reducing the size of the informal sec-
tor which has proved hard to tax. 2. Reducing unproductive tax exemp-
tions. 3. Government should improve and
heighten its efforts in combating tax evasion.
4. Combating corruption which under-mines tax collection efforts.
On the expenditure side, government should reduce its overall recurrent expendi-ture bill, this could be done by revising the administrative structures created under its decentralization plan. Decentralization; in order improve service delivery, the Ugan-dan government undertook an aggressive decentralization plan which has seen the creation of number of new districts as noted in section 1. This rapid growth in the num-ber of districts has seen increase in adminis-trative costs. Government should revisit this plan reduce the number of districts to man-ageable levels. A reduction of the number of districts should be complimented by a re-duction in the size parliament and cabinet.
Revisiting the funding of Universal primary and secondary school; the abolition of tu-ition in UPE and USE programs has increased governments wage bill in form of salary pay-ments to teachers. (Note that, although the total wage bill is huge, individual teacher’s salaries are very small and thus a constant cause for strikes). To ensure future sustain-ability of these programmes therefore, gov-ernment needs to revise the funding para-digm to include a component of parents’ contribution to the education of their chil-dren.
20 ECONOMIC POLICY RESEARCH CENTRE - EPRC
Macroeconomic Effects of Budget Deficits in Uganda: A VAR-VECM Approach
Boosting production and export base; there is also need for government to pursue poli-cies that will boost the production goods for both domestic consumption and export in the long run. A combination of import sub-stitution and export promotion strategies will reduce the reliance on consumption of imported goods as well as boost Uganda’s export base and revenues thereby lowering the current account deficit. In this respect, Uganda should endeavor to increase agricul-tural production where it has a competitive advantage as well as value addition through agro processing in the short and medium term. In the long term however, govern-ment should focus on policies that increase industrial output especially the production of manufactured goods. Statistics show that share of manufacturing to GDP in Uganda has remained static at less than 10 percent since the 1960s. This has left Uganda reliant on the imports and thus a widening current account deficit.
Uganda should position itself and take ad-vantage of the widening regional and in-ternational market resulting from regional integration initiatives as well as interna-tional partnerships. This means that Uganda should endeavor to produce quality prod-ucts at lower costs compared to her neigh-bours. Lowering the cost of production will make Uganda’s exports more competitive. This requires among other things, invest-ing in infrastructure such as roads, railway, energy etc. which would require increased government spending. This means there-fore that government should set its priori-ties right and spend on activities and proj-ects that will result into high economic devidends. In addition, government should engage the private sector through public private partnerships to smoothen the fi-nancing of infrastructural projects.
REFERENCES
Adam, C. S., Bevan, D. L. (2005), “Fiscal Defi-cits and Growth in Developing Coun-tries”, Journal of Public Economics, 89: 571– 597.
Aisen, A., Hauner, D., (2008) “Budget Defi-cits and Interest Rates: A Fresh Per-spective”, IMF Working Paper, Fis-cal Affairs Department, International Monetary Fund, WP/08/42
Akbostancı, E., Tunç, G.İ., (2002), “Turk-ish Twin Deficits: An Error Correction Model of Trade Balance”, Economic Research Centre, ERC Working Papers in Economics 01/06, May 2002
Akinboade, O. A. (2004), “The relationship between budget deficit and interest rates in South Africa: some economet-ric results”, Development Southern Africa, Volume 21, Issue 2, 2004
Antwi. S., Zhao, X., Mills, E.A., (2013), “Con-sequential Effects of Budget Deficit on Economic Growth: Empirical Evidence from Ghana” International Journal of Economics and Finance; Vol. 5, No. 3; 2013
Baharumshah, A. Z., Lau E., Khalid A.M., (2006) “Testing twin deficits hypoth-esis using VARs and variance decom-position.” Journal of the Asia Pacific economy, 11 (3), 331-354.
Basu, S., Datta, D., (2005), “Does Fiscal Defi-cit Influence Trade Deficit? An Econo-metric Enquiry”, Economic and Politi-cal Weekly, Vol. 40, No. 30 (Jul. 23-29, 2005), pp. 3311-3318Published
Bernheim, B. D. (1989), “A Neoclassical Per-spective on Budget Deficits”, Journal of Economic Perspective, 3: 55-72.
Bonga-Bonga, L., (2011), “Budget deficit and long-term interest rates in South Africa”, University of Johannesburg,
21ECONOMIC POLICY RESEARCH CENTRE - EPRC
Macroeconomic Effects of Budget Deficits in Uganda: A VAR-VECM Approach
Department of Economics and Econo-metrics, Auckland Park, 2006, South Africa.
Brownbridge, M. and Tumusiime-Mutebile, E. (2007), “Aid and Fiscal Deficits: Les-sons from Uganda on the Implications for Macroeconomic Management and Fiscal Sustainability”, Development Policy Review, 25(2):193:213
Buscemi, A., Yallwe A. H.,(2012) “Fiscal Defi-cit, National Saving and Sustainabil-ity of Economic Growth in Emerging Economies: A Dynamic GMM Panel Data Approach”, International Journal of Economics and Financial Issues, Vol. 2, No. 2, 2012, pp.126-140,ISSN: 2146-4138
Catão, L. A.V. and Terrones M. E., (2005), “Fiscal Deficits and Inflation,” Journal of Monetary Economics, 52, 529-554.
De Haan, J. and Zelhorst, D. (1990), “The im-pact of government deficits on mon-ey growth in developing countries”, Journal of International Money and Finance, 9(4):455-469
Easterly, W., Schmidt-Hebbel K., (1993), “Fis-cal Deficits and Macroeconomic Per-formance in Developing Countries”, the World Bank Research Observer, Vol. 8, No. 2 (Jul., 1993), pp. 211-237
Georgantopoulos, A.G., Tsamis, A. D. (2011) “The Macroeconomic Effects of Bud-get Deficits in Greece: A VAR-VECM Approach”, International Research Journal of Finance and Economics, 79:
IMF (1995), “Guidelines for Fiscal Adjust-ment” Fiscal Affairs Department, In-ternational Monetary Fund, Washing-ton, D.C. Pamphlet Series No. 49
Keho, Y. (2010), “Budget Deficits and Eco-nomic Growth: Causality Evidence and Policy Implications for WAEMU Coun-tries” European Journal of Economics,
Finance and Administrative Sciences, 18.
Lin, H.Y. and Chu, H.P. (2013). “Are fiscal deficits inflationary?” Journal of Inter-national Money and Finance, 32:214-233
Makochekanwa, A., (2008), “The Impact of Budget Deficit on Inflation in Zimba-bwe”, University of Pretoria, South Africa
Mugume, A., Obwona, M., (1998), “Pub-lic Sector deficit and macroeconomic performance in Uganda”, Economic Policy Research Centre, EPRC Re-search Series No.7
Ndanshau, Michael O. A. (2012) “Budget Deficits, Money Supply and Inflation in Tanzania: A Multivariate Granger Causality Test, 1967–2010” University of Dar es Salaam, Working Paper No. 04/12.
Odhiambo S. O., Momanyi G., Othuon L., Aila F. O., (2013), “The Relationship between Fiscal Deficits and Economic Growth in Kenya: An Empirical Investi-gation”, Greener Journal of Social Sci-ences ISSN: 2276-7800 Vol. 3 (6), pp. 306-323, July 2013
Priewe, J., Herr, H., (2005), “The Macro-economics of Development and Pov-erty Reduction: Strategies Beyond the Washington Consensus”, Nomos-Ver-lag-Ges., 2005
Seater, J. J., (1993), “Ricardian Equivalence”, Journal of Economic Literature, Vol. XXXI (March 1993), pp. 142-190
Suparna, B., Debabrata, D., (2005) “Does Fis-cal Deficit Influence, Trade Deficit? An Econometric Enquiry”, Economic and Political Weekly, Vol. 40, No. 30 (Jul. 23-29, 2005), pp. 3311-3318
Uwilingiye, J., Gupta, R., (2007), “Tempo-ral Causality between Budget Deficit
22 ECONOMIC POLICY RESEARCH CENTRE - EPRC
Macroeconomic Effects of Budget Deficits in Uganda: A VAR-VECM Approach
and Interest Rate: The Case of South Africa”, University of Pretoria, Depart-ment of Economics, Working Paper: 2007-08 July 2007
Vuyyuri, S., Sesahiah, S. V., (2004), “Budget Deficits and other Macroeconomic
Variables in India”, Applied Economet-rics and International Development. AEEADE. Vol. 4-1 (2004) 37
Yellen, J. L. (1989), “Symposium on the Bud-get Deficit”, Journal of Economic Per-spectives, 3: 17–21
ANNEXES
Annex 1: Data Description and Sources
Variable Name Abbreviation Description Data sourceFiscal Deficit BD This is the difference between
the government expenditure and revenue excluding grants
Ministry of Finance Planning and Economic Development
Current Account Balance
CAB The sum of the goods account (trade balance), the services account (services net), the income account (income net) and the net current transfers excluding grants.
Balance of Payments Statement - Bank of Uganda
Lending Interest Rates LIR Weighted Average commercial bank lending interest rates.
Bank of Uganda
Inflation INFLATION Annual headline inflation. Bank of UgandaGross Domestic Product GDP This GDP at constant prices. Uganda Bureau of
Statistics
Annex 2: Summary Statistics, using the observations 1999:1 - 2011:2
LBD LCAB LGDP LLIR INFLATION
Mean 3.582 5.537 8.211 3.013 6.405 Median 3.851 5.562 8.222 2.998 6.329 Maximum 6.105 7.489 8.620 3.249 15.265 Minimum 0.549 2.871 7.715 2.875 -4.281 Std. Dev. 1.186 1.005 0.271 0.078 4.640 Skewness -0.219 -0.465 -0.061 0.791 -0.092 Kurtosis 2.944 3.024 1.742 3.706 2.712 Jarque-Bera 0.404 1.800 3.326 6.251 0.243 Probability 0.817 0.407 0.190 0.044 0.885 Sum 179.112 276.852 410.561 150.629 320.264 Sum Sq. Dev. 68.962 49.453 3.605 0.297 1054.945 Observations 50.000 50.000 50.000 50.000 50.000
23ECONOMIC POLICY RESEARCH CENTRE - EPRC
Macroeconomic Effects of Budget Deficits in Uganda: A VAR-VECM Approach
Annex 3: Time series plots of level variables
0
1
2
3
4
5
6
7
99 00 01 02 03 04 05 06 07 08 09 10 11
LBD
2
3
4
5
6
7
8
99 00 01 02 03 04 05 06 07 08 09 10 11
LCAB
7.6
7.8
8.0
8.2
8.4
8.6
8.8
99 00 01 02 03 04 05 06 07 08 09 10 11
LGDP
2.8
2.9
3.0
3.1
3.2
3.3
99 00 01 02 03 04 05 06 07 08 09 10 11
LLIR
-5
0
5
10
15
20
99 00 01 02 03 04 05 06 07 08 09 10 11
INFLATION
Annex 4: Correlation coefficients, using the observations 1999:1 - 2011:2, 5% critical value (two-tailed) = 0.2787 for n = 50
LBD LCAB LGDP LLIR INFLATION
LBD 1.00 0.21 0.45 -0.03 0.04LCAB 0.21 1.00 0.65 -0.02 0.36LGDP 0.45 0.65 1.00 -0.36 0.50LLIR -0.03 -0.02 -0.36 1.00 -0.10INFLATION 0.04 0.36 0.50 -0.10 1.00
24 ECONOMIC POLICY RESEARCH CENTRE - EPRC
Macroeconomic Effects of Budget Deficits in Uganda: A VAR-VECM Approach
Annex 5: VAR Lag Order Selection Criteria, Endogenous variables: LBD LCAB LGDP LLIR INFLATION
Lag LogL LR FPE AIC SC HQ
0 -189.93150 NA 0.003299 8.475281 8.674047 8.5497401 -54.23641 235.9914 2.70e-05 3.662453 4.855045 4.1092052 -3.55103 77.12993* 9.20e-06* 2.545697 4.732116* 3.364743*3 17.76260 27.80039 1.20e-05 2.705974 5.886220 3.8973134 51.39008 36.55160 1.02e-05 2.330866* 6.504939 3.894499
* indicates lag order selected by the criterion
Annex 6: Testing the model stability
Annex 7: VAR Residual Normality Tests, Orthogonalization: Cholesky (Lutkepohl), Null Hypothesis: residuals are multivariate normal
Component Skewness Chi-sq Prob. Kurtosis Chi-sq Prob. Jarque-Bera
Prob.
1 -0.295323 0.697726 0.4035 3.083273 0.013869 0.9063 0.711595 0.7006
2 -0.263272 0.554497 0.4565 2.962720 0.002780 0.9580 0.557276 0.7568
3 0.173025 0.239501 0.6246 3.960556 1.845337 0.1743 2.084838 0.3526
4 0.623262 3.107643 0.0779 2.871388 0.033082 0.8557 3.140725 0.2080
5 0.061052 0.029819 0.8629 2.164489 1.396157 0.2374 1.425976 0.4902
Joint 4.629187 0.4628 3.291224 0.6552 7.920411 0.6366
-1.5
-1.0
-0.5
0.0
0.5
1.0
1.5
-1.5 -1.0 -0.5 0.0 0.5 1.0 1.5
Inverse Roots of AR Characteristic Polynomial
25ECONOMIC POLICY RESEARCH CENTRE - EPRC
Macroeconomic Effects of Budget Deficits in Uganda: A VAR-VECM Approach
Annex 8: VAR Residual Serial Correlation LM Tests, Null Hypothesis: no serial correlation at lag order h
Lags LM-Stat Prob1 23.45295 0.55112 26.86551 0.36263 14.45678 0.95324 50.13278 0.00215 15.67656 0.92416 19.57938 0.76857 23.61780 0.54158 18.37909 0.82599 19.16106 0.789310 18.50280 0.820311 27.60323 0.326412 19.63313 0.7658Probs from chi-square with 25 df.
26 ECONOMIC POLICY RESEARCH CENTRE - EPRC
Macroeconomic Effects of Budget Deficits in Uganda: A VAR-VECM Approach
EPRC RESEARCH SERIES
Listing of Research Series published since 2010 to date. Full text format of these and earlier papers can be downloaded from the EPRC website at www.eprc.or.ug
Series No.
Author(s) Title Date
116 Adong Annet, Muhumuza Tony and Mbowa Swaibu
Smallholder Food Crop Commercialization in Uganda: Panel Survey Evidence
June 2014
115 Barungi Mildred, Wokadala James and Kasirye Ibrahim
Implementing Universal Secondary Education Policy In Uganda: How Has The Public-Private Partnership Performed?
May 2014
114 Mwaura Francis, Okoboi Geofrey and Ahaibwe Gemma
Determinants of Household’s Choice of Cooking Energy in Uganda
April 2014
113 Mawejje Joseph Tax Evasion, Informality And The Business Environment In Uganda
December 2013
112 Shinyekwa Isaac & Othieno Lawrence
Trade Creation And Diversion Effects Of The East African Community Regional Trade Agreement: A Gravity Model Analysis.
December 2013
111 Mawejje Joseph & Bategeka Lawrence
Accelerating Growth And Maintaining Intergenerational Equity Using Oil Resources In Uganda.
December 2013
110 Bategeka Lawrence et ; UN Wider
Overcoming The Limits Of Institutional Reforms In Uganda
September 2013
109 Munyambonera Ezra Nampewo Dorothy , Adong Annet & Mayanja Lwanga Musa
Access And Use Of Credit In Uganda: Unlocking The Dilemma Of Financing Small Holder Farmers.
June 2013
108 Ahaibwe Gemma & Kasirye Ibrahim
HIV/AIDS Prevention Interventions In Uganda: A Policy Simulation.
June 2013
107 Barungi Mildred & Kasirye Ibrahim
Improving Girl’s Access To Secondary Schooling A Policy Simulation For Uganda
June 2013
106 Ahaibwe Gemma, Mbowa Swaibu & Mayanja Lwanga Musa
Youth Engagement In Agriculture In Uganda: Challenges And Prospects.
June 2013
105 Shinyekwa Isaac & Mawejje Joseph
Macroeconomic And Sectoral Effects Of The EAC Regional Integration On Uganda: A Recursive Computable General Equilibrium Analysis.
May 2013
104 Shinyekwa Isaac Economic And Social Upgrading In The Mobile Telecommunications Industry: The Case Of MTN.
May 2013
103 Mwaura Francis Economic And Social Upgrading In Tourism Global Production Networks: Findings From Uganda.
May 2013
102 Kasirye Ibrahim Constraints To Agricultural Technology Adoption In Uganda: Evidence From The 2005/06-2009/10 Uganda National Panel Survey.
May 2013
27ECONOMIC POLICY RESEARCH CENTRE - EPRC
Macroeconomic Effects of Budget Deficits in Uganda: A VAR-VECM Approach
101 Bategeka Lawrence,Kiiza Julius &Kasirye Ibrahim
Institutional Constraints To Agriculture Development In Uganda.
May 2013
100 Shinyekwa Isaac &Othieno Lawrence
Comparing The Performance Of Uganda’s Intra-East African Community Trade And Other Trading Blocs: A Gravity Model Analysis.
April 2013
99 Okoboi Geoffrey Kuteesa Annette &Barungi Mildred
The Impact Of The National Agricultural Advisory Services Program On Household Production And Welfare In Uganda.
March 2013
98 Adong Annet, Mwaura Francis &Okoboi Geoffrey
What Factors Determine Membership To Farmer Groups In Uganda? Evidence From The Uganda Census Of Agriculture 2008/9.
January 2013
97 Tukahebwa B. Geoffrey The Political Context Of Financing Infrastructure Development In Local Government: Lessons From Local Council Oversight Functions In Uganda.
December 2012
96 Ssewanyana Sarah&Kasirye Ibrahim
Causes Of Health Inequalities In Uganda: Evidence From The Demographic And Health Surveys.
October 2012
95 Kasirye Ibrahim HIV/AIDS Sero-Prevalence And Socioeconomic Status: Evidence From Uganda.
October 2012
94 Ssewanyana Sarah and Kasirye Ibrahim
Poverty And Inequality Dynamics In Uganda: Insights From The Uganda National Panel Surveys 2005/6 And 2009/10.
September 2012
93 Othieno Lawrence & Dorothy Nampewo
Opportunities And Challenges In Uganda’s Trade In Services.
July 2012
92 Kuteesa Annette East African Regional Integration: Challenges In Meeting The Convergence Criteria For Monetary Union: A Survey.
June 2012
91 Mwaura Francis and Ssekitoleko Solomon
Reviewing Uganda’s Tourism Sector For Economic And Social Upgrading.
June 2012
90 Shinyekwa Isaac A Scoping Study Of The Mobile Telecommunications Industry In Uganda.
June 2012
89 Mawejje JosephMunyambonera EzraBategeka Lawrence
Uganda’s Electricity Sector Reforms And Institutional Restructuring.
June 2012
88 Okoboi Geoffrey and Barungi Mildred
Constraints To Fertiliser Use In Uganda: Insights From Uganda Census Of Agriculture 2008/09.
June 2012
87 Othieno Lawrence Shinyekwa Isaac
Prospects And Challenges In The Formation Of The COMESA-EAC And SADC Tripartite Free Trade Area.
November 2011
86 Ssewanyana Sarah,Okoboi Goeffrey &Kasirye Ibrahim
Cost Benefit Analysis Of The Uganda Post Primary Education And Training Expansion And Improvement (PPETEI) Project.
June 2011
85 Barungi Mildred& Kasirye Ibrahim
Cost-Effectiveness Of Water Interventions: The Case For Public Stand-Posts And Bore-Holes In Reducing Diarrhoea Among Urban Households In Uganda.
June 2011
28 ECONOMIC POLICY RESEARCH CENTRE - EPRC
Macroeconomic Effects of Budget Deficits in Uganda: A VAR-VECM Approach
84 Kasirye Ibrahim &Ahaibwe Gemma
Cost Effectiveness Of Malaria Control Programmes In Uganda: The Case Study Of Long Lasting Insecticide Treated Nets (LLINs) And Indoor Residual Spraying.
June 2011
83 Buyinza Faisal Performance And Survival Of Ugandan Manufacturing Firms In The Context Of The East African Community.
September 2011
82 Wokadala James, Nyende Magidu, Guloba Madina & Barungi Mildred
Public Spending In The Water Sub-Sector In Uganda: Evidence From Program Budget Analysis.
November 2011
81Bategeka Lawrence & Matovu John Mary
Oil Wealth And Potential Dutch Disease Effects In Uganda.
June 2011
80 Shinyekwa Isaac &Othieno Lawrence
Uganda’s Revealed Comparative Advantage: The Evidence With The EAC And China.
September2011
79 Othieno Lawrence & Shinyekwa Isaac
Trade, Revenues And Welfare Effects Of The EAC Customs Union On Uganda: An Application Of Wits-Smart Simulation Model.
April 2011
78 Kiiza Julius, Bategeka Lawrence & Ssewanyana Sarah
Righting Resources-Curse Wrongs In Uganda: The Case Of Oil Discovery And The Management Of Popular Expectations.
July 2011
77 Guloba Madina, Wokadala James & Bategeka Lawrence
Does Teaching Methods And Availability Of Teaching Resources Influence Pupil’s Performance?: Evidence From Four Districts In Uganda.
August 2011
76 Okoboi Geoffrey, Muwanika Fred, Mugisha Xavier & Nyende Majidu
Economic And Institutional Efficiency Of The National Agricultural Advisory Services’ Programme: The Case Of Iganga District.
June 2011
75 Okumu Luke &Okuk J. C. Nyankori
Non-Tariff Barriers In EAC Customs Union: Implications For Trade Between Uganda And Other EAC Countries.
December 2010
74 Kasirye Ibrahim & Ssewanyana Sarah
Impacts And Determinants Of Panel Survey Attrition: The Case Of Northern Uganda Survey 2004-2008.
April 2010
73 Twimukye Evarist,Matovu John MarySebastian Levine &Birungi Patrick
Sectoral And Welfare Effects Of The Global Economic Crisis On Uganda: A Recursive Dynamic CGE Analysis.
July 2010
72 Okidi John &Nsubuga Vincent
Inflation Differentials Among Ugandan Households: 1997 – 2007.
June 2010
71 Hisali Eria Fiscal Policy Consistency And Its Implications For Macroeconomic Aggregates: The Case Of Uganda.
June 2010
70 Ssewanyana Sarah & Kasirye Ibrahim
Food Security In Uganda: A Dilemma To Achieving The Millennium Development Goal.
July 2010
69 Okoboi Geoffrey Improved Inputs Use And Productivity In Uganda’s Maize Sector.
March 2010
68 Ssewanyana Sarah & Kasirye Ibrahim
Gender Differences In Uganda: The Case For Access To Education And Health Services.
May 2010
67 Ssewanyana Sarah Combating Chronic Poverty In Uganda: Towards A New Strategy.
June 2010


Economic Policy Research CentrePlot 51, Pool Road, Makerere University Campus
P.O. Box 7841, Kampala, UgandaTel: +256-414-541023/4, Fax: +256-414-541022Email: [email protected], Web: www.eprc.or.ug