Embed Size (px)
Citation preview

International Business Research; Vol. 13, No. 1; 2020
ISSN 1913-9004 E-ISSN 1913-9012
Published by Canadian Center of Science and Education
192
Macroeconomic Drivers of Private Equity Penetration in Sub-Saharan
African Countries
Fonkam Mongwa Nkam1, Akume Daniel Akume2, Molem Christopher Sama3
1 PhD Student, Department of Banking and Finance, Faculty of Social and Management Sciences, University of
Buea, Cameroon
2 Higher Technical Teacher Training College (HTTTC), University of Buea, Kumba, Cameroon
3 Department of Economics, University of Buea, Cameroon
Correspondence: Fonkam Mongwa Nkam, Department of Banking and Finance, Faculty of Social and
Management Sciences, University of Buea, Cameroon.
Received: November 21, 2019 Accepted: December 16, 2019 Online Published: December 19, 2019
doi:10.5539/ibr.v13n1p192 URL: https://doi.org/10.5539/ibr.v13n1p192
Abstract
The objective of this study is to investigate in to the drivers of private equity penetration in Cameroon, Nigeria,
Ghana, Kenya and South Africa. Secondary data was collected from private equity and venture capital data bases
(CapitalIQ, Preqin, Burgiss and Mergermarket), World Bank development indicators, regional private equity and
venture capital associations and country specific stock market websites. The Panel Two-Stage Least Squares
Instrumental Variables (2SLS IV), Panel Corrected Standard Errors (PCSE) and Feasible Generalised Least
Squares (FGLS) estimation techniques were used. This was due to potential problems of endogeneity and
spherical errors of serial correlation, heteroskedasticity, cross sectional dependence and multicollinearity. The
results using the 2SLS IV estimation technique show that stock market capitalisation, GDP per capita, banking
credit to private sector, real exchange rate and private investments are key macroeconomic drivers of private
equity penetration in the selected Sub-Saharan African countries. Inflation had negative and insignificant effect
on private equity penetration in the selected countries. The results using the PCSE and FGLS estimation
techniques show that the signs of all the variables remain the same as was the case in the 2SLS IV estimation
technique though the magnitudes were different. However, the results of PCSE and FGLS estimation techniques
show that banking credit to private sector is significant in the FGLS model while private investments is
significant in the PCSE model. GDP per capita, real exchange rate, stock market capitalisation and inflation are
significant in both the PCSE and FGLS estimation techniques.
Keywords: macroeconomic drivers, private equity penetration, SSA
1. Introduction
Development and finance literature suggests that financial development is beneficial for attracting capital.
Development literature further confirms the private sector as the main driver of economic growth (European
Venture Capital Association [EVCA], 2013). The private sector needs to be adequately capitalised for any
country to be developed. By Private equity (PE) we include Venture Capital (VC). This is because private equity
firms today invest in all the stages of companies that are not quoted on capital markets. PE investors are known
to provide seed, venture, growth and distress capital to companies from small to medium sized. This has made
the PE industry to explode in scale and scope and has become a significant component of the global financial
market (Ernst & Young [EY], 2018). Companies that are backed by PE investors are more efficient and create
more employment than their peers (Belke, Fehn, & Foster-McGregor, 2003). In order to increase their returns,
PE firms are seeking to penetrate developing markets. This is due to strong competition, saturation and depletion
of deals in developed markets. By private penetration, we mean Private equity and venture capital deal flows to a
particular country based on some attractive or unattractive factors.
Developing countries are still in the transformation process and access to capital is a problem. As a consequent,
businesses have difficulties in sourcing finance for growth and expansion. This problem is more serious for
young companies with weak and unattractive balance sheets for commercial bank loans. This has caused some
businesses not to exploit their potentials. In extreme cases some have simply discontinued operations (Cressy,

http://ibr.ccsenet.org International Business Research Vol. 13, No. 1; 2020
193
Munari, & Malipiero 2007). In the wake of these difficulties, PE financing is an alternative source of funding for
businesses. This is because it provides finances to all stages in a business’ lifecycle. By so doing, they can bridge
the gap between a company self-financing and obtaining funds from banks. Faced with the challenges of
business financing and achieving ambitious economic emergence objectives, many governments in Sub Sahara
countries are thriving to make their economies attractive to private equity investors. However, some PE investors
still perceive Sub Sahara as a region of high risk, over-indebtedness, high volatile exchange rates, low middle
class, poor infrastructure and poor financial sector (Leamon & Lerner, 2011).
Despite these perceptions, governments in the sub-Saharan region are creating enabling environments with an
attractive PE penetration profile (International Monetary Fund [IMF], 2015). However, some of these countries
have been attractive while others have simply been unattractive to PE investors. For the purpose of this paper,
five countries (Nigeria, Ghana, Kenya, Cameroon and South Africa) have been selected. From 2013 to 2018,
these countries were the most attractive to private equity investors in their respective sub-regions. In West Africa,
out of 282 completed deals, Nigeria had 54% and Ghana 22%. In terms of deal value to West Africa, Nigeria had
73 % and Ghana 20% of U.S $10.8 billion. In East Africa, of the 194 reported number of PE deals Kenya alone
had 58%. Within this same period, U.S $2.4 billion deal value was reported in East Africa and Kenya had 59%.
In Southern Africa, there were 295 number of PE deals and South Africa alone had 66 %. There was U.S $ 3.5
billion value of reported deals to Southern Africa and South African grabbed 70% share (Africa Private Equity
and Venture Capital Association [AVCA], 2019). In Cameroon, PE activity is timid and only one Merger and
Acquisition deal had been completed through the Douala Stock Exchange (AVCA, 2019).
Most research on the determinants of private equity activity has been on developed countries. Among them are
the studies of Groh and Liechtenstein (2010), Kelly (2012), Aizenman and Kendall (2008), Clarysse, Knockaert,
& Wright (2009), Guler and Guillén (2010), Cherif and Gazdar (2011), Félix, Pires and Gulamhussen (2013),
Oino (2014) and Bernoth and Colavecchio (2014). However, Oni (2017) conducted a study on the determinants
of venture capital supply in Sub-Saharan Africa. Due to low PE penetration, policy makers in the selected
countries have made considerable efforts to liberalise their financial sectors and attract more private equity.
Cameroon passed the 2013 Act in order to improve its investment climate (Ministry of economy, Planning and
Regional Development, 2013). Nigeria formulated reforms to reduce the risk factors to investors (Securities
Exchange Commission [SEC], 2016). Ghana passed the Venture Capital Trust Fund Act in 2004 and financing
schemes legislations (Owusu-Adjei, 2010). Kenya enacted the investment act in 1989, revamped corporate laws,
granted incentives of lower capital gains tax rate to PE firms on exit and enacted the Walker guidelines in
England on transparency (Njubi, 2018). South Africa relaxed regulations on Johannesburg Stock exchange (JSE)
listing requirements and profits repatriation laws (Molatlhwe, 2016).
Despite the national financial liberalisation reforms, private equity penetration in the selected countries continues
to be low. This poses a problem as current literature and policies have failed to provide concrete suggestions and
solutions. This presents significant policy and knowledge gaps. Therefore, this research is motivated by the
failure of current academic literature and policies to investigate in to the macroeconomic drivers of private
equity penetration in Cameroon, Nigeria, Ghana, Kenya and South Africa. Thus, this study seeks to fill the
knowledge and policy gaps by providing results that will increase PE investments in these countries. Based on
this, the objective of this study is to investigate in to the macroeconomic drivers of private equity penetration in
Cameroon, Nigeria, Ghana, Kenya and South Africa.
2. Theoretical and Literature Review
Private equity penetration can be explained using the Modigliani and Miller (1958) trade-off theory and the
Pecking Order theory of Myers (1984). The trade-off theory posits that businesses are financed using either debt
or equity capital. However, debt financing is unattractive as it puts financial pressure on businesses in terms of
interest payments and principal repayments. Due to these constrains, businesses prefer equity financing. This
makes private equity funding a major and attractive source of business finance. According to the pecking order
theory, there are three sources of funding to businesses. These are internal, debt and equity financing. When
private equity activity in increased in a country, businesses benefit from equity financing. This boosts growth and
expansion with less financial pressure in the form of interest payments and principal repayments.
The attractiveness of private equity financing to a country or region can be explained by the neoclassical theory
of investment behaviour developed by Jorgenson (1971) and the Modern Portfolio Theory (MPT) of Markowitz
(1952). The neoclassical theory of investment behaviour theory posits that firms invest if their current capital
stock is smaller than the optimal capital stock and disinvest when their current capital stock is sufficiently larger
than the optimal capital stock. In studies of PE investments, this theory refers to the idea that PE investments

http://ibr.ccsenet.org International Business Research Vol. 13, No. 1; 2020
194
tend to cluster in regions/countries of economic, technological or regulatory advancements (Yan, 2011). The
demand side comprises businesses seeking financing. This means that the demand for private equity as a source
of financing should be higher in times of positive economic prospects. The supply side consists of private
investors looking for investment opportunities with attractive risk-return characteristics. These are based on
some attractive and unattractive macroeconomic and institutional forces such as GDP per capita, inflation, real
exchange rates, banking sector development, capital markets, rate of savings and corruption.
From the assumptions of the MPT, risk-averse investors can construct portfolios to optimise or maximise
expected return based on a given level of portfolio risk. They seek to control risk only through diversification. In
their international allocation strategies to minimise risks, private equity investors make their international
allocation decisions by investing in countries that have low macroeconomic and institutional risk profiles with the
aim of increasing their returns.
In addition to the theories are some empirical duties that explain the macroeconomic derivers of private equity
penetration. Groh and Liechtenstein (2010) undertook a study to determine the attractiveness of Central and
Eastern Europe for risk capital investors. Based on questionnaires addressed to institutional investors, they found
stock market capitalisation to attract private equity funding. Clarysse et al. (2009) used a panel technique to
identify supply and demand drivers of venture capital activity for the UK (1985-2006), Israel (1999-2007) and
the US (1980-2007). They found that the amounts of early stage and total VC invested in these countries are
determined by total entrepreneurial activity (as measured by the Global Entrepreneurship Monitor) and stock
market capitalisation.
Aizenman and Kendall (2008) investigated the internationalisation of venture capital and private equity
investments using gravity analysis covering three decades and 100 countries. The results showed that better
business environment and deeper financial markets were important local factors that attract international venture
capital. Kelly (2012) investigated the drivers of private equity activity by undertaking a panel data study for 17
European countries. By using the Generalised Method of Moments estimator they found market capitalisation to
be an important determinant of PE activity.
Cherif and Gazdar (2011) examined the determinants of venture capital investments across 21 European
countries from 1997-2006. By using the Generalised Least Squares estimator, they found that GDP growth and
market capitalisation were the most macroeconomic determinants of European venture capital investments.
Guler and Guillén (2010) conducted a study on the institutions and the internationalisation of 216 U.S venture
capital firms investing in 95 countries during the 1990 -2002 period. The results showed that venture capital and
private equity firms invest in host countries characterised by good financial institutions and exits through capital
markets. Félix et al. (2013) conducted a study on the determinants of venture capital in Europe. By using an
aggregate data from 23 European countries for the period 1998–2003 to estimate panel data models with fixed
and random effects, they found that stock market capitalisation had a positive impact on venture capital activity.
Oino (2014) studied the macroeconomic and environment determinants of private equity in emerging Asian
markets. By using the extreme bound analysis, the results showed that while GDP growth and market
capitalisation did not result to be significant. Private equity was more accessible in countries with
well-developed stock markets. Bernoth and Colavecchio (2014) studied the macroeconomic determinants of
private equity investment by comparing 16 Central and Eastern European (CEE) and Western European
countries from 2001 to 2011. By applying the extreme bound analysis, their results suggested that GDP per
capita, commercial bank lending, inflation rate and equity market capitalisation were significant determinants of
PE activity. Oni (2017) carried out a study on the determinants of venture capital supply in Sub-Saharan Africa
from 2006 to 2015. The objective was to determine the variables that influence venture capital supply in 8
Sub-Saharan African countries (Botswana, Ivory Coast, Ghana, Kenya, Mauritius, Nigeria, South Africa and
Uganda). By using Panel data models of pooled, fixed and random effects, the results showed that there is a
significant positive relationship between initial public offering, market capitalisation and venture capital supply.
3. Methodology
3.1 Sources of Data
Secondary data was collected from 2002 to 2017. It was collected from CapitalIQ, Preqin, Mergermarket, World
Bank indicators, monthly and annual data from private equity and venture capital association reports such as the
African Venture Capital Association (AVCA), East Africa Venture Capital Association (EAVCA) and South
Africa Venture Capital Association (SAVCA).

http://ibr.ccsenet.org International Business Research Vol. 13, No. 1; 2020
195
3.2 Model Specification
We used three estimators, namely Two-Stage Least Squares, Instrumental Variables (2SLS, IV), Panel Corrected
Standard Errors (PCSE) and Feasible Generalised Least Squares (FGLS). The analyses began with the Panel
Instrumental Variable (IV) based on the fact that endogeneity may exist. Thus, a simple Fixed or Random Effect
estimation would have produced biased results if this is true. The estimation was conducted using the
XTIVREG2 command in STATA 13. The XTIVREG2 implements IV/GMM estimation of the fixed-effects and
first-differences panel data models with possible endogenous regressors. This command is robust in this situation
because of heteroskedasticity and serial correlation within the panels. The traditional panel data
estimators–Fixed Effects (FE) model, Random Effects (RE) model and Ordinary Least Squares (OLS) are used
by assuming consistency but in this situation they are ineffective to deal with. The 2SLS, IV estimation
technique was used because of potential endogenous regressors. The PCSE proposed by Beck and Katz (1995)
and FGLS estimator of Parks (1967) were used because of the existence of spherical errors (cross sectional
dependency, heteroskedasticity and serial correlation) after testing. Both the PCSE and FGSL models were used
because the PCSE estimator provides accurate standard error estimations with little loss in efficiency than the
FGLS. However, the FGLS has an efficiency advantage over the PCSE when the number of time periods (T) is
at least twice the number of cross-sectional units (Park, 1967). In this study, T (16) is trice the N (5) thus calling
for the use of FGLS.
The empirically derived variables used in the models were stock market capitalisation, GDP per capita, banking
credit to private sector, private investments, inflation and real exchange rates. The choice of variables was
backed by the empirical Kelly (2012), Aizenman and Kendall (2008), Clarysse et al. (2009), Oino (2014)
Bernoth and Colavecchio (2014). We used market capitalisation (proxy of capital market development) because
private equity investors use capital markets for deal valuations and during divestments. Therefore the
development level of a country’s capital market is essential to private equity investors. We equally used GDP per
capital because per capita income determines the amounts of goods and services produced by private equity
backed companies that are bought by the population. Banking credit to private sector was used because the
amount of credit granted by domestic financial institutions will determine the need for additional financing that
could be provided by private equity investors. Inflation was used to model for macroeconomic stability. This is
because it affects the prices of goods produced by private equity backed firms and ultimately the returns of
private equity investors. This study equally included private investments and real exchange rates as drivers of
private equity penetration. This is because empirically, private investment is used as a driver of financial sector
development and real exchange rate as a determinant of private investments. The rationale is that private equity
is a financial service that provides loans for private investments. If real exchange rates can affect private
investments they could equally affect private equity investments. Finally, exchange rate uncertainty affects the
value of cross-border investments. Institutional variables will be considered in our next study. The linear form of
the PE penetration model is given as;
, , , , , PEP f MCAP GDPPC BCP PI INF RER (1)
The fixed effect, 2SLS, IV model is specified as;
0 1 2 3 4 5 6 ?it it it it it it it it itlnPEP lnMCAP lnGDPPC lnBCP lnPI lnINF lnRER u (2)
The regression model for the Panel Corrected Standard Errors (PCSE) and Feasible Generalised Least Squares
(FGLS) model is specified as;
0 1 ? 牋 3 4 ? 6 ?it it it it it it it itlnPEP lnMCAP lnGDPPC lnBCP lnPI lnINF lnRER U
(3)
Where
β0 is a constant, β1, β2, β3, β4, β5 and β6 are coefficients of the independent variables in the PEP model. it is the
individual country in year t, ln is Natural Logarithm, ε is the errors autocorrelated along t. From empirical
studies, the a priori was for the coefficients of the independent variables β1, β2, β3 and β4 to be positive while
those of β5 and β6 to be negative.
PEP is Private Equity Penetration. It is the level of private equity deals flow to a country as a proportion of its
http://ibr.ccsenet.org International Business Research Vol. 13, No. 1; 2020
196
lagged GDP. Given the lag between economic development and possibility of investment, we take GDP of
previous year. PE penetration can be measured using GDP as a proxy.
1
牋 牋 牋 ? ? 牋 " "
t
Total Privateequity capital invested incountry i at time tPEP
GDP
(4)
MCAP is stock market capitalisation and it is the market value of outstanding shares of listed home companies.
It is measured as a percentage of market value of outstanding shares to GDP. It is used as proxy of capital market
development.
BCP is banking credit to private Sector and it is the total credit granted to the private sector for production
purposes by financial institutions in a country. It measured as the percentage of total Credit to private Sector by
financial institutions to GDP.
GDPPC is GDP per capita and it is a ratio of a country’s gross domestic product to its total population. It is
measured by dividing a country’s GDP to its total population.
PI is Private Investments and it is gross outlays by the private sector (including private non-profit agencies) on
additions to its fixed domestic assets. It is measured as gross national investments divided by GDP.
INF is inflation rate and it is an indication of the general price level in a country and macroeconomic instability.
It is measured using the Consumer Price Index (CPI).
RER is real exchange rate. It is an indicator of exchange rate risk and certainty in the economy. It is measured
using the value of the currencies of the selected countries against a weighted average of several other currencies
divided by a price deflator or index of costs.
4. Descriptive Statistics
In order to better understand the distribution of the variables, the descriptive are presented per country.
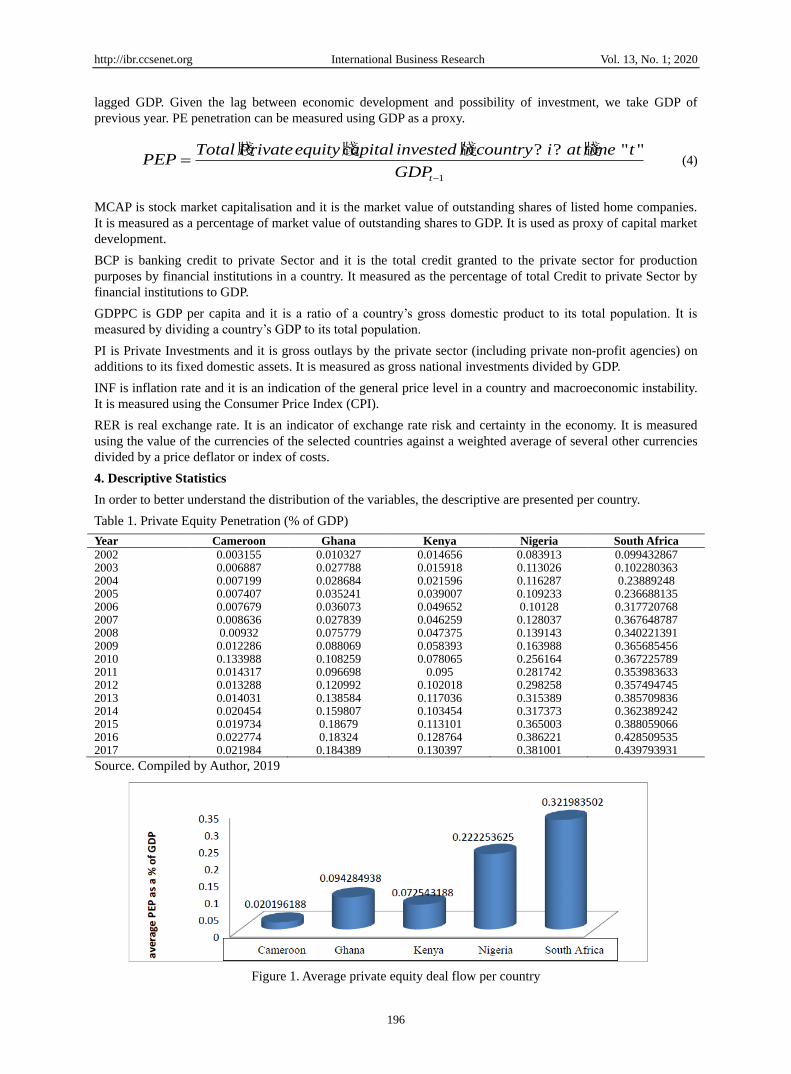
Table 1. Private Equity Penetration (% of GDP)
Year Cameroon Ghana Kenya Nigeria South Africa
2002 0.003155 0.010327 0.014656 0.083913 0.099432867 2003 0.006887 0.027788 0.015918 0.113026 0.102280363 2004 0.007199 0.028684 0.021596 0.116287 0.23889248 2005 0.007407 0.035241 0.039007 0.109233 0.236688135 2006 0.007679 0.036073 0.049652 0.10128 0.317720768 2007 0.008636 0.027839 0.046259 0.128037 0.367648787 2008 0.00932 0.075779 0.047375 0.139143 0.340221391 2009 0.012286 0.088069 0.058393 0.163988 0.365685456 2010 0.133988 0.108259 0.078065 0.256164 0.367225789 2011 0.014317 0.096698 0.095 0.281742 0.353983633 2012 0.013288 0.120992 0.102018 0.298258 0.357494745 2013 0.014031 0.138584 0.117036 0.315389 0.385709836 2014 0.020454 0.159807 0.103454 0.317373 0.362389242 2015 0.019734 0.18679 0.113101 0.365003 0.388059066 2016 0.022774 0.18324 0.128764 0.386221 0.428509535 2017 0.021984 0.184389 0.130397 0.381001 0.439793931
Source. Compiled by Author, 2019
Figure 1. Average private equity deal flow per country

http://ibr.ccsenet.org International Business Research Vol. 13, No. 1; 2020
197
Tables 2, 3, 4, 5 and 6 below show mean, standard deviation, minimum and maximum values of all the variables
used per country. The number of observations (N) is 16 years (2002 to 2017).
Table 2. Cameroon
N Mean Std. Dev. Min Max
pep 16 65260.96 14207.32 41190.55 107158.9 Inf 16 2.198227 1.499817 0.233647 5.337806 Rer 16 100.405 2.433143 96.54008 106.6273 gdppc 16 1254.587 239.5355 719.8896 1571.182 bcp 16 3.06E+09 1.46E+09 9.97E+08 5.06E+09 Pi 16 5.81E+09 1.80E+09 2.64E+09 8.41E+09 mcap 16 4.03E+10 4.64E+10 1.68E+09 1.28E+11
From table 1 above, the mean of PEP is 65260.96. The minimum and maximum values are 41190.55 and
107158.9 respectively. There is low variability from the mean as shown by the low standard deviation value of
14207.32. The mean of the inflation variable (inf) is 2.198227. The minimum and maximum values are
0.233647and 5.337806 respectively. It has a low standard deviation (1.4998170), thus low variability in the
distribution of this variable from the mean. The mean of the real exchange rate (rer) is 100.405. The minimum
and maximum values are 96.54008 and 106.6273 respectively. It has a low standard deviation value of 2.433143.
The average of the GDP per capita (gdppc) is 1254.587. The minimum and maximum values are 719.8896 and
1571.182 respectively. The standard deviation (239.5355) is low. This means that there is a low variability in the
distribution of this variable from the mean. The mean of the banking credit to private sector (bcp) is 3.06E+09.
The minimum and maximum values are 9.97E+08 and 5.06E+09 respectively. There is high variability from the
mean as portrayed by its high standard deviation value of 1.46E+09. The average value of the private
investments (pi) variable is 5.81E+09. The minimum and maximum values are 2.64E+09 and 8.41E+09
respectively. There is low variability in the distribution of this variable from the mean as shown by the low
standard deviation value of 1.80E+09. Market capitalisation (mcap) variable has a mean value of 4.03E+10. The
minimum and maximum values are 1.68E+09 and 1.28E+11 respectively. The standard deviation value of
4.64E+10 is high. This means that there is high variability of this variable from the mean.
Table 3. Ghana
N Mean Std. Dev. Min Max
pep 16 137638.7 54465.39 85358.81 230548 Inf 16 14.20924 4.73252 7.12635 26.67495 Rer 16 91.1858 12.16606 68.3678 107.5895 gdppc 16 1288.467 661.8778 309.4845 2401.754 bcp 16 4.80E+09 2.84E+09 7.49E+08 8.45E+09 Pi 16 7.36E+09 5.58E+09 1.21E+09 1.67E+10 mcap 16 2.74E+09 1.75E+09 3.50E+08 5.71E+09
Table 3 above shows that private equity penetration (pep) in Ghana has a mean of 137638.7. The minimum and
maximum values are 85358.81 and 230548 respectively. The standard deviation is high (54465.39), thus there is
high variability of this variable from the mean. The average value of the inflation variable (inf) is 14.20924. The
minimum and maximum values are 7.12635 and 26.67495 respectively. This variable has a low standard
deviation (4.73252). This shows that there low variability from the mean. The mean of the real exchange rate (rer)
is 91.1858. The minimum and maximum values are 68.3678 and 107.5895 respectively. The variability of this
variable from its mean is low as show by its standard deviation of 12.16606. GDP per capita (gdppc) has an
average value 1288.467. The minimum and maximum values are 309.4845 and 2401.754 respectively. It has a
low standard deviation value of 661.8778. This shows that there is low variability of this variable from the mean.
Domestic credit to private sector (dcp) has a mean value of 4.80E+09. The minimum and maximum values are
7.49E+08 and 8.45E+09 respectively. It has a low standard deviation value of 2.84E+09. This is low, meaning
low variability in the distribution of this variable from its mean. Private investment (pi) has a mean value of
7.36E+09. The minimum and maximum values are 1.21E+09 and 1.67E+10 respectively. It has a low standard
deviation of 5.58E+09. The average of market capitalisation (mcap) is 2.74E+09. The minimum and maximum
values are 3.50E+08 and 5.71E+09 respectively. Its variability from its mean is high as shown by its standard
deviation of 1.75E+09.

http://ibr.ccsenet.org International Business Research Vol. 13, No. 1; 2020
198
Table 4. Kenya
N Mean Std. Dev. Min Max
pep 16 424937.5 365003.7 185317.5 157289 Inf 16 9.64017 5.537859 1.961308 26.23982 Rer 16 80.14293 6.967529 67.31763 88.87352 gdppc 16 954.422 381.8652 395.8494 1594.835 bcp 16 1.21E+10 7.27E+09 3.40E+09 2.32E+10 Pi 16 8.10E+09 4.28E+09 1.99E+09 1.44E+10 mcap 16 1.36E+10 8.22E+09 1.43E+09 3.20E+10
From table 4, the average of the private equity penetration (pep) variable for Kenya is 424937.5. The minimum
and maximum values are 185317.5 and 157289 respectively. It has a high standard deviation value of 365003.7,
thus high variability from the mean. Inflation (inf) has a mean of 9.64017. The minimum and maximum values
are 1.961308 and 26.23982 respectively. It has a low standard deviation value of 5.537859; thus low variability
from the mean. The mean value of real exchange rate (rer) is 80.14293. The minimum and maximum values are
67.31763 and 88.87352 respectively. The variability of this variable from its mean is low as shown by the
standard deviation of 6.967529. The average of the GDP per capita (gdppc) variable is 954.422. The minimum
and maximum values are 395.8494 and 1594.835 respectively. The variability of this variable from its mean is
low as shown by its standard deviation of 381.8652. Domestic credit to private sector (dcp) has a mean of
1.21E+10. The minimum and maximum values are 73.40E+09 and 2.32E+10 respectively. It has a low standard
deviation of 7.27E+09. The mean of private investments (pi) is 8.10E+09. The minimum and maximum values
are 11.99E+09 and 1.44E+10 respectively. The variability from its mean is low as portrayed by its standard
deviation of 4.28E+09. The average of market capitalisation (mcap) is 1.36E+10. The minimum and maximum
values are 1.43E+09 and 3.20E+10 respectively. It has a high standard deviation value of 8.22E+09. There is
high variability in the distribution of this variable from the mean.
Table 5. Nigeria
N Mean Std. Dev. Min Max
pep 16 232 869.3 124 042 111 355.1 461 293.3 inf 16 11.93949 3.48066 5.382224 17.86349 rer 16 99.27788 17.59897 72.70943 127.5896 gdppc 16 2 008.153 762.5206 741.3403 3221.678 bcp 16 4.61E+10 2.52E+10 7.71E+09 8.25E+10 pi 16 6.00E+10 1.71E+10 2.63E+10 8.98E+10 mcap 16 4.58E+10 2.46E+10 2.37E+09 8.85E+10
From table 5 above, the average of the private equity penetration (pep) in Nigeria variable is 232869.3. The
minimum and maximum values are 111355.1 and 461293.3 respectively. The variability from its mean is low as
shown by its standard deviation of 124042. The inflation variable (inf) has a mean of 11.93949. The minimum
and maximum values are 5.382224 and 17.86349 respectively. It has a low standard deviation of 3.48066. The
mean of the real exchange rate (rer) is 99.27788. The minimum and maximum values are 72.70943 and 127.5896
respectively. It has a low standard deviation of 17.59897. The average of the GDP per capita (gdppc) is 2008.153.
The minimum and maximum values are 741.3403 and 3221.678 respectively. It has a low standard deviation of
762.5206. Domestic credit to private sector (dcp) has a mean value of 4.61E+10. The minimum and maximum
values are 7.71E+09 and 8.25E+10 respectively. It has a high standard deviation value of 72.52E+10. Private
investment (pi) has a mean of 6.00E+10. The minimum and maximum values are 2.63E+10 and 18.98E+10
respectively. It has a low standard deviation value of 1.71E+10. The average of market capitalisation (mcap) is
4.58E+10. The minimum and maximum values are 2.37E+09 and 8.85E+10 respectively. It has a low standard
deviation value of 2.46E+10.
http://ibr.ccsenet.org International Business Research Vol. 13, No. 1; 2020
199
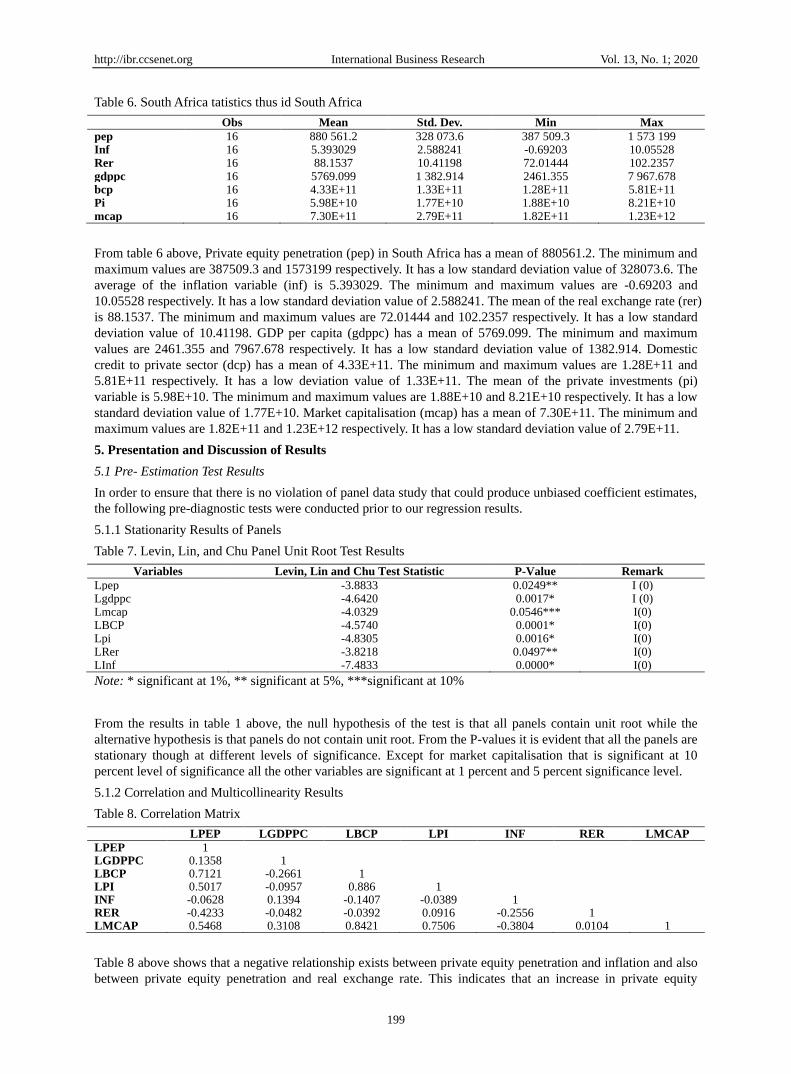
Table 6. South Africa tatistics thus id South Africa
Obs Mean Std. Dev. Min Max
pep 16 880 561.2 328 073.6 387 509.3 1 573 199 Inf 16 5.393029 2.588241 -0.69203 10.05528 Rer 16 88.1537 10.41198 72.01444 102.2357 gdppc 16 5769.099 1 382.914 2461.355 7 967.678 bcp 16 4.33E+11 1.33E+11 1.28E+11 5.81E+11 Pi 16 5.98E+10 1.77E+10 1.88E+10 8.21E+10 mcap 16 7.30E+11 2.79E+11 1.82E+11 1.23E+12
From table 6 above, Private equity penetration (pep) in South Africa has a mean of 880561.2. The minimum and
maximum values are 387509.3 and 1573199 respectively. It has a low standard deviation value of 328073.6. The
average of the inflation variable (inf) is 5.393029. The minimum and maximum values are -0.69203 and
10.05528 respectively. It has a low standard deviation value of 2.588241. The mean of the real exchange rate (rer)
is 88.1537. The minimum and maximum values are 72.01444 and 102.2357 respectively. It has a low standard
deviation value of 10.41198. GDP per capita (gdppc) has a mean of 5769.099. The minimum and maximum
values are 2461.355 and 7967.678 respectively. It has a low standard deviation value of 1382.914. Domestic
credit to private sector (dcp) has a mean of 4.33E+11. The minimum and maximum values are 1.28E+11 and
5.81E+11 respectively. It has a low deviation value of 1.33E+11. The mean of the private investments (pi)
variable is 5.98E+10. The minimum and maximum values are 1.88E+10 and 8.21E+10 respectively. It has a low
standard deviation value of 1.77E+10. Market capitalisation (mcap) has a mean of 7.30E+11. The minimum and
maximum values are 1.82E+11 and 1.23E+12 respectively. It has a low standard deviation value of 2.79E+11.
5. Presentation and Discussion of Results
5.1 Pre- Estimation Test Results
In order to ensure that there is no violation of panel data study that could produce unbiased coefficient estimates,
the following pre-diagnostic tests were conducted prior to our regression results.
5.1.1 Stationarity Results of Panels
Table 7. Levin, Lin, and Chu Panel Unit Root Test Results
Variables Levin, Lin and Chu Test Statistic P-Value Remark
Lpep -3.8833 0.0249** I (0) Lgdppc -4.6420 0.0017* I (0) Lmcap -4.0329 0.0546*** I(0) LBCP -4.5740 0.0001* I(0) Lpi -4.8305 0.0016* I(0) LRer -3.8218 0.0497** I(0) LInf -7.4833 0.0000* I(0)
Note: * significant at 1%, ** significant at 5%, ***significant at 10%
From the results in table 1 above, the null hypothesis of the test is that all panels contain unit root while the
alternative hypothesis is that panels do not contain unit root. From the P-values it is evident that all the panels are
stationary though at different levels of significance. Except for market capitalisation that is significant at 10
percent level of significance all the other variables are significant at 1 percent and 5 percent significance level.
5.1.2 Correlation and Multicollinearity Results
Table 8. Correlation Matrix
LPEP LGDPPC LBCP LPI INF RER LMCAP
LPEP 1 LGDPPC 0.1358 1 LBCP 0.7121 -0.2661 1 LPI 0.5017 -0.0957 0.886 1 INF -0.0628 0.1394 -0.1407 -0.0389 1 RER -0.4233 -0.0482 -0.0392 0.0916 -0.2556 1 LMCAP 0.5468 0.3108 0.8421 0.7506 -0.3804 0.0104 1
Table 8 above shows that a negative relationship exists between private equity penetration and inflation and also
between private equity penetration and real exchange rate. This indicates that an increase in private equity

http://ibr.ccsenet.org International Business Research Vol. 13, No. 1; 2020
200
penetration is associated with a decrease in these variables. It is also observed that a negative correlation exists
between GDP per capita and bank credit to private sector; private investments and GDP per capita while a
positive relationship exists between GDP per capita, inflation and market capitalisation. The relation between
banking credit to private sector and other independent variables show that there is a positive relationship existing
between banking credit to private sector and private investment and market capitalisation while the relationship
between banking credit to private sector, inflation and real exchange rate is negative.
The magnitude of the correlation between the independent variables can also act as a prelude to detect the
presence of multicollinearity. It is observed from the table that highest correlation coefficient (0.8) exist between
banking credit to private sector and private investments and between banking credit to private sector and market
capitalisation. This may mean the existence of multicollinearity between banking credit to private sector and
these variables. To support this, the VIF results are presented in Table 9 below.
Table 9. Multicollinearity Results
Variable VIF 1/VIF
LBCP 8.07 0.123912 LPI 6.43 0.155642 LMCAP 4.85 0.206134 INF 1.62 0.617954 LGDPG 1.28 0.783656 RER 1.27 0.786867
Mean VIF 3.92
The results show that the highest VIF occurs for banking credit to private sector with a value of 8.07 followed by
private investments. The average VIF is 3.92. This is less than the maximum recommended VIF value of 10 and
5 by Hair (1995) and Ringle (2015) respectively. Therefore, our VIF shows that multicollinearity is not a major
issue in our models.
5.1.3 Results for Autocorrelation
Table 10. Wooldridge and Wald Autocorrelation Test Results
Wooldridge Wald
Dependent Variable F-Statistics P-Value F-Statistics P-Value
PEP model (4.8) 229.662 0.0001 133.82 0.000*
* Significant at 1 percent
The P-values of the Wooldridge and Wald tests for the private equity model is significant at 1 percent significant
level indicating the presence of AR (1). Thus in the Panel Corrected Standard Errors and Feasible Generalised
Least Squares analyses this is taken in to consideration.
5.1.4 Results of Cross Sectional Independent
The test results using the fixed effect and random effect analyses is presented table 11 below.
Table 11. Pesaran and Friedman cross sectional independence Test Results
RE FE
Test statistics P-Value Test statistics P-Value
Pesaran 9.181 0.0000 9.729 0.0000* Friedman 57.918 0.0000 57.459 0.0000* Average absolute value of the off-diagonal elements 0.726 0.769
* Significant at 1 percent
The Pesaran and Friedman tests strongly reject the null hypothesis of no cross-sectional dependence. The
average absolute correlation of the residuals is 0.726 and 0.769 for the RE and FE respectively. These values are
very high thus suggesting the presence of cross-sectional dependence under both the FE and RE specifications.

http://ibr.ccsenet.org International Business Research Vol. 13, No. 1; 2020
201
5.1.5 Heteroskedasticity Test
Table 12. Breusch-Pagan Heteroskedasticity Test Results
PEP model F-statistics = 21.37 Prob. F(5, 70) 0.0000*
* Significant at 1 percent
From table 12 above, the p-value is significant at 1 percent significance level. Therefore, we fail to accept the
null hypothesis that their error terms are homoskedastic and accept the alternative hypothesis that they are
heteroskedastic. Therefore this confirms the existence of heteroskedasticity.
5.1.6 Results of Model Identification
Table 13. Anderson canon correlation LM Statistic and Sargan-Hansen Identification Test Results
PEP model
Statistics P-Value
Anderson canon. corr. LM statistic 32.736 0.0000* Sargan statistic 1.596 0.2065
* Significant at 1 percent
The p-value of the Anderson canon correlation LM statistic is significant at 1 percent significance level.
Therefore the null hypothesis that the model is underidentified is rejected. . Similarly, the P-value of the Sargan
Statistic is insignificant at 5 percent significance level. Therefore we fail to reject the null hypothesis that the
over-identifying restrictions are not valid. Therefore, there is no model under-identification problem. This means
that the instruments used in the estimation are valid.
5.1.7 Endogeneity Test Results
Table 14. Sargan-Hansen Endogeneity Test Results
PEP model (Equation 4.8) Sargan statistic =0.950 Chi-sq(2) P-val = 0.3297
The null hypothesis is that the independent variables are exogenous and the alternative is that private equity
penetration is endogenous. Since the P-value is insignificant, we accept the null hypothesis that the independent
variables in the model are exogenous and conclude that there is no endogeneity issue in this study.
5.2 Regression Results
Columns 1, 2, 3 below show the regression results using the panel Two Stage Least Squares Instrumental
Variable (2SLS IV), Panel Corrected Standard Errors (PCSE) and Feasible Generalised Least Squares (FGLS)
estimation techniques respectively. The results taking in to consideration the presence of autocorrelation of order
one (AR(1)) are estimated using both the PCSE and the FGLS estimation techniques.
Table 15. Panel 2SLS IV, PCSE and FGLS Estimation Results
Panel 2SLS IV PCSE FGLS
Coefficient (standard error)
Coefficient (standard error)
Coefficient (standard error)
LMCAP 0.30863* (0.158538)
0.282218** (0.0362206)
0.2612078** (0.0379066)
LGDPPC 0.635354* (0.393294)
0.804604* (0.0935532)
0.712851* (0.0965029)
LBCP 0.828666* (0.453078
0.905849 (0.1568122)
0.958079* (0.06806822)
LPI 1.181726*** (0.258733)
0.258972*** (0. 0.004679)
0.428734 (0.3349939)
LNF -0.00772 (0.01182)
-0.00347** (0.012356)
-0.02589** (0.0125753)
LRER -0.01893* (0.010134)
-0.01667*** (0.0035529)
-0.01515*** (0.0055495)
Constant 0.282218 (0.8440299)
11.29616 (1.420091)
R – Square Centered = 0.3170 0.7867 F( 6, 69) = 5.44

http://ibr.ccsenet.org International Business Research Vol. 13, No. 1; 2020
202
*** 1% level of significance, * 10% level of significance, ** 5% level of significance
6. Discussion of Regression Results
From Table 15 above, our PEP model is well fitted as shown by F-test. The coefficient of determination R-square
of the PCSE and FGLS model shows that about 78 percent of variations in private equity penetration is
explained by the joint effect of all the variables in the model. This is an indication that the PEP model has a good
fit.
The results using the three estimators (2SLS IV, Panel Corrected Standard error [PCSE] and Feasible
Generalised Least Squares [FGLS]) show that the coefficient of stock market capitalisation is positive. This
means that an increase in stock market capitalisation will lead to an increase in private equity penetration. In
quantitative terms, the results of the 2SLS, IV estimator show that a 1 percent increase in stock market
capitalisation will lead to a 0.30863 percent increase in private equity penetration. This positive effect is
statistically significant at 10 percent level of significance. In quantitative terms, the results of the Panel
Corrected Standard error and Feasible Generalised Least Squares estimation techniques show that 1 percent
increase stock market capitalisation will lead to a 0.2822 percent increase in private equity penetration in the
PCSE model and 0.26121 percent in FGLS model. This positive effect is statistically significant at 5 percent
level of significance. These findings are supported by a priori expectation, modern portfolio theory,
Neo-classical of investment behaviour and the findings of Groh and Liechtenstein (2010), Clarysse et al. (2009),
Aizenman and Kendall (2008), Kelly (2012), Cherif and Gazdar (2011), Félix et al. (2013), Oino (2014), Bernoth
and Colavecchio (2014) and Oni (2017. This result is inconsistent with the finding of Oino (2014). From our
findings, a strong capital market creates a favourable environment for PE exits through initial public offerings
and the provision of valuation data for Merger and Acquisition deals.
The coefficient of GDP per capita is positive for the three specifications. This means that an increase in GDP per
capita will lead to an increase in private equity penetration. Specifically, the result of the 2SLS, IV shows that a 1%
increase in GDP per capital will lead to a 0.635354 percent increase in private equity penetration. This effect is
statistically significant at 10 percent level of significance. Using the PCSE and FGLS specifications, a 1 percent
increase in GDP per capita will lead to a 0.804604 percent increase in private equity penetration for the PCSE
model and 0.712851 percent for the FGLS model. This effect is statistically significant at 10 percent level of
significance. The findings of the three techniques are consistent with the theoretical expectation, supported by
the demand side of the Neo-Classical investment behaviour theory and consistent with the finding of Bernoth
and Colavecchio (2014). From the findings, we can argue that when an individual’s real national income
increases his purchasing power and demand for goods and services also increase.
The coefficient of banking credit to private sector is also positive for the three specifications. This means that an
improvement in banking credit to private sector will lead to an increase in private equity penetration. However,
the results using the 2SLS IV estimation technique show that a 1 percent increase in banking credit to private
sector will lead to a 0.828666 percent increase in private equity penetration. This result is statistically significant
at 10 percent level of significance. The results using the using the PCSE and FGLS estimation techniques show
that, a 1 percent increase in banking credit to private sector will lead to a 0.905849 percent increase in private
equity penetration for the PCSE model and 0.958079 percent for the FGLS model. This result is statistically
significant at 10 percent level of significance for the FGLS model and insignificant at the 10 percent level of
significance for the PCSE Model. These three results are in accordance with theoretical expectations and the
demand side of the neo-classical investment theory. The results using the 2SLS IV and FGSL are consistent with
the findings of Guler and Guillén (2010). From our findings we posit that when productive credit is granted, it
increases productivity and subsequently companies that will need to expand their productive capacities will
demand more private equity funding.
Private Investment has a positive effect on private equity penetration for the three specifications. This means that
an increase in private investments will lead to an increase in private equity penetration. In quantitative terms
using the 2SLS IV estimator, a 1 percent increase in private investments will lead to a 1.18172 percent increase
in private equity penetration. This result is statistically significant at 1 percent level of significance indicating
that private investment is an important variable that determines private equity penetration in the selected
countries. In quantitative terms using the PCSE and FGLS estimators, a 1 percent increase in private investments
will lead to a 0.258972 percent increase in private equity penetration for the PCSE model and 0.428734 percent
in the FGLS model. This result is statistically significant at 1 percent level of significance for the PCSE model
and statistically insignificant at all levels of significance according to the FGLS model. The findings of all the

http://ibr.ccsenet.org International Business Research Vol. 13, No. 1; 2020
203
three models are consistent with economic a priori expectation and the theory of neo-classical investment
behaviour. From our results, we can posit that these countries use private equity funding to finance private
investments in the form of gross domestic fixed capital formation.
The coefficient of inflation is negative for all the three estimation techniques. This means that an increase in the
inflation will lead to a decrease in private equity penetration. Specific to the 2SLS IV estimator, an increase in
inflation by 1 percent will lead to a 0.00772 percent decrease in private equity penetration. However, this result
is statistically insignificant at 10 percent level of significance. Specific to the PCSE and FGLS estimators, an
increase in inflation by 1 percent will lead to a -0.00347 percent decrease in private equity penetration for the
PCSE model and -0.0258 percent for the FGLS model. However, this result is statistically significant at 5 percent
level of significance for PCSE and FGLS models. These findings are consistent with a priori expectations, the
supply side of the theory of investment behaviour and the modern portfolio theory. The finding using the 2SLS
IV estimator is consistent with the findings with the findings of Bernoth and Colavecchio (2014) who found
inflation to have a significant effect on private equity activity. The findings using the PCSE and FGLS are also
inconsistent to that of Bernoth and Colavecchio (2014). From the results, we can posit that high inflation rates
adversely affect private equity penetration in these countries as it increases investment risks and reduces
investment returns due to difficulties to make projections.
The coefficient of real exchange rate is also negative for the three specifications. This means that an increase in
exchange rate uncertainty will lead to a decrease in private equity penetration. Specific to the 2SLS IV estimator,
an increase in exchange rate uncertainty by 1 percent will lead to a 1.893 percent decrease in private equity
penetration. This result is statistically significant at 10 percent level of significance. Specific to the PCSE and
FGLS specifications, an increase in exchange rate by 1 percent will lead to a -0.01667 percent decrease in
private equity penetration for the PCSE model and -0.0151 percent for the FGLS model. This result is
statistically significant at 1 percent level of significance for both PCSE and FGLS models. These finding are in
accordance with a priori expectation, neo-classical investment behaviour and modern portfolio theories. From
our findings, we can argue that real exchange rate uncertainty is a common characteristic of the selected
countries because of their underdeveloped financial systems. Private equity investors are known to react
negatively to currency risks.
7. Conclusions and Policy Recommendations
From the findings, the signs of all the variables using the three specifications are the same though the magnitudes
are different. However, inflation is insignificant using the 2SLS estimation technique and significant in the PCSE
and FGLS models. It can also be observed that in terms of PCSE and FGLS estimation techniques used, banking
credit to private sector is insignificant in the PCSE model while private investments is insignificant in the FGLS
model. GDP per capita, real exchange rate, stock market capitalisation are significant using the three estimation
techniques. The findings showed that stock market capitalisation, GDP per capita, banking credit to private
sector and private investments had significant and positive effects on private equity penetration and should be
considered as important drivers of private equity penetration in the selected African countries. On the other hand,
real exchange rates and inflation had significant and negative effects on private equity penetration and should
equally be considered as important drivers of private equity penetration in the selected Sub-Sahara Countries.
This means that these variables should be considered by policy makers when discussing and implementing
policies that will increase and promote private equity penetration/activity in these countries.
On stock market capitalisation, policy makers should formulate and implement policies that will increase the
number of listed companies by setting listing requirements based on businesses sizes. This is in order to give
every business the opportunity to participate in stock market activities. A rigorous education and marketing
campaign on the advantages of listing should follow including the Diaspora. On the improvement of GDP per
capital, we recommend these governments to have favourable macroeconomic environments that will increase
productivity. On banking credit to the private sector, we suggest that these governments should formulate
policies that will increase the development of micro-credit institutions as they are known to grand micro-credits
of a majority of their populations than commercial banks. In terms of inflation, we recommend that policy
makers in these countries should maintain inflation at threshold levels by urging their central banks to pursue
inflation targeting. The outcome of this targeting should be to keep inflation at a lower rate in order to ensure
macroeconomic and financial stability. On real rate of exchange, we recommend that the central banks of these
countries should take measures to stabile the exchange rate of their currencies in order to ensure exchange rate
certainty. To promote private investments in these countries, we recommend that these countries should ensure
friendly business environments. This could be done by taking and implementing measures that will eliminate
corruption and political patronage in government decision making. They should also Fast-track the

http://ibr.ccsenet.org International Business Research Vol. 13, No. 1; 2020
204
computerisation of government processes.
Acknowledgements
We are grateful to the secretary general of the Douala Stock Exchange for his enormous contribution during the
process of data collection.
References
Africa Private Equity and Venture Capital Association. (March, 2019). Annual private equity data tracker.
Retrieved from
https://www.avca-africa.org/research-publications/data-reports/2018-annual-african-private-equity-data-trac
ker
Aizenman, J., & Kendall, J. (2012). The internationalization of venture capital. Journal of Economic Studies,
39(5), 488-511. https://doi.org/10.1108/01443581211259446
Beck, N., & Katz, J. N. (1995). What to do (and not to do) with time-series cross-section data. American
Political Science Review, 89(3), 634-647. https://doi.org/10.2307/2082979
Belke, A. H., Fehn, R., & Foster-McGregor, N. (2003). Does venture capital investment spur employment
growth? Journal of Venturing, 56(3), 232-248. Retrieved from
https://EconPapers.repec.org/RePEc:vie:viennp:0303
Bernoth, K., & Colavecchio, R. (2014). The macroeconomic determinants of private equity investment: a
European comparison. Applied Economics, 46(11), 1170-1183.
https://doi.org/10.1080/00036846.2013.866306
Cherif, M., & Gazdar, K. (2011). What drives venture capital investments in Europe? New results from a panel
data analysis. Journal of Applied Business and Economics, 12(3), 122-139.
Clarysse, B., Knockaert, M., & Wright, M. (2009). Benchmarking UK venture capital to the US and Israel: what
lessons can be learned. Report for British private equity and venture capital association.
Cressy, R., Munari, F., & Malipiero, A. (2007). Playing to their strengths? Evidence that specialization in the
private equity industry confers competitive advantage. Journal of Corporate Finance, 13(4), 647-669.
Ernst & Young. (2018). How to make Sense today of private equity. Retrieved from
www.ey.com/en_gl/private-equity/how-to-make-sense-of-today-s-private-equity-market
European Venture Capital Association. (2013). Exploring the Impact of Private Equity on Economic Growth in
Europe. Frontier Economics Ltd, London.
Félix, E. G. S., Pires, C. P., & Gulamhussen, M. A. (2013). The determinants of venture capital in Europe.
Evidence across countries. Journal of Financial Services Research, 44(3), 259-279.
https://doi.org/10.1007/s10693-012-0146-y
Groh, A. P., von Liechtenstein, H., & Lieser, K. (2010). The European venture capital and private equity country
attractiveness indices. Journal of Corporate Finance, 16(2), 205-224.
https://doi.org/10.1016/j.jcorpfin.2009.09.003
Guler, I., & Guillén, M. F. (2010). Institutions and the internationalization of US venture capital firms. Journal of
International Business Studies, 41(2), 185-205. https://doi.org/10.1057/jibs.2009.35
Hair, J. F., Anderson, R. E., Tatham, R. L., & Black, W. C. (1995). Multivariate dataanalysis with readings.
Englewood Cliff, NJ: Prentice.
International Monetary Fund. (2015). Making Public Investment More Efficient. Policy paper.
https://doi.org/10.5089/9781498344630.007
Jorgenson, D. W. (1971). Econometric studies of investment behavior: A survey. Journal of Economic Literature,
9(4), 1111-1147.
Kelly, R. (2012). Drivers of private equity investment activity: are buyout and venture investors really so
different? Venture Capital, 14(4), 309-330. https://doi.org/10.1080/13691066.2012.688494
Leamon, A., & Lerner, J. (2011). Creating a venture ecosystem in Brazil: FINEP's INOVAR Project. Harvard
business school.
Markowitz, H. (1952). Portfolio selection. The Journal of Finance, 7(1), 77-91.
https://doi.org/10.1111/j.1540-6261.1952.tb01525.x

http://ibr.ccsenet.org International Business Research Vol. 13, No. 1; 2020
205
Ministry of the Economy, Planning and Regional Development. (2013). Investing in Cameroon
Modigliani, F., & Miller, M. H. (1958). The cost of capital, corporation finance and the theory of investment. The
American, 1, 3.
Molatlhwe, L. (2015). Private equity growth in emerging markets: a South African case study (Master’s thesis,
University of Pretoria, South Africa). Retrieved from
https://repository.up.ac.za/bitstream/handle/2263/52261/Molatlhwe_Private_2016.pdf?sequence=1
Myers, S. C. (1984). The capital structure puzzle. The Journal of Finance, 39(3), 574-592.
https://doi.org/10.1111/j.1540-6261.1984.tb03646.x
Njubi, T. W. (2018). Factors that influence venture capitalist’s decision in funding Small Medium Enterprises in
Kenya (Masters thesis, Strathmore University, Nairobi, Kenya). Retrieved from
https://pdfs.semanticscholar.org/2030/ab5ddd91561a7223171ba91ca18eb4ae73c1.pdf
Oino, I. (2014). The macroeconomic and environmental determinants of private equity in emerging Asia market:
The application of extreme bounds analysis. Journal of Investment and Management, 3(3), 51-60.
https://doi.org/10.11648/j.jim.20140303.12
Oni, O. (2017). Determinants of Venture Capital Supply in Sub-Saharan Africa. Journal of Economics and
Behavioral Studies, 9(4), 87-97. https://doi.org/10.22610/jebs.v9i4.1824
Owusu-Adjei, K. (2010). A survey of the Ghanaian private equity industry and its contribution to private
sector development (Bachelor’s Thesis, University of Ghana). Retrieved from
http://hdl.handle.net/20.500.11988/157
Parks, R. W. (1967). Efficient estimation of a system of regression equations when disturbances are both serially
and contemporaneously correlated. Journal of the American Statistical Association, 62(318), 500-509.
https://doi.org/10.1080/01621459.1967.10482923
Ringle, C., Da Silva, D., & Bido, D. (2015). Structural equation modeling with the Smart PLS. Brazilian Journal
Of Marketing, 13(2). https://doi.org/10.5585/remark.v13i2.2717
Securities and Exchange Commission. (2016). Trends in Private Equity Market. SEC Learning series.
Yan, J. (2011). Merger waves: Theory and evidence. The Quarterly Journal of Finance, 1(03), 551-606.
https://doi.org/10.1142/S201013921100016X
Copyrights
Copyright for this article is retained by the author(s), with first publication rights granted to the journal.
This is an open-access article distributed under the terms and conditions of the Creative Commons Attribution
license (http://creativecommons.org/licenses/by/4.0/).