Embed Size (px)
DESCRIPTION
Macroeconomic Demography of Intergenerational Transfers. Andrew Mason University of Hawaii and East-West Center Ronald Lee University of California - Berkeley. Project Objectives. Develop a system of aggregate accounts that measures economic flows across age groups - PowerPoint PPT Presentation
Citation preview

March 2005 Andrew Mason, East-West Center
Macroeconomic Demography of Intergenerational Transfers
Andrew Mason
University of Hawaii and East-West Center
Ronald Lee
University of California - Berkeley

March 2005 Andrew Mason, East-West Center
Project Objectives
• Develop a system of aggregate accounts that measures economic flows across age groups
• National Transfer Flow Accounts – Market and non-market transactions– Public and private (familial)– Asset flows (capital, credit, land)– Transfers

March 2005 Andrew Mason, East-West Center
Project Objectives
• Estimate current and historical accounts in varying social, economic, and political contexts
• Develop projection models that can be used to assess the effects of economic change, aging, family systems, and public policy
• Study the evolution of support systems• Study the macroeconomic consequences of
aging and alternative support systems
March 2005 Andrew Mason, East-West Center
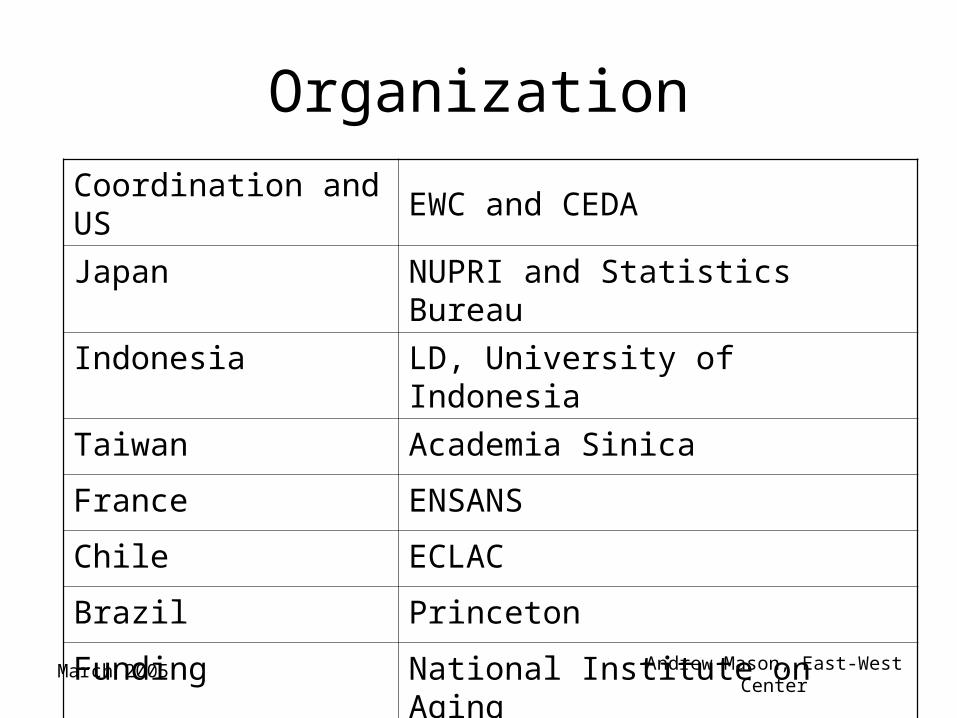
Organization
Coordination and US EWC and CEDA
Japan NUPRI and Statistics Bureau
Indonesia LD, University of Indonesia
Taiwan Academia Sinica
France ENSANS
Chile ECLAC
Brazil Princeton
Funding National Institute on Aging
March 2005 Andrew Mason, East-West Center
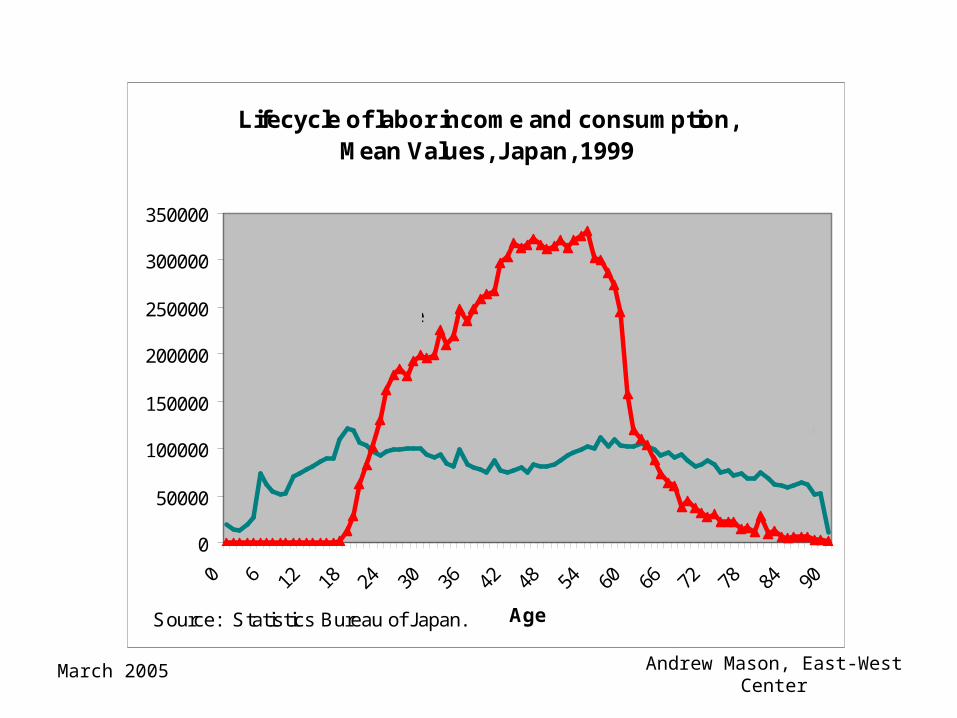
Lifecycle of labor income and consumption, Mean Values, Japan, 1999
0
50000
100000
150000
200000
250000
300000
350000
0 6 12 18 24 30 36 42 48 54 60 66 72 78 84 90
AgeSource: Statistics Bureau of Japan.
Consumption
Labor Income

March 2005 Andrew Mason, East-West Center
Lifecycle of labor income and consumption, Aggregate Values, Japan, 1999
0
2000
4000
6000
8000
10000
12000
14000
0 6 12 18 24 30 36 42 48 54 60 66 72 78 84 90
AgeSource: Statistics Bureau of Japan.
Consumption
Labor Income

March 2005 Andrew Mason, East-West Center
Lifecycle Deficit, Aggregate Values, Japan, 1999
-8000
-6000
-4000
-2000
0
2000
4000
6000
AgeSource: Statistics Bureau of Japan.
Deficits
Surplus

March 2005 Andrew Mason, East-West Center
NT Flow Account, Aggregate. Taiwan, 1998 (NT$ billion), nominal
Age
Total 0-19 20-29 30-49 50-64 65+
Lifecycle Deficit 832 1,704 7 -1,329 25 424
Consumption 6,570 1,775 1,163 2,376 757 499
Private 5,290 1,244 951 2,040 640 414
Public 1,280 531 212 335 117 85
Less: Labor income 5,738 70 1,156 3,704 732 75

March 2005 Andrew Mason, East-West Center
Issues
• Consumption age profile– Available estimation methods problematic
(Engel, Rothbarth, collective models)
– Education and health can be reliably estimated
• Productivity age profile – Earnings may not reflect age variation in
productivity– Seniority wage system in Japan, for example.

March 2005 Andrew Mason, East-West Center
Table 1. A Classification of NTA Reallocations.
Asset Reallocations
TransfersCapitalProperty and
Credit
PublicPublic infrastructure
Public debtStudent loans
Money
Public educationPublic health careUnfunded pension
plans
Private
HousingConsumer durablesFactories
FarmsInventories
Consumer creditInsurance
Land
Familial support of children and parentsBequestsCharitable contributions
Source: Adapted from Lee 1994.

March 2005 Andrew Mason, East-West Center
NT Flow Account, Aggregate. Taiwan, 1998 (NT$ billion), nominal
Age
Total 0-19 20-29 30-49 50-64 65+
Lifecycle Reallocations 832 1,704 7 -1,329 25 424
Asset Reallocations 861 -5 -101 414 271 282
Income on Assets 2,456 4 175 1,539 528 211
Less: Saving 1,595 9 276 1,126 256 -72
Transfers -29 1,710 108 -1,742 -246 141
Public 2 611 51 -673 -103 116
Private -31 1,099 -18 -1,155 -52 95
Bequests 0 0 75 86 -91 -70

March 2005 Andrew Mason, East-West Center
Components of Age ReallocationsAggregate values, Taiwan, 1998
-150
-100
-50
0
50
100
150
0 10 20 30 40 50 60 70 80 90+
Age
Re
all
oc
ati
on
s (
$N
T
bil
lio
ns
) .
Bequests Private Transfers Public Transfers Asset Reallocation
Total Inflow
Total Outflow

March 2005 Andrew Mason, East-West Center
Components of Reallocations Mean Values, Taiwan, 1998
-400
-300
-200
-100
0
100
200
300
400
0 10 20 30 40 50 60 70 80 90+
Age
Reallo
cati
on
s (
$N
T 0
00s)
.
Bequests Private Transfers Public Transfers Asset Reallocation
Total Inflow
Total Outflow

March 2005 Andrew Mason, East-West Center
Components of ReallocationsAggregate Values, US, 2000
-150
-100
-50
0
50
100
150
0 10 20 30 40 50 60 70 80 90+
Age
Re
all
oc
ati
on
s (
$U
S
bil
lio
ns
) .
Bequests Private Transfers Public Transfers Asset Reallocation
Total Inflow
Total Outflow

March 2005 Andrew Mason, East-West Center
Components of Reallocations Mean values, US, 2000
-40000
-20000
0
20000
40000
60000
80000
0 10 20 30 40 50 60 70 80 90+
Age
Re
all
oc
ati
on
s (
$U
S)
.
Bequests Private Transfers Public Transfers Asset Reallocation
Total Inflow
Total Outflow

March 2005 Andrew Mason, East-West Center
Intra-household Net Transfers, Japan 1999, Taiwan 1998, and US 2000
-150.0
-100.0
-50.0
0.0
50.0
100.0
150.0
0 10 20 30 40 50 60 70 80Age
Ne
t T
ran
sfe
rs
Japan
Taiwan
US
Note: Net Transfers are expressed as a percent of per capita private consumption. US values include inter-household private transfers. Age groups w ith positive values are net recipients. Sources: Japan Statistics Bureau and Mason, Lee, Tung, and Lai 2005.

March 2005 Andrew Mason, East-West Center
Finance of Consumption, Young Dependents (Age 0-19)
37.2 34.4
59.8 61.9
4.03.6
-20
0
20
40
60
80
100
120
USA (2000) Taiwan (1998)
Per
cen
tag
e o
f C
on
sum
pti
on
Public Transfers
Private Transfers
Work

March 2005 Andrew Mason, East-West Center
Finance of Consumption, Old Dependents (Age 65+)
35.323.3
61.842.5
-14.6 -14.1
4.4 33.2
15.113.1
-40
-20
0
20
40
60
80
100
120
140
USA (2000) Taiwan (1998)Pe
rce
nta
ge
of
Co
ns
um
pti
on
Public Transfers
Private Transfers
Work
Bequests
Asset Reallocations

March 2005 Andrew Mason, East-West Center
Concluding Comments
• Estimates are preliminary.
• Many technical issues remain.
• Early results are plausible and interesting.

March 2005 Andrew Mason, East-West Center
The End
March 2005 Andrew Mason, East-West Center
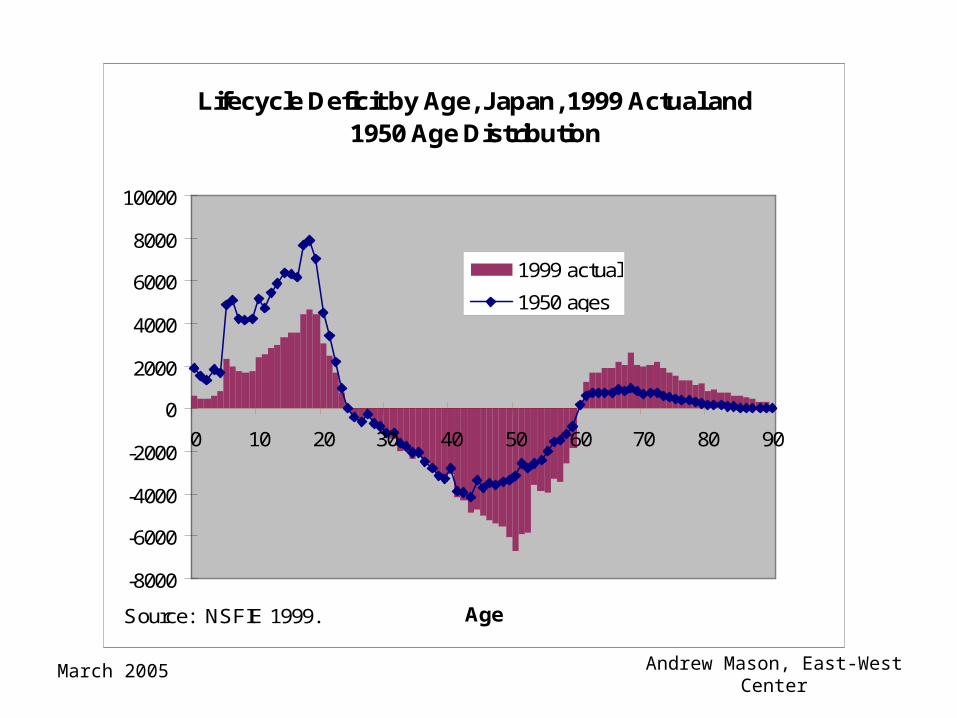
Lifecycle Deficit by Age, Japan, 1999 Actual and 1950 Age Distribution
-8000
-6000
-4000
-2000
0
2000
4000
6000
8000
10000
0 10 20 30 40 50 60 70 80 90
Age
1999 actual
1950 ages
Source: NSFIE 1999.

March 2005 Andrew Mason, East-West Center
Lifecycle Deficit by Age, Japan, 1999 Actual and 2050 Age Distribution
-8000
-6000
-4000
-2000
0
2000
4000
6000
0 10 20 30 40 50 60 70 80 90
Age
1999 actual
2050 ages
Note. Values for 2050 based on UN low fertility projection and 1999 mean profiles.