Embed Size (px)
Citation preview
Macroeconomic Case for a Land Value Tax Reform in Ireland
Dr. Constantin Gurdgiev
Trinity College, Dublin
May 2009
______________________________________________________________________________
Note: The present report was compiled as a part of the early stage research project supported by the Feasta
‘Smart Taxes’ Network working with the Urban Forum, DIT, School of Philosophy and Economics and the
the Land Resource Research Group.
All errors and omissions are author’s own.
Author contact information:
Dr Constantin Gurdgiev
School of Business
Trinity College, Dublin
Dublin 2, Ireland
2
Executive Summary
Land Value Tax is defined as an annual tax or charge on the rental value of the land occupied by the site or
a property. LVT can apply either in a flat rate fashion or on the basis of the zoning of land. As such, LVT is
not a transaction-based tax, but a tax levied on the value of the land.
This study shows that other forms of property taxation deliver three major disadvantages relative to LVT:
• Property taxes, unlike LVT, penalize more sustainable use of land suitable for development,
thereby encouraging land speculation and discouraging efficiently planned development;
• Property taxes, unlike LVT, induce significant efficiency losses in tax collection; and
• Property taxes do not deliver a direct public return to publicly-financed infrastructure and
public/social amenities investments. LVT does provide exactly such a mechanism for capturing a
share of private windfalls accruing to land owners arising from public investments.
In light of the collapse in property boom it is now apparent that the existent structure of property taxation in
Ireland no longer represents a viable environment. In particular, the existent system based on transaction
taxes presents a set of major shortcomings from economic and fiscal points of view. These are:
• disincentivising sustainable use of land in development and encouraging speculative holding and
rezoning of land, while creating artificial constraints on supply of land suitable for development;
• increasing potential for tax avoidance, grey markets transactions and corruption;
• reducing market turnover in resale properties and the liquidity of household wealth;
• contributing to asset price bubble emergence, inflation and collapse in the real estate markets;
• reducing life-cycle investments in human capital, social capital and other economically important
activities, reducing pensions and savings provisions;
• levies unnecessarily high burden of taxation on personal income.
The problematic aspects of the existent system of taxation are contrasted by the positive effects of LVT
reform on the aforementioned incentives and economic mechanisms.
From the fiscal policy point of view, the existent transactions-based system of property taxation reduces
fiscal policy capabilities to act as countercyclical economic stabilizer. Stamp duty types of taxation on
property induce greater volatility to fiscal policy and stronger pro-cyclicality of tax revenue, reduce
planning and forecasting accuracy for fiscal and economic policies and increase the volatility of Exchequer
revenues, while reducing the level of tax receipts.
The present study shows that LVT reform satisfies the set of main criteria for reforming existent system of
property taxation must include the following considerations. The reformed system will:
3
1. Improve macroeconomic stability and support economic growth with specific focus on higher
value-added development activities and provision of quality housing, commercial property and
infrastructure consistent with creation of sustainable high quality employment, skills acquisition
and investment in human and productive physical capital;
2. Increase efficiency of resource allocation, as pertaining to development and property;
3. Reduce adverse impacts of property taxation on economic and social inequality, inclusive of
addressing the issues of social exclusion;
4. Support environmental sustainability of development and enhance social capital;
5. Simplify the tax system and make it more transparent and reduce incentives for corruption,
operations of grey markets and tax evasion;
6. Introduce change gradually so as to avoid disruption of existent contractual arrangements and not
cause dramatic shifts in economic expectations;
7. Allow and encourage coordination of tax policies with other reforms;
8. Achieve political feasibility without creating a single narrow interest constituency.
The present research provides initial quantitative and qualitative analysis of these objectives. To this,
section 2 addresses the issues of asset price bubble formation in the presence of transaction-related taxation
(i.e stamp duty). Section 3 outlines the specific risks from transaction tax on property to the Exchequer
revenue generation and briefly outlines the impact of the current taxation system on macroeconomic
development and public infrastructure investments. Section 4 deals briefly with the problems of budgetary
uncertainty and forecasting errors for Exchequer revenue. Section 5 defines Land Value Tax and briefly
outlines main points of proposed reforms, while section 6 deals briefly with the revenue-smoothing
properties of the LVT. Section 7 addresses the main socio-economic problems and advantages associated
with different forms of property taxation regime, including issues of social equity and environmental
impact. We also outline and briefly address the traditional objections levied against the Land Value Tax.
Section 8 concludes.
The present research paper is not designed to provide specific calculations of exact rates to be applied to
taxing land/site values. This objective is reserved for a subsequent study and is perhaps best suited for the
work of the Commission on Taxation. We expect the outcome of the two-stage Delphi survey project
designed to survey attitudes of various social, economic, business and political interest groups on how Land
Value Tax reform can be
• Structured and integrated into existent system of taxation, and transitioned into practice; and
• Used to replace (as a substitute) and supplement (as a complement) the existent tax heads; and
Analysis of the Delphi survey results will be incorporated in the follow-up study to the present submission
to be delivered in the beginning of June.
4
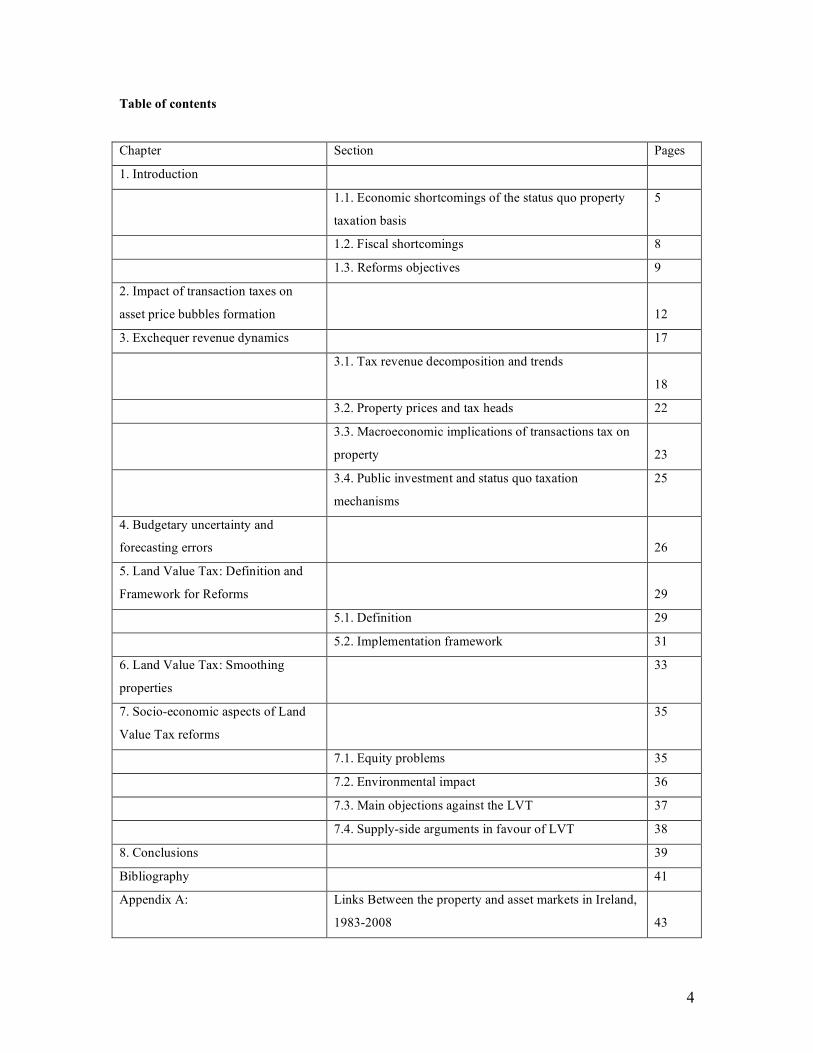
Table of contents
Chapter Section Pages
1. Introduction
1.1. Economic shortcomings of the status quo property
taxation basis
5
1.2. Fiscal shortcomings 8
1.3. Reforms objectives 9
2. Impact of transaction taxes on
asset price bubbles formation
12
3. Exchequer revenue dynamics 17
3.1. Tax revenue decomposition and trends
18
3.2. Property prices and tax heads 22
3.3. Macroeconomic implications of transactions tax on
property
23
3.4. Public investment and status quo taxation
mechanisms
25
4. Budgetary uncertainty and
forecasting errors
26
5. Land Value Tax: Definition and
Framework for Reforms
29
5.1. Definition 29
5.2. Implementation framework 31
6. Land Value Tax: Smoothing
properties
33
7. Socio-economic aspects of Land
Value Tax reforms
35
7.1. Equity problems 35
7.2. Environmental impact 36
7.3. Main objections against the LVT 37
7.4. Supply-side arguments in favour of LVT 38
8. Conclusions 39
Bibliography 41
Appendix A: Links Between the property and asset markets in Ireland,
1983-2008
43
5
1. Introduction
In light of the collapse in property boom in the late 2007-early 2008, it is now apparent that the existent
structure of property taxation in Ireland no longer represents a viable environment. In particular, the
existent system based on transaction taxes in the property markets (a stamp duty for existent dwelling, a
VAT on newly built properties, and a series of development levies and charges, inclusive of the social
housing provision requirement) presents the following shortcomings from economic and fiscal points of
view:
1.1 Economic shortcomings of the status quo property taxation system:
1. Disincentivising intensive and sustainable use of land in development, agriculture and for
recreational use (by CSO estimates, as of Q4 2008, there were over 200,000 vacant or unoccupied
residential properties in the Republic – well over 10% of the entire stock of housing);
2. Encouraging speculative holding and rezoning of land (exemplified by the recent-vintage land-
banks with expected default rates estimated at 44% (Davy, 2009) to over 50% (Gurdgiev and
Lucey, 2009), this contrasts estimated default rates for the UK land banks of 24%);
3. Creating artificial constraints on supply of land suitable for development (at the height of the
property boom, planning restrictions – enforced often in a non-transparent fashion - and
uncertainty, alongside demand for speculative assets have resulted in a rise of the site value
relative to the final property price from 15% in the mid 1990s to well over 50% in 2006-2007);
4. Inflation of land prices and taxation regime relating to property have led to an unprecedented rise
in the cost of housing in Ireland with a situation whereby even taking into account the recent
increases in housing affordability, a family with two average wage earners cannot afford to
purchase homes that are in hedonic terms comparable with the standard of housing available to
their counterparts in other parts of Europe and in the OECD countries.
5. Increasing potential for tax avoidance, grey markets transactions and corruption (numerous
scandals involving local corruption relating to zoning and permissions to build have been
identified in the past, while there is significant anecdotal evidence that at the height of the market
activity, some buyers and sellers of properties have transacted in cash for a part of transaction so
as to avoid a shift of the underlying transaction into higher stamp duty band);
6
6. Contributing to suburban and extra-urban sprawl (Greater Dublin Area now covers the territory in
excess of the Greater Los Angeles area while housing only 1/8th of the latter population (for details
see Gurdgiev, 2006a)). In addition, there is a significant adverse impact from the existent
transactions-based tax on environmental sustainability of development, as briefly discussed in
section 7.2 below;
7. Transactions-based system of taxation cannot be used to fund infrastructure such as mass transit
systems within the built up areas, but can be used to generate infrastructure investment for green
field sites alone (using Section 48/49 of the 2000 Planning and Development Act);
8. Reducing market turnover in resale properties, resulting in the residential resale market that is
characterised by low transactions volume relative to other countries, e.g. that of the UK and US
(section 2 elaborates);
9. Reducing liquidity of wealth, especially for the elderly (at the peak of the market, it is estimated
that only 2-3% of properties sold involved the elderly owners trading down, contributing in part to
the decline in the inter-census population in areas like Dun Laoghaire. Ireland stands out as an
outlier in terms of elderly homeowners unwillingness to trade down to release equity accumulated
in their property (see Chiuri and Jappelli, 2008). This, in turn, has three adverse effects. Firstly, it
reduces liquid wealth and post-retirement income of the elderly, contributing to smaller health
expenditure and lower quality of life for the so-called ‘income-poor, asset-rich’ individuals and
families. Secondly, by compressing trade-down sales into the latter part of the asset bubble, this
contributes to more extreme debt and negative equity burden on the mid-life-cycle families trading
up. Thirdly, by reducing the number of transactions in the market, this suppresses the actually
realisable Exchequer revenue, relative to the potential revenue.);
10. Contributing to the price uncertainty and volatility in the real estate markets (Scheinkman effect of
the Tobin tax in the case of sticky assets shows that taxes on transactions for relatively illiquid
assets amplifies price bubbles by reducing, artificially supply of assets on the market, for details,
see Scheinkman and Xiong (2003) who show that in presence of significant transaction costs,
Tobin tax on asset trading will not significantly reduce speculative trading and will have only
minor impact in reducing the size of the financial bubble or price volatility of the asset (also, see
Shiller, 2000 and Gurdgiev, 2006. Section 2 below elaborates on this point.);
11. Producing a drag on early-life-cycle investment for younger households with a resultant
opportunity cost to the society and economy at large in the form of lower educational and health
investments, lower investment in children and lower long-term savings provision. Education and
7
health under-investment is the opportunity cost of housing investment as are foregone investment
in other forms of capital – human, social, business, etc. While we cannot quantify this effect for
Ireland, see Taylor (1998) for a discussion of economics of overinvestment in housing in the US;
12. Misallocation or inefficient duplication of investment in infrastructure and services as large areas
(e.g Dublin 4 and 6) become dominated by older families, empty-nesters, living beside often
underutilised schools, while children in the outer suburbs are crowded into temporary, prefab
facilities;
13. Reducing early life-cycle pensions-related savings and decreasing safety-net savings by younger
households, with a resultant higher propensity to engage in precautionary savings behaviour at the
onset of a downward correction in the economic growth by both the old and the young
generations. Over investment in housing reduces funds available for pensions and safety-net
investments. This is particularly true when there are significant upfront costs to house purchases,
as in the case of high stamp duty rates. For example, the average house price in Dublin in 2006
was around €532,000. This would imply a stamp duty cost of €32,920-39,900 up-front. The future
value of this lump sum in retirement savings account assuming 5% annualized return for an
average age worker would be ca €142,600. Current economic downturn is seeing numerous
households facing simultaneously a negative equity on their mortgage, high mortgage financing
costs relative to household income, increasing (and already high) risk of unemployment and
falling real after-tax incomes. In such environment, under-provision of cash savings yields
extremely strong incentives to engage in precautionary savings behaviour, thus withdrawing all
discretionary consumption. The knock-on effect is to reduce Exchequer revenue from VAT and
retail sector-related revenue and depress the rates of economic activity.
14. By front-loading tax expenditure, transactions taxes increase the overall economic cost of
financing fiscal spending and inflate life-cycle cost of public property. This point is covered in
detail in sections 3 and 4 below;
15. Deeper problems are created by the overall imbalance in taxation system that levies high burden of
taxation on personal income in a lump-sum fashion, thus dis-incentivising human capital
investments and productive investments to the existent stock of productive physical capital. This is
a classic argument of opportunity cost of a lump-sum upfront tax payment schemes, the point
covered in more detail in section 3.1 below.
8
1.2 Fiscal shortcomings:
1. Transactions-based system of property taxation reduces fiscal policy capabilities to act as
countercyclical economic stabilizer through two main channels (discussed in more details in
section 2 below):
a. At the time of economic slowdown, asset prices, including housing may decline generally
more than business and household income. For example, in the current recession virtually
no forecast assumes house prices declines (peak to trough) of less than 30% with some
estimates ranging up to 70% for select locations. At the same time, income declines
projections generally range in the neighbourhood of 12-17% at the aggregate level.
Likewise, expected declines in property-related rents are ranging in estimates between
15% and 25%, still below the expected declines in property prices. Thus, any revenue
directly linked to the immediate property prices is expected to undershoot income
adjustments, implying reduced ability for the Exchequer to finance existent and
expanding fiscal commitments. This represents the asset price adjustment channel for
amplifying macroeconomic shocks impact on Exchequer revenue.
b. In addition, during recessions the number of transactions will inevitably fall significantly
in excess of the declines in both income or asset prices. This is so since price-elasticity of
housing supply is relatively low (Muellbauer, 2006), while price elasticity of housing
demand is higher and this differential in elasticities is persistent over time. Falling asset
prices in housing markets tend to trigger long-term declines in prices, implying that a
rational potential buyer will delay any new purchase of any asset with substantial
transactions cost/taxes over a much more extended period of time than for other asset
classes with lower transactions cost/taxes (e.g shares). Even in other asset classes, such
delays can be significant – e.g for the recession of the early 1990s in the US, economic
recovery, having started in late 1991 failed to trigger a stock market recovery until the
early 1993. These delays in restarting housing and general property markets can be
referred to as the transaction volume adjustment channel for exacerbating the impact of
macroeconomic and asset markets shocks on revenue.
2. Stamp duty types of taxation on property induce greater volatility to fiscal policy and stronger pro-
cyclicality of tax revenue (see discussion below in sections 3.1-3.3);
3. Transactions-based property taxes reduce planning and forecasting accuracy for fiscal and
economic policies (see discussion below in section 4);

9
4. Over-reliance on transactions-based property taxation as the tool for raising Exchequer revenue
implies that whilst the ordinary taxpayers perceive a lump sum up-front tax to be non-transparent,
unfair and largely arbitrarily levied, a small number of professional property markets participants
(developers, land and property investors and property agents) have an incentive to capture the
Exchequer dependency on transactions taxes to lobby for favourable tax and development permits
regime and/or specific exemptions. On the other hand, local authorities responsible for
development (planning) permits have no specific incentive to consider any development in the
context of long-run returns. Thus, transactions-based taxation can lead to higher incidences of
corruption (official and grey), risk of inefficient investment (from public and private points of
view), incidences of more severe externalities flowing either from public sector costs to private
benefits or vice versa, and politicisation of development; and
5. Increase incentives for tax evasion and avoidance and grey-market (cash and barter) transactions,
especially around stamp duty thresholds. While impossible to quantify, tax evasion and grey-
market transactions involving property sales are assumed to exist on the basis of anecdotal
evidence and media reports. This is particularly prevalent (with ample documentation in existence)
in the cases of commercial property and developers’ efforts to maximise the legal avenues for
stamp duty avoidance, often holding completed houses vacant rather than letting them in the short
term in order to preserve stamp duty free status for first time buyers.
1.3. Reforms objectives
The set of main criteria for reforming existent system of property taxation must include the following
considerations. The reformed system must:
1. Improve macroeconomic stability;
2. Support economic growth with specific focus on higher value-added development activities and
provision of quality housing, commercial property and infrastructure consistent with and
supportive of modern economic activity, contribute to creation of sustainable high quality
employment, skills acquisition and investment in human and productive physical capital;
3. Increase efficiency of resource allocation, as pertaining to development and property-linked
resources (land, sites, density, access roads, common/shared facilities, public infrastructure and
social amenities);
10
4. Reduce adverse impacts of property taxation on economic and social inequality, inclusive of
addressing the issues of social exclusion;
5. Support environmental sustainability of development and preserve and enhance positive social
capital;
6. Simplify the system and make it more transparent and reduce incentives for corruption, operations
of grey markets and tax evasion; and reduce administration and compliance costs;
7. Introduce change gradually so as to avoid disruption of existent contractual arrangements and not
cause dramatic shifts in economic expectations;
8. Allow and encourage coordination of tax policies with other reforms, e.g shifting the burden of
taxation away from personal income, introducing transparent and stable system of land-use
planning etc;
9. Achieve political feasibility without creating a single narrow interest constituency (e.g without
alleviating the interest of a single group, such as land owners or property owners, over the needs
and rights of the rest of the society).
The present research provides initial quantitative and qualitative analysis of these objectives. While
comprehensive research into all of the above reform objectives is beyond the scope of the present initial
research project, we aim to address these aspects of the proposed reform in subsequent submissions. At this
point, it suffices to state that the main thrust of the proposed reform of moving Irish taxation away from the
current reliance on transactions-based property and development taxes to Land/Site Value Taxation
mechanism will address all of the above points.
Overall, the above lists of the shortcomings of the current system (both from the economic policy – section
1.1, and fiscal policy – section 1.2, perspectives), as well as the list of desired reforms objectives (section
1.3) clearly indicate that the existent system of taxation in Ireland is broken and cannot be fixed without a
significant shift of the taxation burden off the transactions taxes to levying a charge against the
economically inert (less mobile) and less investment-intensive asset, such as land.
The evidence on Irish tax system, and in particular on property transactions taxes, shows that in line with
other countries with similar taxation structures (e.g UK and parts of the US) current tax system frustrates
11
economic development, public investment funding and reduces macroeconomic stability. It furthermore
imposes distortionary and arbitrary tax burden on households.
The UK research also shows that in the presence of either direct or transactions-based property taxes,
public infrastructure investment benefits are fully captured by the private property owners, with no return to
the Exchequer (Atisreal and Geofutures, 2005 and Riley, 2001). An additional argument to be made here,
that is not developed in the existent literature, is that transactions taxes are also likely to incentivise
suboptimally low levels of overall investment in common (public or private) and social capital (see section
3.4 below).
The present paper is designed as follows. Section 2 below addresses the issues of asset price bubble
formation in the presence of transaction-related taxation (i.e stamp duty). Section 3 outlines the specific
risks from transaction tax on property to the Exchequer revenue generation and briefly outlines the impact
of the current taxation system on macroeconomic development and public infrastructure investments.
Section 4 deals briefly with the problems of budgetary uncertainty and forecasting errors for Exchequer
revenue. Section 5 defines Land Value Tax and briefly outlines main points of proposed reforms, while
section 6 deals briefly with the revenue-smoothing properties of the LVT. Section 7 addresses the main
socio-economic problems and advantages associated with different forms of property taxation regime,
including issues of social equity and environmental impact. We also outline and briefly address the
traditional objections levied against the Land Value Tax. Section 8 concludes.
The present research paper is not designed to provide specific calculations of exact rates to be applied to
taxing land/site values. This objective is reserved for a subsequent study and is perhaps best suited for the
work of the Commission on Taxation. However, regardless of who undertakes such estimation, more
extensive consideration must be given to the specific preferences of various stakeholders in the society over
the reform of the entire system of taxation in Ireland. With this in mind, we expect the outcome of the two-
stage Delphi survey project designed to survey attitudes of various social, economic, business and political
interest groups on how Land Value Tax reform can be
• Structured;
• Integrated into existent system of taxation;
• Used to replace (as a substitute) and supplement (as a complement) the existent tax heads; and
• Transitioned into legislative framework.
Analysis of the Delphi survey results will be incorporated in the follow-up study to the present submission
to be delivered in the beginning of June.
12
2. Impact of transactions taxes on asset price bubble formation
According to a number of studies, primarily focusing on the UK, returns to property in the so-called
‘Anglo-Saxon’ and ‘Scandinavian’ economies are:
• simultaneously persistent (i.e fundamentals-driven); and
• volatile (i.e momentum-driven).
In other words, changes in commercial and residential property returns in one year tend to be followed by a
similar change in the following year. This is also confirmed in the case of Irish markets (see Appendix A
for details).
Abraham and Hendershott (1996) attributed these two properties of the real estate markets to the build-up
and subsequent deflation of asset price bubbles. In their analysis, as property prices are positively
correlated with previous changes in prices, higher capital gains tend to be followed by even higher capital
gains, generating a price bubble. In the deflation stage, property prices tend to follow declining trend for a
prolonged period of time. Thus, unlike other asset markets, property markets tend to overshoot and
undershoot the fundamentals-determined equilibrium price over much longer periods of time. This is
confirmed in a theoretical setting in Gurdgiev (2006) which also presents analysis relating to the role of the
opportunity cost of housing relative to other investments (incorporating tax rates) in determining the extent
of over- under-shooting (see the end of this section for more details).
Claesens et al (2008) extends this theoretical and spot-empirical analysis to the current global economic
environment. The study provides a comprehensive empirical characterization of the linkages between key
macroeconomic and financial variables around business and financial cycles for 21 OECD countries over
the period 1960–2007. In particular, the study analyzes the implications of 122 recessions, 112 (28) credit
contraction (crunch) episodes, 114 (28) episodes of house price declines (busts), 234 (58) episodes of
equity price declines (busts) and their various overlaps in these countries over the sample period.
The results indicate that recessions associated with credit crunches and house price busts tend to be deeper
and longer than other recessions. For example, a credit crunch episode typically lasts two-and-a-half years
and is associated with nearly a 20 percent decline in credit. A housing bust tends to persist even longer –
four-and-a-half years with a 30 percent fall in real house prices. And an equity price bust lasts some 10
quarters and when it is over, the real value of equities drops by half. In one out of six recessions, there is
also a credit crunch underway, and in one out of four recessions a house price bust. Although recessions
accompanied with severe credit crunches or house price busts last only three months longer, they typically
result in output losses two to three times greater than recessions without such financial stresses. There is
also evidence that the extent of declines in house prices appears to influence the depth of recessions, even
after accounting for the changes in other financial variables, including credit and equity prices, and various
13
other controls.
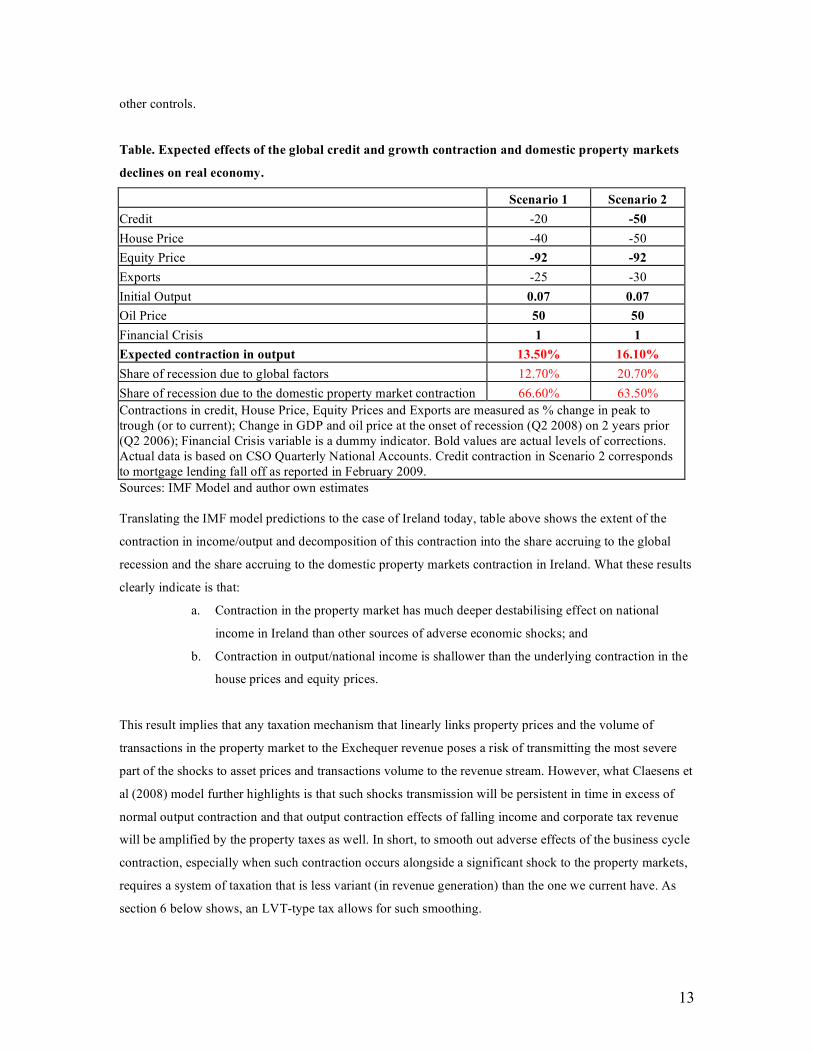
Table. Expected effects of the global credit and growth contraction and domestic property markets
declines on real economy.
Scenario 1 Scenario 2 Credit -20 -50 House Price -40 -50 Equity Price -92 -92 Exports -25 -30 Initial Output 0.07 0.07 Oil Price 50 50 Financial Crisis 1 1 Expected contraction in output 13.50% 16.10% Share of recession due to global factors 12.70% 20.70% Share of recession due to the domestic property market contraction 66.60% 63.50% Contractions in credit, House Price, Equity Prices and Exports are measured as % change in peak to trough (or to current); Change in GDP and oil price at the onset of recession (Q2 2008) on 2 years prior (Q2 2006); Financial Crisis variable is a dummy indicator. Bold values are actual levels of corrections. Actual data is based on CSO Quarterly National Accounts. Credit contraction in Scenario 2 corresponds to mortgage lending fall off as reported in February 2009. Sources: IMF Model and author own estimates Translating the IMF model predictions to the case of Ireland today, table above shows the extent of the
contraction in income/output and decomposition of this contraction into the share accruing to the global
recession and the share accruing to the domestic property markets contraction in Ireland. What these results
clearly indicate is that:
a. Contraction in the property market has much deeper destabilising effect on national
income in Ireland than other sources of adverse economic shocks; and
b. Contraction in output/national income is shallower than the underlying contraction in the
house prices and equity prices.
This result implies that any taxation mechanism that linearly links property prices and the volume of
transactions in the property market to the Exchequer revenue poses a risk of transmitting the most severe
part of the shocks to asset prices and transactions volume to the revenue stream. However, what Claesens et
al (2008) model further highlights is that such shocks transmission will be persistent in time in excess of
normal output contraction and that output contraction effects of falling income and corporate tax revenue
will be amplified by the property taxes as well. In short, to smooth out adverse effects of the business cycle
contraction, especially when such contraction occurs alongside a significant shock to the property markets,
requires a system of taxation that is less variant (in revenue generation) than the one we current have. As
section 6 below shows, an LVT-type tax allows for such smoothing.
14
The strong positive correlation in property prices implies that investors rationally expect persistent returns,
thus producing greater demand for property transactions at the times of the boom and lower demand for
such transactions at the times of the bust. This has a significant implication for the present tax regime that
relies on the taxation of transactions. According to this logic, tax revenue from stamp duties should be
rising faster in the periods of property boom than simple price inflation in property markets dictates, as
appreciation in property prices coincides with rising number of transactions. Conversely, stamp duty
revenue will be expected to decline much faster than the actual property prices in the downturn, as
transactions number falls more dramatically than price falls. This, of course, is borne out by the current data
with the latest Exchequer returns showing a 69% decline in stamps on 2008 while house prices declines
register ‘only’ around 20-30% (depending on different estimation sources) over the same period.
In addition, as some recent research suggested (Sheinkman and Xiong, 2003, Barthelemy and Prigent,
2008) property taxation reliant on Tobin-styled transaction taxes can lead to further amplification of the
asset bubble, inducing even more volatility to the tax receipts and investment activity in the property
markets.
The logic of Barthelemy and Prigent (2008) argument is that transaction tax results in a longer holding
period for assets that are less liquid (i.e property). Thus, during the boom there is a tendency for investors
to over-hold property, while during the bust part of the cycle, the same investors tend to stay out of the
property markets for much longer period of time. They estimate that a doubling of an ad-valorem tax from
5% of the value of the house sold to 10% induces increases in the holding period of ca 10%. Absence of
transaction tax implies a reselling period that is some 8% shorter than in the case of a stamp duty-type 5%
tax.
In effect, this can be viewed, from a different perspective, as a de facto decrease in the liquidity of the
property assets relative to other assets, exacerbating the overall demand for the long-term risk premium to
the asset, thus further amplifying the boom-bust cycles. This liquidity risk based interpretation suggests a
non-trivial additional risk to the credit system, as outlined in Gurdgiev (2003), which can lead to a much
severe downturn and a rise in corporate insolvencies that is not consistent with standard business cycle
dynamics. The result is suboptimally low investment in productive (firm) capital even at the times of
economic expansion.
It is important to note here that transactions-linked and traditional property taxes have been empirically
shown to be inferior in their stabilization capacity to the Land Value Tax. For example, Denmark, which
has a combination of LVT and property tax shows distinctly higher capacity to generate stable property
markets and exchequer revenue from the property asset taxation than the UK (HM Treasury, 2003).
15
Another important issue is that transactions taxes contribute to suppression of the secondary property
markets, reducing the volume of resale transactions and thus putting pressure on major source of supply. At
the height of the Celtic Tiger building boom, new construction accounted for over 10% of the overall stock
of housing annually, capturing 3/4 of the entire sales volumes. In more normally behaved property markets,
e.g the UK, stock of new housing comprises only 1% of the entire stock of houses (Muellbauer, 2005). In
Hong Kong it accounts for roughly 15% (Bao and Zhou, 2008).
In general, increasing the responsiveness of effective supply of housing to changes in the price of housing
is in itself a stabilizing factor for the asset markets. Thus, any tax reform aimed at inducing greater stability
in the property markets should operate on the secondary (resale) markets, as well as on new property
supply.
Per Muellbauer (2005) estimate, an increase in the responsiveness of the existent stock of housing to
changes in house prices of only 0.03% would be equivalent to a beneficial stabilizing rise in new
construction supply of 3%. At the same time, such an increase will be corresponding to the scenario where
a 50% increase in real house prices would bring about a 1.5% increase in effective housing supply after the
tax reform switching to a land value taxation. In Irish markets, the same number will be as follows: a 0.03%
increase in price elasticity of second-hand homes resale would be correspondent to roughly 2.9% increase
in price elasticity of new construction, implying that a 50% increase in real prices will be expected to
generate a 1.4% increase in effective house supply.
These findings are broadly consistent with theoretical models of asset price behaviour for sticky assets (like
property).
Gurdgiev (2006b) shows that in a theoretical framework of the open economy macroeconomics, high
opportunity cost of housing, definable as after-tax real return to bonds relative to after tax real return to
housing (property), economies with large share of housing in overall household consumption expenditure
will experience more volatile adjustments in underlying macroeconomic fundamentals (output,
consumption, exchange rates, consumption price inflation, asset price inflation and thus tax revenue) in
response to the asset price shock than in the case of economies with smaller share of housing in overall
consumption expenditure. Since this relationship is linearly related to the level of property transactions
taxation implied in the model, higher rates of transactions-based tax on property will lead to higher
volatility in economic fundamentals.
Scheinkman and Xiong (2003) show three interesting theoretical conclusions relating to the issues at hand:
16
1. Scheinkman and Xiong (2003) establish that in general, for asset markets, “agents pay prices that
exceed their own valuation of future dividends because they believe that in the future they will
find a buyer willing to pay even more. This causes a significant bubble component in asset price
even when small differences of beliefs are sufficient to generate a trade”. In other words, when
agents, due to self-asserted or self-generated over-confidence in their ability to predict the market,
generate disagreement regarding asset price fundamentals, price bubbles will emerge. These
bubbles will be larger the lower is the asset ability to support short-selling trades (and in the case
of housing or physical property, such constraints are infinitely large).
2. Scheinkman and Xiong (2003) show that in general Tobin-style taxes (transaction-based taxes) on
assets will be effective in reducing speculative trading (ameliorate bubble conditions) only when
transactions costs are small. Clearly, in the case of property, transaction costs are relatively large,
ranging well in excess of the 0.1% costs involved in trading, for example, US equities.
Furthermore, the transaction costs in the case of property traded in Ireland also include substantial
stamp duty costs. Thus Scheinkman and Xiong (2003) conclusions support the assertion that high
stamp duty tax rates in Ireland fail to substantially reduce speculative property investment, thus
contributing to bubble formation and expansion.
3. The model clearly establishes that “since Tobin tax [e.g. stamp duty] [even when low enough to
produce some stabilizing effects] will no doubt also deter trading generated by fundamental
causes, … the limited impact of the tax on the size of the bubble and on price volatility cannot
serve as an endorsement of the Tobin tax”.
Indeed, Scheinkman and Xiong (2003) show that when transaction cost (tax) is near zero, the owner of the
asset sells the appreciating asset at the point of bubble initiation, realising near-zero profits and preventing
bubble formation. As transactions costs approach zero, the holding period for asset between trades falls and
profit, in extremum, is driven to zero. When transaction costs rise the trading frequency is greatly reduced,
so investors (or property owners) delay selling asset until the bubble is fully inflated.
Finally, it is worth mentioning that Vayanos (1998) shows similar results of the transaction taxes.
Specifically he finds that an increase in transaction cost (tax) can reduce the trading frequency (cutting out
resale market, for example) but may increase asset prices, adding fuel to the asset price bubble fire.
In general, thus, theoretical studies conclusions that higher Tobin-style stamp duty taxes do not ameliorate,
and may even exacerbate, asset price bubble formation in the case of property markets are supported by the
empirical studies from the UK cited above. Both empirical and theoretical evidence points to the
17
detrimental nature of the transactions-based property taxation in supporting emergence and inflation of
property bubbles and subsequent deeper deflation of the asset prices in the post-bubble environment.
But the same evidence can be interpreted also in the context of a flat rate tax applicable to the less inflatable
component of the property asset. As long as such tax
• Does not increase the cost of transactions;
• Does not relate directly to the short-run changes in property prices; and
• Does not reduce the liquidity of the asset (i.e does not create a barrier to trade);
Such a tax will be superior to transactions taxes in terms of reducing the bubble formation and deflation
effects of the transactions tax. It can, therefore, be argued that an LVT, by applying tax to the site value of
property that is largely independent of the individual property price, is not susceptible to short-term
changes in the value of the properties and is not a transaction tax, offers a much more stable (vis-à-vis asset
price bubble formation and deflation) mechanism for raising revenue. It can even be argued that the above
evidence against the transactions taxes supports the view that LVT can be asset-stabilzing. For more on the
latter aspect of LVT, see section 6 below.
3. Exchequer revenue dynamics
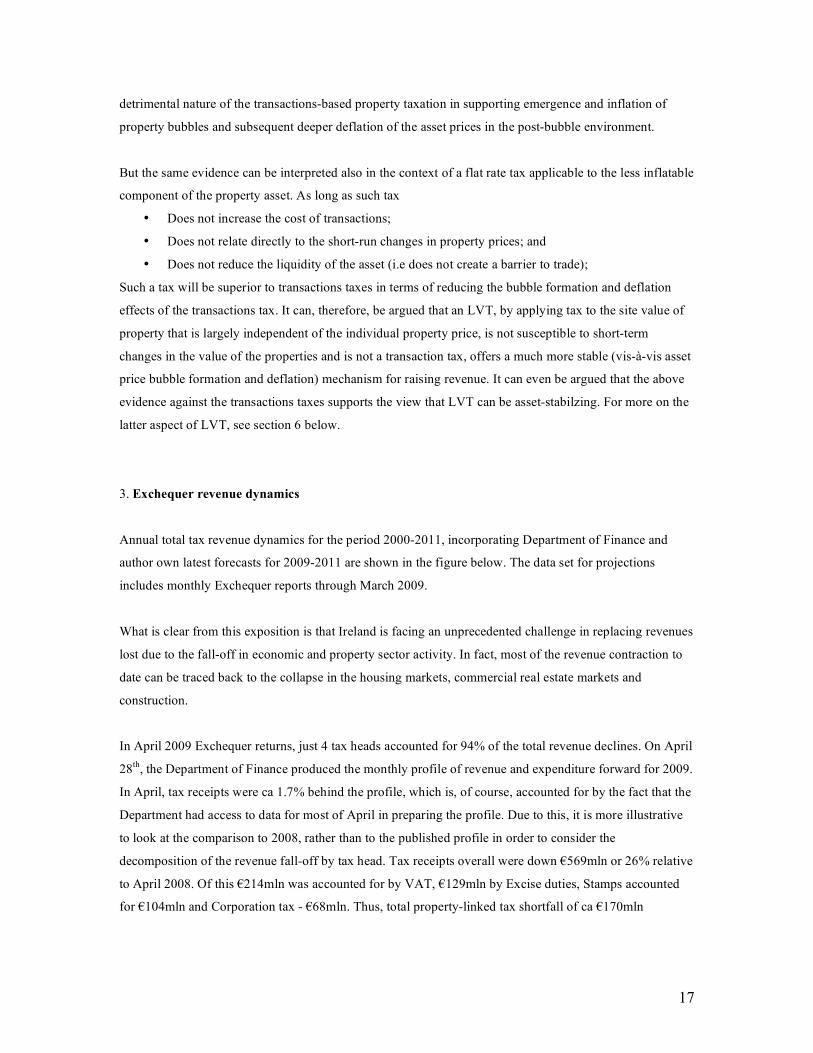
Annual total tax revenue dynamics for the period 2000-2011, incorporating Department of Finance and
author own latest forecasts for 2009-2011 are shown in the figure below. The data set for projections
includes monthly Exchequer reports through March 2009.
What is clear from this exposition is that Ireland is facing an unprecedented challenge in replacing revenues
lost due to the fall-off in economic and property sector activity. In fact, most of the revenue contraction to
date can be traced back to the collapse in the housing markets, commercial real estate markets and
construction.
In April 2009 Exchequer returns, just 4 tax heads accounted for 94% of the total revenue declines. On April
28th, the Department of Finance produced the monthly profile of revenue and expenditure forward for 2009.
In April, tax receipts were ca 1.7% behind the profile, which is, of course, accounted for by the fact that the
Department had access to data for most of April in preparing the profile. Due to this, it is more illustrative
to look at the comparison to 2008, rather than to the published profile in order to consider the
decomposition of the revenue fall-off by tax head. Tax receipts overall were down €569mln or 26% relative
to April 2008. Of this €214mln was accounted for by VAT, €129mln by Excise duties, Stamps accounted
for €104mln and Corporation tax - €68mln. Thus, total property-linked tax shortfall of ca €170mln
18
Source: Department of Finance and author own projections
(inclusive of VAT share accruing to the property transactions, Stamps and CGT/CAT shares) accounted for
ca 30% of the total tax decline in April in y-o-y terms.
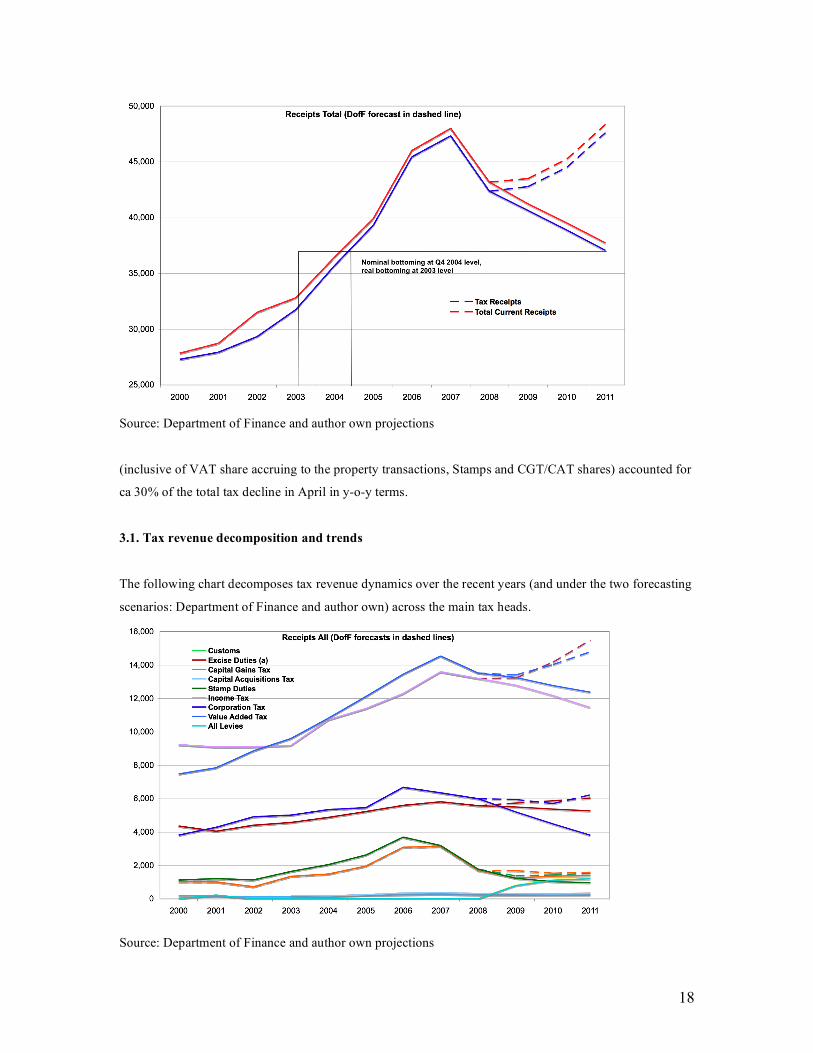
3.1. Tax revenue decomposition and trends
The following chart decomposes tax revenue dynamics over the recent years (and under the two forecasting
scenarios: Department of Finance and author own) across the main tax heads.
Source: Department of Finance and author own projections
19
This shows that the most significant deterioration to date has taken place in the Stamp Duties revenues,
followed by CGT and VAT. More importantly, both forecasts indicate that these sources of revenue – all
heavily linked to property markets transactions – are likely to remain subdued through 2011.
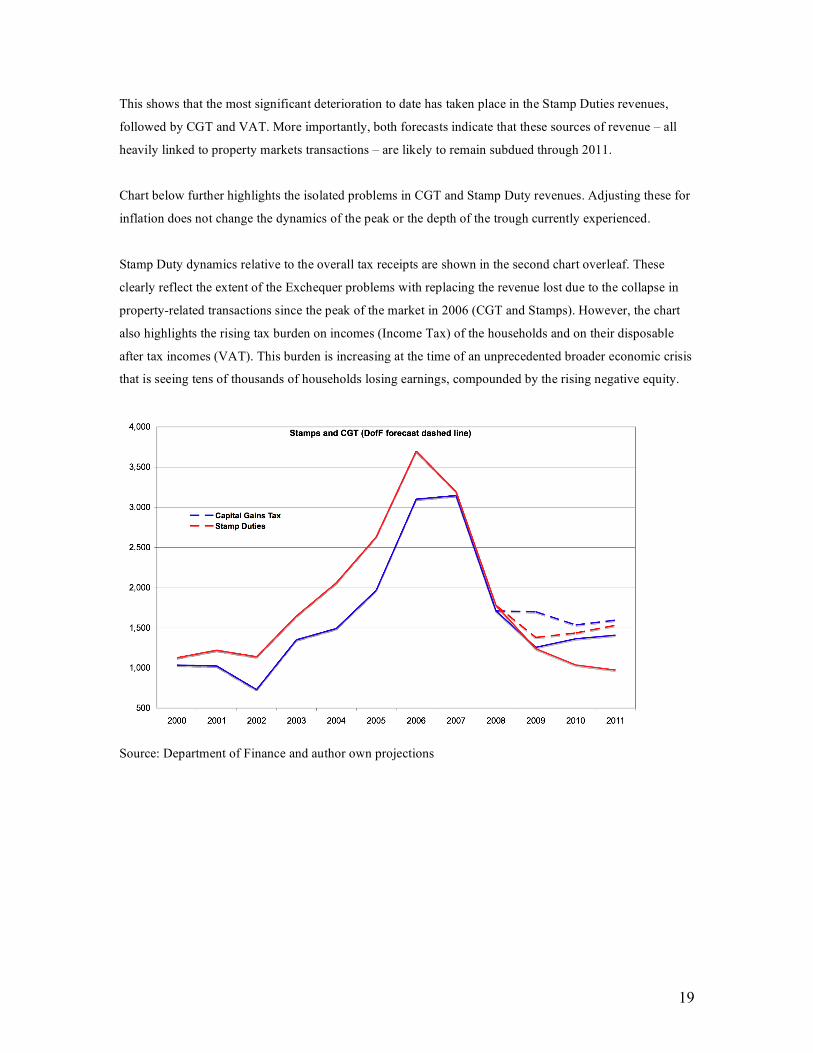
Chart below further highlights the isolated problems in CGT and Stamp Duty revenues. Adjusting these for
inflation does not change the dynamics of the peak or the depth of the trough currently experienced.
Stamp Duty dynamics relative to the overall tax receipts are shown in the second chart overleaf. These
clearly reflect the extent of the Exchequer problems with replacing the revenue lost due to the collapse in
property-related transactions since the peak of the market in 2006 (CGT and Stamps). However, the chart
also highlights the rising tax burden on incomes (Income Tax) of the households and on their disposable
after tax incomes (VAT). This burden is increasing at the time of an unprecedented broader economic crisis
that is seeing tens of thousands of households losing earnings, compounded by the rising negative equity.
Source: Department of Finance and author own projections
20
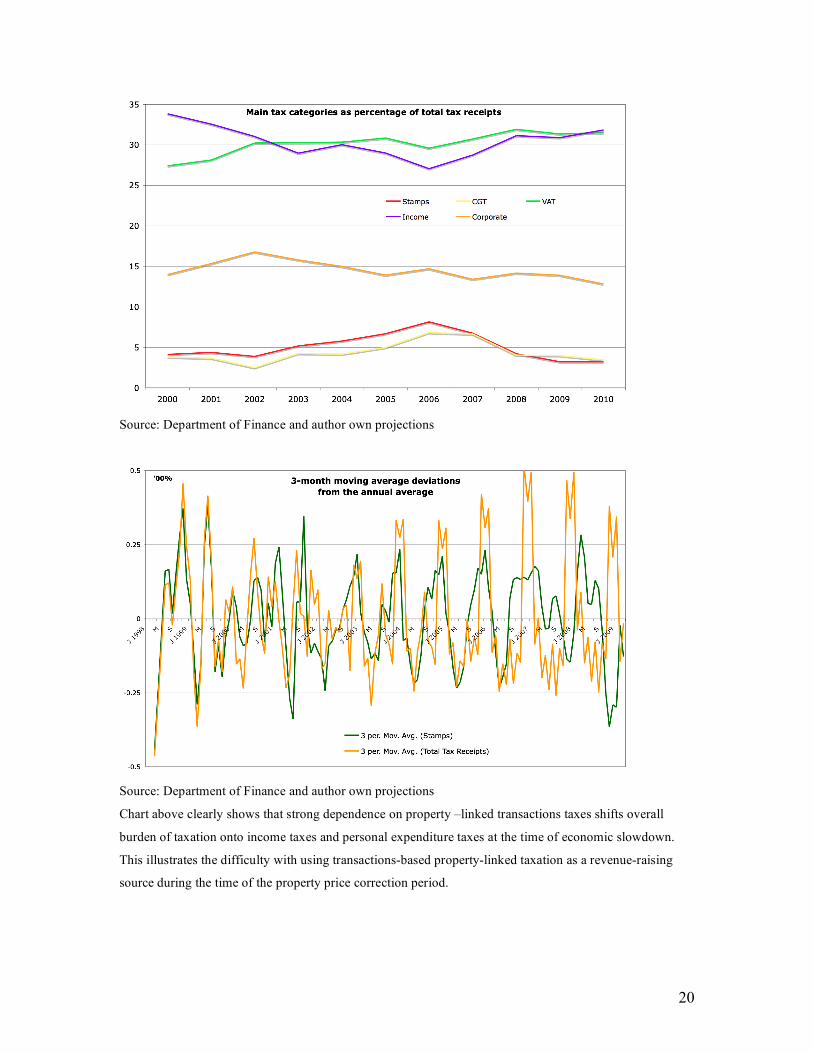
Source: Department of Finance and author own projections
Source: Department of Finance and author own projections
Chart above clearly shows that strong dependence on property –linked transactions taxes shifts overall
burden of taxation onto income taxes and personal expenditure taxes at the time of economic slowdown.
This illustrates the difficulty with using transactions-based property-linked taxation as a revenue-raising
source during the time of the property price correction period.
21
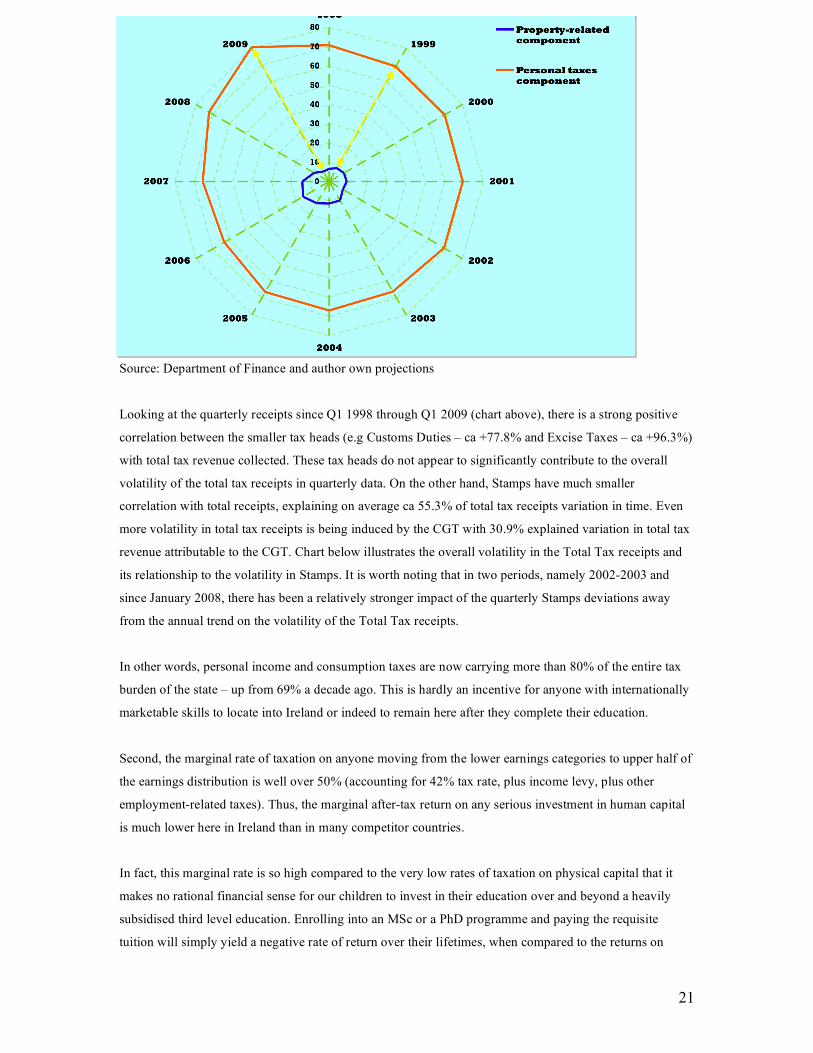
Source: Department of Finance and author own projections
Looking at the quarterly receipts since Q1 1998 through Q1 2009 (chart above), there is a strong positive
correlation between the smaller tax heads (e.g Customs Duties – ca +77.8% and Excise Taxes – ca +96.3%)
with total tax revenue collected. These tax heads do not appear to significantly contribute to the overall
volatility of the total tax receipts in quarterly data. On the other hand, Stamps have much smaller
correlation with total receipts, explaining on average ca 55.3% of total tax receipts variation in time. Even
more volatility in total tax receipts is being induced by the CGT with 30.9% explained variation in total tax
revenue attributable to the CGT. Chart below illustrates the overall volatility in the Total Tax receipts and
its relationship to the volatility in Stamps. It is worth noting that in two periods, namely 2002-2003 and
since January 2008, there has been a relatively stronger impact of the quarterly Stamps deviations away
from the annual trend on the volatility of the Total Tax receipts.
In other words, personal income and consumption taxes are now carrying more than 80% of the entire tax
burden of the state – up from 69% a decade ago. This is hardly an incentive for anyone with internationally
marketable skills to locate into Ireland or indeed to remain here after they complete their education.
Second, the marginal rate of taxation on anyone moving from the lower earnings categories to upper half of
the earnings distribution is well over 50% (accounting for 42% tax rate, plus income levy, plus other
employment-related taxes). Thus, the marginal after-tax return on any serious investment in human capital
is much lower here in Ireland than in many competitor countries.
In fact, this marginal rate is so high compared to the very low rates of taxation on physical capital that it
makes no rational financial sense for our children to invest in their education over and beyond a heavily
subsidised third level education. Enrolling into an MSc or a PhD programme and paying the requisite
tuition will simply yield a negative rate of return over their lifetimes, when compared to the returns on
22
investing in physical buildings, machinery, shares, bonds and commodities. Although the recent
downgrades in the financial markets have brought the latter down significantly, averaged over the life-time
these assets yield 6-8 percent risk-adjusted returns taxable at or below 20% CGT rate (25% for land). An
added year of post-tertiary education provides an average yield of ca 5% per annum over the life-time, but
carries a tax of over 50%.
The above facts show that (a) our fiscal and taxation structures are incapable of supporting a shift of Irish
economic model away from physical capital-dependent growth, and (b) we cannot seriously hope to either
change the pro-cyclical nature of our fiscal spending or to decouple our fiscal policies from the risk of
being held hostage to the short-term volatility in the housing markets.
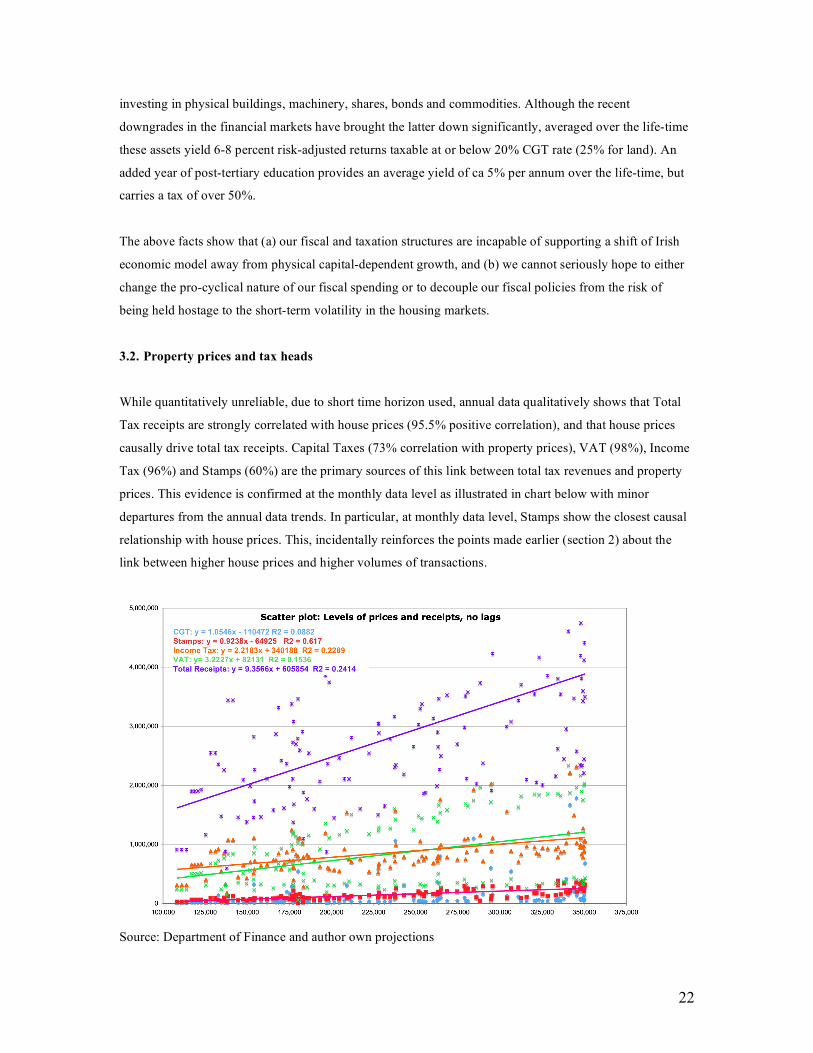
3.2. Property prices and tax heads
While quantitatively unreliable, due to short time horizon used, annual data qualitatively shows that Total
Tax receipts are strongly correlated with house prices (95.5% positive correlation), and that house prices
causally drive total tax receipts. Capital Taxes (73% correlation with property prices), VAT (98%), Income
Tax (96%) and Stamps (60%) are the primary sources of this link between total tax revenues and property
prices. This evidence is confirmed at the monthly data level as illustrated in chart below with minor
departures from the annual data trends. In particular, at monthly data level, Stamps show the closest causal
relationship with house prices. This, incidentally reinforces the points made earlier (section 2) about the
link between higher house prices and higher volumes of transactions.
Source: Department of Finance and author own projections
23
3.3. Macroeconomic implications of transactions tax on property
Muellbauer (2006) discusses long-running concerns of economic policymakers with the issue of asset-
linked transactions taxation. In particular, he points to the Fisher’s debt deflation theory of depressions, as
the basis for thinking about how credit market decisions impact macroeconomic fluctuations.
Fisher’s theory was expanded and elaborated by Bernanke and Blinder (1992), Bernanke, Gertler and
Gilchrist (1996 and 1999) in a theory of financial accelerator. In particular, changes in asset prices – at both
the first and the second moment levels – are transmitted to macroeconomic activity via the financial
accelerator. This applies to both households and firms. In lay terms, this means that during the boom,
collateralization of property permits expansion of credit, fuelling consumer and corporate expenditure,
further fuelling the boom. Conversely, a significant fall in underlying asset prices will worsen a downturn
via a credit crunch or a Japanese-styled debt-deflation spiral.
This process, whereby collateralization of property acts to amplify macroeconomic fluctuations – making
recessions deeper and longer, while fuelling booms – is naturally linked to the systems of property taxation.
As asset prices rise, tax revenue – whether based on the level of prices or on transactions – rises as well.
Financial accelerator, in other words, generally applies to the tax revenue as well, making the revenue
stream not only more pro-cyclical, but more volatile across the cycles.
The end result of our reliance on property-linked taxation, and especially transactions-type taxation is that
Ireland is facing a strong pro-cyclical tax collection pattern. In other words, fortunes of the property
markets activity drive our Exchequer receipts, in effect severely restricting the potential for counter-cyclical
fiscal policy implementation.
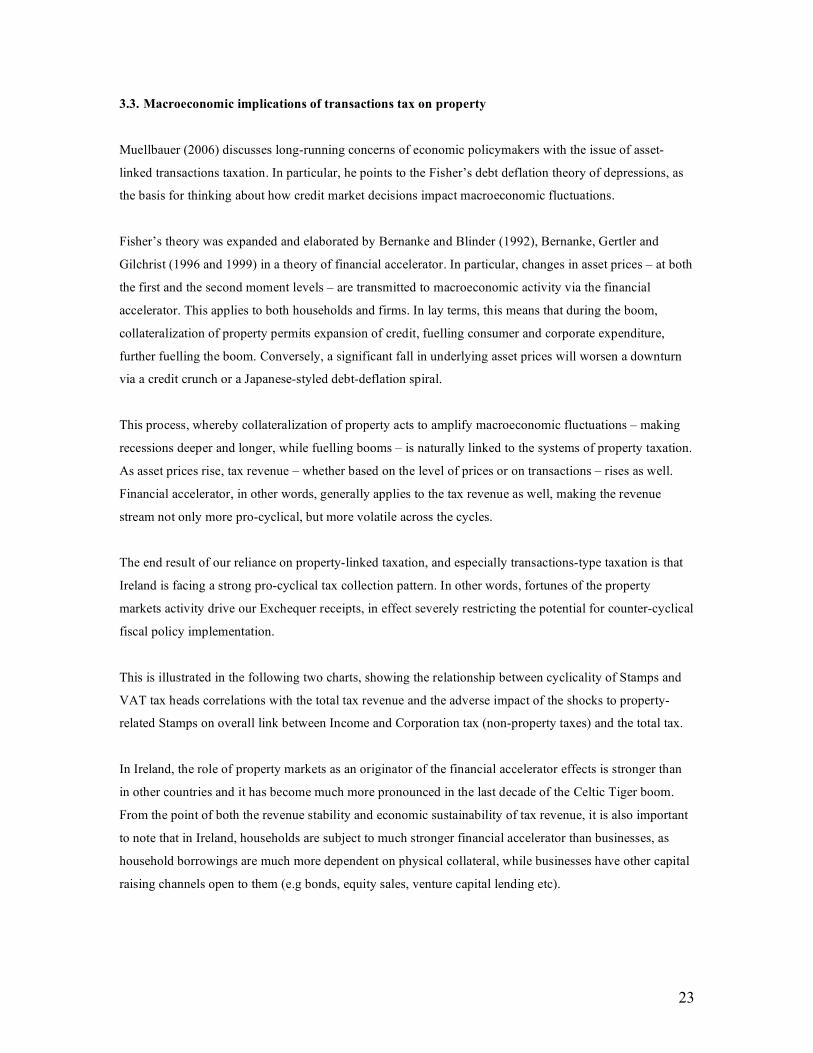
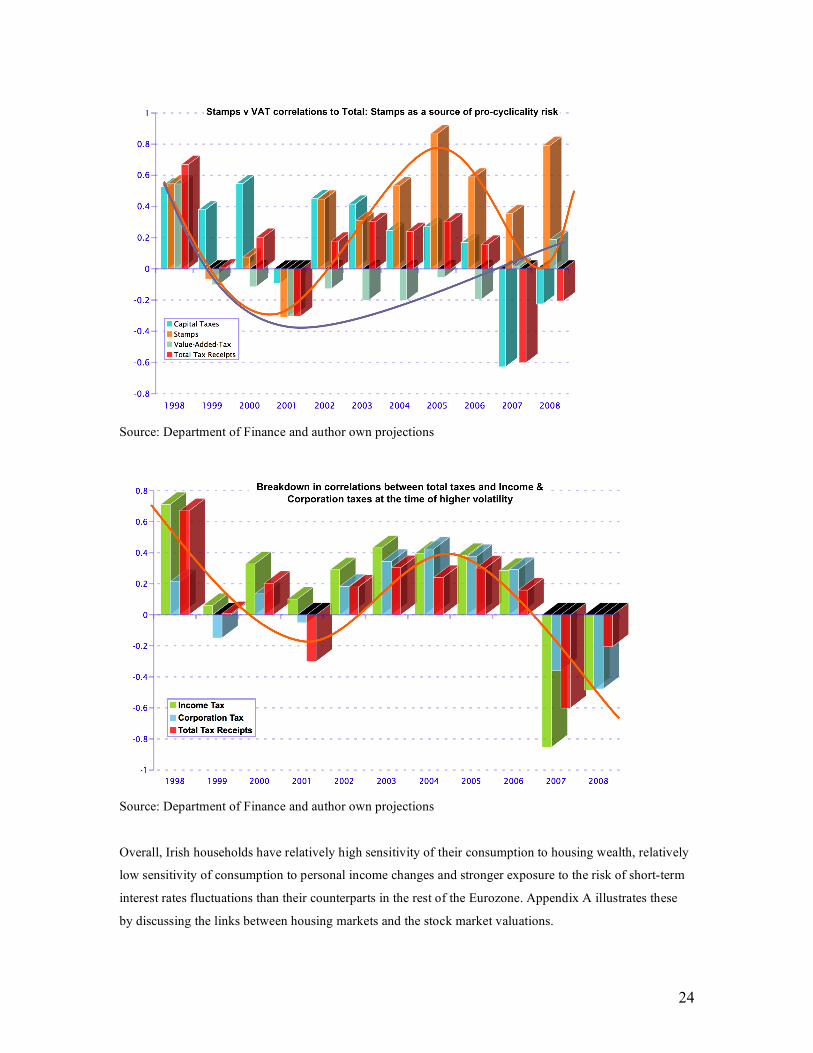
This is illustrated in the following two charts, showing the relationship between cyclicality of Stamps and
VAT tax heads correlations with the total tax revenue and the adverse impact of the shocks to property-
related Stamps on overall link between Income and Corporation tax (non-property taxes) and the total tax.
In Ireland, the role of property markets as an originator of the financial accelerator effects is stronger than
in other countries and it has become much more pronounced in the last decade of the Celtic Tiger boom.
From the point of both the revenue stability and economic sustainability of tax revenue, it is also important
to note that in Ireland, households are subject to much stronger financial accelerator than businesses, as
household borrowings are much more dependent on physical collateral, while businesses have other capital
raising channels open to them (e.g bonds, equity sales, venture capital lending etc).
24
Source: Department of Finance and author own projections
Source: Department of Finance and author own projections
Overall, Irish households have relatively high sensitivity of their consumption to housing wealth, relatively
low sensitivity of consumption to personal income changes and stronger exposure to the risk of short-term
interest rates fluctuations than their counterparts in the rest of the Eurozone. Appendix A illustrates these
by discussing the links between housing markets and the stock market valuations.
25
The main point here is that a tax system reliant on asset valuation must be designed in such a way so as to
act as an systemic stabilizer. This means two things in the context when the underlying asset is the
property:
1. The desired tax system should levy a charge against the least volatile determinant of the property
price;
2. The desired tax system should be based on a stream of rents associated with the property, instead
of the actual price levels commanded by the property.
However, in addition to the financial accelerator mechanism, some recent regulatory changes in the
banking sector are further contributing to the destabilising link between asset markets and the
macroeconomic performance. Goodhart, Hofmann and Segoviano (2004) and Taylor and Goodhart (2004)
show that under the recently enacted Basel II criteria for capital reserve adequacy of the banks, capital
ratios are now potentially even more pro-cyclical than before. Thus, adverse changes in the underlying
asset markets have more pronounced effect on capital adequacy for the banks, which in turn can lead to the
more extreme credit market outcomes. This implies that tax system, especially taxes linked to asset
valuations, must be designed with internal stabilizers in mind. In general (Muellbauer, 2006) property
taxation offers some potential to act as a macroeconomic stabilizer.
Land Value Tax, by anchoring tax rates to the less mobile and less volatile subcomponent of the property
asset values, offers much stronger internal stabilization potential than a general property tax.
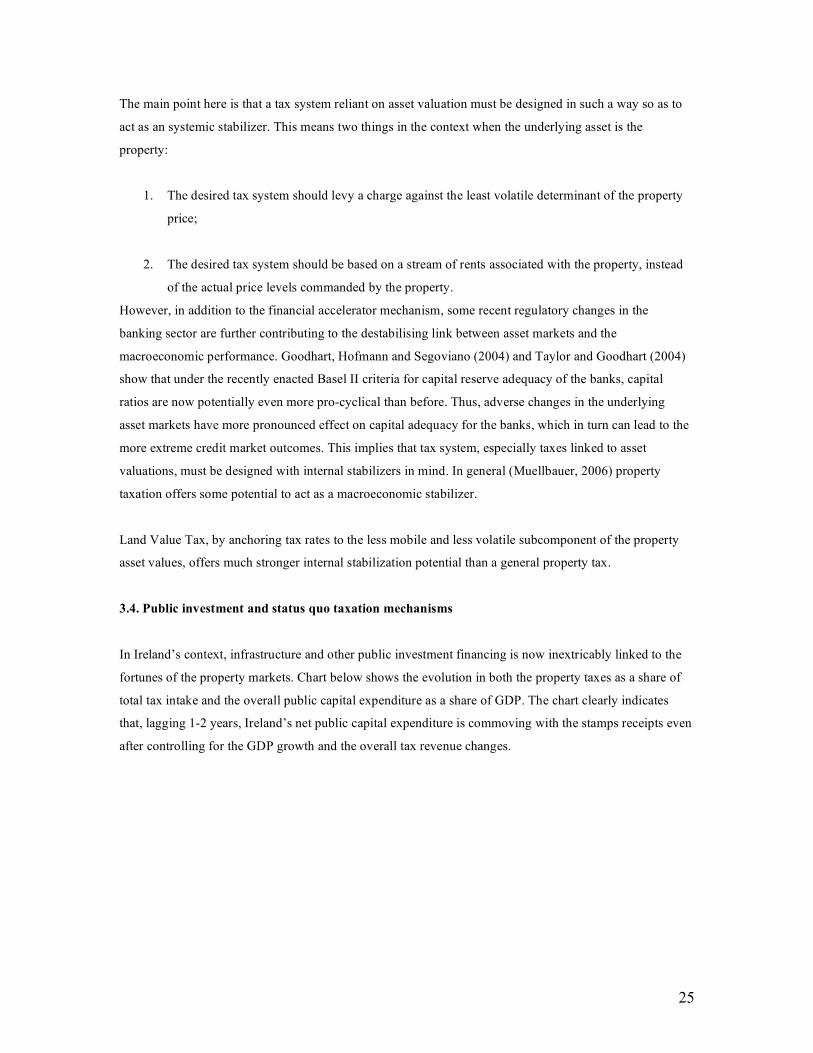
3.4. Public investment and status quo taxation mechanisms
In Ireland’s context, infrastructure and other public investment financing is now inextricably linked to the
fortunes of the property markets. Chart below shows the evolution in both the property taxes as a share of
total tax intake and the overall public capital expenditure as a share of GDP. The chart clearly indicates
that, lagging 1-2 years, Ireland’s net public capital expenditure is commoving with the stamps receipts even
after controlling for the GDP growth and the overall tax revenue changes.
26
Source: Department of Finance and author own calculations
This type of co-movement represents a serious time consistency problem. At the time of declining tax
revenue, previous commitments on capital investment must be financed out of borrowing. The extent of
borrowing is in turn determined by the rate of revenue fall-off, which itself is linked to two sources of risk
mentioned in section 1.2 above (items 1.a: asset price adjustment channel of risk, and 1.b: transaction
volume adjustment channel). We are currently experiencing just this type of twin channel shock.
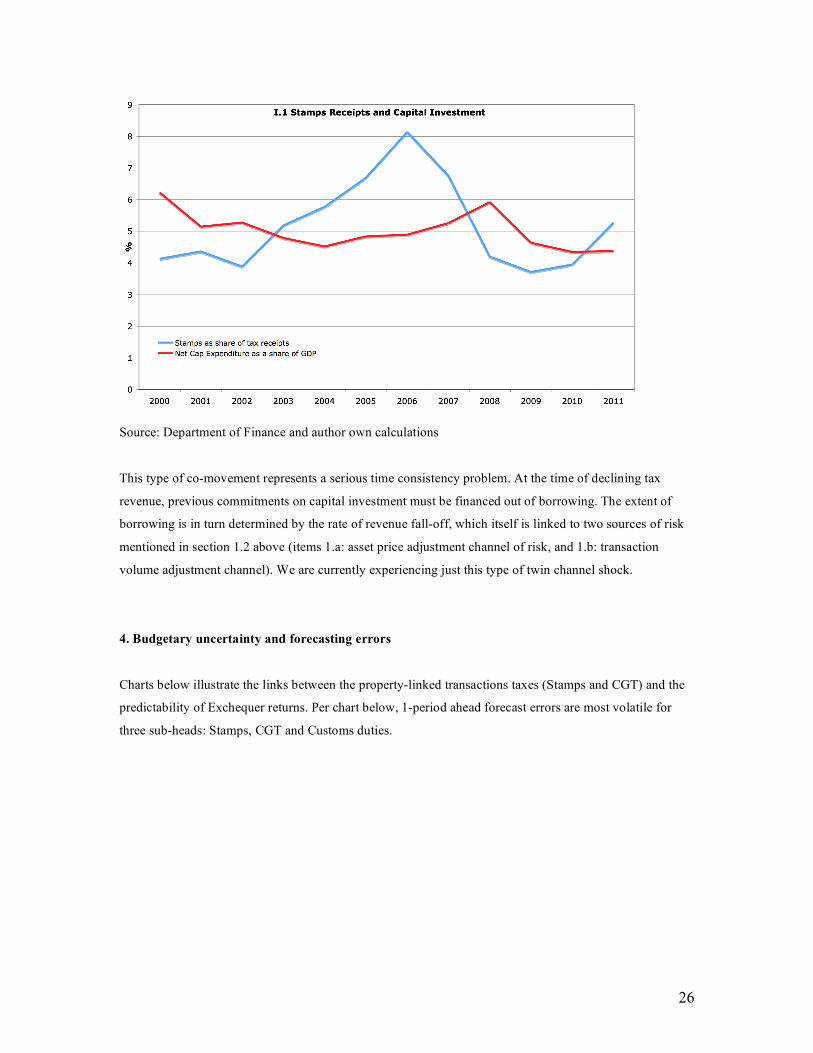
4. Budgetary uncertainty and forecasting errors
Charts below illustrate the links between the property-linked transactions taxes (Stamps and CGT) and the
predictability of Exchequer returns. Per chart below, 1-period ahead forecast errors are most volatile for
three sub-heads: Stamps, CGT and Customs duties.
27
Source: Department of Finance and author own calculations
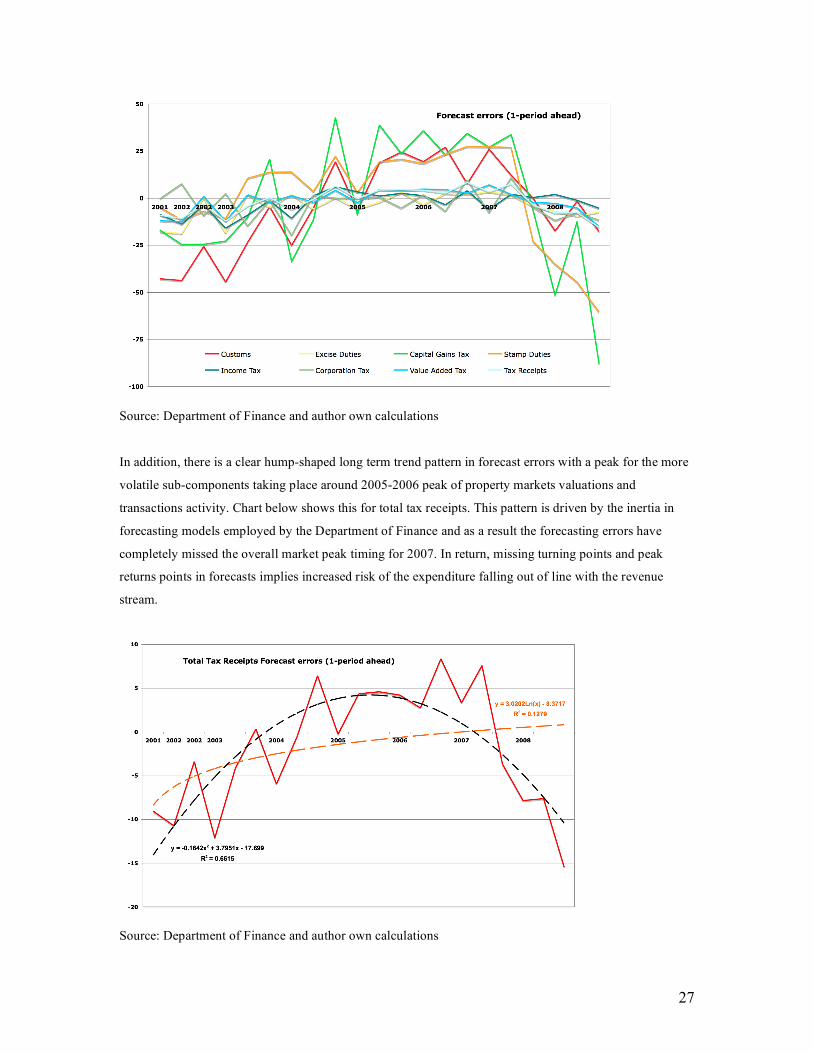
In addition, there is a clear hump-shaped long term trend pattern in forecast errors with a peak for the more
volatile sub-components taking place around 2005-2006 peak of property markets valuations and
transactions activity. Chart below shows this for total tax receipts. This pattern is driven by the inertia in
forecasting models employed by the Department of Finance and as a result the forecasting errors have
completely missed the overall market peak timing for 2007. In return, missing turning points and peak
returns points in forecasts implies increased risk of the expenditure falling out of line with the revenue
stream.
Source: Department of Finance and author own calculations
28
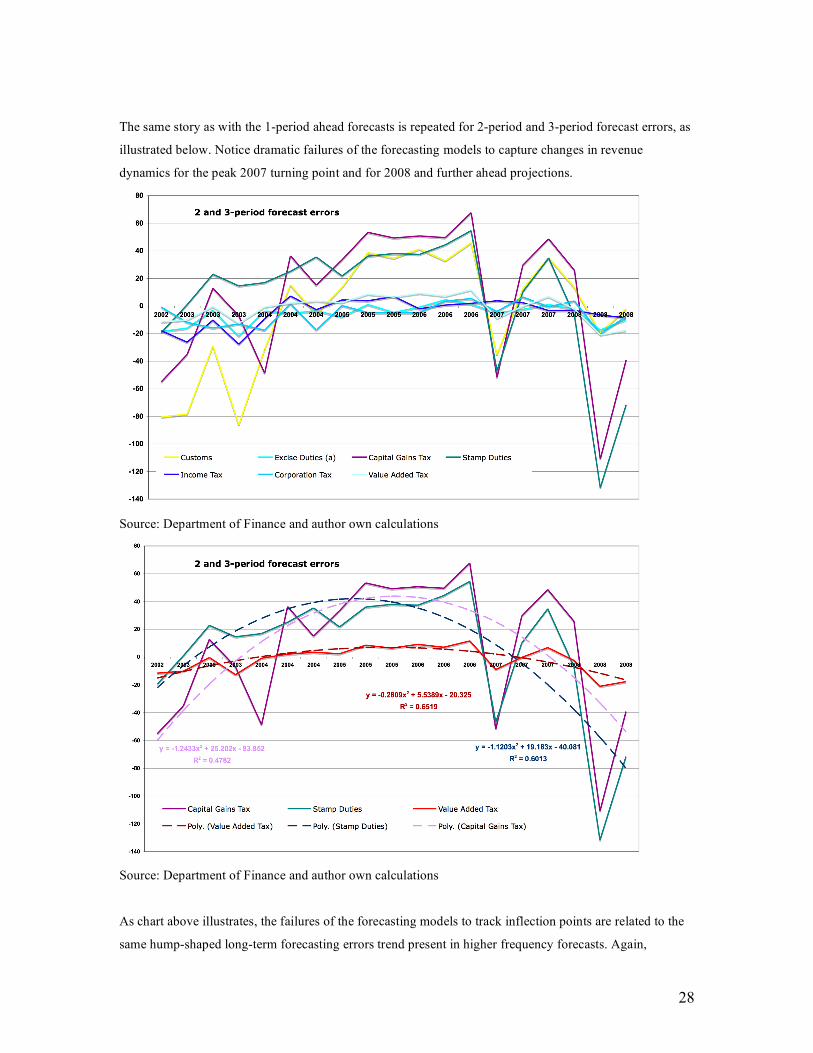
The same story as with the 1-period ahead forecasts is repeated for 2-period and 3-period forecast errors, as
illustrated below. Notice dramatic failures of the forecasting models to capture changes in revenue
dynamics for the peak 2007 turning point and for 2008 and further ahead projections.
Source: Department of Finance and author own calculations
Source: Department of Finance and author own calculations
As chart above illustrates, the failures of the forecasting models to track inflection points are related to the
same hump-shaped long-term forecasting errors trend present in higher frequency forecasts. Again,
29
absolute peaks in forecast errors trend occur at 2005-2006 period for VAT, Stamps and CGT, and these
peaks are virtually identical for CGT and Stamps, while being much lower for VAT. This pattern is driven
primarily by the behaviour of the property prices and transactions volumes, as the timing of peaks suggests.
Much of this evidence is consistent with other countries experience with the transactions based taxation in
the property markets. Even in absence of the significant (as in the case of Ireland) year-to-year volatility in
house prices, the UK has an “unusual degree to which house prices affect the rest of the economy – the
correlation between house-price inflation and consumption in the UK is more than twice of Germany and a
third higher than in France” [although house prices volatility in the UK is higher than in Germany and
France by far smaller magnitude] (Maxwell and Vigor, 2005)
As we show in the concluding exercise in below, creation of a tax-based automatic stabilizer for the
housing and broader property markets, property tax system must reflect actual differences in property
valuations in time. For LVT this implies high frequency valuation of land, capturing regional and specific
zoning differentials.
5. Land Value Tax: Definition and implementation
5.1. Definition
Land Value Tax is defined as an annual tax or charge on the rental value of the land occupied by the site or
a property. LVT can apply either in a flat rate fashion, i.e single rate band or on the basis of the zoning of
land.
Under a flat rate application, all land classes will be taxed at a single rate, of X% of the rental value of land.
The rental value of land, based on long-term average cost of capital financing (Libor average plus spread
average times risk weighting) should be approximately equal to 5-7% for the 5-year average price of
property. If the tax rate were to recoup full value of land within 15-year tenure horizon, the rate of annual
tax should capture 4.7% of the value of land. Thus, if the value of land is currently assumed to be at 20% of
the property price, economically efficient rate of taxation under flat tax system should be in the region of
1-1.4% of the average property price.
The flat rate of taxation will allow the aligning of incentives for efficient utilization of land under specific
uses. Thus, for example, due to its low rental value, SAC-designated protected or peripheral lands will face
low tax burden.
30
While a flat rate application is preferred, a less transparent and more active structure of use incentives can
be put in place under LVT reforms. For example, public lands incurring an LVT of 0%, rising to W% for
forestry and sustainable agriculture lands, to X%>W% for agricultural land, Y%>X% for residential land
and Z%>Y% for industrial and commercial land. Of course, such a gradient is provided solely as an
illustrative example with further refinement of the specific zoning bands needed.
As such, LVT is not a transaction-based tax, but a tax that is levied on the exogenously determined value of
the land. In addition, LVT is not a tax on development or improvement of property. These are pivotal
points as any other form of property taxation delivers three major disadvantages relative to LVT:
1. Property taxes in general penalize more sustainable and intensive use of land suitable for such
development, thereby encouraging land speculation and discouraging properly planned
development; and
2. Property taxes, unlike LVT induce significant efficiency losses in tax collection and
administration; and
3. Property taxes in general do not deliver a direct public return to publicly-financed infrastructure
and amenities investments that act to enhance the value of land more than the value of the actual
buildings and structures sitting on the site. LVT, conversely, does provide exactly such a
mechanism for capturing a share of private windfalls accruing to land owners arising from public
investments.
Concerning the first point above, LVT will incentivise developers not to hold land as a speculative
investment as the length of time land is held without productive use translates directly into the cost of
holding such undeveloped land with favourable zoning attached to it. This factor also separates LVT as the
only form of property taxation that encourages local and central authorities to focus their attention on
intensive use of suitable land, reducing suburban sprawl. LVT will also incentivise more appropriate and
speedier utilization of brownfield sites.
Furthermore, LVT acts as an automatic stabilizer for reducing regional income differentials in line with the
current objectives of the National Spatial Strategy. This is so because businesses (and thus jobs creation)
are bound to see lower costs of annual land rent as a significant incentive for locating outside major urban
centres. As the value of land, regardless of specific zoning attached to it, will be lower in the areas with
lower income, lower resulting LVT will act to drive more businesses to these locations reducing local
unemployment, raising local incomes and bringing down income inequality between various regions. This
effect is crucially dependent on LVT being an annual tax on value of land (i.e a running operating cost for
businesses), rather than one-off transaction-based stamp duty (i.e sunk capital cost).
31
Per second point, previous discussion has shown that transactions-based property taxation induces high
volatility and excessive pro-cyclicality of revenue, hampering stabilizing effects of the counter-cyclical
fiscal policies. In addition, traditional property taxes, by directly linking tax revenue to property values act
as:
• Either a source of destabilizing influence on property markets and tax revenue whenever tax rates
apply to frequently assessed property valuations (in other words, as prices fall (rise), tax revenue
tends to fall (rise) in line with property prices at a speed coincident with the rate of property
valuations revisions. Thus, recessionary environment – with underlying fall in property prices –
also induces a fall in property tax revenue); or
• A source of inefficiencies in transfers of private gains accruing to the property developers from
public investments in infrastructure and amenities (when tax rates are set on infrequently adjusted
property valuations, any improvements in infrastructure or amenities in the vicinity of a given
property yield privately captured benefits to property owners that are not recoverable until
property value is reassessed for taxation purposes).
LVT avoids both of these shortcomings.
Finally, on the third point above, LVT allows direct taxation of private wealth that arises through public
investments in infrastructure and amenities. In addition to taxing windfall gains to private landowners that
accrue without their undertaking any investment or production activity of their own, LVT will also provide
a direct incentive for more infrastructure development and higher efficiency infrastructure investment by
the local authorities. UK’s South East Commission (2005) has concluded that an LVT “could well be a
useful tool for delivering sustainable development.”
5.2. Implementation framework
Implementation of the LVT framework will require prior consideration of the following main aspects of the
reform:
1. Which tax heads, other than Stamps and development levies, should be substituted for with the
new LVT rates? At this point in time no specific proposal as to the issue of which taxes, other than
Stamps and development levies, should be substituted away (fully or partially) under the reform.
We await the results of the Delphi-method survey of all stakeholders to determine which targets
would appeal to the majority of the voters.
2. What transition path to the new tax system should be taken (i.e the issue of crediting those
homeowners who have recently paid stamp duty)? It is the author view that individuals who
purchased their homes within the last 7-8 years should be credited, to the full amount of their
stamp duty paid, against the assessed tax. These individuals should be allowed to elect whether
32
they would opt to pay the LVT rates after a full exemption is taken or amortize their exemption
amount across time. In other words, for example, person A with stamp duty credit against LVT
allowing her to delay LVT application for the next 5 years can chose to either take her 5 years
exemption consecutively in full, starting full application of the LVT in year 6, or opt to amortise
her exemption of, say, 10 years, taking half-annual credit each year against the 5-year allowance.
3. How frequently should households pay LVT and how frequently should LVT rates be assessed? It
is optimal, from our point of view, to have the following assessment periods:
• Commercial property – annually or every three years (depending on the frequency of
transactions);
• Residential property – every 3 years – reflective of higher price and transactions volume
volatility in this area;
• Industrial property, forestry and agriculture – every 5 years – reflective of longer investment
cycles in these sectors.
4. Who should be exempt from application of the LVT or who should be granted partial relief against
LVT? Exemptions and relief from LVT should apply to income-poor asset-rich elderly and people
with generally low incomes or on social welfare assistance and only in relation tot heir primary
residency. In some cases, such exemptions/relief should take a form of temporary relief until such
a time when they sell property or until their property is deeded to their heirs. There should be no
exemptions or relief or reduced rates application for any development land.
5. Which rates should apply to various zoning-based types of land: non-commercial land owned by
charities and NGOs, public lands, forestry, agricultural land, industrial land, residential,
commercial, etc.? It is the preference of this author that non-commercial land owned by the NGOs
and non-commercial public lands should bear no LVT. The burden of LVT rates should thereafter
increase from forestry to agricultural land; to commercially-used public lands and NGO-owned
land set at the same rate of LVT as industrial land; to residential land and finally to commercial
land.
6. How can we address the issue of investors’ expectations by signalling the permanent nature of the
LVT? LVT should be supported by a legislation that commits this and future Governments to
retaining LVT system of taxation into the future. The legislative framework, under which such a
commitment can be obtained, is outside the cope of the present research.
7. Should local authorities have a right to levy LVT and assess land values for the purpose of LVT
collection or should these functions be carried out centrally? It is the view of this author that local
33
authorities – defined in their more regional, broader terms, and following a consolidating local
government reform – should be the main administrators of the LVT collection. However,
assessment of and supervision over the LVT rates should be centrally-based to facilitate
transparency and to avoid incentives for corruption and undue influence.
8. How will the assessment process work (frequency, source of data, transparency, regime stability
etc)? The methodology for reforms will be subject of the follow up submission to the Commission
on Taxation.
6. Land Value Tax: smoothing properties
One of the important aspects of the current system of transactions-based taxes is the simultaneous volatility
of receipts at the annual level and the persistency of trends on receipts associated with the underlying asset
prices and transactions activities. This was discussed above in sections 3 and 4.
While lack of detailed data on land transactions prevents any direct modelling of the LVT, we can simulate
LVT revenue path using a portfolio approach to tax revenue flows. Under the portfolio approach we can
create a series of blended combinations of other tax heads with exposure to property markets: VAT,
CGT/CAT, Stamps (Blends 1 and 2) and extend this blend to incorporate also Income and Corporation
taxes (see Appendix A and section 3 above for justification of the link between these two tax heads and the
property markets), generating Blend 3. In both cases, we use the weights to balance out the specific tax
heads. These weights are based on:
• Stamp duty revenue is simulated by using a 3-year average (step-average computed for each 3 –
year period average price to reflect a 3-year period of revising a direct property value tax) of
Stamps weighted using the correlation coefficient between stamps revenue and property prices
based on monthly time series;
• VAT and CGT/CAT revenue is simulated using monthly correlation between VAT receipts and
property prices and applied to a 3-year step-average of property prices;
• Stamp duty revenue is smoothed out using a 3-year lag and 12 month moving average, at a 30%
share of actual revenue, to replicate the dynamics of a standard-type property tax levied on a flat
rate basis;
• Income and Corporation taxes are discounted based on the 3-year average correlations with the
property prices;
• We use residential property, asking prices for this exercise in absence of a comprehensive data set
on commercial and residential realised prices.
Charts below illustrate the properties of these blended tax revenue streams.
34
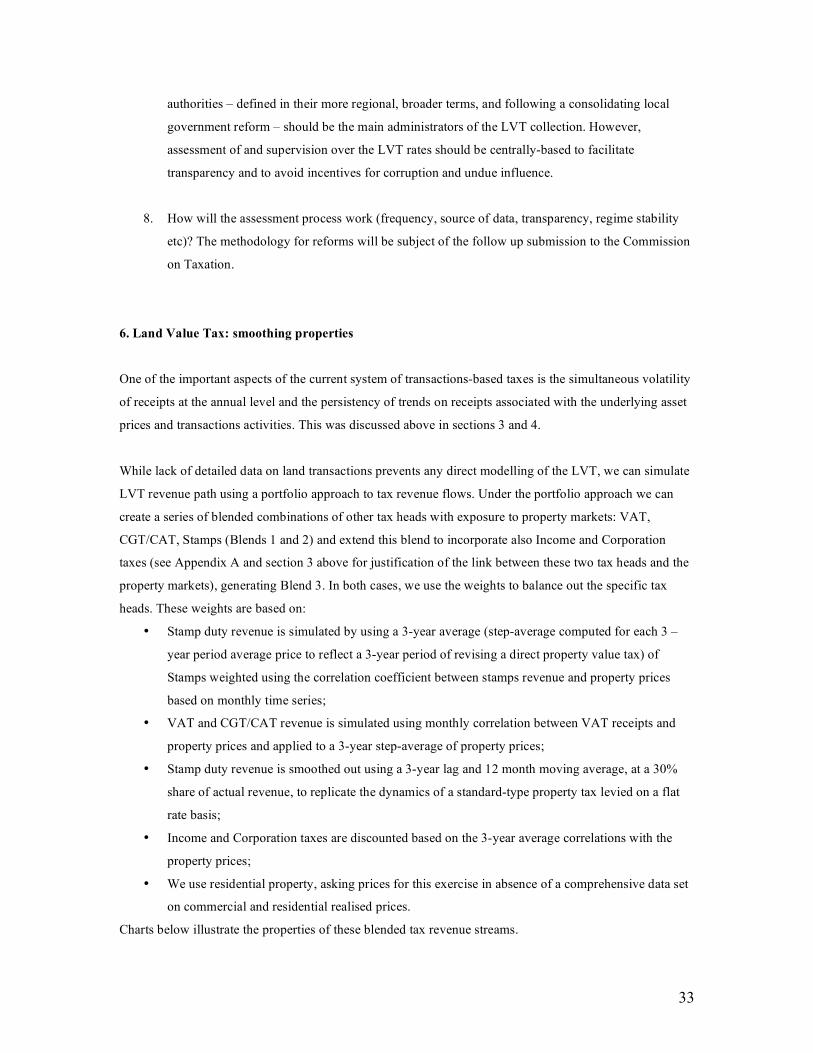
Chart above shows the smoothing properties of the first two blends: blend 1 reliant on stamps revenues,
blend 2 reliant on CGT/CAT revenue. Both blends generate very similar smooth dynamics, with two
positive effects:
1. Both blends smooth-out completely revenue volatility over the 2001-2002 slowdown; and
2. Both blends delay and smooth-out the contraction in revenue during the current downturn.
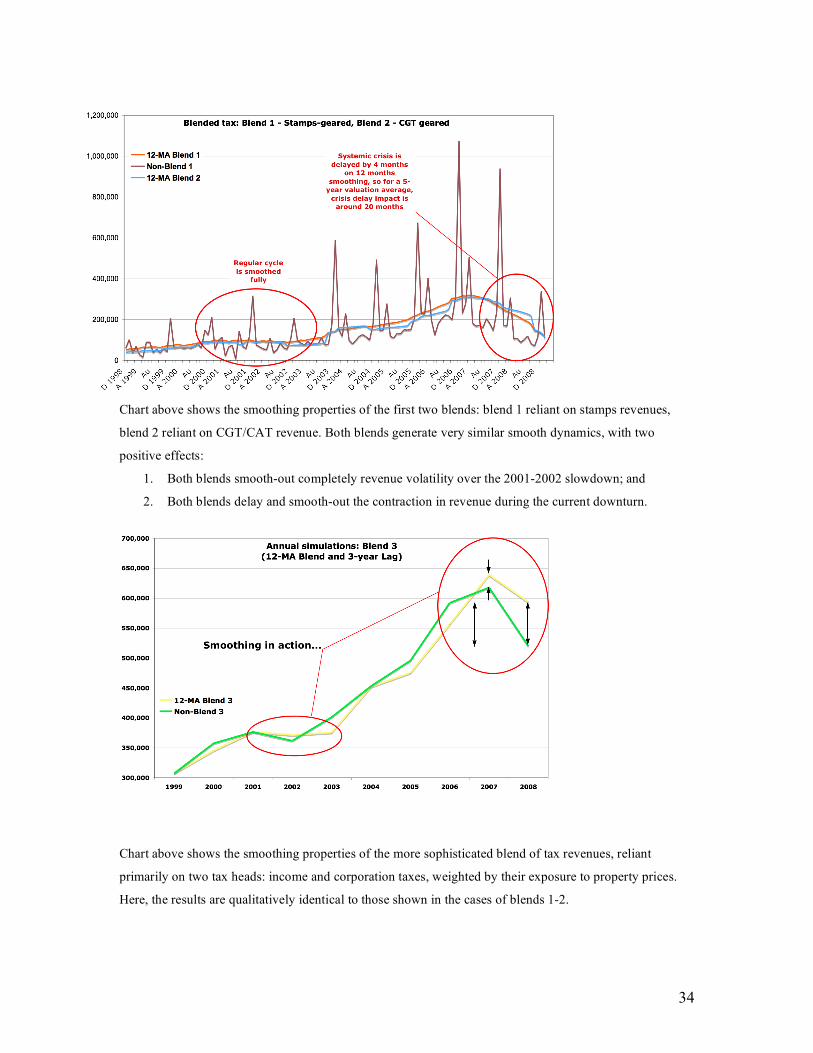
Chart above shows the smoothing properties of the more sophisticated blend of tax revenues, reliant
primarily on two tax heads: income and corporation taxes, weighted by their exposure to property prices.
Here, the results are qualitatively identical to those shown in the cases of blends 1-2.
35
To summarise, this simple stylized exercise shows that application of a flat rate tax to the less mobile, more
resilient component of the overall property prices leads to substantially smoother revenue streams. In so far
as such less mobile and more resilient component of property price is land or site value, an LVT will act as
a smoothing instrument for Exchequer revenue volatility, reducing uncertainty of revenue and providing for
less volatile and less pro-cyclical receipts.
7. Socio-economic aspects of Land Value Tax reforms
7.1. Equity problems
In addition to the above problems, current system of taxation imposes rather arbitrary equity losses. No
matter how these are set, thresholds for various rates applications imply that stamp duty on property
induces increasing property tax costs per €1 marginal increase in price over each threshold. This results in
the compression of property prices around each stamp duty band and leads to mispricing of property. In
addition, such compressions lead to large-scale tax avoidance and illegal (grey markets) transactions in
property.
LVT allows to fully remove arbitrary jumps (discontinuities) in application of the stamp duty without
sacrificing actual tax revenue collected.
Regional and local social deprivation, low demand for housing improvements and social facilities
development in the inner cities, regional and local employment inequality all are the outcomes of the
resources allocations that are conditional on tax policies.
So far, Irish taxation system stressed two divergent approaches to development and equity. Development
incentives have been heavily concentrated in various tax exemptions and stimuli to developers, landowners
and existent property holders. Social equity programmes have focused on public transfers from the
productive economy to the NGO and quasi-NGO sectors.
The main problem with this approach is that it delivers divergence between the productive incentives and
the expenditure allocation. In other words, those who engage in publicly-financed consumption have no
incentives to participate in the economic activity of development, while those who engage in development
have no incentive to localise their productive and investment activity.
In part, it is important to note that the returns to land exhibit huge differentials depending not necessarily on
the actual realized use of this land, but on the potential (zoned) use of it. This often cannot be justified from
36
the point of view of cost/benefit analysis to the broader local communities. Although delayed renovation,
undeveloped land banks, speculative holdings of derelict properties are more often than not an outcome of
the skewed planning system, it is clear that the tax system can and should be used to improve social and
economic efficiency of land utilization. Furthermore, taxation can increase the efficiency of allocation of
the existent stock of housing and commercial property as long as the inefficient use of such stock incurs an
ongoing cost, proportional to the asset value without penalizing improvements in the properties that are
carried out on the back of individual investment into property.
As Muellbauer (2006) points out “since the different types of taxes have different incentive effects on
economic activity, a balance of taxation that puts more weight on taxes with smaller deadweight losses is to
be preferred”. In the context of designing socially optimal tax system that addresses the issues of economic
inequality and social exclusion, Muellbauer (2006) further states that “Most obviously, however, policy-
makers who include reduced economic inequality and social exclusion… would wish to avoid regressive
forms of taxation (such as the current form of Council Tax [in the UK]). While means-tested benefits can
be used to ameliorate a regressive tax system, the high marginal tax rates associated with withdrawal of
such benefits, have negative incentive and so efficiency effects”. Muellbauer (2006) goes on to directly
recommend that the UK adopts Site/Land Value Taxation as the means for ameliorating adverse effects of
tax system on social exclusion and economic inequality.
7.2. Environmental impact
The UK research has shown conclusively that planning mechanisms, aligned to transaction-based taxation
in the property markets, distort the incentives of local and central authorities to support economically and
environmentally sustainable development in their areas. This effect arises due to the fact that transactions
based taxation ‘bunches’ up tax revenue up front of the higher rate of services provision required by new
development, while saddling local authorities with the costs of such development and rediverting revenue
to the central government (Cheshire and Sheppard, 2004). The result is reduction in economic growth and
innovation (Travers, 2005) and lower effectiveness of public investment (Huhne, 2004).
Muellbauer (2006) also notes that the UK Sustainable Communities Plan (2003) has several key elements
including “improving the local environment; and protecting the countryside”.
7.3. Main objections against the LVT
There are several objections against the LVT that arise from the experience of other countries with either
the implementation or application of the tax. International case studies for LVT, while not a subject for the
current study, will be provided in the follow up research paper at a later date.
37
First, in the case of the UK experience with introduction of land taxes in 1909, 1914, 1947, 1967, 1974 and
1985, the main problem found was the reluctance of the land owners to initiate new land transactions within
the short-time after tax imposition. This reluctance was driven solely by the (what was proven to be
rational) expectations that the tax will be repealed following the next elections. Perceived temporary
nature of the tax created incentives to delay transactions. Of course, the problem was that all of these tax
measures applied to land transactions, not the capital value of the land (McLean, 2005).
Second objection relates to the problems of proper valuation and tax assessment. While this issue lies
outside the scope of this research, it is worth noting that:
1. The same objection applies to all capital value-based taxes on property; and
2. The problem is self-correcting once time is allowed for establishing public and transparent
database for land values and property prices – something that will be inevitable under any system
of property taxation as well.
Thirdly, there is an argument of inequity, suggesting that LVT will adversely impact those who are
considered property rich, but income poor. This can be rebutted as follows:
1. There is a need for everyone in the society to face a true cost of their consumption decisions,
otherwise, continuous transfer of income and wealth from the younger generations (asset poor but
with higher expected life-time income) to the older ones (asset rich, but with lower expected life-
time income) will result in gradual emigration out of the country of those younger people with
above-average earnings potential, who will be asked, by the current system, to heavily subsidise
excessive (relative to income) asset holdings of the elderly;
2. With LVT in place, the elderly, in the long run, will benefit from releasing some of the equity
trapped in their properties, allowing them to enjoy higher standards of living and extending their
ability to lead active and healthier lives as the result of supplementary income derived from
trading down;
3. In cases where the ability to pay LVT is not supported by actual income – whether in the case of
the elderly or in the case of the young individual – there can be a deferral of the LVT liability to
time when the property is either sold by the current owner or passes to the younger generation
through inheritance.
38
The fourth classical objection is that LVT can encourage excessive local authorities- led development as
such development will maximize returns to the local authorities through tax claw-backs. This is fallacious
argument altogether, as it neglects to note that local authorities in Ireland are elected directly by the local
constituencies. Should local constituencies want higher levels of development restrictions, such restrictions
can be imposed by the local authorities. What is important, however, is that LVT will reduce the adverse
effects of centralized transfers of funds for local authorities development – a system (currently in operation)
that in effect allows some local authorities to impose the cost of their own choice of preservation on those
households who subsidise the local authority while not benefiting from being resident in the area. In other
words, there is an argument to be made whether a working household living in Dublin should pay with their
taxes for the luxury of preserving parts of rural Ireland to which this household has no claim or access and
which benefits only the residents of the specific rural areas.
The fifth point relates to the impact of LVT application on businesses, such as those where property is
split across multiple occupiers in the case of offices or retail units. However, LVT will encourage more
intensive utilization of suitable development lands, including brownfield sites and will also restore direct
connection between the public sector assessment of taxation and the impact of such assessment on the
public sector itself. What this means is that when the public sector is also faced with an LVT on sites with
commercial value that the sector owns, it will have an incentive to release (either through a direct sale or a
long term lease) some of the unproductive land into private markets, yielding a rate of return on otherwise
useless land to the Exchequer and also directly relating any future changes in taxation rates or valuation
mechanisms back to the balance sheet of the public sector land holders.
Land-extensive businesses will be potentially the net losers from LVT. This impact will be significantly
minimized, under the flat LVT rate application by the fact that land status under the zoning laws is fully
reflected in price differentials. In other words, public, non-commercial, and agricultural lands will carry
lower rental value under the current zoning provisions, implying much lower burden of taxation.
7.4. Supply-side arguments in favour of LVT
While earlier we considered the links between the LVT reform and the potential for creating a more stable
demand, here we want to focus briefly on the expected benefits of LVT on supply side of the property
markets. This topic was briefly touched upon in sections 3 and 4.
Muellbauer (2006) puts forward a series of arguments showing that the traditional property taxation
regimes disincentivise business, employment and higher wage earners locating in areas with lower cost,
lower demand for business investment. In other words, existent tax systems as operated in the UK are
geared toward reinforcing regional and local inequalities in investment, growth and income. Muellbauer
39
(2006) concludes that “it is obvious that if the tax base… were shifted towards land,… businesses locating
in the low land price locations usually associated with economic deprivation would benefit.”
8. Conclusions
The present paper establishes some main macroeconomic reasons for introducing land value tax in Ireland
as a replacement for existent transactions-based property taxation – the Stamp Duty and development
levies. The scope of this reform requires an entirely separate basis of analysis and will be developed,
alongside the detailed evaluation of international experiences with LVT, in a follow up paper.
Muellbauer (2006) states that “the property tax alternatives to LVT are not attractive.” This, as shown
above, is so because of the following main reasons:
1. Property taxation, especially as practised in Ireland today, introduces distortionary incentives for
development and land speculation;
2. Furthermore, it fails to prevent emergence and orderly deflation of the asset price bubbles in
property markets;
3. It induces extremely high linkages between long term public expenditure financing needs and the
property prices and transactions volumes, inducing a strong positive correlation between asset
price bubbles dynamics and Exchequer revenue;
4. It undermines predictability of the Exchequer revenue and results in unsustainably high
procyclicality of revenue, inducing in return, strong pro-cyclicality of public expenditure;
5. It fails to properly price public infrastructure and social amenities investments, concentrating
returns to these in private developers’ hands;
6. It fails to deliver more environmentally sustainable and socially equitable development;
7. It creates artificial supply constraints for land and property and reduces price-elasticity of demand
for property during the downward price adjustment periods while increasing significantly price-
elasticity of property demand in times of asset price inflation;
40
8. Current tax system reduces liquidity of property holdings for the elderly, resulting in a phenomena
whereby asset-rich, income-poor individuals can lead substandard (in quality) life in exchange for
holding on to largely unutilised existent property;
9. It reduces life-cycle investments in education, business and health, undermines long term savings
and pensions provisions and induces higher risk of pensions default.
Overall, LVT is argued to alleviate all of the above negative attributes of property taxation system that is
based on transactions taxes, providing for delivery of the main objectives for tax reforms as outlined in
section 1.3 above.
41
Bibliography
Abraham, J. and Hendershott, P. (1996) “Bubbles in metropolitan housing markets”, Journal of Housing Research, vol issue 7, pages 191-207. Atisreal and Geofutures (2005) “Property value study – assessing the change in values attributable to the Jubilee Line Extension”. London: Transport for London. Barthelemy, F. and Prigent, J-L (2008) “Optimal time to sell in real estate portfolio management”, The Journal of Real Estate Finance and Economics, 38 (1), January, pages 59-87. Bao, H. X. and Zhou S.Z. (2008) “The land market in Hong Kong: price index and relationship with the property market” Department of Land Economy, University of Cambridge, Working Paper, April 2008: SSRN Number 959890. Bernanke, B. and Gertler, M. (1992) “ The Federal Fundas Rate and the channels of monetary transmission”, Journal of Economic Perspectives, vol 9, issue 4, pages 27-48. Bernanke, B., Gertler, M. and Gilchrist, S. (1996) “The financial accelerator and the flight to quality”, Review of Economics and Statistics, vol 78 (1), pages 1-15. Bernanke, B., Gertler, M. and Gilchrist, S. (1999) “The financial accelerator in a quantitative business cycle framework”, in Handbook of Macroeconomics, ed. John Taylor and Michael Woodford, NY: North Holland. CBFSAI (2007a), Quarterly Bulletin 2, 2007 CBFSAI (2007b), Quarterly Bulletin 3, 2007 Cheshire, P. and Sheppard, S. (2005) “The introduction of price signals into land use planning decision-making: a proposal”, Urban Studies 42 (4), pages 647-663. Chiuri, M. and Jappelli, T. (2008) “Do elderly reduce housing equity? An international comparison”, Journal of Population Economics, ISSN: 1432-1475 (online), August 2008. Claesens, S., Kose, A. and Terrones, M. E. (2008) “What happens during recessions, crunches and busts?” IMF Working Paper, WP/08/274, SSRN: id316742. Davy (2009) Daily research note, Davy Stockbrokers, April 29, 2009. DEHLG (2009) Department of the Environment and Local Government, hhtp://www.environ.ie/en/Publications/StatisticsandRegularPublications/HousingStatistics/FileDownLoad,2277,en.XLS ESRI (2008): http://www.esri.ie/irish_economy/ Goodhart, C., Hoffman, B. and Segoviano, M. (2004) “Bank regulation and macroeconomic fluctuations”, forthcoming in Oxford Review of Economic Policy. Gurdgiev C. (2003) “Exogenous liquidity supply in presence of repudiation risk and private asset recover”, Trinity College, Department of Economics Working Paper no TEP 2003/7, forthcoming in Frontiers in Economics and Finance.
42
Gurdgiev, C. (2006a) “An alternative vision of Ireland in contrast with the current spatial development mantra”, in SubUrban to SuperRural:Ireland at the Venice Biennale 10th International Architecture Exhibition, ed Shane O’Toole, Gandon Editions, ISBN 0-948037-37-7), pages 96-104. Gurdgiev, C. (2006b) “Owner-occupied housing in a model of exchange rate determination”, Journal of Housing Economcis, 15(2006) pages 217-229. Gurdgiev, C and Lucey, B. (2009) “What’s the real price of NAMA?”, Business & Finance, 23rd of April – 6th of May, 2009, pages 30-31. HM Treasury (2003) “Submission on EMU from leading academics”. Huhne, C. (2004) “Why we should follow Pittsburgh”. New Statesman, September 27, 2004, pages 38-39. Maxwell, D. and Vigor, A. (2005) “Land Value Tax: worth the transition?” IPPR and University of Oxford, Department of Politics and International Relations. McLean, Iain (2005) “Land Value Tax: options for reform” in The citizen’s stake: exploring the future of universal asset policies”, ed. W. Paxton, S. White and D. Maxwell, Policy Press, London, 2005. Muellbauer, J. (2006) “Property taxation and the economy”, Economic Journal, volume 115, Issue 502. Quan, D. C. and Titman, S. (1997) “Commercial real estate prices and stock market returns: an international analysis”, Financial Analysts Journal, vol 53, 3, May 1997, pages 21-34. Riley, D. (2001) “Taken for a ride: trains, taxpayers and the Treasury”. Policy Paper, Middlesex: Centre for Land Policy Studies. Scheinkman, J. and Xiong, W. (2003) “Overconfidence and speculative bubbles”, Journal of Political Economy, vol 111(6) pages 1183-1219, December. Shiller, R. J. (2000) Irrational Exuberance, Princeton, N.J.: Princeton University Press, 2000, pages 225-228. South East Commission (2005) “Commission on Sustainable Development in the South East: Final Report”, London, IPPR. Taylor, A. and Goodhart, C. (2004) “Procyclicality and volatility in the financial system: the implementation of Basel II and IAS 39”, Draft paper. Financial Markets Group, London School of Economics. Taylor, L. (1998) “Does the United States overinvest in housing?” Federal Reserve Bank of Dallas, Economic Review, Q2 1998 pages 10-18. Travers, T. (2005) “Freedom is a must for sustainable communities to work”. Local Government Chronicle, June 23, 2005, page 7. Tse, R.Y.C. (2001) “Impact of property prices on stock prices in Hong Kong”, Review of Pacific Basic Financial Markets and Polities, Vol 4, number 1, 2001, pages 29-43. Vayanos, D. (1998) “Transactions costs and asset prices: a dynamic equilibrium model”, Review of Financial Studies 11, Spring 1998, pages 1-58.
43
Appendix A: Links between the property and asset markets in Ireland, 1983-2008.
(Based on a research project: Irish stock markets valuations and fundamentals of public, private and
corporate debt, by Deirdre Reilly, 2009, Trinity College, Dublin, under supervision of Dr Constantin
Gurdgiev)
In contrast with international research, there is little understanding and research into the relationship
between national house prices and the stock market valuations in the Irish economy.
Tse (2001) analysis the impact of property prices on stock prices in Hong Kong between 1974 and 1998.
Real estate-related firms account for over 30% of Hong Kong's stock market capitalization and Tse (2001)
finds that changes in stock prices tend to move with changes in residential and office property prices in the
long run. Furthermore, the study finds that the property and stock prices series are cointegrated and an
impulse response function may be employed to examine the dynamic relationships between real estate and
common stock prices. It is found that although changes in expectations is an important determinate of the
short-run correlation between property and stock prices, the long-run positive correlation is attributable to
economic fundaments that impact on both property and stock prices.
Quan and Titman (1997) examine the relationship between stock returns and changes in property values
and rents on data from 17 different countries. When the data is pooled, Quan and Titman (1997) find a
very strong relation between stock returns and both value changes and changes in rental rates. This positive
relation is mainly due to countries such as the UK, Japan and a number of smaller countries, particularly in
the Asia/Pacific region. The relation between stock and real estate prices is significant is some countries
and not in others. While this may be caused by fundamental differences in the structure of the economies, it
should be noted that the countries with the most reliable data, that is, the U.S., Australia, Canada, and Hong
Kong, all had insignificant relations between stock and real estate prices.
A.1. Data
The data for average monthly national house prices from January 1996 to December 2008 was obtained
from Daft.ie. Pre-1996, quarterly national house prices, broken down into new and second-hand homes, are
available from the Department of the Environment, Heritage and Local Government (DOEHLG) (2009).
Quarterly average house prices and quarterly rates of change in house prices were calculated by getting the
overall average price of new and second-hand, based on the overall breakdown between the two for the
period 1980 to 2008 (44% to 56%). The DOEHLG rates of change are used to take the Daft.ie statistics
back pre-1996, by converting the quarterly rates of change into monthly rates using the exponential
function. The levels series for house prices, plotted against time, is shown in Figure A.1.
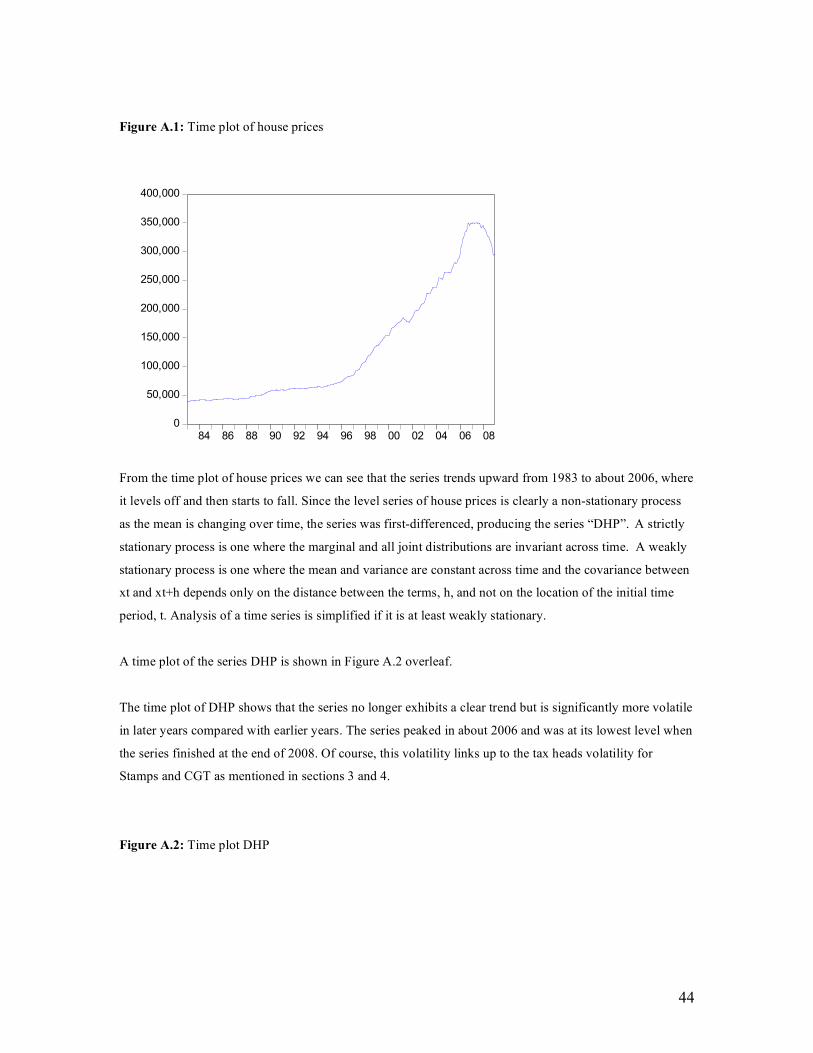
44
Figure A.1: Time plot of house prices
0
50,000
100,000
150,000
200,000
250,000
300,000
350,000
400,000
84 86 88 90 92 94 96 98 00 02 04 06 08
House Prices
From the time plot of house prices we can see that the series trends upward from 1983 to about 2006, where
it levels off and then starts to fall. Since the level series of house prices is clearly a non-stationary process
as the mean is changing over time, the series was first-differenced, producing the series “DHP”. A strictly
stationary process is one where the marginal and all joint distributions are invariant across time. A weakly
stationary process is one where the mean and variance are constant across time and the covariance between
xt and xt+h depends only on the distance between the terms, h, and not on the location of the initial time
period, t. Analysis of a time series is simplified if it is at least weakly stationary.
A time plot of the series DHP is shown in Figure A.2 overleaf.
The time plot of DHP shows that the series no longer exhibits a clear trend but is significantly more volatile
in later years compared with earlier years. The series peaked in about 2006 and was at its lowest level when
the series finished at the end of 2008. Of course, this volatility links up to the tax heads volatility for
Stamps and CGT as mentioned in sections 3 and 4.
Figure A.2: Time plot DHP

45
-12,000
-8,000
-4,000
0
4,000
8,000
12,000
84 86 88 90 92 94 96 98 00 02 04 06 08
DHP
Figure A.3: Time plot of ISEQ
-.3
-.2
-.1
.0
.1
.2
.3
84 86 88 90 92 94 96 98 00 02 04 06 08
ISEQ
To construct a monthly series for the ISEQ, the daily value for the index was obtained from Econwin. This
was converted into a monthly series of the percentage change in the value of the index from the start of the
month to the end of the month. The value on the first day of trading of the month was subtracted from the
value on the last day of trading, and the answer was divided by the value for the first day of trading. A time
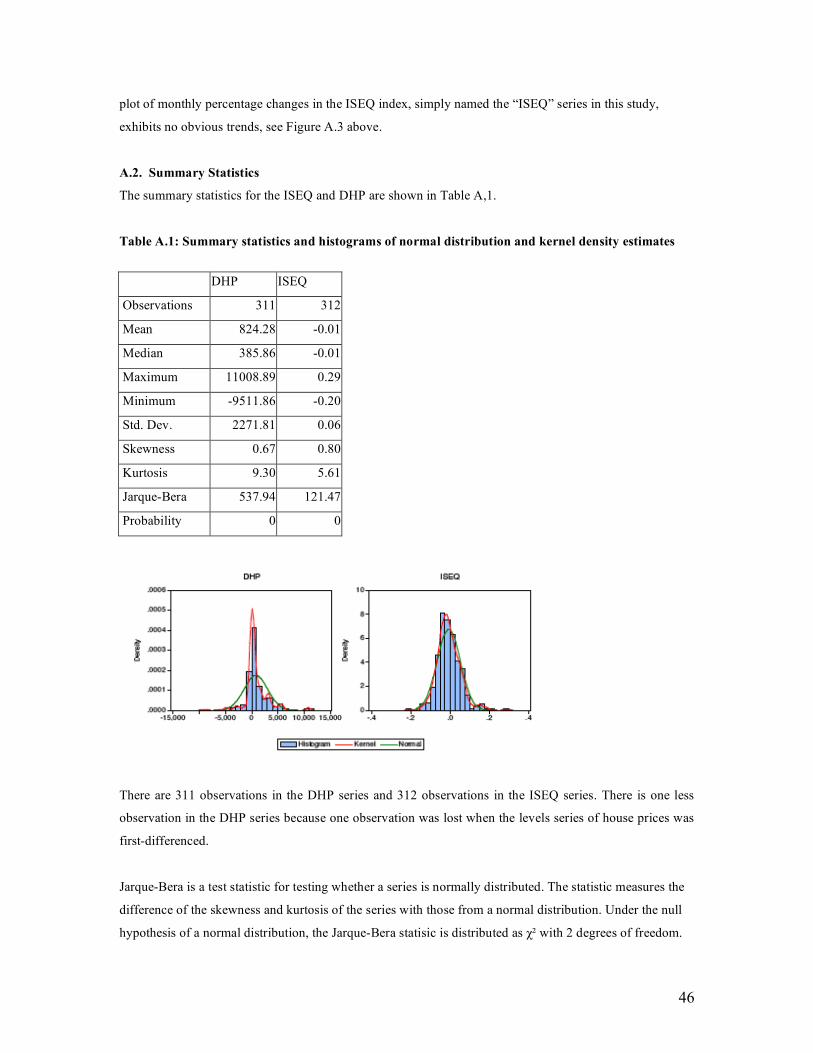
46
plot of monthly percentage changes in the ISEQ index, simply named the “ISEQ” series in this study,
exhibits no obvious trends, see Figure A.3 above.
A.2. Summary Statistics
The summary statistics for the ISEQ and DHP are shown in Table A,1.
Table A.1: Summary statistics and histograms of normal distribution and kernel density estimates
DHP ISEQ
Observations 311 312
Mean 824.28 -0.01
Median 385.86 -0.01
Maximum 11008.89 0.29
Minimum -9511.86 -0.20
Std. Dev. 2271.81 0.06
Skewness 0.67 0.80
Kurtosis 9.30 5.61
Jarque-Bera 537.94 121.47
Probability 0 0
There are 311 observations in the DHP series and 312 observations in the ISEQ series. There is one less
observation in the DHP series because one observation was lost when the levels series of house prices was
first-differenced.
Jarque-Bera is a test statistic for testing whether a series is normally distributed. The statistic measures the
difference of the skewness and kurtosis of the series with those from a normal distribution. Under the null
hypothesis of a normal distribution, the Jarque-Bera statisic is distributed as χ² with 2 degrees of freedom.
47
The reported probability is the probability that a Jarque-Bera statistic exceeds (in absolute value) the
observed value under the null hypothesis. With a probability of zero percent, the null hypothesis of a
normal distribution is clearly rejected for the DHP and ISEQ series. Both series are positively skewed and
leptokurtic. This is clearly shown in the figure enclosed in Table 1 above.
A.3. Dynamic Structure of the Time Series
A.3.1 The Autocorrelation Function
A common finding in time series analysis is that the values of a series are correlated with their past values.
To determine the dynamic nature of the DHP and ISEQ series, the autocorrelation function (ACF) and
partial autocorrelation function (PACF) of the series in levels and first differences were plotted. The ACF
of a series describes the correlation of the values of a series at different points in time, as a function of the
two times or the time difference. It is helpful in capturing the linear dynamic of a series. The PACF of a
stationary time series is a function of its ACF. The ACF and PACF are useful in determining the order of p
of an autoregressive (AR) process or a moving average (MA) process.
The ACF of the DHP series falls of exponentially, indicating that an AR model may be appropriate. The
first 15 observations are significantly positively correlated at the 5 percent significance level. The PACF is
significant for the first, second, and sixth observation, indicating that series may incorporate AR(1), AR(2)
and AR(6) parameters. For an AR(p) series, the sample PACF should cut off at lag p. The Ljung-Box Q-
statistic, which is reported with the autocorrelation function for each lag, basically tests whether any of the
autocorrelations up to and including the particular lag are significantly different from zero at the 5 percent
significance level. All of the reported Q-statistics are statistically significant at even the 1 percent
significance level.
The ACF of the first differenced DHP series is only statistically significant at the 5 percent level on the first
lag, exhibiting negative correlation. The PACF shows that the first 5 lags are negative and statistically
significant at the 5 percent level. However, the Q-statistic is statistically significant at the 1 percent
significance level for all the reported lags.
Both the ACF and the PACF of the levels of the ISEQ series are only statistically significant at the 5
percent level for the first and fifth lag, where it displays positive correlation. The Q-statistic is significant at
the 5 percent level for the first, second, fifth, sixth and tenth lags. Considering the advantages of keeping
the number of parameters in the model low, a MA model with only MA(1) and MA(5) parameters may be
appropriate. However, the PACF of a pure MA process asymptotes gradually to zero, which is not the case
here. Therefore, a low order autoregressive moving average (ARMA) model, which incorporate the ideas of
48
AR and MA models into a compact form to keep the number of parameters small, may be more
appropriate.
The ACF of the first-differenced ISEQ series shows that only the first lag is significant at the 5 percent
level, being negatively correlated. The PACF is negatively correlated and statistically significant at the 5
percent level for the first 9 observations. In this case, the PACF does asymptotically go to zero, indicating
that a MA model may be appropriate. However, this PACF suggest that a higher order MA process may be
required. The Q-statistics for all reported lags of the first differenced ISEQ series are statistically
significant at the 5 percent level.
A.3.2 Unit Root Testing
A time series may be non-stationary because it is a unit root process. A unit root process is a highly
persistent time series process where the current value equals the last period’s value, plus a weakly
dependent disturbance. Shocks to unit root processes have permanent effects that do not decay over time.
Ordinary least squares (OLS) estimation requires that a stochastic process be stationary. It is important to
check a time series for unit roots because in the presence of such roots OLS will produce spurious
regression results that are invalid.
The strong memory of a unit root process can be seen in the sample ACF of the observed series. The
sample ACFs all approach 1 as the sample size increases. Neither the DHP nor ISEQ ACF exhibit such
behaviour, suggesting that they do not have unit roots. Nevertheless, formal unit root tests were conducted
on the series.
The Dickey-Fuller test is a t test of the null hypothesis of a unit root in an AR(1) model. We can reject the
null hypothesis when the observed test statistic is less than the critical value, where the asymptotic
distribution of the test statistic under the null hypotheses is the Dickey-Fuller (DF) distribution. The
Augmented Dickey-Fuller (ADF) test is a test for a unit root that includes lagged changes of the variable as
regressors. Similarly, the null hypothesis is that the series has a unit root and it can be rejected when the
observed test statistic is less than the critical value, where the asymptotic distribution of the test statistic
under the null hypotheses is the DF distribution. The Philips-Perron (PP) test is an alternative test for
detecting a unit root process in a time series. Again, the null hypothesis is that the series has a unit root and
we can reject the null hypothesis when the observed test statistic is less than the critical value as given by
the DF distribution.
Using the ADF test for the DHP series, with both 5 and 12 lags, the null hypothesis of a unit root series
could not be rejected even at the 10 percent significance level, see Appendix 2 for the unit root tests. Unlike
the ADF test on DHP, using the PP test we can reject the null hypothesis of a unit root at the 1 percent
49
significance level. Similarly, the null hypothesis can be rejected at the 1 percent significance level with the
DF test. However, the simple DF test may be untrustworthy because the validity of the critical values relies
on the dynamics being correctly modelled.
Conducting the ADF test on the ISEQ series and allowing EViews to automatically select the number of
lags, resulted in doing the simple DF test because the program automatically selected zero lags. The null
hypothesis of a unit root process could be rejected at the 1 percent significance level. Because of the
monthly nature of the data, an ADF test that specified 12 lags was carried out. This resulted in a test
statistic that could be rejected at no lower than an 8 percent significance level. However, the PP test
allowed the null hypothesis to be rejected at the 1 percent significance level.
Considering both the mixed nature of the results from the formal unit root test and the behaviour of the
ACFs, for both the DHP and ISEQ series, it was decided to cautiously reject the null hypothesis of the
processes having a unit root.
A.4. Statistical Modelling using ARCH techniques
Modeling the volatility of a time series can improve the efficiency in parameter estimation and the accuracy
in interval forecast. The basic idea of volatility study is that the time series is either serially uncorrelated or
has minor lower order serial correlation, however it is a dependent series, Tsay (2005).
A.4.1 Statistical Modelling of DHP
The ACF of the residuals from the model of DHP with AR(1), AR(2) and AR(6) parameters suggested that
there was no significant serial correlations. However, the sample ACF of the squared residuals clearly
shows that the series is not serially independent. Each of the lags on the ACF are statistically significant at
the 5 percent level and the Q-statistic suggests they are significant at the 1 percent significance level. The
PACF of the squared residuals indicates that an ARCH(2) model might be appropriate. Therefore, the
following model is specified,
DHP = µ + at, at = σtεt, σt² = α₀ + α₁a²t-₁ + α₂a²t- ₂+ α₃a²t-₃ + α₄a²t-₄ for the DHP series.
Assuming that εt are iid standard normal, the parameters from the obtained fitted model are all significant
at the 1 percent significance level. However, the Q-statistic of standardized residuals and squared
standardized residuals is significant at the 1 percent significance level, suggesting that the mean equation
and volatility equation is inadequate. Rather than adding more parameters to the ARCH model to
adequately describe the volatility process, a generalized ARCH (GARCH) model was sought.
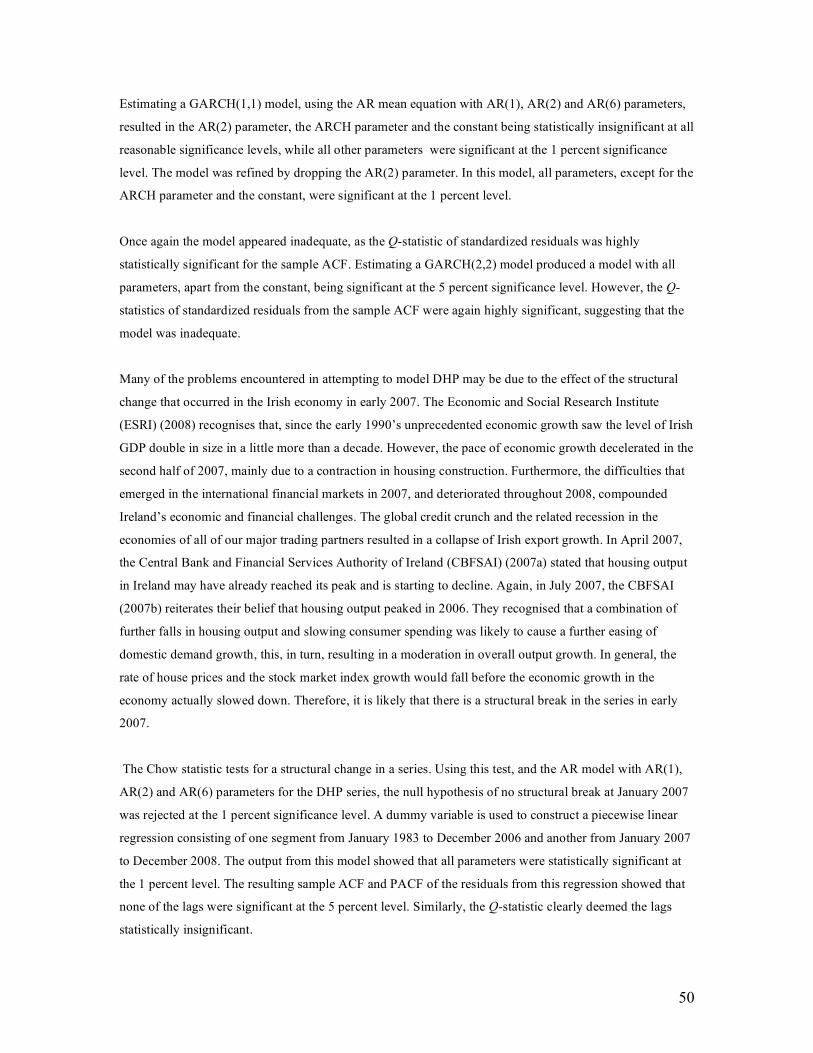
50
Estimating a GARCH(1,1) model, using the AR mean equation with AR(1), AR(2) and AR(6) parameters,
resulted in the AR(2) parameter, the ARCH parameter and the constant being statistically insignificant at all
reasonable significance levels, while all other parameters were significant at the 1 percent significance
level. The model was refined by dropping the AR(2) parameter. In this model, all parameters, except for the
ARCH parameter and the constant, were significant at the 1 percent level.
Once again the model appeared inadequate, as the Q-statistic of standardized residuals was highly
statistically significant for the sample ACF. Estimating a GARCH(2,2) model produced a model with all
parameters, apart from the constant, being significant at the 5 percent significance level. However, the Q-
statistics of standardized residuals from the sample ACF were again highly significant, suggesting that the
model was inadequate.
Many of the problems encountered in attempting to model DHP may be due to the effect of the structural
change that occurred in the Irish economy in early 2007. The Economic and Social Research Institute
(ESRI) (2008) recognises that, since the early 1990’s unprecedented economic growth saw the level of Irish
GDP double in size in a little more than a decade. However, the pace of economic growth decelerated in the
second half of 2007, mainly due to a contraction in housing construction. Furthermore, the difficulties that
emerged in the international financial markets in 2007, and deteriorated throughout 2008, compounded
Ireland’s economic and financial challenges. The global credit crunch and the related recession in the
economies of all of our major trading partners resulted in a collapse of Irish export growth. In April 2007,
the Central Bank and Financial Services Authority of Ireland (CBFSAI) (2007a) stated that housing output
in Ireland may have already reached its peak and is starting to decline. Again, in July 2007, the CBFSAI
(2007b) reiterates their belief that housing output peaked in 2006. They recognised that a combination of
further falls in housing output and slowing consumer spending was likely to cause a further easing of
domestic demand growth, this, in turn, resulting in a moderation in overall output growth. In general, the
rate of house prices and the stock market index growth would fall before the economic growth in the
economy actually slowed down. Therefore, it is likely that there is a structural break in the series in early
2007.
The Chow statistic tests for a structural change in a series. Using this test, and the AR model with AR(1),
AR(2) and AR(6) parameters for the DHP series, the null hypothesis of no structural break at January 2007
was rejected at the 1 percent significance level. A dummy variable is used to construct a piecewise linear
regression consisting of one segment from January 1983 to December 2006 and another from January 2007
to December 2008. The output from this model showed that all parameters were statistically significant at
the 1 percent level. The resulting sample ACF and PACF of the residuals from this regression showed that
none of the lags were significant at the 5 percent level. Similarly, the Q-statistic clearly deemed the lags
statistically insignificant.
51
While the series may be serially uncorrelated, the ACF and PACF of the squared residuals from the
equation unambiguously show that it is a dependent series. The large spikes at the first and second lag of
the PACF indicates that a ARCH(2) model may be an appropriate volatility model for the series. The
regression output showed that all the parameters from this model were statistically significant at the 1
percent level. The ACF and PACF of squared standardized residuals suggested that much of the linear
dependence in the series had been removed by the employment of the ARCH(2) model, however the
squared standardised residual from the twelfth lag remained statistically significant. Similarly, the Q-
statistic indicated a much lower degree of serial dependence in the series but the sixth and twelfth lag were
statistically significant at the 2 percent level. Rather than estimating a higher order ARCH model to account
for the serial dependence at lags 6 and 12, a GARCH(2,1) model was estimated. The regression output
showed that the AR(1) parameter was now statistically insignificant, while all the other parameters were
significant at the 1 percent level. However, the ACF and PACF of squared standardized residuals and the
Q-statistic indicated that many of the lags were statistically significant. This model did not do as good a job
of capturing the serial dependence in the data as did the ARCH(2) model. The ARCH LM test was
performed to test the standardized residuals of the ARCH(2) model for additional ARCH. The null
hypothesis of no ARCH up to order 12 in the residuals could not be rejected, indicating that the variance
equation is correctly specified. The histogram of standardized residuals is bimodal and the Jarque-Bera
statistic strongly rejects the null hypothesis of normal distribution.
A. 4.2 Statistical Modelling of ISEQ
The ISEQ series would also have been affected by the structural change that occurred in the Irish economy
in early 2007. Performing a Chow test on the MA model of the series with MA(1) and MA(5) parameters,
indicates that the null hypothesis of no structural break can be rejected at a negligible significance level.
Re-estimating the model with a dummy variable to account for this change produces a regression in which
the constant, dummy and MA(1) parameter are significant at the 5 percent level but the MA(5) parameter is
statistically insignificant. Considering the ACF and PACF from ISEQ, modeled simply using a constant
and the dummy, suggests that an MA(1) model may be a more appropriate model when the dummy is used
as an independent variable. The regression output from estimating this model indicates that all the
parameters are significant at the 5 percent level. The resulting ACF, PACF and Q-statistics suggests that the
series is serially uncorrelated.
However, the ACF, PACF and Q-statistics of the squared residuals from this model show that the series is
dependent. The nature of the PACF indicates that an ARCH(3) model may capture the dependence in the
series. Estimating this model reduces the significance of the MA(1) parameter, it is now only significant at
the 7 percent significance level. The first ARCH parameter was significant at the 6 percent level, the
second ARCH parameter was statistically insignificant and the third ARCH parameter was significant at the
52
1 percent level. The resulting ACF, PACF and Q-statistics all indicate that the series is no longer
dependent. As an alternative to the ARCH(3) model, the GARCH(1,1) model was estimated to investigate
its ability to model the data. The MA(1) parameter in this model was only significant at the 8 percent level,
while all of the other parameters, apart from the constant, were statistically significant at the 1 percent
level. However, the ACF, PACF and Q-statistics of squared standardized residuals indicated that some of
the of the lags were statistically significant at the 5 percent level. Therefore, the ARCH(3) model appears to
do a better job of modeling the dependence in the series. The ARCH LM test was carried out to test the
standardized residuals of the ARCH(3) model for additional ARCH. The null hypothesis of no ARCH up
to order 12 in the residuals could not be rejected, indicating that the variance equation is correctly specified.
The descriptive statistics and histogram of standardized residuals show that the standardized residuals are
leptokurtic and slightly positively skewed. The Jarque-Bera statistic strongly rejects the null hypothesis of
normal distribution.
A.5. Cointegration of the Series
When a linear combination of two or more non-stationary time series is stationary, the series are said to be
cointegrated. The linear combination is known as the cointegrating equation and may be interpreted a long-
run equilibrium relationship between the variables. The earlier tests of DHP and ISEQ for the presence of
units produced mixed results, however it was decided to cautiously assume the series were intergrated of
order zero. Yet if both series have one or more unit roots, then it is possible that they are cointergrated, and
that they share a common trend. Academic studies, discussed in Section A.1, found that in some
economies, house prices are related to the value of the country’s stock market, it is plausible that changes in
Irish house prices would be related to changes in the value of the ISEQ index. Furthermore, a simple
measure of the correlation between the series indicates that they have a correlation of –0.2.
A.5.1 Cointegration Testing
Under the assumption that both series are non-stationary, the Johansen cointegration test was used to test if
the series are cointegrated. The results of the Johansen test are sensitive to the number of lags of the first
differenced terms in the auxiliary regression. When 0 to 5 lags are specified, both the trace statistic and the
maximum eigenvalue statistic indicated that there existed two cointegration relations between the variables.
However, when 6 to 12 lags were specified, both the trace statistic and the maximum eigenvalue statistic
indicated that one conintegration relationship was present among the variables. With 13 or more lags, both
the trace statistic and the maximum eigenvalue statistic reported that there was no cointegration among the
variables.
A.5.2 Vector Error Correction Model

53
A vector error correction (VEC) model is designed for use with cointegrated nonstationary series. The VEC
model has cointegration relations built into the specification in such a way that it restricts the long-run
behaviour of the endogenous variables to converge to their cointegrating relationships yet allowing for
short-run adjustment dynamics. The cointegration term is known as the error correction term because the
deviation from long-run equilibrium is corrected gradually through a series of partial short-run adjustments,
EViews (2007). In order to decide how many differenced lags to include in the VEC model, the vector
autoregressive (VAR) lag length criteria was computed. The sequential modified likelihood ratio test
statistic, final prediction error and Akaike information criterion (AIC) all suggested that 6 differenced lags
be included. The Schwarz information criterion (SC) selected one, while the Hannan-Quinn information
criterion selected two. Since the majority of the information criteria suggested 6 lags, a VEC with 6
differenced lags was computed. To investigate the need for 6 lags, a Wald test for lag exclusion was carried
out. The results suggested that the sixth lag be excluded and in the ISEQ equation lags 2 to 5 may not be
necessary either. The AIC and SIC that resulted from the re-estimation of the VEC with 5 differenced lags
was actually larger than that from the VEC with 6 lags, indicating that the VEC model with 6 lags was
preferred to that with 5 lags. Considering all the information available, it was decided to proceed with the
VEC model with 6 differenced lags.
An examination of the inverse roots from the AR characteristic polynomial suggests that the estimated
VEC is stationary. The modulus of each of the roots, apart from the single unit root, which is assumed by
the nature of the model, are less than one in absolute value and lie inside the unit circle. A graph of the pair-
wise cross-correlograms for the estimated residuals in the VEC shows that the absolute value of the
correlation between ISEQ and DHP(-8) exceeds twice the asymptotic standard errors of the lagged
correlations. However, the Portmanteau autocorrelation test indicates that none of the residual serial
correlations are statistically significant. Similarly, the Lagrange Multiplier (LM) test for residual serial
correlation up to lag 12 signifies that the null hypothesis of no serial correlation cannot be rejected at the 5
percent significance level for any of the lags, although it is very close to rejection at the eight lag. It is clear
from the Jarque-Bera residual normality tests, using 3 different orthogonalisation methods (Cholesky of
covariance, square root of correlation and square root of covariance), that the residuals from the VEC
model with 6 differenced lags do not conform to a normal distribution. The White hetroskedasticity tests,
with and without cross terms, test the null hypothesis of no hetroskedasticity or no misspecification. In both
cases the null hypothesis can be rejected at the 1 percent significance level. The output from the VEC with
6 differenced lags indicates that the mean of the difference between the ISEQ and DHP is about zero. This
can also been seen by examining the graph of the cointegrating relationship, see Figure A.4.
Figure A.4: Cointegration Relationship between ISEQ and DHP
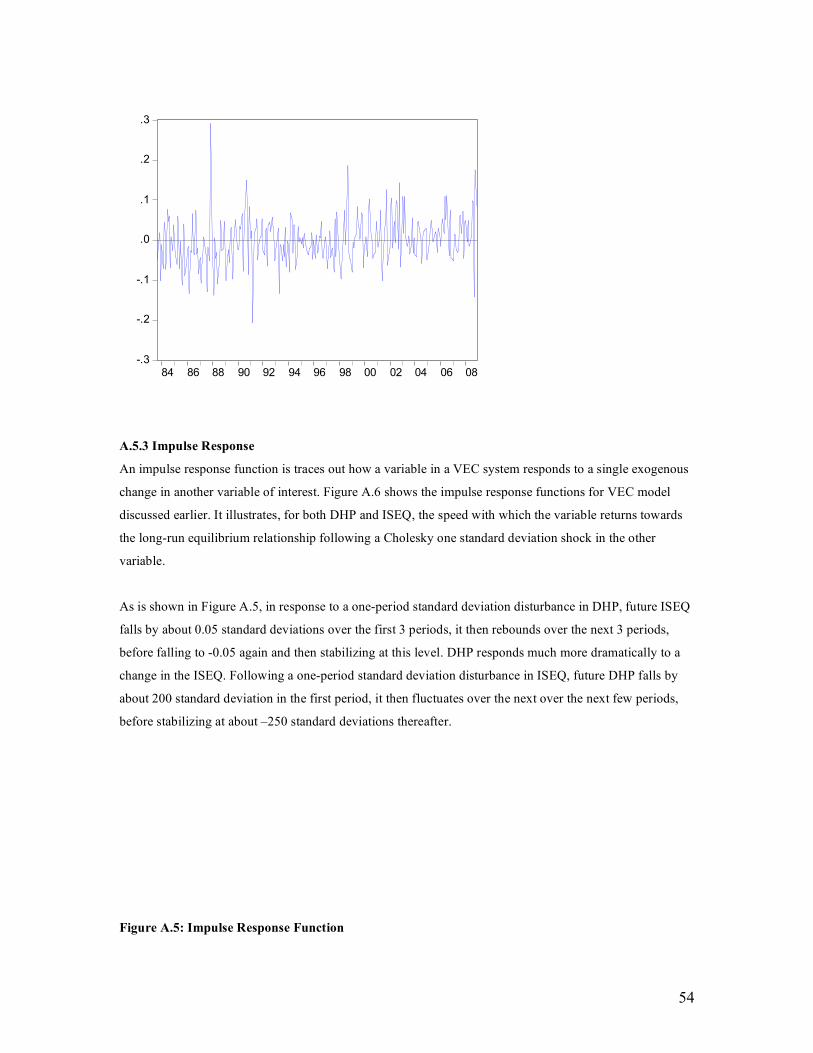
54
-.3
-.2
-.1
.0
.1
.2
.3
84 86 88 90 92 94 96 98 00 02 04 06 08
Cointegrating relation 1
A.5.3 Impulse Response
An impulse response function is traces out how a variable in a VEC system responds to a single exogenous
change in another variable of interest. Figure A.6 shows the impulse response functions for VEC model
discussed earlier. It illustrates, for both DHP and ISEQ, the speed with which the variable returns towards
the long-run equilibrium relationship following a Cholesky one standard deviation shock in the other
variable.
As is shown in Figure A.5, in response to a one-period standard deviation disturbance in DHP, future ISEQ
falls by about 0.05 standard deviations over the first 3 periods, it then rebounds over the next 3 periods,
before falling to -0.05 again and then stabilizing at this level. DHP responds much more dramatically to a
change in the ISEQ. Following a one-period standard deviation disturbance in ISEQ, future DHP falls by
about 200 standard deviation in the first period, it then fluctuates over the next over the next few periods,
before stabilizing at about –250 standard deviations thereafter.
Figure A.5: Impulse Response Function
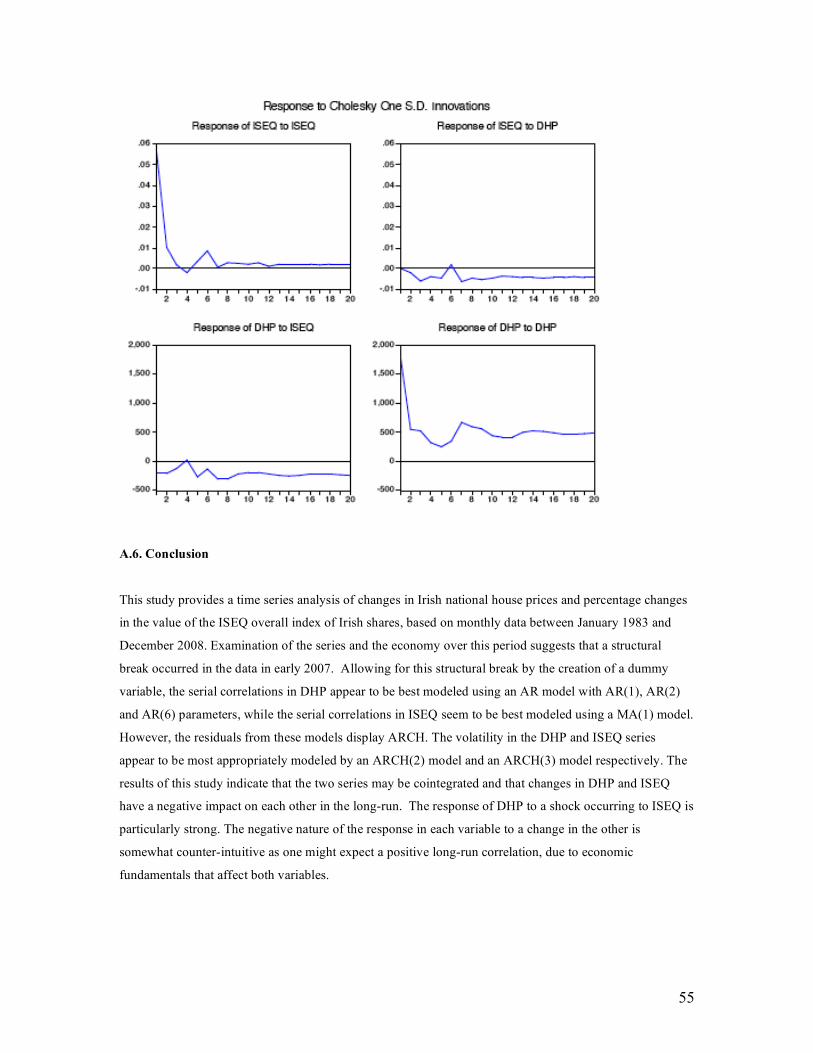
55
A.6. Conclusion
This study provides a time series analysis of changes in Irish national house prices and percentage changes
in the value of the ISEQ overall index of Irish shares, based on monthly data between January 1983 and
December 2008. Examination of the series and the economy over this period suggests that a structural
break occurred in the data in early 2007. Allowing for this structural break by the creation of a dummy
variable, the serial correlations in DHP appear to be best modeled using an AR model with AR(1), AR(2)
and AR(6) parameters, while the serial correlations in ISEQ seem to be best modeled using a MA(1) model.
However, the residuals from these models display ARCH. The volatility in the DHP and ISEQ series
appear to be most appropriately modeled by an ARCH(2) model and an ARCH(3) model respectively. The
results of this study indicate that the two series may be cointegrated and that changes in DHP and ISEQ
have a negative impact on each other in the long-run. The response of DHP to a shock occurring to ISEQ is
particularly strong. The negative nature of the response in each variable to a change in the other is
somewhat counter-intuitive as one might expect a positive long-run correlation, due to economic
fundamentals that affect both variables.