Embed Size (px)
Citation preview
Macroeconomic and Distributional Effects of Devaluation
in a Dollarized Economy:
A CGE Analysis for Bolivia
Abstract:
In this paper, a real-financial CGE model is employed for Bolivia to simulate the macroeconomic and distributional effects of exchange rate policy in a highly dollarized economy. Overall, dollarization appears to matter more through real than through financial-sector effects. The main macroeconomic result of the simulations is that the potential of nominal devaluation to smooth the adjustment path after a negative shock primarily depends on the absence of wage indexation. Only if nominal wages are constant in the short run, devaluation reduces unemployment and cushions the reduction of real GDP induced by the shock. Financial de-dollarization tends to be contractionary in Bolivia but different degrees of financial dollarization hardly change the real sector effects. As concerns distributional effects, nominal devaluation in no circumstance reduces the poverty effect of the external shock. Even the significant short-run macroeconomic expansion that occurs without wage indexation does not translate into significant poverty alleviation, given the offsetting effects of devaluation on real factor incomes, real interest incomes, and real transfers received by households. Keywords: Dollarization, Poverty, Computable General Equilibrium Model, Bolivia
JEL–classification: 016, D3, C68 corresponding author : Rainer Schweickert/Rainer Thiele Manfred Wiebelt Kiel Institute for World Economics Kiel Institute for World Economics 24100 Kiel, Germany 24100 Kiel, Germany Phone: +49/431/8814-494/-215 Phone: +49/431/8814-211 Fax: +49/431/8814-502 Fax: +49/431/8814-502 Email: [email protected] E-mail: [email protected] [email protected]
1
I. Introduction
In resource-based developing economies that suffer from recurrent external shocks, there
ought to be a large potential role for exchange rate policy as a means of mitigating the
ensuing macroeconomic instability. Real devaluation after a negative external shock could be
expected to have an expansionary effect, thereby smoothing the adjustment path of the
economy. At the same time, real devaluation could be expected to favor poor export-
competing producers at the expense of wealthier import-consuming parts of the population
(Klasen et al. 2004). Among the factors that might compromise a devaluation strategy in such
a setting, de-facto dollarization, which is wide-spread in Latin America (Heysen 2005),
figures prominently. De-facto dollarization implies high pass-through of nominal exchange
rate changes, which reduces the effectiveness of nominal devaluation with respect to
achieving a real devaluation, and a high degree of financial dollarization, which affects the
wealth and real balance effects of a nominal devaluation (Levy-Yeyati and Sturzenegger
2003: 11–14).
Against this backdrop, the present paper evaluates the macroeconomic, distributional and
poverty impacts of devaluation in one particular country, Bolivia, employing a recursive-
dynamic real-financial Computable General Equilibrium (CGE) model. Being highly
dollarized, highly indebted, poor, and shock-prone at the same time, Bolivia is an ideal
candidate for such a case study. The country is still confronted with the protracted economic
crisis that started in the late 1990s with the negative impact of El Niño and a sharp reversal of
FDI inflows following the drastic devaluations in Brazil and Argentina in 1999 and 2002.
This raises two questions. Would a more active exchange rate policy have been helpful to
restore the country’s international competitiveness, and would a stronger real depreciation
have helped to mitigate the distributional consequences of external shocks by favoring poor
export and import-competing producers at the expense of wealthier import-consuming
segments of the population?
The remainder of the paper is structured as follows. Chapter II discusses the major links
between devaluation and dollarization, both in general terms and with specific reference to
Bolivia. The modeling framework is introduced in Chapter III. Chapter IV contains the
simulation results. Three assumptions about dollarization are considered: full dollarization,
financial dollarization, and partial financial dollarization. The paper closes with some
concluding remarks in Chapter V.
2
II. Devaluation and Dollarization
The scope for using exchange rate adjustment in order to smooth external shocks is limited by
the potential pass-through to inflation and the impact on the financial system. Bolivia’s quasi-
crawling peg has helped to avoid excess exchange rate volatility and to provide a visible,
short-term anchor for inflation. However, such an exchange rate regime faces important
shortcomings due to a lack of transparency about the final target of the central bank, the
limited scope for rapid exchange rate adjustments due to the high potential pass-through of
the exchange rate to inflation, and concerns about the financial system soundness in view of a
high degree of financial dollarization (IMF 2003).
Portfolio balance models considering both sides of banks’ balance sheets find that financial
dollarization depends on the volatility of real return on assets denominated in each currency.
This is a function of the volatility of real exchange rates changes relative to inflation rate
changes. An important implication is that policies such as a quasi-crawling peg that target at
least to some extent a stable real exchange rate should not expect to reduce financial
dollarization. Another implication is that economies with a high pass-through due to
widespread dollar pricing as a result of previous high inflation rates will exhibit higher
dollarization ratios irrespective of their current inflation levels (Levy-Yeyati and Sturzenegger
2003).
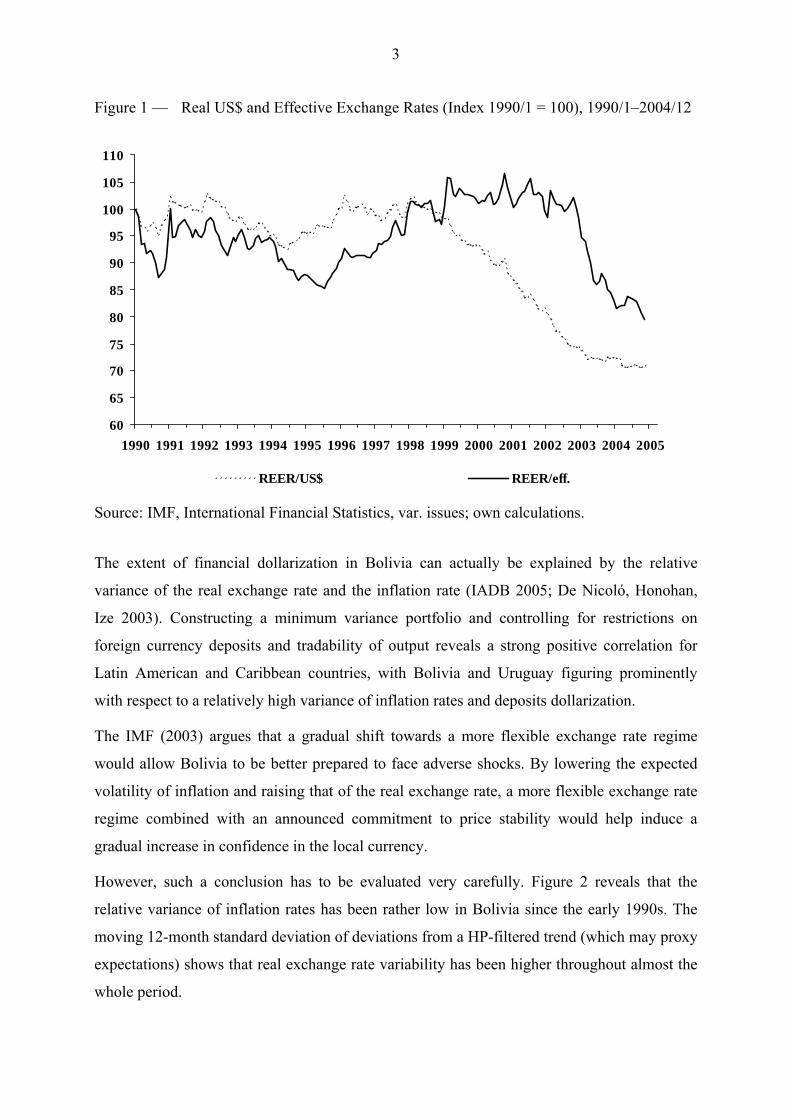
This fits quite well with the stylized facts of exchange rate policy and dollarization in Bolivia.
As can be seen in Figure 1, the quasi-crawling peg regime in Bolivia actually delivered real
exchange rate stability until recently. This allowed for a remonetization of the economy. The
ratio of deposits to GDP increased from a low level of about 15 percent at the beginning of
the 1990s to about 40 percent at the end of the 1990s. At the same time, however, Bolivia
became probably the most dollarized economy among those that have stopped short of full
dollarization. In 2003, the degree of deposit dollarization in the banking system rose to about
92 percent, dollar-denominated deposits accounted for 77 percent of broad money and bank
credit to the private sector in dollars was close to 97 percent (IMF 2003).
3
Figure 1 — Real US$ and Effective Exchange Rates (Index 1990/1 = 100), 1990/1–2004/12
60
65
70
75
80
85
90
95
100
105
110
1990 1991 1992 1993 1994 1995 1996 1997 1998 1999 2000 2001 2002 2003 2004 2005
REER/US$ REER/eff.
Source: IMF, International Financial Statistics, var. issues; own calculations.
The extent of financial dollarization in Bolivia can actually be explained by the relative
variance of the real exchange rate and the inflation rate (IADB 2005; De Nicoló, Honohan,
Ize 2003). Constructing a minimum variance portfolio and controlling for restrictions on
foreign currency deposits and tradability of output reveals a strong positive correlation for
Latin American and Caribbean countries, with Bolivia and Uruguay figuring prominently
with respect to a relatively high variance of inflation rates and deposits dollarization.
The IMF (2003) argues that a gradual shift towards a more flexible exchange rate regime
would allow Bolivia to be better prepared to face adverse shocks. By lowering the expected
volatility of inflation and raising that of the real exchange rate, a more flexible exchange rate
regime combined with an announced commitment to price stability would help induce a
gradual increase in confidence in the local currency.
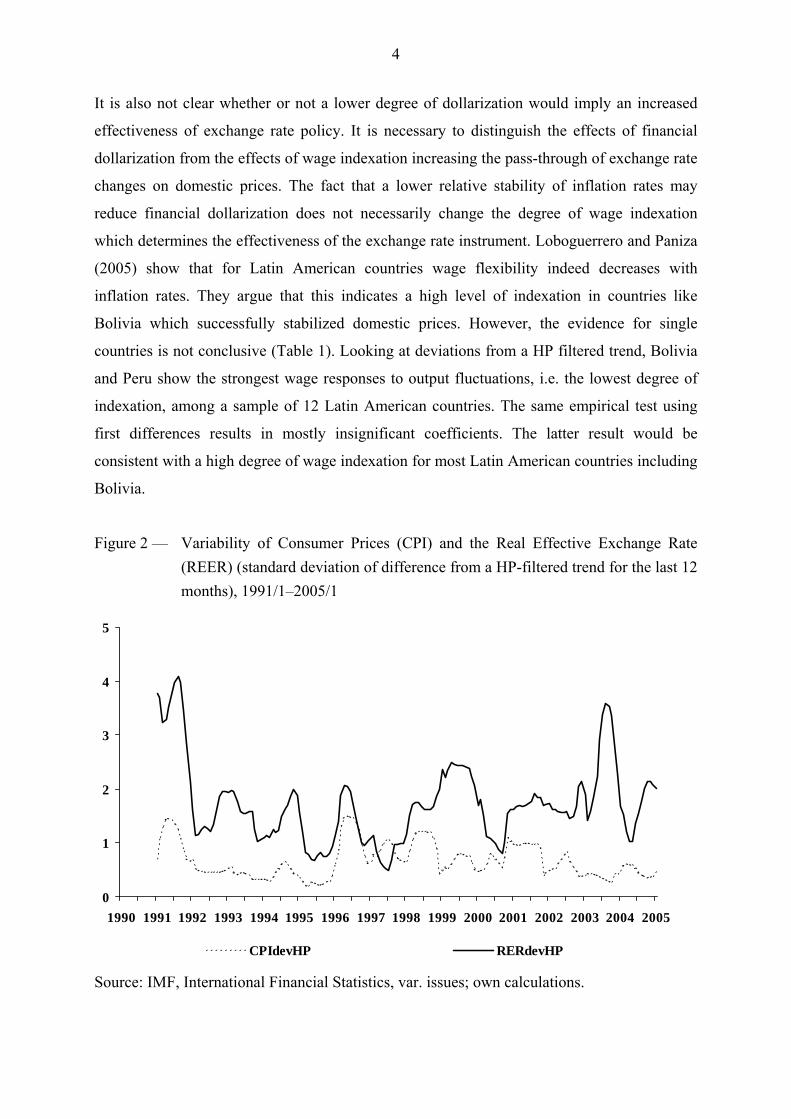
However, such a conclusion has to be evaluated very carefully. Figure 2 reveals that the
relative variance of inflation rates has been rather low in Bolivia since the early 1990s. The
moving 12-month standard deviation of deviations from a HP-filtered trend (which may proxy
expectations) shows that real exchange rate variability has been higher throughout almost the
whole period.
4
It is also not clear whether or not a lower degree of dollarization would imply an increased
effectiveness of exchange rate policy. It is necessary to distinguish the effects of financial
dollarization from the effects of wage indexation increasing the pass-through of exchange rate
changes on domestic prices. The fact that a lower relative stability of inflation rates may
reduce financial dollarization does not necessarily change the degree of wage indexation
which determines the effectiveness of the exchange rate instrument. Loboguerrero and Paniza
(2005) show that for Latin American countries wage flexibility indeed decreases with
inflation rates. They argue that this indicates a high level of indexation in countries like
Bolivia which successfully stabilized domestic prices. However, the evidence for single
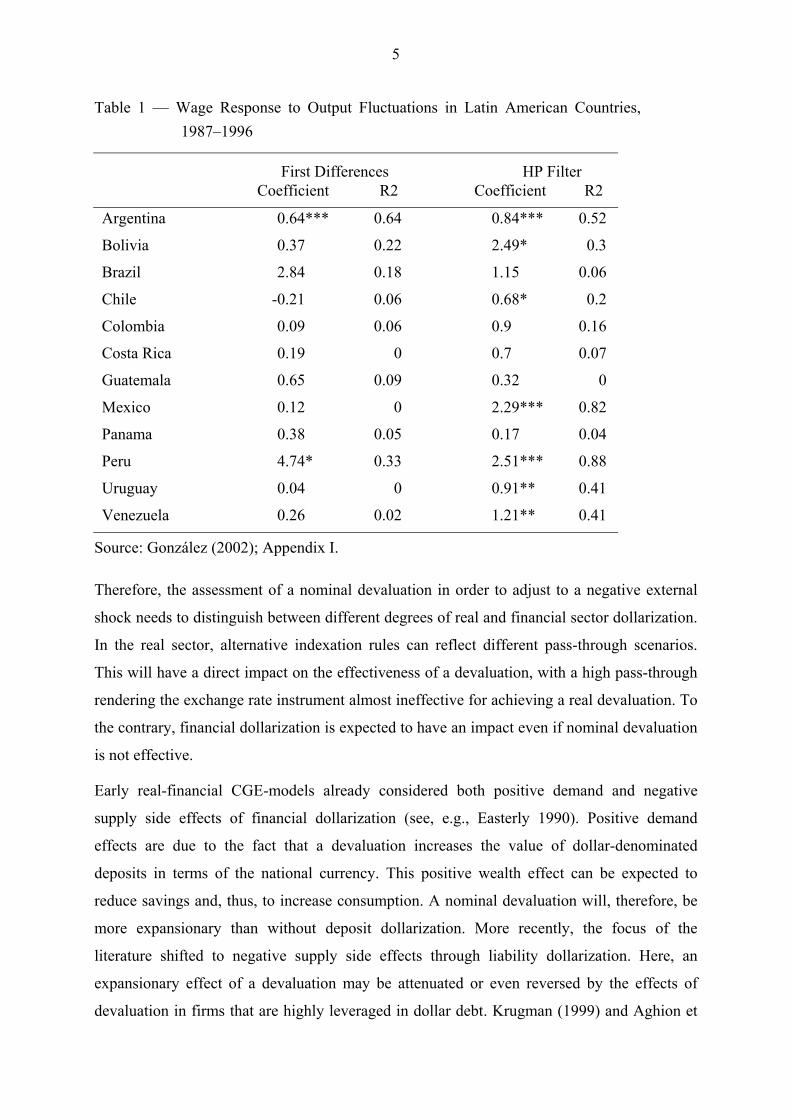
countries is not conclusive (Table 1). Looking at deviations from a HP filtered trend, Bolivia
and Peru show the strongest wage responses to output fluctuations, i.e. the lowest degree of
indexation, among a sample of 12 Latin American countries. The same empirical test using
first differences results in mostly insignificant coefficients. The latter result would be
consistent with a high degree of wage indexation for most Latin American countries including
Bolivia.
Figure 2 — Variability of Consumer Prices (CPI) and the Real Effective Exchange Rate (REER) (standard deviation of difference from a HP-filtered trend for the last 12 months), 1991/1–2005/1
0
1
2
3
4
5
1990 1991 1992 1993 1994 1995 1996 1997 1998 1999 2000 2001 2002 2003 2004 2005
CPIdevHP RERdevHP
Source: IMF, International Financial Statistics, var. issues; own calculations.
5
Table 1 — Wage Response to Output Fluctuations in Latin American Countries, 1987–1996
First Differences HP Filter Coefficient R2 Coefficient R2
Argentina 0.64*** 0.64 0.84*** 0.52
Bolivia 0.37 0.22 2.49* 0.3
Brazil 2.84 0.18 1.15 0.06
Chile -0.21 0.06 0.68* 0.2
Colombia 0.09 0.06 0.9 0.16
Costa Rica 0.19 0 0.7 0.07
Guatemala 0.65 0.09 0.32 0
Mexico 0.12 0 2.29*** 0.82
Panama 0.38 0.05 0.17 0.04
Peru 4.74* 0.33 2.51*** 0.88
Uruguay 0.04 0 0.91** 0.41
Venezuela 0.26 0.02 1.21** 0.41
Source: González (2002); Appendix I.
Therefore, the assessment of a nominal devaluation in order to adjust to a negative external
shock needs to distinguish between different degrees of real and financial sector dollarization.
In the real sector, alternative indexation rules can reflect different pass-through scenarios.
This will have a direct impact on the effectiveness of a devaluation, with a high pass-through
rendering the exchange rate instrument almost ineffective for achieving a real devaluation. To
the contrary, financial dollarization is expected to have an impact even if nominal devaluation
is not effective.
Early real-financial CGE-models already considered both positive demand and negative
supply side effects of financial dollarization (see, e.g., Easterly 1990). Positive demand
effects are due to the fact that a devaluation increases the value of dollar-denominated
deposits in terms of the national currency. This positive wealth effect can be expected to
reduce savings and, thus, to increase consumption. A nominal devaluation will, therefore, be
more expansionary than without deposit dollarization. More recently, the focus of the
literature shifted to negative supply side effects through liability dollarization. Here, an
expansionary effect of a devaluation may be attenuated or even reversed by the effects of
devaluation in firms that are highly leveraged in dollar debt. Krugman (1999) and Aghion et
6
al. (2001), e.g., assume this balance sheet effect to be large enough to dominate the
expansionary Mundell-Fleming effect (see also Céspedes et al. 2000). As argued by Calvo
and Reinhart (2002), pervasive liability dollarization may be a cause of fear of floating.
Indeed, Levy-Yeyati et al. (2003) showed that foreign currency-denominated liabilities are
positively related with the probability of pegging the exchange rate against a major currency.
It is also clear that both real and financial sector dollarization should have distributional
consequences by either affecting the possibility to smooth the adjustment to a negative shock
which affects poor households in the tradable sector or by changing the relative wealth
position of poor households depending on their net asset position in the financial sector.
III. A Real-Financial CGE Model for Bolivia
To capture the major links between devaluation and dollarization along the lines discussed
above, we constructed a CGE model for Bolivia that explicitly incorporates financial portfolio
balances. In presenting the modeling framework, we first deal with the accounts describing
the real and financial transactions in the base year 1997, and then move on to explain the
structure of the model, placing particular emphasis on some key transmission mechanisms.
1. Social and Financial Accounts
Table 2 lists the activities, production factors and economic agents for which real and
financial flows are recorded in a Social Accounting Matrix (SAM), and financial stocks in
corresponding Accumulation Balances.1 In keeping with our focus on the distributional
impact of exchange rate policy, the SAM exhibits a high degree of differentiation among
sectors (sectoral distribution), factors of production (extended functional distribution) and
households (socio-economic distribution). The sectoral disaggregation is driven by the need to
account for differences in tradability as these differences are the key determinant of the
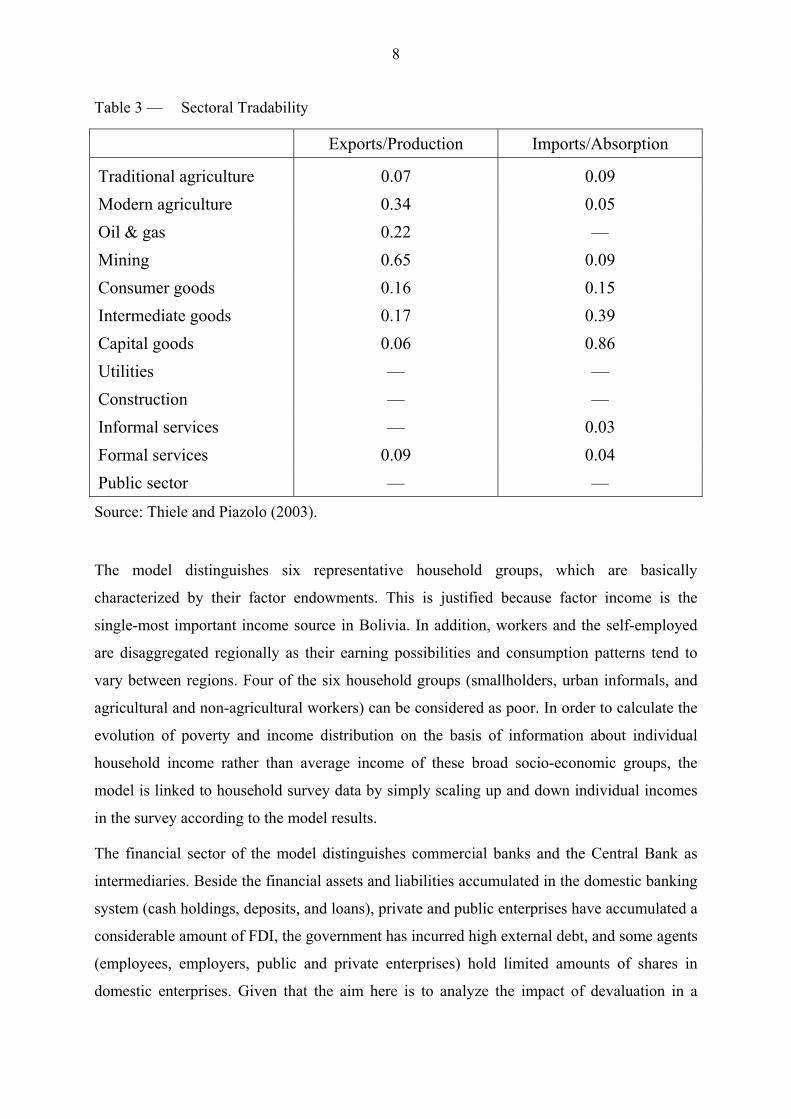
resource reallocation resulting from devaluation. As shown in Table 3, modern agriculture,
oil&gas, and mining are most strongly export-oriented, while intermediate goods and capital
goods can be regarded as typical import-competing activities. At the other end of the
spectrum, some sectors (utilities, construction, informal services, public services) produce
pure non-tradables.
1 A full documentation of the SAM and the Accumulation Balances, along with a detailed
explanation of all major entries, can be found in Thiele, Piazolo (2003).
7
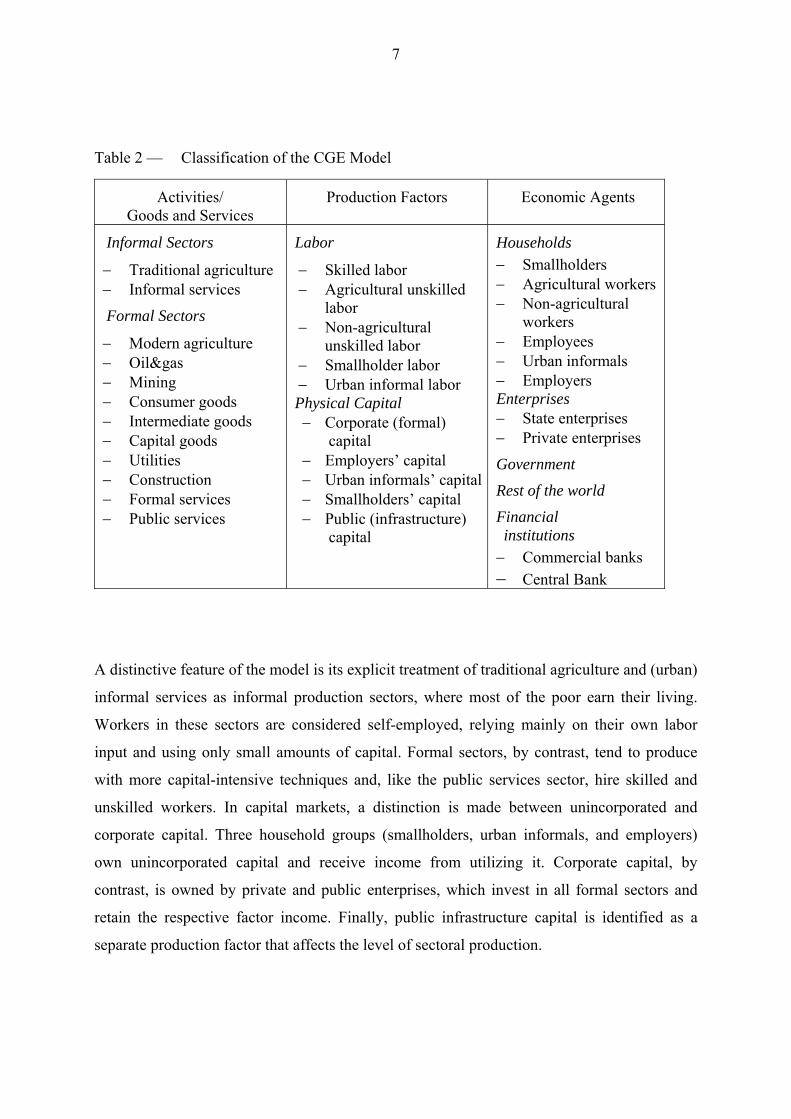
Table 2 — Classification of the CGE Model
Activities/ Goods and Services
Production Factors Economic Agents
Informal Sectors
− Traditional agriculture − Informal services
Formal Sectors
− Modern agriculture − Oil&gas − Mining − Consumer goods − Intermediate goods − Capital goods − Utilities − Construction − Formal services − Public services
Labor
− Skilled labor − Agricultural unskilled
labor − Non-agricultural
unskilled labor − Smallholder labor − Urban informal labor Physical Capital − Corporate (formal)
capital − Employers’ capital − Urban informals’ capital− Smallholders’ capital − Public (infrastructure)
capital
Households − Smallholders − Agricultural workers − Non-agricultural
workers − Employees − Urban informals − Employers Enterprises − State enterprises − Private enterprises
Government
Rest of the world
Financial institutions
− Commercial banks − Central Bank
A distinctive feature of the model is its explicit treatment of traditional agriculture and (urban)
informal services as informal production sectors, where most of the poor earn their living.
Workers in these sectors are considered self-employed, relying mainly on their own labor
input and using only small amounts of capital. Formal sectors, by contrast, tend to produce
with more capital-intensive techniques and, like the public services sector, hire skilled and
unskilled workers. In capital markets, a distinction is made between unincorporated and
corporate capital. Three household groups (smallholders, urban informals, and employers)
own unincorporated capital and receive income from utilizing it. Corporate capital, by
contrast, is owned by private and public enterprises, which invest in all formal sectors and
retain the respective factor income. Finally, public infrastructure capital is identified as a
separate production factor that affects the level of sectoral production.
8
Table 3 — Sectoral Tradability
Exports/Production Imports/Absorption
Traditional agriculture 0.07 0.09 Modern agriculture 0.34 0.05 Oil & gas 0.22 — Mining 0.65 0.09 Consumer goods 0.16 0.15 Intermediate goods 0.17 0.39 Capital goods 0.06 0.86 Utilities — — Construction — — Informal services — 0.03 Formal services 0.09 0.04 Public sector — —
Source: Thiele and Piazolo (2003).
The model distinguishes six representative household groups, which are basically
characterized by their factor endowments. This is justified because factor income is the
single-most important income source in Bolivia. In addition, workers and the self-employed
are disaggregated regionally as their earning possibilities and consumption patterns tend to
vary between regions. Four of the six household groups (smallholders, urban informals, and
agricultural and non-agricultural workers) can be considered as poor. In order to calculate the
evolution of poverty and income distribution on the basis of information about individual
household income rather than average income of these broad socio-economic groups, the
model is linked to household survey data by simply scaling up and down individual incomes
in the survey according to the model results.
The financial sector of the model distinguishes commercial banks and the Central Bank as
intermediaries. Beside the financial assets and liabilities accumulated in the domestic banking
system (cash holdings, deposits, and loans), private and public enterprises have accumulated a
considerable amount of FDI, the government has incurred high external debt, and some agents
(employees, employers, public and private enterprises) hold limited amounts of shares in
domestic enterprises. Given that the aim here is to analyze the impact of devaluation in a
9
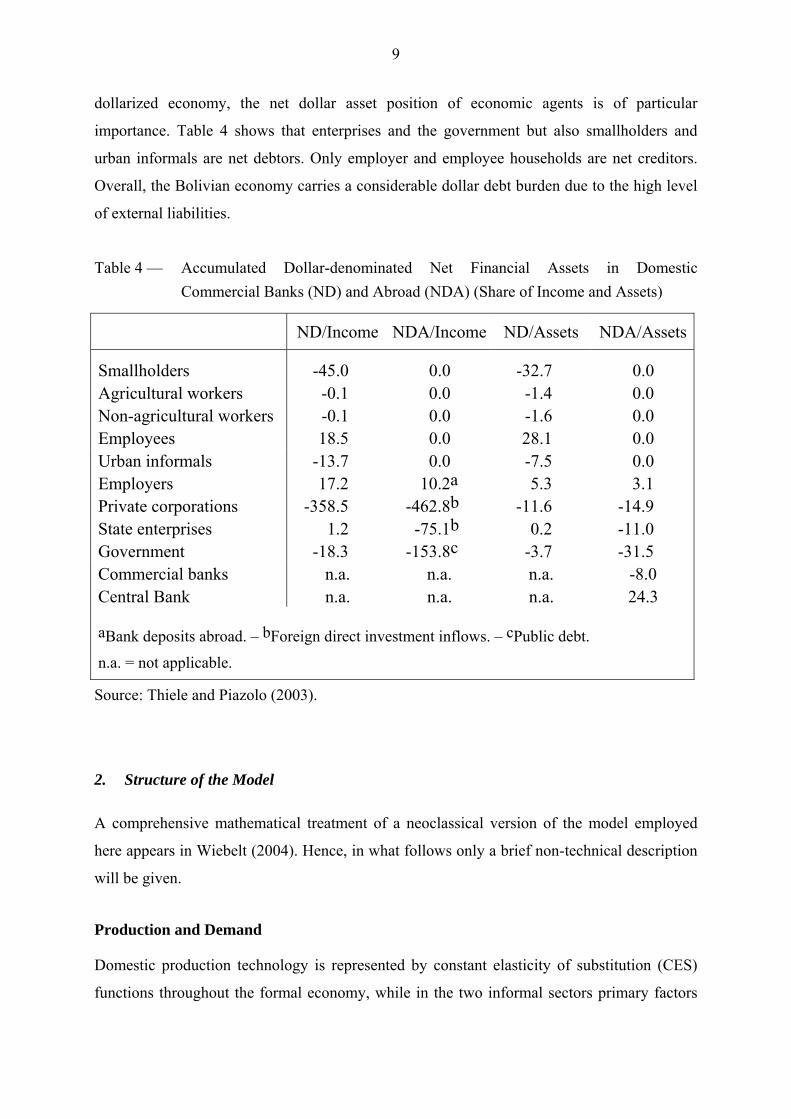
dollarized economy, the net dollar asset position of economic agents is of particular
importance. Table 4 shows that enterprises and the government but also smallholders and
urban informals are net debtors. Only employer and employee households are net creditors.
Overall, the Bolivian economy carries a considerable dollar debt burden due to the high level
of external liabilities.
Table 4 — Accumulated Dollar-denominated Net Financial Assets in Domestic Commercial Banks (ND) and Abroad (NDA) (Share of Income and Assets)
ND/Income NDA/Income ND/Assets NDA/Assets
Smallholders -45.0 0.0 -32.7 0.0 Agricultural workers -0.1 0.0 -1.4 0.0 Non-agricultural workers -0.1 0.0 -1.6 0.0 Employees 18.5 0.0 28.1 0.0 Urban informals -13.7 0.0 -7.5 0.0 Employers 17.2 10.2a 5.3 3.1 Private corporations -358.5 -462.8b -11.6 -14.9 State enterprises 1.2 -75.1b 0.2 -11.0 Government -18.3 -153.8c -3.7 -31.5 Commercial banks n.a. n.a. n.a. -8.0 Central Bank n.a. n.a. n.a. 24.3
aBank deposits abroad. – bForeign direct investment inflows. – cPublic debt.
n.a. = not applicable.
Source: Thiele and Piazolo (2003).
2. Structure of the Model
A comprehensive mathematical treatment of a neoclassical version of the model employed
here appears in Wiebelt (2004). Hence, in what follows only a brief non-technical description
will be given.
Production and Demand
Domestic production technology is represented by constant elasticity of substitution (CES)
functions throughout the formal economy, while in the two informal sectors primary factors
10
are combined via a Cobb-Douglas production function to account for the fact that labor can
fairly easily substitute for the very basic capital goods used in these sectors. Despite the
flexible production technology, the overwhelming importance of self-employed labor implies
that smallholders and urban informals can hardly adjust supply in the short run. Adjustment to
adverse demand shocks will thus work through a fall in prices, which in turn reduces income.
Both formal and informal sectors use intermediate inputs in fixed proportions to production.
In addition, based on the view that cumulative public investment improves the productivity of
private activities, public capital enters the production relationship via a CES function where it
is combined with the aggregate of private production factors (Agenor et al. 2003). Trade is
modeled in the conventional way by means of a constant elasticity of transformation (CET)
function relating domestically sold and exported goods, and a CES function relating
domestically produced and imported goods (Armington assumption).
To capture the reality of Bolivian employment, the model assumes a high degree of labor
market segmentation (see Table 2). In the urban labor market, the barriers for informal
workers to enter the formal workforce are taken into account by assuming limited mobility
between these labor market segments, i.e., people are stuck in low-paid informal sector jobs,
and for open unemployment of all formal labor categories, which appears to be an accurate
characterization of the Bolivian labor market in recession years when rates of open
unemployment tend to rise to non-negligible levels.
Alternative assumptions about wage formation in the three formal labor markets reflect
different degrees of indexation in the real sectors. On the one extreme, it is assumed that
nominal wages are constant, i.e., do not react to changes in consumer prices. On the other
extreme, workers assume a strong pass-through of devaluation and index wages to consumer
price inflation. It is to be expected that the pass-through in this scenario is high compared to
the scenario without wage indexation.
On the demand side, households’ allocation of expenditures on different goods is specified as
a linear expenditure system (LES), with poorer households devoting larger budget shares to
price-independent subsistence consumption than richer households. Total household
consumption is linear in disposable income with a real balances term added, while public
consumption is assumed to be a policy variable. Real investment levels are determined
endogenously for each economic agent except the government, whose investment is assumed
to be set by an exogenous policy decision. Together with exogenous technical progress and
given growth rates for variables such as labor supply and real government expenditures, the
11
endogenous evolution of private investment generates the dynamics of the model in the form
of a sequence of static equilibria.
Financial Sector
The model’s financial sector follows the approach developed by Rosensweig and Taylor
(1990), which is in turn based on Tobin’s portfolio-theoretic framework, where the interaction
of stocks and flows plays a decisive role. Starting from the beginning-of-period stocks of
assets and liabilities, financial markets match the savings and investment decisions of all
economic agents over the period, comprising the accumulation of both physical and financial
assets and liabilities. The financial markets handle simultaneously the flows arising from
savings and financial accumulation, and those arising from the reshuffling of existing
portfolios due to changes in asset returns. For the latter, it is assumed that individual agents
have only limited possibilities to substitute among different assets, which is captured by CES
functions of relative rates of return. A further characteristic of the financial sector is that
specific economic agents, e.g. smallholders, may be constrained in their access to credit,
which is clearly the case for most of Bolivia’s informal producers. This is modeled by
determining bank credit to the respective agent residually after all other agents’ credit demand
is satisfied (Jemio 2001).
The identification of stocks in the model makes it possible to account for the revaluation of
assets and liabilities, which is of great importance in the highly dollarized Bolivian economy
where the value of most domestic financial assets and liabilities is at least partially indexed to
movements in the exchange rate. Together with the accumulation occurring over the period,
these revaluations determine the end-of-period stocks of assets, liabilities and net wealth for
each economic agent.
Key Transmission Channels
Some specific real-financial interactions need to be detailed further because of the central role
they play in determining the impact of devaluation. First, consumption and savings of each
household group are affected by a wealth term, which is defined as net financial wealth
lagged one period and deflated by the household-specific consumer price index. This
definition implies that devaluation will lead to an increase in wealth (and thus higher
consumption and lower savings) if the share of dollar assets in total financial holdings
exceeds the elasticity of the consumer price index to the exchange rate. The latter depends
12
positively both on the share of imported goods in the consumption basket and on the extent to
which wages are adjusted in response to the devaluation. Given that workers have almost no
dollar income, there is a clear distributional trade-off involved in wage adjustments. These
raise the inflationary response to devaluation and thereby lower the real balances of creditors
such as employees and employers. The above real balance condition for asset stocks can also
be expressed in flow terms, i.e., real interest income from financial assets will increase if the
share of the dollar-denominated assets exceeds the elasticity of the consumption deflator to
the exchange rate.
Second, nominal private investment by agent is determined endogenously in the model after
savings and the financial portfolio has been determined.2 For each investing agent, the
identity
investment = saving – ∆assets + ∆liabilities
must hold, i.e., agents with a saving-investment surplus accumulate (net) financial assets and
thereby finance the deficits of the other agents. Thus financial flows also enter the investment
function. Nominal private investment is deflated by the replacement cost of capital. The
outcome of devaluation on investment depends on its effect on household savings, which has
been discussed above, and on the real balance effect. The real balance effect of devaluation
will be negative if the share of dollar liabilities in total liabilities exceeds the replacement
costs of capital. The replacement costs of capital, in turn, depend on the pass-through of
exchange rate changes on domestic prices and on the share of domestic capital inputs. This
implies that devaluation will increase the debt burden if the pass-through is low and the share
of dollar debt is high. If the pass-through approaches unity and there is near purchasing power
parity, by contrast, the debt burden will be reduced by devaluation through its inflationary
impact. The above reasoning can also be applied to individual investing agents, with a slightly
different interpretation for net creditors such as employers: they experience a positive real
balance effect in case of a high dollar asset share and a low pass-through that preserves the
real value of their assets.
2 Another option, which is chosen by Easterly (1990), is to specify investment by economic
agent as a function of the cash flow, i.e. gross profits less taxes, interest payments, and capital losses on debt. This specification reflects widespread credit rationing and internal self-financing of enterprises, but does not seem to be appropriate for Bolivia, where the dominating investors such as private enterprises are closely linked to banks and thus are likely to have preferential access to credit (Jemio 2001) .
13
Because dollarization and interest rates are assumed to be exogenous in the model,
devaluation does not affect the portfolio choices of households and enterprises. The implicit
assumption is that private agents adjust their portfolios after a devaluation in order to hold a
constant share of dollar assets (liabilities).
Third, if financial balances are taken into account, the government can influence its own real
balances through its control over the nominal exchange rate. Even if there is full pass-through
of devaluation into wages, the government’s position will improve through the fall in the real
value of its external debt. However, the model assumes that real investment and real
consumption are held constant by the government. That implies that there are no
repercussions from government expenditures on the macroeconomic effects of a devaluation.
There are, however, distributional effects because nominal expenditures and nominal transfers
increase with inflation for public services – mainly determined by wage inflation – while the
real value of transfers depends on household-specific inflation.
The way in which all these effects operate in conjunction is determined by the model closure,
which places the model on the continuum of neoclassical versus Keynesian and short run
versus long run. The model closure adopted here is short run in the sense that it assumes
quantity adjustment on formal labor markets, but it is not strictly Keynesian – like, for
example, in Easterly (1990) – because prices are allowed to clear goods markets. On the
financial side, the equilibrating variables are the level of foreign exchange reserves and
government debt. All interest rates and the exchange rate are fixed, as are both current and
capital government expenditures in real terms. The assumptions underlying this closure are
that in a recession the monetary authority makes no attempt to control the quantity of money,
and that the government can fairly easily obtain additional funds from international
institutions (e.g., a stand-by loan from the IMF) instead of trimming expenditures such as
public sector wages.
IV. Simulation Results
1. Benchmark and Simulations
The model is calibrated for 1997, i.e. a year when Bolivia still benefited from improvements
in its terms-of-trade, strong inflows of foreign direct investment, and a stable macroeconomic
situation. In the base run, the dynamics of the model are driven by a constant rate of increase
in the labor supply, a constant rate of increase in FDI inflows and a constant rate of
14
depreciation of 2 percent annually. The latter mirrors the de-facto crawling-peg exchange rate
regime implemented at the time.
The shock scenario, which reflects the need for Bolivia to adjust to a new macroeconomic
situation, includes two major shocks. First, the negative impact of El Niño is accounted for by
a reduction of the productivity increases in traditional and modern agriculture. Second, the
reversal of FDI inflows is specified as a permanent reduction in the net FDI to GDP ratio.3
The devaluation scenario assumes that Bolivia experiences these shocks but, different to this
shock scenario, the monetary authorities react with a discretionary, one-time increase in the
rate of devaluation from 2 percent to 10 percent. Hence, the results for the devaluating
scenario reflect the combined effects of external shocks and additional devaluation. This
allows to analyze whether net devaluation can mitigate the impact of the chocks.
Three sets of simulations are run, reflecting alternative assumptions about real and financial
sector dollarization: A full dollarization scenario, which assumes full indexation of wages to
consumer price inflation as well as almost full dollarization of commercial bank deposits and
credits (90 and 95 percent of total); a financial dollarization scenario, which assumes constant
nominal wages in the real sector while maintaining almost full dollarization in the financial
sector; and, finally, partial financial dollarization scenarios with alternative changes of the
exogenous share of dollar assets and liabilities captured by a revaluation coefficient (RC): a
lower RC scenario where dollarization is reduced to half its initial ratio, a lower deposit RC
scenario that only halves the ratio of deposit dollarization, and a lower loan RC scenario that
only halves the ratio of loan dollarization. As will be seen in the discussion of the results
below, this helps to identify the different transmission channels for an impact of a nominal
devaluation on consumption and investment.
2. Full Dollarization
As expected and clearly shown in Figures 3a-d, temporary exchange rate adjustment may
hardly help to cushion the short-run negative macroeconomic impacts of external shocks if
wages are fully indexed to the consumer price index. The major immediate impact of
3 For a detailed account of the macroeconomic, sectoral, and distributional effects of this
shock scenario, see Lay et al. (2004). Here the shock scenario only serves as a benchmark against which the effects of a devaluation are evaluated.
15
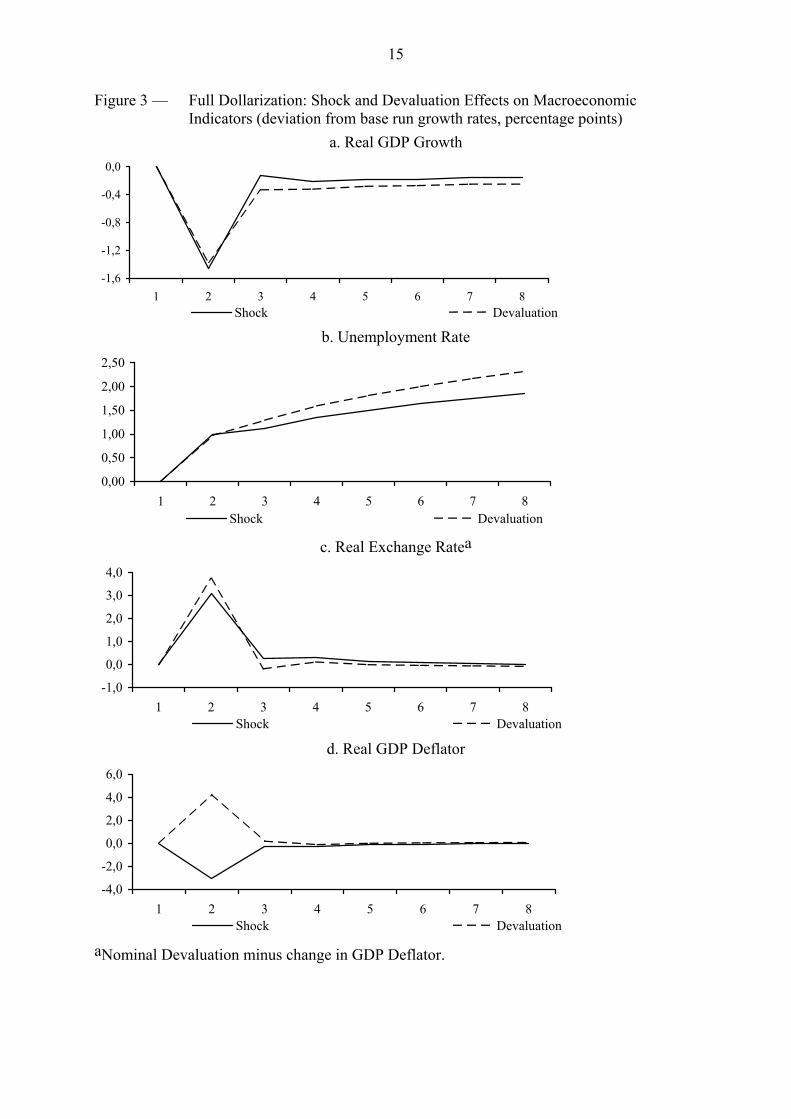
Figure 3 — Full Dollarization: Shock and Devaluation Effects on Macroeconomic Indicators (deviation from base run growth rates, percentage points)
a. Real GDP Growth
-1,6
-1,2
-0,8
-0,4
0,0
1 2 3 4 5 6 7 8Shock Devaluation
b. Unemployment Rate
c. Real Exchange Ratea
0,00
0,50
1,00
1,50
2,00
2,50
1 2 3 4 5 6 7 8Shock Devaluation
-1,0
0,0
1,0
2,0
3,0
4,0
1 2 3 4 5 6 7 8Shock Devaluation
d. Real GDP Deflator
-4,0
-2,0
0,0
2,0
4,0
6,0
1 2 3 4 5 6 7 8Shock Devaluation
aNominal Devaluation minus change in GDP Deflator.
16
devaluation is higher domestic prices with employment and output almost unaffected
compared to the isolated shock simulation. As in the shock scenario, the unemployment rate
increases by one percentage point from 5 to 6 percent. The inflationary impact follows the
rate of devaluation, leaving relative prices almost unaffected. In particular, the policy appears
ineffective in achieving a sizeable depreciation of the real exchange rate that would be
necessary to stimulate export growth and import substitution. Initially, the volumes of both
exports and imports rise slightly, leaving the trade deficit unaffected. Gradually, when GDP
recovers and the real exchange rate appreciates, the trade deficit even exceeds its level of the
isolated shock simulation.
With the exception of government investment, which is exogenously given, individual agents’
investment is affected very differently in the short-run depending on their net financial asset
positions. As would be expected from the discussion of dollar indebtedness in section III,
smallholders experience the sharpest drop in investment. Their investable funds decline by 16
percent compared to the shock simulation, as a result of the capital losses on dollar-
denominated debt, while the replacement cost of capital rises by 6 percent. The squeeze on
urban informals’ investment is much less because of the modest indebtedness. Employers, on
the other hand, actually benefit from their net asset position in dollars but the capital gains
resulting from the devaluation are more than compensated by rising capital cost. Finally,
private corporations can increase their investment despite their net dollar indebtedness in the
domestic banking system because “domestic” financial capital losses are more than
compensated by capital gains, which result from the revaluation of accumulated foreign direct
investment. Revaluation gains of state enterprises, on the other hand, are only partly offset by
rising replacement cost of capital. Overall, the devaluation leads to a restructuring of
investment from the unincorporated to the corporate sector and a lower reduction of
investment compared to the shock simulation. However, the relative rise of investment in the
short-run does not materialize in higher GDP growth in the medium-run because the short-run
expansionary effects that result from revaluations are more than compensated in the medium-
run by their lagged contractionary effects.
Two types of lagged effects result from revaluations. First, the revaluation has an impact on
the agents’ interest surplus and thereby on medium-run income. With identical deposit and
credit interest rates and a higher dollarization of loan accounts than deposit accounts, the
revaluation that results from the devaluation leads to a reduction of interest income and
therefore gross income, investment and consumption. Again net debtors to commercial banks,
17
such as smallholders, urban informals, and private enterprises experience the highest income
losses while employees, employers and state enterprises benefit from the revaluation of their
net deposits. Since the net debtors are also the major investing agents in Bolivia, medium-run
investment out of income falls. Second, the different net financial asset positions of
households also affect – with a one-period lag – consumption. However, the impact of
revaluations of pre-period net wealth on consumption is limited despite the high degree of
financial dollarization, given moderate marginal propensities to consume out of wealth
(assumed to be 5 percent for all households), and a moderate increase in devaluation
compared to the base run (10 versus 2 percent). Consumption of agricultural and non-
agricultural workers is unaffected by the revaluation since their bank deposits equal credits.
Consumption rises for employees and employers, falls for urban informals, and remains
almost constant for smallholders despite them being significant net debtors. Overall, the
negative impact of revaluations on investment dominates, implying that medium-run GDP
growth is somewhat lower than in the shock scenario.
As for the distributional consequences of the devaluation, the absence of an expansionary
impact even in the short run implies that if the devaluation were to mitigate the worsening of
the poverty situation resulting from the shock it would have to be associated with a marked
improvement in the distribution of income.4 If anything, however, income inequality increases
somewhat (Table 5). As net creditors in the domestic banking system the two richest
household groups, employers and employees, benefit from the revaluation of their dollar
assets and higher real interest income while the two poorest groups, smallholders and urban
informals, are hit by higher interest cost on their dollar-denominated liabilities.
The other major components of real household income, factor rewards and transfers, are
largely unaffected. Nominal transfers are linked to nominal government expenditures, which
in turn adjust to yield the exogenously given real government expenditures. As a result of the
inflationary impact of devaluation, both nominal expenditures and nominal transfers rise. In
4 The changes in the Gini coefficient or any other summary measure of inequality associated
with these income changes have to be interpreted carefully because the corresponding survey does not contain reliable information on interest income. Interest income and payments have been added to household factor income and are distributed according to factor endowments in order to calculate summary distributional and poverty indicators.
5 The changes in the Gini coefficient or any other summary measure of inequality associated with these income changes cannot be calculated in a meaningful way because the corresponding survey does not contain reliable information on interest income.
18
real terms, however, transfers are virtually constant as the nominal expansion is almost
exactly matched by increases in the household-specific consumer price indices.
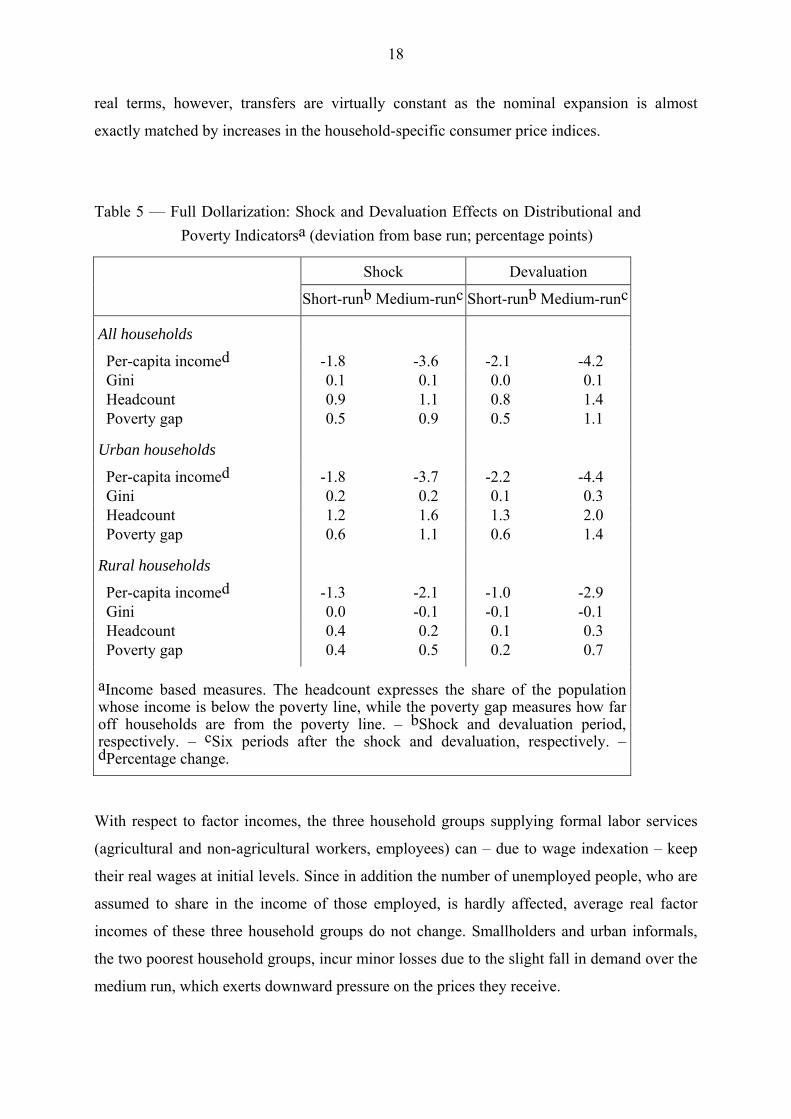
Table 5 — Full Dollarization: Shock and Devaluation Effects on Distributional and Poverty Indicatorsa (deviation from base run; percentage points)
Shock Devaluation
Short-runb Medium-runc Short-runb Medium-runc
All households
Per-capita incomed -1.8 -3.6 -2.1 -4.2 Gini 0.1 0.1 0.0 0.1 Headcount 0.9 1.1 0.8 1.4 Poverty gap 0.5 0.9 0.5 1.1
Urban households
Per-capita incomed -1.8 -3.7 -2.2 -4.4 Gini 0.2 0.2 0.1 0.3 Headcount 1.2 1.6 1.3 2.0 Poverty gap 0.6 1.1 0.6 1.4
Rural households
Per-capita incomed -1.3 -2.1 -1.0 -2.9 Gini 0.0 -0.1 -0.1 -0.1 Headcount 0.4 0.2 0.1 0.3 Poverty gap 0.4 0.5 0.2 0.7
aIncome based measures. The headcount expresses the share of the population whose income is below the poverty line, while the poverty gap measures how far off households are from the poverty line. – bShock and devaluation period, respectively. – cSix periods after the shock and devaluation, respectively. – dPercentage change.
With respect to factor incomes, the three household groups supplying formal labor services
(agricultural and non-agricultural workers, employees) can – due to wage indexation – keep
their real wages at initial levels. Since in addition the number of unemployed people, who are
assumed to share in the income of those employed, is hardly affected, average real factor
incomes of these three household groups do not change. Smallholders and urban informals,
the two poorest household groups, incur minor losses due to the slight fall in demand over the
medium run, which exerts downward pressure on the prices they receive.
19
All this translates into lower per-capita incomes and slightly higher medium-run poverty
headcounts and poverty gaps than in the shock scenario. The impact on the incidence and
depth of poverty is somewhat more pronounced in urban than in rural areas as rural
households tend to be further below the poverty line and are less affected by the devaluation
of the Boliviano.
3. Financial Dollarization
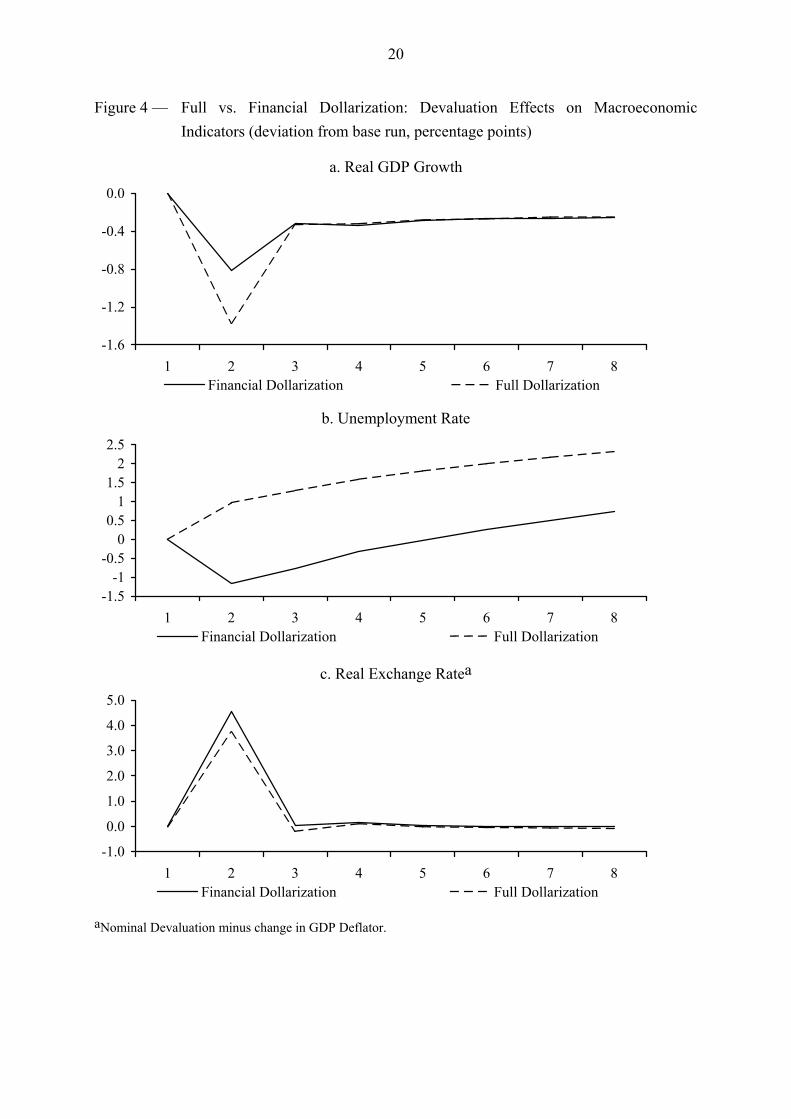
The pass-through of devaluation is less pronounced if wages are not indexed, meaning that
the policy is effective in achieving a real depreciation in the short run. Compared to the full
dollarization scenario, the devaluation immediately reduces real product wages in export
industries thereby stimulating export growth. Moreover, lower real wages in import
competing sectors provide an incentive for import substitution. The combined rise in
commodity exports and fall in commodity imports and the accompanying rise in foreign-
exchange earnings have a positive impact on overall growth and employment (Figures 4a-d).
Over the medium-run, the expansionary effect of the devaluation fades and the economy
returns to the isolated shock trend, but at a slightly higher real exchange rate and significantly
higher levels of employment. The lagged effects of deposit and loan revaluations on private
investment and consumption are identical to those in the case of full dollarization, and,
together with exogenously determined growth rates for government investment and
consumption, imply that GDP growth is also identical.
The distributional outcome of the devaluation is the result of – partly offsetting – movements
in all different income components. First, analogous to the case of full wage indexation,
employers and employees experience a rise in real interest income of up to 2 percentage
points. Second, real factor incomes are affected via two main channels. On the one hand, the
real devaluation causes a reallocation of resources from nontradable to tradable sectors. The
strongest response occurs in modern agriculture, where production increases by roughly 8
percent in the short-run, creating additional employment for agricultural workers. This
employment effect appears to overcompensate the real wage losses suffered by those
agricultural workers already employed, the net result being a rise in average real factor
20
Figure 4 — Full vs. Financial Dollarization: Devaluation Effects on Macroeconomic Indicators (deviation from base run, percentage points)
a. Real GDP Growth
-1.6
-1.2
-0.8
-0.4
0.0
1 2 3 4 5 6 7 8Financial Dollarization Full Dollarization
b. Unemployment Rate
-1.5-1
-0.50
0.51
1.52
2.5
1 2 3 4 5 6 7 8Financial Dollarization Full Dollarization
c. Real Exchange Ratea
-1.0
0.0
1.0
2.0
3.0
4.0
5.0
1 2 3 4 5 6 7 8Financial Dollarization Full Dollarization
aNominal Devaluation minus change in GDP Deflator.
21
incomes by 4 percentage points. By contrast, for non-agricultural workers, who partly work in
nontradable and partly in tradable sectors, and even more strongly for employees, who are
largely confined to the nontradable segment of the economy, the wage effect dominates,
reducing their real factor incomes by 3 and 5 percentage points, respectively. On the other
hand, the two mainly demand-driven sectors, traditional agriculture and informal services,
benefit from the additional income created by the devaluation. This leads to 2 and 3
percentage points higher real factor incomes in the short run for smallholders and urban
informals, respectively.
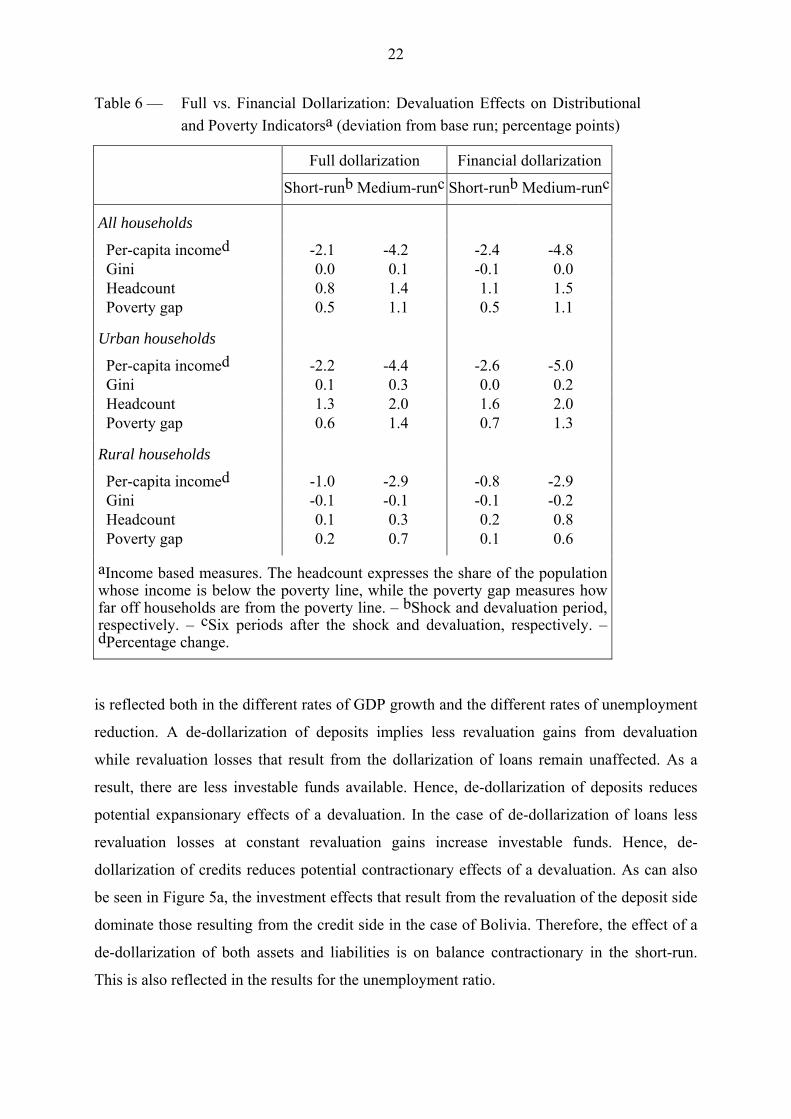
Third, the real value of government transfers decreases by approximately 5 percentage points
for all household groups. This is because the price for public services and the consumer price
index with which transfers are deflated do not move in parallel. Due to a lack of pressure from
public sector wages, the former rises only slightly so that only a small increase in nominal
government expenditures is necessary to keep real expenditures constant, which leads to an
equally small increase in nominal transfers. Consumer prices, by contrast, fully absorb the
inflationary impact of the devaluation, thereby eroding the purchasing power of transfers.
This effect tends to cancel out the poverty-reducing effect of rising real factor incomes,
implying that on balance the poverty outcome does not improve compared to the situation
with indexed wages (see Table 6). The short-run expansion induced by an additional real
devaluation in the case of wage flexibility thus clearly does not turn out to be pro-poor. A
more favorable impact on poverty could only be expected if the government were to take
steps towards protecting the real value of the transfers received by the poor.
4. Partial Financial Dollarization
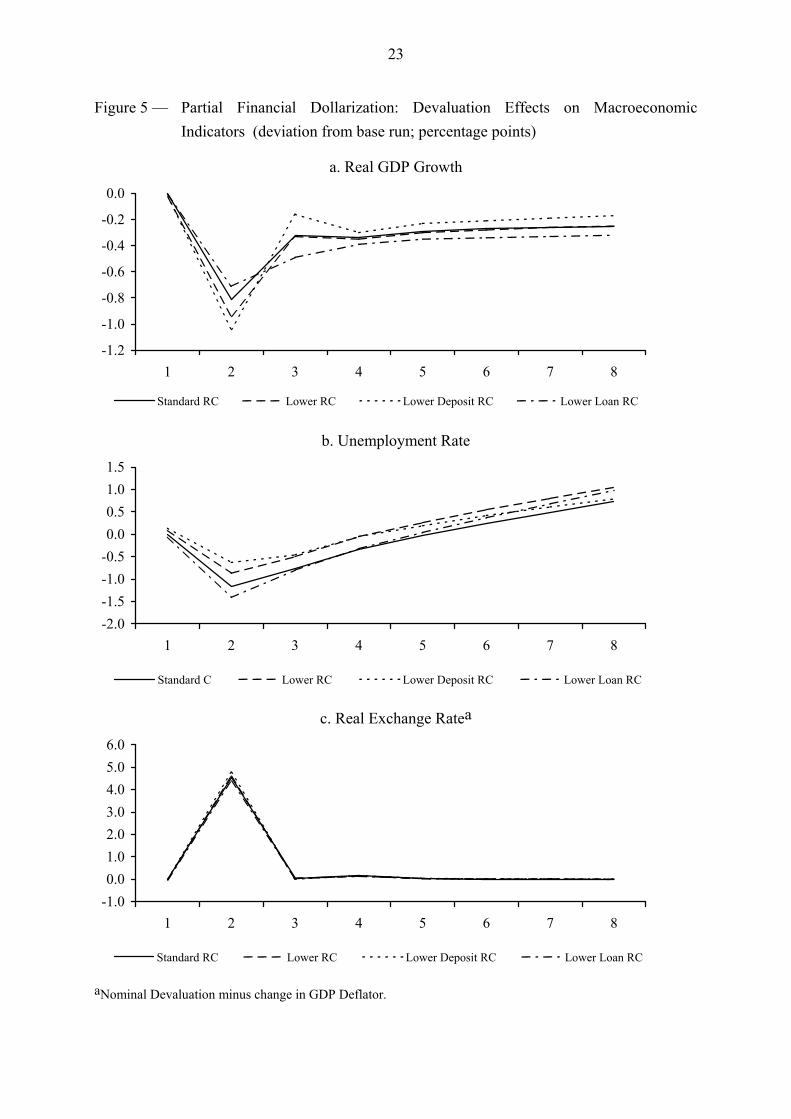
The short and medium-run impact of devaluation on real GDP, the unemployment rate and
the real exchange rate under different degrees of dollarization of the commercial banking
system is shown in Figures 5a-c. It is clear from Figure 5c that changes in the degree of
dollarization have almost no impact on the real exchange rate, neither in the short-run nor in
the medium run. The comparison of the lower-deposit-RC and the lower-loan-RC-scenarios
reveals that a reduction of deposit dollarization is contractionary compared to the financial
dollarization scenario discussed above, while a de-dollarization of loans is expansionary. This
22
Table 6 — Full vs. Financial Dollarization: Devaluation Effects on Distributional and Poverty Indicatorsa (deviation from base run; percentage points)
Full dollarization Financial dollarization
Short-runb Medium-runc Short-runb Medium-runc
All households
Per-capita incomed -2.1 -4.2 -2.4 -4.8 Gini 0.0 0.1 -0.1 0.0 Headcount 0.8 1.4 1.1 1.5 Poverty gap 0.5 1.1 0.5 1.1
Urban households
Per-capita incomed -2.2 -4.4 -2.6 -5.0 Gini 0.1 0.3 0.0 0.2 Headcount 1.3 2.0 1.6 2.0 Poverty gap 0.6 1.4 0.7 1.3
Rural households
Per-capita incomed -1.0 -2.9 -0.8 -2.9 Gini -0.1 -0.1 -0.1 -0.2 Headcount 0.1 0.3 0.2 0.8 Poverty gap 0.2 0.7 0.1 0.6
aIncome based measures. The headcount expresses the share of the population whose income is below the poverty line, while the poverty gap measures how far off households are from the poverty line. – bShock and devaluation period, respectively. – cSix periods after the shock and devaluation, respectively. – dPercentage change.
is reflected both in the different rates of GDP growth and the different rates of unemployment
reduction. A de-dollarization of deposits implies less revaluation gains from devaluation
while revaluation losses that result from the dollarization of loans remain unaffected. As a
result, there are less investable funds available. Hence, de-dollarization of deposits reduces
potential expansionary effects of a devaluation. In the case of de-dollarization of loans less
revaluation losses at constant revaluation gains increase investable funds. Hence, de-
dollarization of credits reduces potential contractionary effects of a devaluation. As can also
be seen in Figure 5a, the investment effects that result from the revaluation of the deposit side
dominate those resulting from the credit side in the case of Bolivia. Therefore, the effect of a
de-dollarization of both assets and liabilities is on balance contractionary in the short-run.
This is also reflected in the results for the unemployment ratio.
23
Figure 5 — Partial Financial Dollarization: Devaluation Effects on Macroeconomic Indicators (deviation from base run; percentage points)
a. Real GDP Growth
-1.2
-1.0
-0.8
-0.6
-0.4
-0.2
0.0
1 2 3 4 5 6 7 8
Standard RC Lower RC Lower Deposit RC Lower Loan RC
b. Unemployment Rate
-2.0-1.5-1.0-0.50.00.51.01.5
1 2 3 4 5 6 7 8
Standard C Lower RC Lower Deposit RC Lower Loan RC
c. Real Exchange Ratea
-1.00.01.02.03.04.05.06.0
1 2 3 4 5 6 7 8
Standard RC Lower RC Lower Deposit RC Lower Loan RC
aNominal Devaluation minus change in GDP Deflator.
24
In the medium-run, the impact of revaluation gains and losses induced by an equiproportional
reduction of the degree of dollarization fades and GDP and the unemployment rate coincide
with their shock levels. It is also evident that de-dollarization on the credit side affects mostly
private enterprises leading to a smooth adjustment of investment and therefore a smooth
adjustment to the medium-run growth path of the shock simulation. By contrast, revaluations
on the deposit side are mostly felt by households. Higher net revaluation losses as a result of
de-dollarization of deposits induce households to reduce their investment expenditures while
increasing their consumption expenditures in the post-devaluation period, which has a slightly
expansionary impact on real GDP growth.
As one might expect, the distributional effects of attempts to reduce financial dollarization run
mainly through the revaluation of assets and liabilities and thus mainly concern the two
richest household groups. If we consider deposit de-dollarization in isolation, the result is that
employees and employers experience a fall in real interest income due to a weaker
appreciation of their assets. A de-dollarization of loans works in the opposite direction, but
with a considerably smaller impact. Taking both sides of the balance sheet together,
employees receive 2 percentage points and employers 1 percentage point less interest income,
i.e. financial de-dollarization leads to lower income inequality, albeit to a very limited extent.
As concerns the evolution of poverty, with full as well as deposit de-dollarization the urban
and national headcount rise by about 0.5 percentage points in the short run (Table 7), which
reflects a small reduction in urban informals’ real factor incomes due to lower domestic
demand. This effect slightly increases over the medium run.
V. Concluding Remarks
In this paper, a real-financial CGE model has been employed for Bolivia to simulate the
macroeconomic and distributional effects of exchange rate policy in a highly dollarized
economy. Two characteristics of a dollarized economy have been considered: Dollarization
may involve wage indexation with the consequence of a high pass-through of a nominal
devaluation on domestic prices, and it may involve a high ratio of assets and liabilities in
dollars with the consequence of revaluation of wealth and real balances in the case of
exchange rate changes.
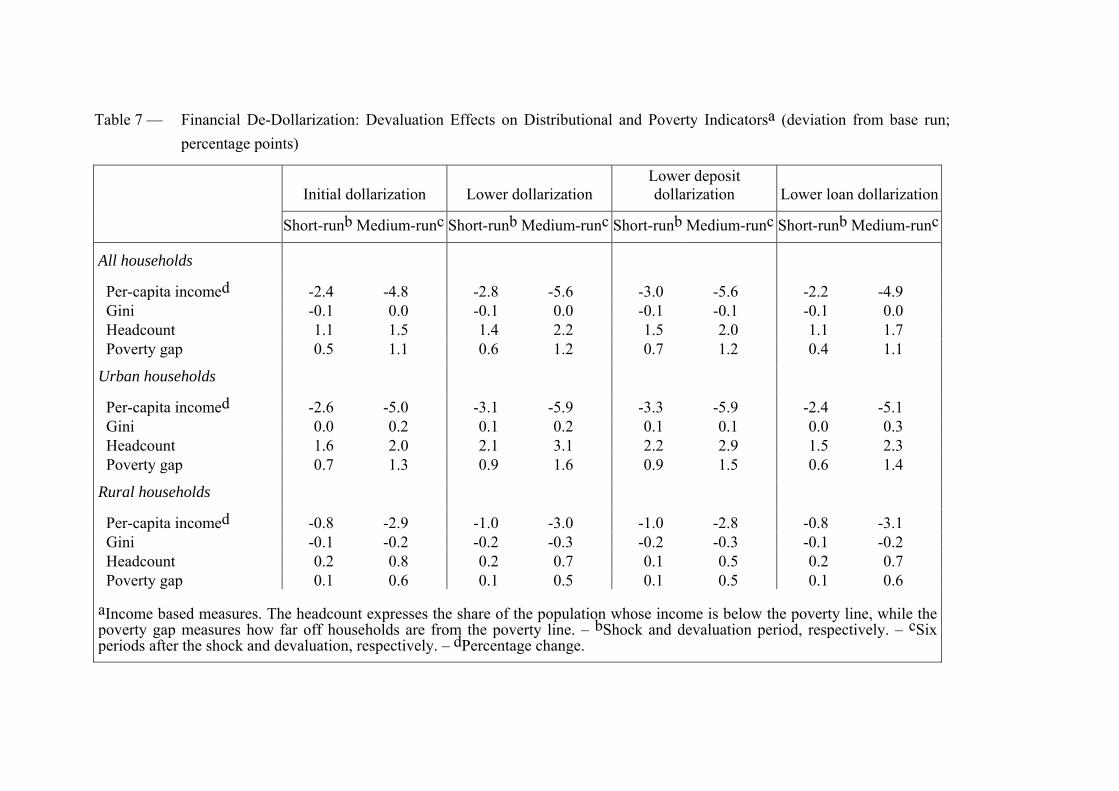
Table 7 — Financial De-Dollarization: Devaluation Effects on Distributional and Poverty Indicatorsa (deviation from base run; percentage points)
Initial dollarization Lower dollarization Lower deposit dollarization Lower loan dollarization
Short-runb Medium-runc Short-runb Medium-runc Short-runb Medium-runc Short-runb Medium-runc
All households
Per-capita incomed -2.4 -4.8 -2.8 -5.6 -3.0 -5.6 -2.2 -4.9 Gini -0.1 0.0 -0.1 0.0 -0.1 -0.1 -0.1 0.0 Headcount 1.1 1.5 1.4 2.2 1.5 2.0 1.1 1.7 Poverty gap 0.5 1.1 0.6 1.2 0.7 1.2 0.4 1.1
Urban households
Per-capita incomed -2.6 -5.0 -3.1 -5.9 -3.3 -5.9 -2.4 -5.1 Gini 0.0 0.2 0.1 0.2 0.1 0.1 0.0 0.3 Headcount 1.6 2.0 2.1 3.1 2.2 2.9 1.5 2.3 Poverty gap 0.7 1.3 0.9 1.6 0.9 1.5 0.6 1.4
Rural households
Per-capita incomed -0.8 -2.9 -1.0 -3.0 -1.0 -2.8 -0.8 -3.1 Gini -0.1 -0.2 -0.2 -0.3 -0.2 -0.3 -0.1 -0.2 Headcount 0.2 0.8 0.2 0.7 0.1 0.5 0.2 0.7 Poverty gap 0.1 0.6 0.1 0.5 0.1 0.5 0.1 0.6
aIncome based measures. The headcount expresses the share of the population whose income is below the poverty line, while the poverty gap measures how far off households are from the poverty line. – bShock and devaluation period, respectively. – cSix periods after the shock and devaluation, respectively. – dPercentage change.
26
The main macroeconomic result of the simulations is that the potential of nominal devaluation
to smooth the adjustment path after a negative shock primarily depends on the indexation of
wages. In the case of complete indexation, the main consequence of nominal devaluation is a
temporary increase of inflation, with only a minor real devaluation and almost constant
output. To the contrary, if nominal wages are constant in the short run, unemployment is
reduced and the reduction of real GDP induced by the shock is cushioned significantly.
Different degrees of financial dollarization hardly change this qualitative result. Short-term
smoothing of adjustment to the shock is only observed in the case of a lower degree of loan
dollarization. This is because loan dollarization has a recessionary impact as nominal
devaluation increases the real debt burden for enterprises, thereby reducing investment. With
a lower degree of loan dollarization, this recessionary impact is moderated. The reverse is true
for deposit dollarization, which raises asset values and thus investable funds in case of a
devaluation. With lower dollarization, this expansionary effect is reduced. Overall, the second
effect dominates in Bolivia.
As concerns distributional effects, the most interesting result is that nominal devaluation in no
circumstance reduces the poverty effect of the external shock. Even the significant short-run
macroeconomic expansion that occurs without wage indexation does not translate into
significant poverty alleviation, which is due to the fact that the real value of transfers received
by households decreases. The fall in real transfers comes about via the government budget.
Given a lack of pressure from public sector wages, public sector prices rise only slightly so
that only a small increase in nominal government expenditures is necessary to keep real
expenditures constant, which leads to an equally small increase in nominal transfers.
Household-specific consumer prices, by contrast, rise much more strongly, thereby eroding
the purchasing power of transfers.
Overall, dollarization appears to matter more through real than through financial-sector
effects. This result may change, however, if some simplifying assumptions like fixed interest
rates and constant real expenditure of the government would be relaxed. A richer formulation
of the government and the financial sector separating partial dollar indebtedness of the
corporate sector to commercial banks from Boliviano indebtedness of the unincorporated
sector to development banks and alternative monetary policy scenarios could be useful to
further investigate the robustness of results.
27
References
Agenor, Pierre-Richard, Alejandro Izquierdo, and Hippolyte Fofack (2003). The Integrated Macroeconomic Model for Poverty Analysis: A Quantitative Macroeconomic Framework for the Analysis of Poverty Reduction Strategies. World Bank Policy Research Working Paper 3092, Washington, D.C.
Aghion, Ph., Ph. Bacchetta, and A. Banerjee. (2001). Currency Crises and Monetary Policy in an Economy with Credit Constraints. European Economic Review 45 (7): 1121–1150.
Calvo, G.A., and C.M. Reinhart (2002). Fear of Floating. Quarterly Journal of Economics 117 (2): 379–408.
De Nicoló, G., P. Honohan, A. Ize (2003). Dollarization of the Banking System: Good or Bad? IMF Working Paper 03/146. Washington, D.C.
Easterly, W. (1990). Portfolio Effects in a CGE Model: Devaluation in a Dollarized Economy. In: L. Taylor (ed.), Socially Relevant Policy Analysis: Structuralist Computable Equilibrium Models for the Developing World, Cambridge, Mass.: MIT Press.
González Anaya, J.A. (2002). Labor Market Flexibility in Thirteen Latin American Countries and the United States: Revisiting and Expanding Okun Coefficients. Stanford University, Center for Research on Economic Development and Policy Reform, Working Paper 136. Stanford.
Heysen, S. (2005). Dollarization: Controlling Risk Is Key. Finance & Development 42 (1): 45–46.
IADB (2005). Unlocking Credit – The Quest for Deep and Stable Bank Lending. Economic and Social Progress Report 2005. Washington, D.C.
IMF (2003). Boliva – Selected Issues and Statistical Appendix. IMF Country Report No. 03/258. Washington, D.C.
IMF (a). International Financial Statistics via Datastream. Washington, D.C.
Jemio, L.C. (2001). Debt, Crisis and Reform in Bolivia: Biting the Bullet. Basingstoke: Palgrave in association with Institute of Social Studies.
Klasen, S., M. Grosse, J. Lay, J. Spatz, R. Thiele, and M.Wiebelt (2004). Operationalizing Pro-Poor Growth: Country Case Study Bolivia. Ibero America Institute for Econ. Research (IAI) Discussion Papers 101.
Krugman, P. (1999). Balance Sheets, the Transfer Problem, and Financial Crises. International Tax and Public Finance 6 (4): 459–72.
Lay, J., R. Thiele, and M. Wiebelt (2004). Pro-Poor Growth in Bolivia: Accounting for External Shocks and Policy Reforms. Kiel Working Paper 1231. Institute for World Economics, Kiel.
Levy-Yeyati, E., F. Sturzenegger, and I. Reggio (2003). On the Endogeneity of Exchange Rate Regimes. Business Scholl, Universidad Turcuato Di Tella, Buenos Aires. Mimeo.
28
Loboguerrero, A.M., U. Panizza (2005). Macroeconomic Shocks, Inflation, and Latin America’s Labor Market. In: R.J. Langhammer, L. Vinhas de Souza (eds.), Monetary Policy and Macroeconomic Stabilization in Latin America. Berlin-Heidelberg.
Rosensweig, J.A. and L. Taylor (1990). “Devaluation, Capital Flows and Crowding-out: A CGE Model with Portfolio Choice for Thailand”. In: L. Taylor (ed.), Socially Relevant Policy Analysis: Structuralist Computable Equilibrium Models for the Developing World, Cambridge, Mass.: MIT Press.
Thiele, R., and D. Piazolo (2003). A Social Accounting Matrix for Bolivia Featuring Formal and Informal Activities. Cuadernos de Economía 40: 285–318.
Wiebelt, M. (2004). GEMPIA – A Dynamic Real-Financial General Equilibrium Model for Poverty Impact Analysis. Kiel Working Papers 1230. Institute for World Economics, Kiel.
Yeyati, L, F. Sturzenegger (2003). Dollarization: A Primer. In: E. Levy-Yeyati, F. Sturzenegger (eds.), Dollarization – Debates and Policy Alternatives, Cambridge, Mass. and London: The MIT Press.