Embed Size (px)
Citation preview
Macroeconomic and Bank-Specific Determinants of the U.S. Non-Performing Loans: Before and During the Recent Crisis
By
Jung Hyun Park
Bachelor of Commerce, University of British Columbia, 2010
Lei Zhang
Bachelor of Management, Ocean University of China, 2010
RESEARCH PROJECT SUBMITTED IN PARTIAL FULFILLMENT
OF THE REQUIREMENTS FOR THE DEGREE OF
MASTER OF SCIENCE IN FINANCE
BEEDIE SCHOOL OF BUSINESS
© Jung Hyun Park 2012
© Lei Zhang 2012
SIMON FRASER UNIVERSITY
Summer 2012
All rights reserved. However, in accordance with the Copyright Act of Canada, this work may be reproduced, without authorization, under the conditions for Fair Dealing. Therefore, limited reproduction of this work for the purposes of private study, research, criticism, review and news reporting is likely to be in accordance with the law, particularly if cited appropriately
2
Approval
Name: Jung Hyun Park and Lei Zhang
Degree: Master of Science in Finance
Title of Project:
Supervisory Committee:
____________________________________
Dr. Jijun Niu Senior Supervisor Assistant Professor of Finance
____________________________________
Dr. Peter Klein Second Reader Professor of Finance
Date Approved: ____________________________________
Macroeconomic and Bank-Specific Determinants of the U.S. Non-Performing Loans: Before and During the Recent Crisis

3
Table of Contents
Abstract . . ... . . . . . . . . . . . . . . . . . . . . . . . . . . . . . . . . . . . . . . . . . . . . . . . . . . . . . . . . …. .4
Acknowledgements . . . . . . . . . . . . . . . . . . . . . . . . ………………………….................. 5
1. Introduction . . . . . . . . . . . . . . . . . . . . . . . . . . . . . . . . . . . . . . . . . . . . . . . . . . ……….6
2. Literature Review . . . . . . . . . . . . . . . . . ………. . . . . .. . . . . . . . . . . . . . . . . . . . . . . .7
3. Determinant factors of NPLs . . . . . . . .. . . . . . . . . . . . . ... . . . . . . . . . . . . . . . . . . . . . .9
3.1 Macroeconomic factors . . . . . . . . . . . . . . . . . . . . . . . . . . . . . . . . . . . . . . . . . . . . .9
3.2 Bank specific determinants ... . . . ……….. . . . . . . . . . . . . . . . . . . . . . . . . . . . . .10
4. Data Sample and Econometric Methodology . . . . . . . . . . . . . . …………………….13
4.1 Banking Data ... .. . . ………………... .. . . . . . . . . . . . . . . . . . . . . . . . . . . . . . . ..13
4.2 Econometric model. . . . . . . . . . .. . . . . . . . . . . . . . . . . . . . . . . . . . . . . . . . . . . . . .13
5. Model estimation and results. . . . . . . . . . . . …. . .. . . . . . ... . . . . . . . . . . . . . . . . . .. 14
5.1 Model Estimation. . . . . . . . . . . …. . .. . . . . . ... . . . . . . . . . . . . . . . . . ... . . . . …..14
5.2 Results. . . . . . . . . . . …. . .. . . . . . ... . . . . . . . . . . . . . . . . . ... . . . . . ... . . . . . ... . 15
5.2.1 Pre-financial Crisis Period. . . . . . . . . . . …. . .. . . . . . ... . . . . . . . . . . . . . .15
5.2.2 Financial Crisis Period. . . . . . . . . . . …. . .. . . . . . ... . . . . . . . . . . . . . . . . ...17
6. Conclusions . . . . . . . .. . . . . . . . . . . . . . . . . . . . . . . . . . . . . . . . ……... . . . . . . . . . . .18
References . . . . . . . . . . . . . . . . . . . . . . . . . . . . . . . . . . . . . . . . . . . . . . . . . . . . . . . . . . . . 19
Appendix . . . . . . . .. . . . . . . . . . .. . . . . . . . . . . . . . . . . . . . . . . . . . . . . . . . . . . . . . . . . . . 21

4
Abstract
Both macroeconomic and bank-specific factors are correlated to the occurrence
of Non-Performing Loans (NPL). We use a sample of U.S. banks over two distinct
time periods to provide empirical evidence of various key macroeconomic and bank-
specific determinants’ effects on NPLs.
Keywords: Non-performing loans; Macroeconomic determinants; Bank specific determinants;
Crisis; the U.S. banking system

5
Acknowledgements
We would like to express gratitude to our supervisor, Dr. Jijun Niu and second reader,
Dr. Peter Klein, whose invaluable support, comments and encouragement helped us
through all the research and writing of this thesis.
We also would like to thank all of the instructors in the Master of Science in Finance
program for their profound dedication. We cannot walk so long without their support.
We also thank our beloved parents for supporting us all the way through our study for
many years. None of this would have been possible without their support, understanding
and encouragement.

6
1. Introduction
The sub-prime mortgage crisis has cast attention on Non-Performing Loans
(NPL) as a signal of an economic crisis. Because of NPLs correlation to the health of
an economy, financial regulatory bodies across the globe are increasingly viewing
NPLs as a significant factor in managing risk. NPLs, which are typically defined as
loans that have been in default for 90 days, are garnering an increasing amount of
literature in its relation to macroeconomic and bank-specific determinants.
Louzis, Vouldis, and Metaxas (2011) used the GMM method to examine the
macroeconomic and bank-specific determinants of NPLs in Greece for mortgage,
business, and consumer loan portfolios. This paper complements this literature by
using the Ordinary Least Square (OLS) method to verify the key determinants of
NPLs in the U.S. banking system over two distinct time periods – one in a period of
economic stability (2002 – 2006), and one in recession (2007-2010). This paper
hypothesizes that both macroeconomic factors (GDP growth, unemployment rate, and
federal fund rate) and bank-specific factors (solvency ratio, inefficiency ratio, return
on equity, bank size, non-interest income) are correlated to NPLs.
There are two key differentiators of this paper. First, we use two distinct time
periods - one period before the onset of an economic crisis (2002 – 2006), and
another during an economic crisis (2007-2010).
Secondly, we focus on the U.S. banking system as the economic crisis in study
(2007-2010) was initially caused by factors in the U.S. banking industry.

7
2. Literature review
Academic scholars and researchers have been increasingly aware of non-
performing loans as a signal of credit risk. This awareness has increased the amount
of research in understanding the key determinants of NPLs. This paper takes various
ideas and concepts from this literature and applies these concepts to a different
environment.
Salas and Saurina (2002) examined the effect of both macroeconomic and
individual bank level variables of problem loans in Spanish commercial and savings
banks in their literature. Their focus was on the importance of individual bank factors
such as growth policies and managerial incentives. They found evidence that the
effect of these individual factors held true even when macroeconomic variables were
held constant. In our paper, we take several variables from their test as our
determinants of NPLs such as the GDP growth rate, inefficiency, size, and capital
ratio. While their study examined two different types of banks – commercial and
savings, our paper studies three types of loans.
Quagliariello (2007) investigated the cyclical nature of banks’ risk in Italy. The
literature shows that loan risk, is significantly impacted by recessionary economic
cycles, and banks’ tendencies to clamp down on lending during these recessionary
times, causes a decrease in earnings, further contributing to the recession. In our
literature, we have divided our data into two distinct time periods – one during
normal economic times and one during recessionary times.

8
Carey (1998) studied the determinants of the loss on both private and public
issued large bond portfolio. They conclude that the profitability and risk quality of
both private and public loans is affected by both specific factors such as
diversification and the riskiness of individual portfolio assets.
Berge and Boye (2007) mentioned the economic cyclical sensitivity of the
problem loans including NPLs. NPLs are highly sensitive to macroeconomic
variables and have a tendency to increase during economic contraction periods.
Similar to their literature, we have included in our test variables, the unemployment
rate and real interest rate (federal fund rate) as well as GDP growth rate.
Demsetz and Strahan (1997) tested the effect of a bank’s size on diversification
benefit. From the literature, large bank holding companies’ lower capital ratios and
larger C&I loan portfolio is offsetting the diversification benefit. They conclude that
this is due to larger banks’ ability to pursue riskier loans and operate with a greater
amount of leverage. Similarly, we test the bank-size in our paper as the bank-specific
variable to verify the result in the U.S. banking system over two time periods.
Stiroh (2002) focuses on the trend of increasing non-traditional business
activities in the U.S. banking industry and tested the diversification benefit from non-
interest income. The literature determines that non-interest income does not provide
obvious diversification benefits. Similar to this literature, we test the impact of
noninterest income as a bank-specific variable.
Nkusu (2011) showed a negative correlation between NPLs and various
macroeconomic variables through his study. He finds that slowing economic growth, a

9
higher unemployment rate, or decreasing asset prices are directly related to increases in
NPLs. Macroeconomic variables are important indicators in the measurement of loan
quality, which in turn directly affects NPLs.
Podpiera and Weill (2008) showed that two of the key determinants that result in
bank failures are reduced cost efficiency and an increase of NPLs. In examining the
causality between the two determinants, they verify that reduced costs efficiency usually
precedes the onset of increased NPLs. However, they find no strong evidence that an
increase in NPLs have any effect on reduced cost efficiency.
Campbell (2007) mentions that bank insolvency is one of the primary reasons of
recent bank failures. The literature focuses on delivering the framework for preventing
and controlling NPLs to properly manage regulatory and supervisory issues on bank
insolvency. The study stresses the importance of building an effective system to
minimize the problem of NPLs through a prudent internal control system combined with
enforcement power.
3. Determinant factors of NPLs
3.1 Macroeconomic factors
The effects of specific macroeconomic factors in the performance of NPLs are being
increasingly studied by academic researchers. These studies have led us to apply these
specific factors to the U.S. economy, in order to determine the magnitude of their effect
on NPLs. We will do empirical testing on the GDP growth rate, unemployment rate, and
federal fund rate.

10
The macroeconomic cycle, as measured by the GDP growth rate, is a strong
indicator of loan quality. During periods of economic expansion, the individual’s and
corporation’s ability to sufficiently fund their debt obligations results in relatively low
NPLs. And in the event of sustained economic stability, NPLs will remain low. However,
the ability to fund debt decreases when the economy enters a period of contraction, thus
resulting in increasing NPLs. Salas and Saurina (2002) find a negative correlation
between GDP growth and NPLs.
Unemployment rates are directly related the consumer’s ability to generate cash-
flow to service debt. Due to the lower consumption of goods during periods of high
unemployment, the cash-flow of corporations is also negatively impacted. This decrease
in cash-flow signals a positive correlation between unemployment rates and NPLs.
Lending rates have a direct cause on the serviceability of loans. As rates become
higher, there is increased difficulty in meeting debt obligations. Lawrence (1995) and
Rinaldi and Sanchis-Arellano (2006) find negative correlations between both the
unemployment rate and lending rate, and NPLs.
3.2 Bank specific determinants
The performance of loans cannot be solely determined by macroeconomic factors.
Factors that are specific to each individual bank also have a measureable effect on NPLs.
Among individual-specific factors, we test solvency ratio, inefficiency ratio, return on
equity, bank-size and non-interest income.
The solvency ratio is defined as the ratio of total equity to total assets. The solvency
ratio is negatively correlated to NPLs. Highly leveraged capital results in a tendency

11
towards higher risk-taking due to the necessity of generating higher profits with lower
capital. Berger and DeYoung (1997) and Salas and Saurina (2002) find a negative
correlation between solvency ratios and NPLs.
The inefficiency ratio can be either positively or negatively correlated with NPLs.
On the one hand, the inefficiency ratio is positively correlated to NPLs. As the
inefficiency ratio is an indicator of the bank’s efficiency in carrying out due diligence in
the application, control, and monitoring of loans. Berger and DeYoung (1997) find a
positive correlation between a bank’s inefficiency and NPLs.
On the other hand, the inefficiency ratio is negatively correlated to NPLs. Conversely,
high cost efficiency may be indicative of a lack of devoting resources to carrying out due
diligence in the application, control, and monitoring of loans, therefore increasing the risk
of these loans. Salas and Saurina (2002) find a negative correlation between inefficiency
and NPLs.
The return on equity is defined as the ratio of net income to total equity. The return
on equity also can be either positively or negatively correlated with NPLs. Due to
pressures to improve reported financial performance, the bank may sacrifice long term
profitability, by creation of higher-risk, lower quality loans, in order to achieve short-
term profitability. So the return on equity is positively correlated to NPLs. Rajan (1994)
find a positive correlation between return on equity and NPLs.
However, the return on equity is possibly negatively correlated to NPLs. In the long
term, past financial out-performance is a likely indicator in the bank’s ability to generate
profitable loans.

12
The bank’s size is defined as the logarithm of total assets. The bank’s size can be
either positively or negatively correlated with NPLs. The reason of size has positively
correlation with NPLs is because a bank’s larger size gives the bank further ability to
pursue higher risk loans and utilize higher levels of leverage. Stiroh (2004) did not find a
diversification benefit determined by bank size. However, Stern and Feldman (2004) find
that large banks are able to take excessive risk by using leverage to extend loans.
Meanwhile, the bank’s size can be negatively correlated to NPLs. A bank’s size
indicates a higher likelihood of a diversified loan portfolio, thereby lowering risk and a
higher probability of achieving target returns. Salas and Saurina (2002) find a negative
correlation between bank size and NPLs.
The non-interest income is defined as the ratio of non-interest income to net
operating income. The non-interest income ratio can be either positively or negatively
correlated to NPLs. Due to NPLs tendency to generate increasing amounts of fee and
penalty based revenue, a higher ratio of this non-interest income signals a higher
percentage of NPLs. So it has positively relationship with NPLs. Stiroh (2002) finds a
positive correlation between the non-interest income ratio, and NPLs.
The non-interest income ratio also can be negatively correlated to NPLs. A higher
non-interest income ratio indicates a diversified portfolio consisting of multiple income-
streams from other business operations. Due to the stable cash-flow generated from other
operations, the likelihood of engaging in high-risk loans is decreased. Rajan and Dhal
(2003) find a negative correlation between diversified income, including the non-interest
income ratio, and NPLs.

13
4. Data Sample and Econometric Methodology
4.1 Banking Data
All information used in this study is in the public domain. This empirical analysis
aims to investigate the impact of macroeconomic and bank-specific factors to non-
performing loans for three types of loans (real-estate, commercial and industrial, and
consumer) in two distinct sub-sample periods (2002-2006 and 2007-2010). This paper
draws its data from Wharton Research Data Services (WRDS). It includes annual data
from 2670 banks, which represents the vast majority of U.S banks. The sources of
information for our macroeconomic variables (Table 2) are the Bureau of Economic
Analysis, Bureau of Labor Statistics and Federal Reserve.
4.2 Econometric model
In accordance with previous research studies, we define the structure of non-
performing loan type i (Real Estate, Commercial and Industrial, and Consumer) in year t
as:
NPL!,! = β! + β! GDP growth rate!,!!!
+ β! Unemployment rate!,!!!+β! Federal funds rate!,!!!
+β! Bank specific variables!,!!! + ε!,! Eq.(1)
Where β! is a constant variable, β! β! β! β! are the coefficients for the lagged
determinant factors, respectively. ε!,! is the error term.
The OLS regression analysis used in this paper is carried out using a simple

14
estimation strategy. We estimate the empirical model with some adjustments to generate
a more robust result. It commences with a linear regression and all variables are
winsorized at 1% and 99% to reduce the impact of outliers.
We measure the magnitude of macroeconomic impact by using the GDP growth rate
and unemployment rate. To gauge the timing effect, we use one-year lag data and we
expect negative coefficients. The Federal fund rate reflects the monetary policy of U.S.,
and thus is an important factor in banks’ determination of lending rates. Each of the bank-
specific indicators in Table 1 are then added to Eq.(1) to further explain the impact of
different bank ratios to non-performing loans. The bank specific variables that are
implemented in this paper are Return on Equity (ROE), solvency ratio, inefficiency, bank
size and non-interest income.
5. Model estimation and results
5.1 Model Estimation
Tables 3 and 4 present the descriptive statistics for each category of Nonperforming
Loans (NPLs) for the two time periods. In the period 2002 to 2006, Commercial and
Industrial loans (C&I) have on average the highest NPLs, while NPLs in Consumer loans
have on average the lowest NPLs with Real Estate loan NPL levels very close to but
slightly higher than Consumer loans. The standard deviations of NPLs for all three types
of loans are close. However, Real Estate NPLs are the most volatile exhibiting the highest
positive skewness and extra kurtosis. In the period 2007 to 2010, the NPLs of Real Estate
loans increased by 210.68%, becoming the highest among these three types of loans. As
this time period includes the heyday of the 2008 sub-prime financial crisis, it is an

15
understandable and highly expected result and also reveals the link between non-
performing loans and macroeconomic performance.
Figure 3 depicts the NPL ratios for all loan types over the studied time periods. All
three NPL categories exhibit a drastic upward trend from mid-2007 and from late 2009
onwards show either a decrease or are constant. The NPL ratio in Real Estate
significantly displayed this behavior as it climbed to almost 0.09, which was about 9
times its ratio for the pre-crisis period. Moreover, commercial and industrial loans are
showing a steady downward trend before 2007, which is abruptly reversed after the
financial crisis started.
5.2 Results
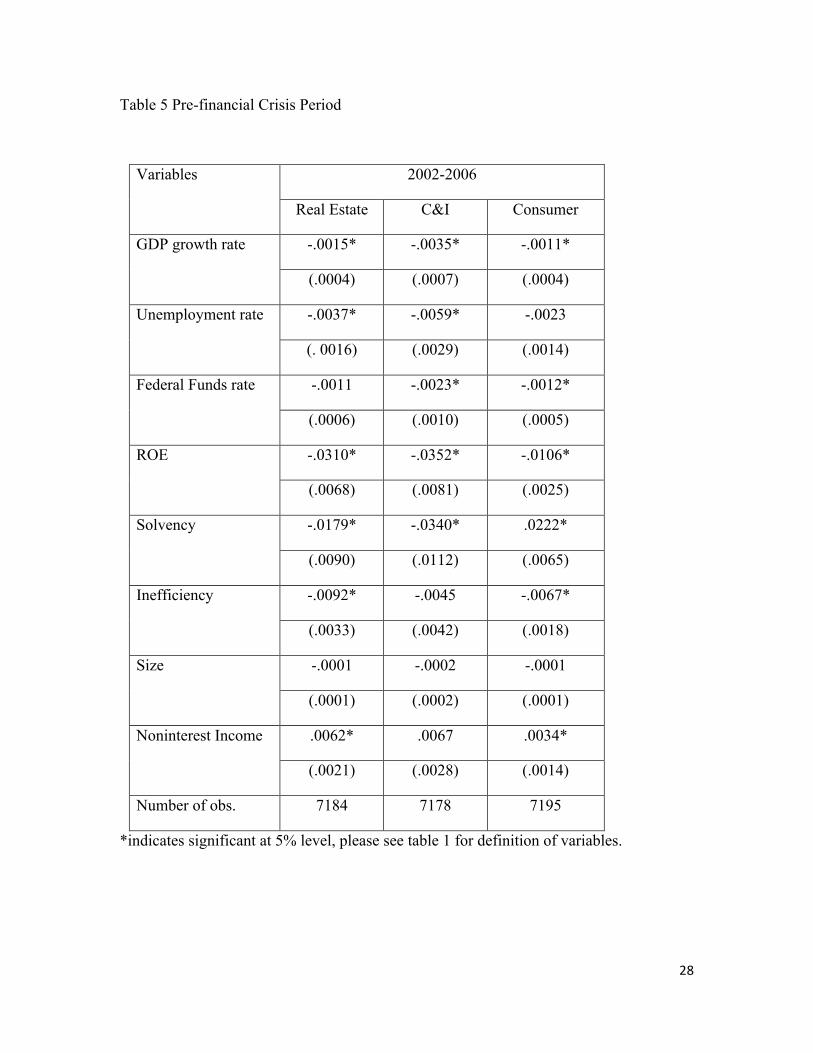
5.2.1 Pre-financial Crisis Period
From tables 5, we find that the majority of variables have a coefficient of the
expected sign, but they are not always statistically significant.
As predicted by our hypothesis, the GDP growth rate is statistically significant and
negatively affects the NPL ratio among all three types of loans. This result points to the
conclusion that a strong economic cycle influences the business’ ability to repay its loans.
With the exception of consumer loans, the NPL ratio is negatively affected by an upward
trend of the unemployment rate and implies that fluctuations in the economy quickly
translate to meaningful effects on NPLs. As well, the coefficients for the Federal Funds
rate are negative. Compare with the research that Louzis, Vouldis and Metaxas (2011)
provided, we have different coefficient results in the unemployment rate and Federal
Funds rate (real lending rate). We think the possible explanations for the differences are

16
as follows: firstly, the increases in employment rate and real lending rate can cause less
people or business has the ability to borrow money, which decreases the amount of loans,
then reduces the problem loans. Secondly, we believe it takes time for the non-
performing loan ratios reflect the changes in those two macroeconomic indicators so we
attribute it to the lag effect.
The Return on Equity has a significant impact on all NPL categories with
Commercial and Industrial NPLs being the most sensitive. Taking into account the fact
ROE is a ratio that used to measure the profitability of the business, the negative
relationship between this variable and the occurrence of problem loans meets our
anticipation.
The solvency indicator is statistically significant and negatively correlated to the
Real Estate and Consumer and Industrial NPLs, while being statistically insignificant for
Consumer NPLs. Therefore, for the first two types of loans, if the bank has solvency
problems, it is can relatively easily adopt risker loan policies. In contrast, the higher the
solvency ratio, the lower the incentives to take risker loan policies, and consequently, the
less prevalent problem loans become.
Inefficiency has a noticeable impact on Real Estate and Consumer NPLs, while
displaying an insignificant coefficient on Commercial and Industrial NPLs. According to
Louzis, Vouldis and Metaxas (2011), one possible explanation could be the Skimping
hypothesis, which states that low inefficiency causes increasing number of NPLs. and
therefore the higher probability of “skimping” on costs related to due diligence in the
administration of loans. The logic is that as a bank devotes more effort (and therefore

17
resulting in higher costs and lower efficiency) to the credit vetting process, the amount of
potential NPLs will be decrease.
Size does not seem to affect the level of NPLs. Our assumption that larger banks tend
to have fewer problem loans than smaller banks, is not true during good economy periods.
For all loan types, non-interest income has a positive and significant effect on NPLs.
This is likely due to the significant contribution to service and penalty fees generated
from NPLs.
5.2.2 Financial Crisis Period
The GDP growth rate, unemployment rate and ROE all have a negative impact on all
NPL categories in the crisis period while the federal fund rate is no longer significant in
determining all three types of NPLs.
The coefficients for the solvency rate are statistically significant and negative in Real
Estate and Commercial and Industrial Loans in this period, which suggests that highly
leveraged capital has higher risks.
The coefficients of the inefficiency ratio for the crisis period are insignificant among
all types of loans, so the level of management is not correlated to NPLs in this period.
Size allows for more diversification opportunities as larger banks can compose less
concentrated portfolios that include borrowers from different industries, geographical
locations, capital size and other customer segments. According to Demsetz and Strahan
(1997), larger sized banks may assume more risk than the smaller ones because they
willing to gain more profit by using their diversification advantages.

18
In contrast with the pre-crisis period, NPLs and noninterest rate displays a negative
relationship in the crisis period in Real Estate Loan. One possible explanation could be
that during the period that a lot of mortgage loans default, the increasing fees or penalties
do not help or have a negative impact on the collectability of these loans.
In the pre-crisis period, for all the three types of loans, NPLs in Commercial and
Industrial are the most easily affected by all the variables. On the other hand, during the
crisis period, the NPLs in Real Estate are most volatile due to the quickly increased bad
debts in mortgages.
6. Conclusion
This paper displays the empirical evidence that the correlation between non-
performing loans and the economic and bank-specific factors are observable. Using the
U.S bank data, we observe that before the recent financial crisis, commercial and
industrial loan were the most vulnerable to all the determinants. However, under times of
economic recession, real estate loans are significantly exposed to the studied
macroeconomic and bank-specific determinants, supporting the view that the U.S
mortgage market is still weak and susceptible to economic cycles.

19
References
[1] Berge, T.O., Boye, K.G., 2007. An analysis of bank’s problem loans. Norges Bank
Economic Bulletin 78, 65–76.
[2] Boyd, J., Gertler, M., 1994. The role of large banks in the recent US banking crisis.
Federal Reserve Bank of Minneapolis Quarterly Review 18, 1–21.
[3] Breuer, J.B., 2006. Problem bank loans, conflicts of interest, and institutions. Journal
of Financial Stability 2, 266–285.
[4] Carey, M., 1998. Credit risk in private debt portfolios. Journal of Finance 53, 1363–
1387.
[5] Demsetz, R., Strahan, P., 1997. Diversification, Size, and Risk at Bank Holding
Companies. Journal of Money, Credit, and Banking 29:3 (1997), 300-313
[6] Hu, J., Yang, Li., Yung-Ho, C., 2004. Ownership and non-performing loans: evidence
from Taiwan’s banks. Developing Economies 42, 405–420.
[7] Kutner, M., Nachtsheim, C., Neter, J., Li, W., 2004. Applied Linear Statistical Models.
McGraw-Hill, New York.
[8] Louzis, D., Vouldis, A., Metaxas, V., 2011. Macroeconomic and bank-specific
determinants of non-performing loans in Greece: A comparative study of mortgage,
business and consumer loan portfolios. Journal of Banking & Finance 36 (2012), 1012–
1027.
[9] Nkus, M., 2011. Nonperforming Loans and Macrofinancial Vulnerabilities in
Advanced Economies. Working Paper
[10] Podpiera, J., Weill, L., 2008. Bad luck or bad management? Emerging banking
market experience. Journal of Financial Stability 4, 135–148.
[11] Quagliariello, M., 2007. Banks’ riskiness over the business cycle: a panel analysis
on Italian intermediaries. Applied Financial Economics, 17:2, 119-138
[12] Reinhart, C., Rogoff, K., 2010. From Financial Crash to Debt Crisis. NBER
Working Paper 15795
[13] Rajan, R., Dhal, S., 2003. Non-performing loans and terms of credit of public sector
banks in India: an empirical assessment. Reserve Bank of India Occasional Paper 24, 81–
121.
[14] Salas, V., Saurina, J., 2002. Credit Risk in Two Institutional Regimes: Spanish

20
Commercial and Saving Banks. Journal of Financial Services Research 22:3, 203-224
[15] Sinkey Jr., J., Greenawalt, M., 1991. Loan-loss experience and risk-taking behavior
at large commercial banks. Journal of Financial Services Research 5, 43–59.
[16] Stiroh, K., 2004. Diversification in banking: is noninterest income the answer?
Journal of Money, Credit and Banking 36, 853–882.
[17] Voulgaris, F., Asteriou, D., Agiomirgianakis, G., 2004. Size and determinants of
capital structure in the Greek manufacturing sector. International Review of Applied
Economics 18, 247–262.
[18] Williams, B., Prather, L., 2010. Bank risk and return: the impact of bank Non-
Interest Income. International Journal of Managerial Finance Vol. 6 No. 3

21
Appendix
Figure 1.
Each loan amount by type
0
0.5
1
1.5
2
2.5
3
3.5
2002 2003 2004 2005 2006 2007 2008 2009 2010
Real estate loans (in trillion)
Commercial and Industrial loans
Consumer loans
22
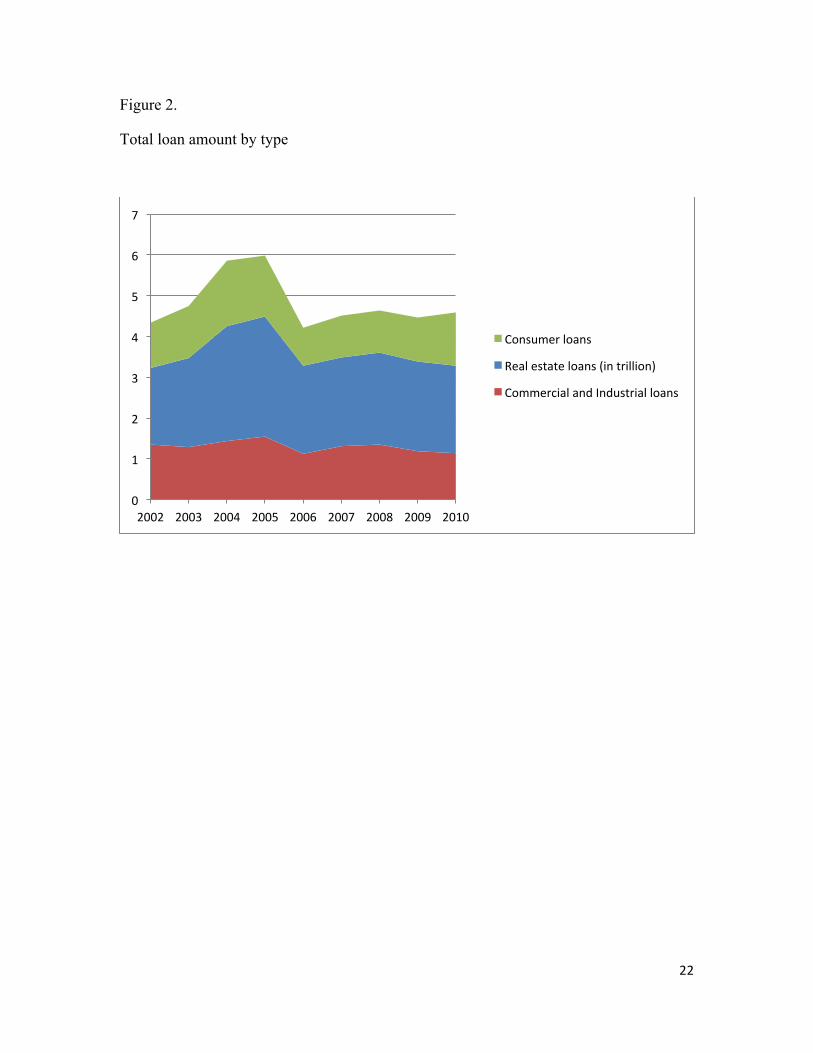
Figure 2.
Total loan amount by type
0
1
2
3
4
5
6
7
2002 2003 2004 2005 2006 2007 2008 2009 2010
Consumer loans
Real estate loans (in trillion)
Commercial and Industrial loans

23
Figure 3.
NPL ratio of different types of loan
0
0.01
0.02
0.03
0.04
0.05
0.06
0.07
0.08
0.09
0.1
2002 2003 2004 2005 2006 2007 2008 2009 2010
NPL raBo in Real Estate Loans
NPL raBo in Commercial and Industrial Loans
NPL raBo in Cosumer Loans

24
Table 1. Definition of Variables
Variable Definition Expectation
GDP growth rate (-)
Unemployment rate (+)
Federal Funds rate (+)
Solvency Ratio Total Equity/Total Assets (-)
Inefficiency Ratio Non-interest expense/Net operating Income (+) (-)
Return on Equity Net Income/Total Equity (+) (-)
Bank Size Log(Total Assets) (-)
Non-interest Income Ratio Non-interest Income/Net Operation Income (+) (-)

25
Table 2 Macroeconomic rates
Year GDP_Growth_Rate(real) Unemployment_Rate Federal_funds_Rate
2002 1.8 5.78 1.67
2003 2.5 5.99 1.13
2004 3.5 5.54 1.35
2005 3.1 5.08 3.22
2006 2.7 4.61 4.97
2007 1.9 4.62 5.02
2008 -0.3 5.80 1.92
2009 -3.5 9.28 0.16
2010 3.0 9.63 0.18

26
Table 3 Summary Statistics of Nonperforming Loan Ratio by Loan Type(2002-2006)
2002-2006 Real Estate C&I Consumer
Maximum 0.1162 0.1274 0.0684
Minimum 0.0000 0.0000 0.0000
Mean 0.0073 0.0118 0.0061
Median 0.0042 0.0051 0.0032
St.Dev 0.0107 0.0191 0.0093
Skewness 4.4477 3.3064 3.7769
Kurtosis 33.8110 16.5763 21.8112
Obs. 9726 9730 9741

27
Table 4 Summary Statistics of Nonperforming Loan Ratio by Loan Type (2007-2010)
2007-2010 Real Estate C&I Consumer
Maximum 0.1162 0.1274 0.0684
Minimum 0.0000 0.0000 0.0000
Mean 0.0226 0.0194 0.0077
Median 0.0128 0.0104 0.0036
St.Dev 0.0269 0.0257 0.0124
Skewness 2.0165 2.4372 3.0981
Kurtosis 6.7613 9.4329 13.6418
Obs. 3945 3956 3949
28
Table 5 Pre-financial Crisis Period
Variables 2002-2006
Real Estate C&I Consumer
GDP growth rate -.0015* -.0035* -.0011*
(.0004) (.0007) (.0004)
Unemployment rate -.0037* -.0059* -.0023
(. 0016) (.0029) (.0014)
Federal Funds rate -.0011 -.0023* -.0012*
(.0006) (.0010) (.0005)
ROE -.0310* -.0352* -.0106*
(.0068) (.0081) (.0025)
Solvency -.0179* -.0340* .0222*
(.0090) (.0112) (.0065)
Inefficiency -.0092* -.0045 -.0067*
(.0033) (.0042) (.0018)
Size -.0001 -.0002 -.0001
(.0001) (.0002) (.0001)
Noninterest Income .0062* .0067 .0034*
(.0021) (.0028) (.0014)
Number of obs. 7184 7178 7195
*indicates significant at 5% level, please see table 1 for definition of variables.

29
Table 6 Financial Crisis Period
Variables 2007-2010
Real Estate C&I Consumer
GDP growth rate -.0088* -.0065* -.0024*
(.0011) (.0010) (.0006)
Unemployment rate -.0072* -.0060* -.0020*
(.0009) (.0009) (.0005)
Federal Funds rate .0016 .0004 .0007
(.0009) (.0009) (.0005)
ROE -.0445* -.0375* -.0103*
(.0047) (.0053) (.0022)
Solvency -.0592* -.0458* -.0094
(.0163) (.0152) (.0081)
Inefficiency -.0039 -.0029 -.0031
.0042 (.0046) (.0020)
Size .0028* .0004 .0011*
(.0004) (.0004) (.0002)
Noninterest Income -.0094* .0001 -.0023
(.0046) (.0041) (.0020)
Number of obs. 3696 3703 3699
*indicates significant at 5% level, please see table 1 for definition of variables.