Embed Size (px)
Citation preview

RESTAURANT BRANDS NEW ZEALAND LIMITED
Sydney
4 May 2017Russel Creedy Group CEO
Macquarie Investor Day Presentation

Presentation Outline
• RBD – Who Are We
• FY17 Trading Results
• Hawaiian Acquisition
• Growth Opportunities

Restaurant Brands (RBD) is a corporate franchisee based in New Zealand with operations in Hawaii and Australia

Restaurant Brands has seen a solid sales and profit performance primarily from its New Zealand business over the past 5 years
311.9 329.3 359.5 387.6
497.2
FY2013 FY2014 FY2015 FY2016 FY2017
Sales $NZm
17.7 18.922.5 24.2
30.6
FY2013 FY2014 FY2015 FY2016 FY2017
Trading NPAT $NZm

Restaurant Brands is truly an international multi-brand operator
NZ Australia NZ NZ HawaiiHawaii TotalNZ$NZm
Sales 310 130 40 25 40 100 80 725
Brand EBITDA 65 20 4 5 2 18 8 122
People 2,300 2,200 400 300 450 850 1,070 7,570
Stores 94 47 30 24 20 37 45 297
FY18 (analyst consensus)

Trading results for the 12 months ended 27 February 2017 (FY17)
Commentary (FY17 vs FY16)
• Group Revenues +28.1%
• NPAT (excluding non-trading) +26.3%
• Reported NPAT (including non-trading) +7.8%
• Brand EBITDA +$19.3m driven by KFC Australia
• Fully imputed 13.5 cps final dividend brings full year to +9.5%
• Hawaiian expansion with acquisition of Pacific Island Restaurants (post balance date)
FY15 FY16 FY17
$372.6m $404.1m $517.5m
$22.5m $24.2m $30.6m
$23.8m $24.1m $26.0m
$61.5m $66.9m $86.2m
19.0cps 21.0cps 23.0cps
- 82 stores

Restaurant Brands enjoys very strong operating cash flows
Cash Flow $m FY15 FY16 FY17
Operating cash flow 36.5 44.3 47.9
Investing cash flow (33.0) (15.3) (79.0)
Free cash flow 3.5 29.0 (31.1)
FY15 FY16 FY17Investing cash outflow (QSR) - - (63.9)
Investing cash outflow (other) (41.4) (20.8) (20.3)
Investing cash inflow 8.4 5.5 5.2
(33.0) (15.3) (79.0)

The New Zealand business grew strongly in FY17 with sales of $400m, led by KFC
265.0 282.5
296.5
7.7%6.3%
3.6%
FY15 FY16 FY17
KFC Sales
Total Sales $m Same Store Sales %
48.4 44.9 40.5
6.3% 2.6%3.6%
FY15 FY16 FY17
Pizza Hut Sales
Total Sales $m Same Store Sales %
26.1
26.8
26.7
5.1%
6.9%
4.5%
FY15 FY16 FY17
Starbucks Sales
Total Sales $m Same Store Sales %
20.1 33.4 36.3
-28%-5% -3.8%
FY15 FY16 FY17
Carl's Jr. Sales
Total Sales $m Same Store Sales %

KFC also drove New Zealand earnings growth in FY17
50.8 57.2 61.4
19.2%20.2%
20.7%
12.0%
16.0%
20.0%
FY15 FY16 FY17
KFC EBITDA
EBITDA $m EBITDA % of Sales
6.4 4.9 4.1
13.2%
10.9%10.0%
0.0%
4.0%
8.0%
12.0%
16.0%
FY15 FY16 FY17
Pizza Hut EBITDA
EBITDA $m EBITDA % of Sales
4.3 4.4
4.8
16.3% 16.4%
17.8%
12.0%
16.0%
20.0%
FY15 FY16 FY17
Starbucks EBITDA
EBITDA $m EBITDA % of Sales
0.2
0.4
1.0
0.8% 1.3%
2.7%
FY15 FY16 FY17
Carl's Jr. EBITDA
EBITDA $m EBITDA % of Sales

Dividend up 9.5% to 23.0 cents commensurate with profitability (fully imputed at 28%)
FY15 FY16 FY17
Earnings per share (excluding non-trading) cps 23.0 24.7 28.4
Total dividend cps 19.0 21.0 23.0
Payout ratio of NPAT (excluding non-trading) % 83% 85% 81%

The QSR acquisition settled on 27 April 2016. The 42 KFC stores have delivered ahead of plan
97.2
116.6 106.4
FY17 (10 monthsactual)
FY17 (annualised) Year 1 Target
$NZm
QSR – Sales above Target
15.0
18.0 16.0
FY17 (10 monthsactual)
FY17 (annualised) Year 1 Target
$NZm
EBITDA up on target

Material growth opportunities are already being exploited in Australia
Expand restaurant networkA number of locations have been identified which represent ideal and profitable opportunities to increase the restaurant portfolio footprint in existing trade area
Acquire other franchises/portfoliosPotential scope to expand the QSR KFC portfolio footprint in NSW and other states, either through building restaurants in new locations or the acquisition of other franchise portfolios in the KFC network
Potential acquisition of Yum restaurantsYum owns approximately 150 KFC restaurants in Australia and has just put 100 of them on the market
• Two new stores under construction • Five independent store acquired (settled after balance date)
• RBD is actively evaluating the possible purchase of some of these stores
Restaurant Brands Hawaii – Progress to date
• Agreement to purchase 100% of shares in Pacific Island Restaurants Inc. (PIR) for $US105 million signed 26 October 2016
• PIR is the sole Taco Bell and Pizza Hut franchisee in Hawaii, Guam and Saipan
• Successful capital raising in November 2016 through Accelerated Renounceable Entitlement Offer (AREO) raised $NZ94 million from mainly existing shareholders
• Transaction was finally settled on 7 March 2017
• Acquired business is expected to deliver $NZ180 million in sales and store EBITDA of $27 million; on target to deliver this to date

Transaction highlights
PIR is a well-established, profitable business with potential for improved profitability from a targeted re-investment programme, and provides a beachhead for other potential opportunities
1. Established in 1971, PIR is the sole Taco Bell and Pizza Hut franchisee in Hawaii, Guam and Saipan, has been consistently profitable in recent years and has a stable, experienced management team (average tenure of 25 years)
2. Taco Bell and Pizza Hut are both iconic Yum! brands and have leading positions in their respective markets with attractive and stable margins
3. There is an opportunity to execute an investment programme (which has been substantially agreed with Yum!) to progressively refresh PIR’s stores, which Restaurant Brands believes will improve PIR’s profitability, reflecting RBNZ’s experience over the last ten years in New Zealand
4. PIR provides the next stage of RBNZ’s growth platform and an entry point into the Hawaii market and platform for other potential bolt-on acquisitions
5. Hawaii has a stable legal and economic framework, with sound forecast GDP growth of approximately 4% p.a. from 2015 forecast through to 20192
6. PIR’s primary exposure is to the domestic Hawaiian market, and provides an opportunity to service a portion of the 8.9 million visitor arrivals to Hawaii each year
• Store network
Hawaii Guam Saipan
30
38
7
6 1
• Leading market share in branded QSR pizza and Mexican food in Hawaii1
Pizza Hut43%
Domino's21%
Papa John's16%
Little Caesars12%
Boston's7%
Harpo's1%
Taco Bell91%
Taco Del Mar9%
• 1. Market share data as at March 2016 based on Oahu, Hawaii customer visits per Ward Research Inc, extrapolated to account for PIR presence in neighbouring islands; 2. State Hawaii, Department of Business, Economic Development and Tourism, Outlook for the Economy Q3 2016.
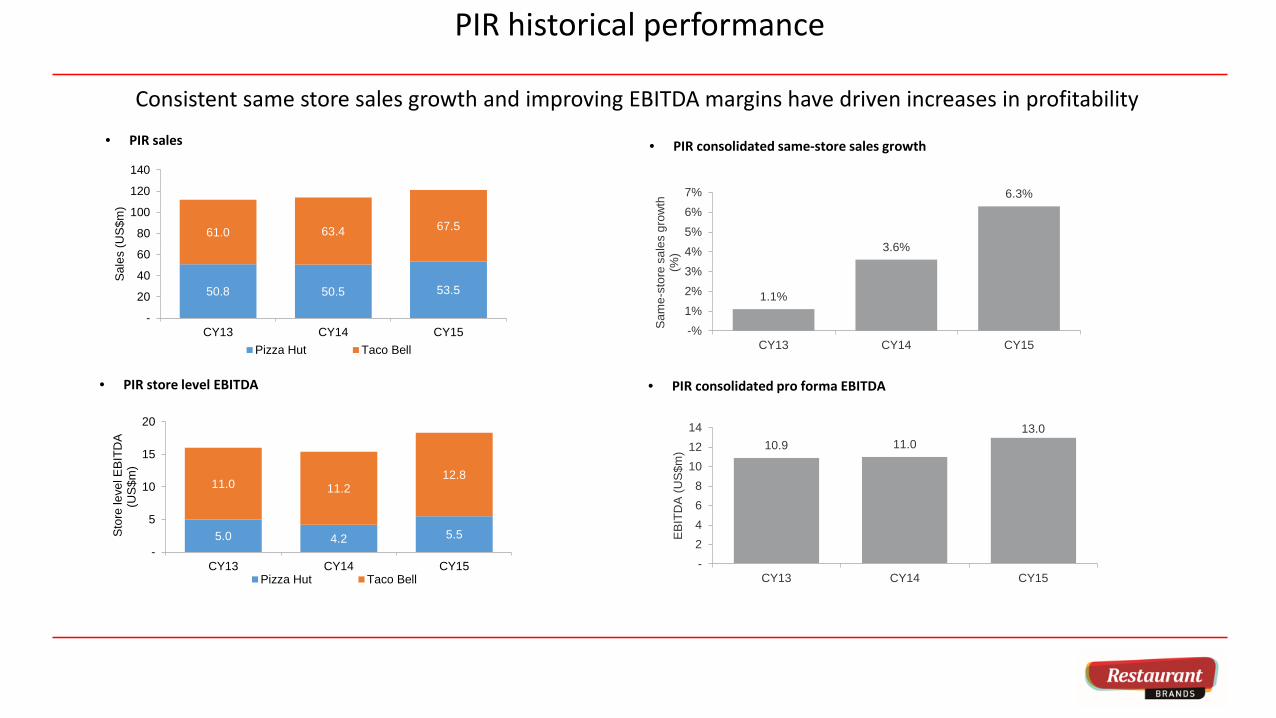
PIR historical performance
Consistent same store sales growth and improving EBITDA margins have driven increases in profitability
• PIR consolidated same-store sales growth
• PIR store level EBITDA • PIR consolidated pro forma EBITDA
• PIR sales
1.1%
3.6%
6.3%
-%1%2%3%4%5%6%7%
CY13 CY14 CY15
Sam
e-st
ore
sale
s gr
owth
(%
)
50.8 50.5 53.5
61.0 63.4 67.5
-
20
40
60
80
100
120
140
CY13 CY14 CY15
Sal
es (U
S$m
)
Pizza Hut Taco Bell
5.0 4.2 5.5
11.0 11.212.8
-
5
10
15
20
CY13 CY14 CY15
Sto
re le
vel E
BIT
DA
(U
S$m
)
Pizza Hut Taco Bell
10.9 11.013.0
-2468
101214
CY13 CY14 CY15
EB
ITD
A (U
S$m
)

Taco Bell
Taco Bell is a strongly performing QSR with a loyal customer base and strong margins
Key facts Hawaiian market leader in Mexican QSR1
10.2 11.0 11.212.8
-
5
10
15
CY12 CY13 CY14 CY15
Sto
re le
vel E
BIT
DA
(U
S$m
)
1. Market share data as at March 2016 based on Oahu, Hawaii customer visits per Ward Research Inc, extrapolated to account for PIR presence in neighbouring islands.
• 37 stores, 30 in Hawaii and seven in Guam
• Contributed 70% of PIR’s CY15 store level EBITDA
• Leading Mexican QSR in the local market; key competitors include:
• McDonald’s, Burger King, Jack in the Box, Wendy’s, Zippy’sand Taco Del Mar
• Taco Bell store formats cover drive-thru, dine-in and takeaway
• Higher margins driven in part by an all day menu which includes breakfast and late night options
• Staged upgrade of “mission style” buildings by 2025
Unique product offering supported by continued innovation
EBITDA growth driven by a combination of sales growth and margin improvement (US$m and % sales)
CrunchwrapSupreme
Nacho Cheese Doritos Locos
taco
QuesalupaBreakfast Crunchwrap
Taco Bell91%
Taco Del Mar9%

Pizza Hut
• 45 stores, 38 in Hawaii, six in Guam and one in Saipan
• Contributed 30% of PIR’s CY15 store level EBITDA
• Pizza Hut has a higher Hawaiian market share than its next two largest competitors combined1
• Named Hawaii’s Best Pizza by the Honolulu Star-Advertiser in 2016
• Stable store level EBITDA margin of ~10%
• Store upgrade plan commenced in 2015, with the majority of stores still to be upgraded
Pizza Hut is the Hawaiian market leader in Pizza QSR1Key facts
Consistent EBITDA (US$m and % sales)2
PIR has a strong network of Pizza Hut stores, which operate on similar margins to Pizza Hut New Zealand
Pizza Hut43%
Domino's21%
Papa John's16%
Little Caesars12%
Boston's7%
Harpo's1%
1 of 13 Red Roof stores, the other 32 stores are Delco (Delivery / Pickup) or Food Court stores
Strong store network
38
14 14 116
1
Pizza hut Domino's Papa Johns LittleCaesars
Boston's Harpo'sHarpo’s
4.9 5.04.2
5.5
-123456
CY12 CY13 CY14 CY15
Sto
re le
vel E
BIT
DA
(U
S$m
)
1. Market share data as at March 2016 based on Oahu, Hawaii customer visits per Ward Research Inc, extrapolated to account for PIR presence in neighbouring islands; 2. CY14 margins impacted by high commodity prices, particularly cheese

Store refresh strategy
• PIR has recently agreed a ten year investment programme with Yum! for Taco Bell and is in advanced discussions for Pizza Hut
• The investment programmes are expected to be funded out of PIR’s operating cash flows and PIR debt facility
• RBNZ’s own experience in New Zealand has been that store refresh expenditure typically results in increased store sales and profitability and generates an attractive return on capital
• In New Zealand, RBNZ has been able to achieve sustainable sales growth and an uplift in profitability across its whole store portfolio from its refresh programme
• In light of this RBNZ may spend in excess of the investment programme where management identifies attractive opportunities
New Zealand KFC Transformation ProgrammeOverview
KFC New Zealand sales growth following store transformation programme
-1
4
9
14
19
24
140
160
180
200
220
240
260
1996 1997 1998 1999 2000 2002 2003 2004 2005 2006 2007 2008 2009 2010 2011 2012 2013 2014
Transformation Spend ($m's) (Right Axis) Sales Revenue ($m's) (Left Axis)
Befo
re
tran
sfor
mat
ion
Afte
r tr
ansf
orm
atio
n
Restaurant Brands’ experience in New Zealand indicates that a targeted store refresh programme could further improve PIR’s profitibility

Growth Opportunities
GROWTH PATH
TRANSFORMATION & STORE REINVESTMENT
(Existing brand and geography)
Running the business better• Strong Operations• Compelling Marketing
ASSET INVESTMENT
Build profitable network growth through asset build or acquisition
BUILD NEW STORES(Existing brand and geography)
ACQUIRE INDIVIDUAL STORES(Existing geography and brand)
ACQUIRE LARGE NUMBERS OF STORES
(Existing brand and geography)
BUILD/ACQUIRE NEW BRAND
• KFC New Zealand• Taco Bell Hawaii• Pizza Hut Hawaii
• INFILL• GREENFIELD
• Pizza Hut New Zealand• KFC New Zealand• Taco Bell Hawaii• KFC Australia
• KFC New Zealand• KFC Australia • KFC Australia • Taco Bell New Zealand
• KFC Hawaii• Taco Bell Australia
ORGANIC
“To build RBD to a $1 billion company in sales and market capitalisation by growing both top and bottom line”

Strategic plans have identified expansion potential in Australia and the US, utilising strong expertise with franchise brands
New Zealand Australia Hawaii US
x x
x x x
x x
x
Presentx
identified growth opportunitiesno current expansion plans


![PM 2014 investor day 2014-06-26-CEO Investor Day Slides [FINAL]](https://img.pdfslide.us/doc/110x75/577cbc651a28aba7118da313/pm-2014-investor-day-2014-06-26-ceo-investor-day-slides-final.jpg)
![PM 2014 investor day 2014-06-26-Operations Investor Day Slides [FINAL]](https://img.pdfslide.us/doc/110x75/577cbc651a28aba7118da314/pm-2014-investor-day-2014-06-26-operations-investor-day-slides-final.jpg)