Embed Size (px)
Citation preview
MACQUARIE GLOBAL INFRASTRUCTURE TOTAL RETURN FUNDSEMI-ANNUAL REPORT 2010

1
CAUTION REGARDING FORWARD-LOOKING STATEMENTS AND pAST pERFORMANCE
This Semi-Annual Report contains certain forward-looking statements within the meaning of Section 27A of the Securities Act of 1933. Forward-looking statements include statements regarding the goals, beliefs, plans or current expectations of Macquarie Capital Investment Management LLC (“MCIM” or “Manager”) and its respective representatives, taking into account the information currently available to them. Forward-looking statements include all statements that do not relate solely to current or historical facts. For example, forward-looking statements may include the use of words such as “anticipate,” “estimate,” “intend,” “expect,” “believe,” “plan,” “may,” “should,” “would,” or other words that convey uncertainty of future events or outcomes. Forward-looking statements involve known and unknown risks, uncertainties and other factors that may cause the Fund’s actual results, performance or achievements to be materially different from any future results, performance or achievements expressed or implied by the forward-looking statements. Past performance is not a reliable indication of future performance. When evaluating the information included in this Semi-Annual Report, you are cautioned not to place undue reliance on these forward looking statements, which reflect the judgment of MCIM and its respective representatives only as of the date hereof. We undertake no obligation
to publicly revise or update these forward-looking statements to reflect events and circumstances that arise after the date hereof.
Capitalized terms, used but not defined herein, have the meaning assigned to them in the Fund’s prospectus.
Investments in the Macquarie Global Infrastructure Total Return Fund Inc (“MGU” or “Fund”) are not deposits with or other liabilities of Macquarie Bank Limited ABN 46 008 583 542 (“MBL”) nor any Macquarie Group company and are subject to investment risk, including possible delays in repayment and loss of income and principal invested. Neither MBL nor any other member company of the Macquarie Group guarantees the performance of the Fund or the repayment of capital from the Fund or any particular rate of return.
2
Shareholder LetterMAy 31, 2010 (unaudited)
Introduction
We are pleased to present this Semi-Annual report to the shareholders of Macquarie Global Infrastructure Total Return Fund Inc. (“MGU” or “Fund”) for the six months ended May 31, 2010 (“Period”). The Fund commenced operations and began trading on the New York Stock Exchange on August 26, 2005.
performance & portfolio Review
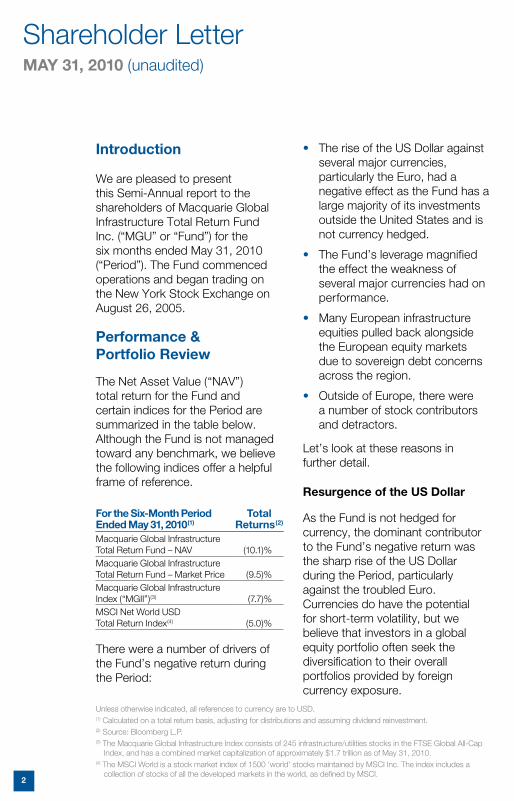
The Net Asset Value (“NAV”) total return for the Fund and certain indices for the Period are summarized in the table below. Although the Fund is not managed toward any benchmark, we believe the following indices offer a helpful frame of reference.
For the Six-Month period Ended May 31, 2010(1)
Total Returns(2)
Macquarie Global Infrastructure Total Return Fund – NAV (10.1)%Macquarie Global Infrastructure Total Return Fund – Market Price (9.5)%Macquarie Global Infrastructure Index (“MGII”)(3) (7.7)%MSCI Net World USD Total Return Index(4) (5.0)%
There were a number of drivers of the Fund’s negative return during the Period:
• The rise of the US Dollar against several major currencies, particularly the Euro, had a negative effect as the Fund has a large majority of its investments outside the United States and is not currency hedged.
• The Fund’s leverage magnified the effect the weakness of several major currencies had on performance.
• Many European infrastructure equities pulled back alongside the European equity markets due to sovereign debt concerns across the region.
• Outside of Europe, there were a number of stock contributors and detractors.
Let’s look at these reasons in further detail.
Resurgence of the US Dollar
As the Fund is not hedged for currency, the dominant contributor to the Fund’s negative return was the sharp rise of the US Dollar during the Period, particularly against the troubled Euro. Currencies do have the potential for short-term volatility, but we believe that investors in a global equity portfolio often seek the diversification to their overall portfolios provided by foreign currency exposure.
Unless otherwise indicated, all references to currency are to USD.(1) Calculated on a total return basis, adjusting for distributions and assuming dividend reinvestment. (2) Source: Bloomberg L.P.(3) The Macquarie Global Infrastructure Index consists of 245 infrastructure/utilities stocks in the FTSE Global All-Cap
Index, and has a combined market capitalization of approximately $1.7 trillion as of May 31, 2010. (4) The MSCI World is a stock market index of 1500 ‘world’ stocks maintained by MSCI Inc. The index includes a
collection of stocks of all the developed markets in the world, as defined by MSCI.
3
Against the US Dollar over the Period, the Euro, British Pound, and Australian Dollar, depreciated by 18%, 12%, and 8%, respectively, while the Canadian Dollar slightly appreciated by 1%.(2) These four currencies represented approximately 54% of the globally diversified portfolio’s security positions at the Period’s end.
Leverage
While global equity markets were little changed over the Period, the Fund’s leverage negatively affected MGU’s performance as it magnified the Fund’s downside move due to the strength of the US Dollar. By contrast to this Period, the Fund’s leverage was a strong contributor in 2009 when overall returns were strongly positive.
As of May 31, 2010, the Fund had $91 million in leverage outstanding and $9 million of available commitments. The Fund’s leverage was 24.5% relative to Total Assets which is below the limit outlined in the Fund’s Prospectus.
European Market Weakness
While clouds of volcanic ash from Iceland’s Eyjafjallajokull volcano grounded over 100,000 flights to and within much of Europe over almost a week in April, it was the cloud of uncertainty over the continent (particularly Greece, Spain, Portugal, Ireland, and Italy) that weighed most heavily on global markets for much of the Period. Ratings agencies
cut Greece’s debt rating to sub investment grade and lowered Portugal and Spain’s ratings as well, adding to fears that a European debt problem could slow the European and global recoveries.
European equity markets underperformed given these negative developments, and infrastructure equities were not immune from this weakness despite continued positive news at the operational level at many of these companies. The larger negative returns (in local currency terms) among the Fund’s holdings were in Southern Europe: toll road operator Abertis Infraestructuras and electricity transmission company Red Eléctrica in Spain and Italian toll road operator Atlantia. German and French stocks posted mixed returns, in local currency. All of these holdings were among the largest stock detractors from absolute performance in US Dollar terms.
With approximately 28% of the Fund as at Period-end invested in stocks listed on exchanges in the Eurozone, we have been monitoring developments very closely. The Fund has had no exposure to Greece or Portugal. Offsetting the negative impact of fiscal consolidation upon economic growth, we believe, the weaker Euro will have somewhat of a positive impact on certain infrastructure companies with exposure to European exports, such as Hamburger Hafen und Logistik, a German seaport owner and operator in the city of Hamburg.Consistent with the essential service
4
Shareholder LetterMAy 31, 2010 (unaudited)
nature of infrastructure and thus its typically resilient demand through the economic cycle, we do not expect the operations and earnings of most of our infrastructure companies to be materially adversely affected by the European sovereign debt crisis. Indeed, our main focus has been on identifying opportunities where we believe the fall in share price is exaggerated relative to valuations and forecast earnings. For example, the stock of Abertis Infraestructuras fell around 18% over the Period on concern about Spain, but we estimate this company is only around 25% exposed to the Spanish economy. In our view, it was oversold, which created an attractive buying opportunity.
Over the Period, the Fund’s overall weighting in Eurozone countries was reduced from over 34% to 28%. We have selectively rotated among stocks where relative valuations have changed because of the somewhat undifferentiated selling in some European equity markets. It is in situations such as this that we believe investors who are focused on the fundamentals and able to filter out the short-term noise can lay the foundations for future outperformance.
Other Notable Stock Contributors and Detractors
The major positive sector contributors to the Fund’s return for the Period were Pipelines, Airports, and Water. The major sector detractors were Toll Roads and Electricity and Gas Distribution. On
a country level, the major positive contributor was the United States, while Australia and Spain were the largest detractors.
While the Pipelines sector was not immune to the broad market weakness late in the Period, the strong fundamentals of the sector remain intact in our view. US-listed Master Limited Partnerships that own pipeline and associated energy infrastructure assets make up nearly half of the Fund’s investment in the Pipelines sector. These holdings outperformed both the broader infrastructure sector and the Pipelines sector over the Period. Company announcements in the Pipelines sector throughout the Period continued to reflect sound operational performance and a favorable outlook. We continue to believe that the pipeline stocks in the Pipelines Sector within the Fund have conservative management, limited exposure to volume and commodity price risk and offer relatively predictable earnings, sound balance sheets, defensive and very predictable cash flows, attractive yields and good growth prospects. Enterprise Products Partners LP and Magellan Midstream Partners LP were two of the four top stock contributors in the Fund for the Period.
On a local currency level, the Airports sector also performed well, with generally positive earnings and underlying passenger traffic data. Airline industry body (“IATA”) (whose members represent over 90% of
5
the world’s international air traffic) reported that demand continues to improve further. In the March quarter, international air travel was up an annualized 9% and air freight was up 26%. (“IATA”) also reported that international economy class travel was back to pre-crisis levels following a strong increase in the March quarter. Among the stronger performers were Grupo Aeroportuario del Pacifico in Mexico, Fraport in Germany, Zurich Airport in Switzerland, and Auckland International Airport in New Zealand.
The Water sector performed well for the Fund due to the UK holdings. The regulated UK water companies accepted the final determination for regulated water and waste water tariffs for the period 2010-15. The acceptance together with the announced capital structure policies were well received by the market. Late in the Period, Severn Trent reported a good earnings result. It also benefited from a higher than expected UK inflation number. The market understands that inflation protection is one of the attractive characteristics of UK water companies, as the regulator permits them to pass inflation through to customers by way of higher tariffs and thus revenue.
The Toll Roads sector was affected by the general weakness in Spanish and Italian markets, as well as the knock back by Transurban management of the takeover offer.
The Transurban board was of the view the offer was not sufficiently certain and did not properly reflect the company’s value. One of the three bidders subsequently exited the register and the stock fell back closer to pre-takeover offer levels. By contrast, China’s Jiangsu Expressway posted a strong return for the Period, driven by increased traffic growth.
The Electricity and Gas Distribution sector was led lower by Australian regulated electricity distribution company Spark Infrastructure Group (“Spark”), which pulled back in the latter half of the Period. Spark indicated that it is undertaking a strategic review to consider its capital structure, ownership structure and future funding needs.
The top stock contributor was US-based electricity transmission company ITC Holdings (“ITC”). It benefited from a study by the Midwest Independent Transmission System Operator that showed high voltage transmission is needed to integrate renewable energy, consistent with ITC’s proposed USD 11 billion transmission line called the Green Power Express. ITC also raised its 2009/10 earnings guidance on higher than previously expected project completion.
performance Relative to the MGII
The Fund, which is not managed towards any benchmark, underperformed the Macquarie
6
Shareholder LetterMAy 31, 2010 (unaudited)
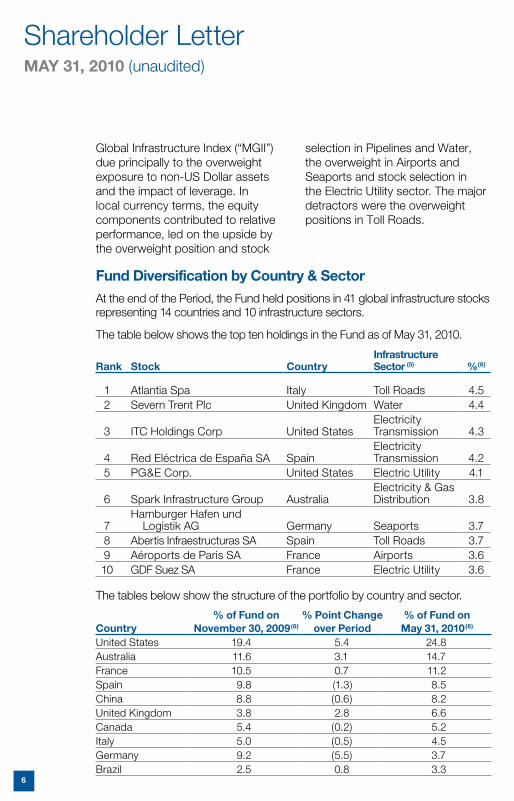
Fund Diversification by Country & SectorAt the end of the Period, the Fund held positions in 41 global infrastructure stocks representing 14 countries and 10 infrastructure sectors.
The table below shows the top ten holdings in the Fund as of May 31, 2010.
Rank Stock CountryInfrastructure Sector (5) %(6)
1 Atlantia Spa Italy Toll Roads 4.52 Severn Trent Plc United Kingdom Water 4.4
3 ITC Holdings Corp United StatesElectricity Transmission 4.3
4 Red Eléctrica de España SA SpainElectricity Transmission 4.2
5 PG&E Corp. United States Electric Utility 4.1
6 Spark Infrastructure Group AustraliaElectricity & Gas Distribution 3.8
7Hamburger Hafen und Logistik AG Germany Seaports 3.7
8 Abertis Infraestructuras SA Spain Toll Roads 3.79 Aéroports de Paris SA France Airports 3.610 GDF Suez SA France Electric Utility 3.6
The tables below show the structure of the portfolio by country and sector.
Country% of Fund on
November 30, 2009(6)
% point Change over period
% of Fund onMay 31, 2010(6)
United States 19.4 5.4 24.8Australia 11.6 3.1 14.7France 10.5 0.7 11.2Spain 9.8 (1.3) 8.5China 8.8 (0.6) 8.2United Kingdom 3.8 2.8 6.6Canada 5.4 (0.2) 5.2Italy 5.0 (0.5) 4.5Germany 9.2 (5.5) 3.7Brazil 2.5 0.8 3.3
Global Infrastructure Index (“MGII”) due principally to the overweight exposure to non-US Dollar assets and the impact of leverage. In local currency terms, the equity components contributed to relative performance, led on the upside by the overweight position and stock
selection in Pipelines and Water, the overweight in Airports and Seaports and stock selection in the Electric Utility sector. The major detractors were the overweight positions in Toll Roads.
7
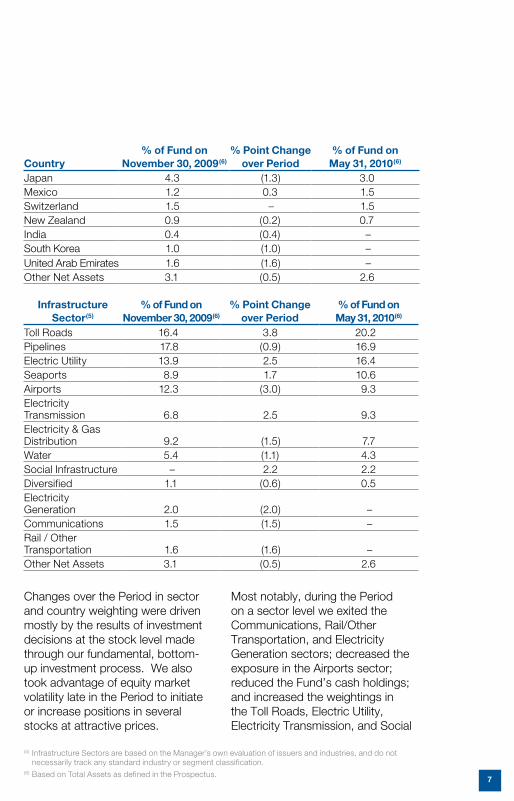
Changes over the Period in sector and country weighting were driven mostly by the results of investment decisions at the stock level made through our fundamental, bottom-up investment process. We also took advantage of equity market volatility late in the Period to initiate or increase positions in several stocks at attractive prices.
Most notably, during the Period on a sector level we exited the Communications, Rail/Other Transportation, and Electricity Generation sectors; decreased the exposure in the Airports sector; reduced the Fund’s cash holdings; and increased the weightings in the Toll Roads, Electric Utility, Electricity Transmission, and Social
Country% of Fund on
November 30, 2009(6)
% point Change over period
% of Fund onMay 31, 2010(6)
Japan 4.3 (1.3) 3.0Mexico 1.2 0.3 1.5Switzerland 1.5 – 1.5New Zealand 0.9 (0.2) 0.7India 0.4 (0.4) –South Korea 1.0 (1.0) –United Arab Emirates 1.6 (1.6) –Other Net Assets 3.1 (0.5) 2.6
Infrastructure Sector(5)
% of Fund on November 30, 2009(6)
% point Change over period
% of Fund on May 31, 2010(6)
Toll Roads 16.4 3.8 20.2Pipelines 17.8 (0.9) 16.9Electric Utility 13.9 2.5 16.4Seaports 8.9 1.7 10.6Airports 12.3 (3.0) 9.3Electricity Transmission 6.8 2.5 9.3Electricity & Gas Distribution 9.2 (1.5) 7.7Water 5.4 (1.1) 4.3Social Infrastructure – 2.2 2.2Diversified 1.1 (0.6) 0.5Electricity Generation 2.0 (2.0) –Communications 1.5 (1.5) –Rail / Other Transportation 1.6 (1.6) –Other Net Assets 3.1 (0.5) 2.6
(5) Infrastructure Sectors are based on the Manager’s own evaluation of issuers and industries, and do not necessarily track any standard industry or segment classification.
(6) Based on Total Assets as defined in the Prospectus.
8
Shareholder LetterMAy 31, 2010 (unaudited)
Infrastructure sectors. On a country level, we decreased Germany and increased the United States, Australia, and the United Kingdom.
Distributions
In each of December 2009 and March 2010, the Fund’s Board of Directors approved a regular quarterly distribution of $0.16 per share totaling $0.32 per share.
A portion of the distributions may be treated as paid from sources other than net income, including, but not limited to, short-term capital gain, long-term capital gain and return of capital. The final determination of the source of all distributions in 2010, including the percentage of qualified dividend income, will be made after the Fund’s year-end.
Based on the Fund’s NAV of $16.21 and closing market price of $13.30 on May 28, 2010 (the last US business day in the Period), the most recent $0.16 per share distribution represents an annualized distribution rate of 3.9% on NAV and 4.8% on market price.
Outlook
The global economic recovery continues to develop, with growth led by Asia followed by the United States, while Europe lags. Uncertainty over the European sovereign debt and fiscal situation remains. These markets are likely to remain vigilant and will continue to look for signs that policy makers can make significant progress.
We believe, many of MGU’s holdings have organic growth opportunities through investments that we expect will provide attractive returns and enhance earnings over time. Furthermore, the infrastructure sector on an operational level has generally continued to perform strongly over the Period. Overall, we continue to see resilient infrastructure earnings. Combined with these factors, the equity market sell-off toward the end of the Period created a number of attractive investment opportunities for the Fund, with such businesses well positioned in the current uncertain environment.
In our view, the Fund holds strategically well positioned, high quality infrastructure stocks and is well balanced with holdings in both the user demand and regulated/contracted sectors.
9
Board and portfolio Manager Changes
As previously announced in April 2010, Jon Fitch retired from serving as Chief Executive Officer (“CEO”) and Co-Portfolio Manager of MGU on May 31, 2010. The Fund’s Board of Directors appointed Brad Frishberg as the new CEO, effective May 31, 2010.
Also as a result of Mr. Fitch’s retirement, Andrew Maple-Brown became the sole Portfolio Manager of the Fund effective June 1, 2010. Mr. Maple-Brown is supported by Macquarie Funds Group’s Infrastructure Securities team, which is one of the largest and most experienced investment teams specializing in the listed infrastructure sector.
In April, 2010 Sally Warrall relocated back to Australia. As a result, the Board of Directors appointed Brett Byrd, Senior Vice President at Macquarie Funds Group, as the new Chief Compliance Officer.
Conclusion
The Fund’s investment strategy is to invest in the listed securities of companies globally that own and/or operate infrastructure assets that provide essential services, have strong strategic positions, and are well positioned to generate sustainable and growing cash flow streams.
We believe that MGU provides investors with an attractive vehicle to access the broad global universe of listed infrastructure securities. We continue to appreciate your investment in the Fund.
For any questions or comments you may have, please call us at 1-800-910-1434 or visit us online at www.macquarie.com/mgu.
Yours sincerely,
Andrew Maple-BrownPortfolio Manager
10
Schedule of InvestmentsMAy 31, 2010 (unaudited)(Expressed in U.S. Dollars)
Description Shares Value $
See Notes to Financial Statements.
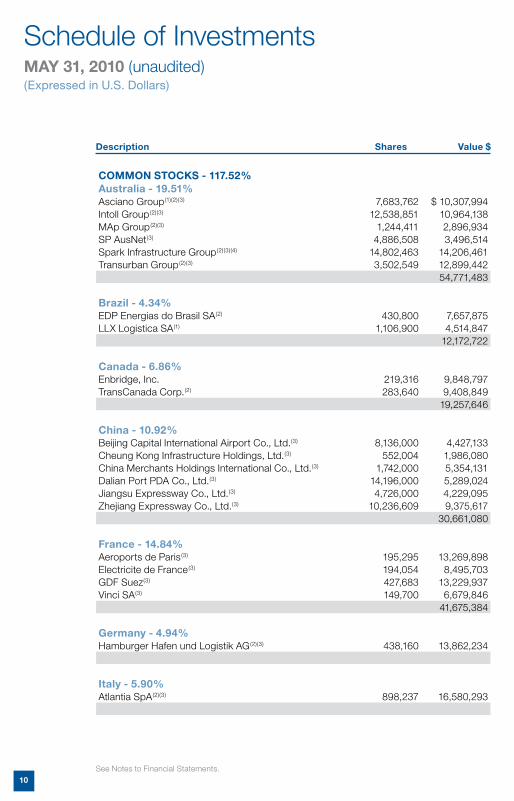
COMMON STOCKS - 117.52%Australia - 19.51%Asciano Group(1)(2)(3) 7,683,762 $ 10,307,994Intoll Group(2)(3) 12,538,851 10,964,138MAp Group(2)(3) 1,244,411 2,896,934SP AusNet(3) 4,886,508 3,496,514Spark Infrastructure Group(2)(3)(4) 14,802,463 14,206,461Transurban Group(2)(3) 3,502,549 12,899,442
54,771,483
Brazil - 4.34%EDP Energias do Brasil SA(2) 430,800 7,657,875LLX Logistica SA(1) 1,106,900 4,514,847
12,172,722
Canada - 6.86%Enbridge, Inc. 219,316 9,848,797TransCanada Corp.(2) 283,640 9,408,849
19,257,646
China - 10.92%Beijing Capital International Airport Co., Ltd.(3) 8,136,000 4,427,133Cheung Kong Infrastructure Holdings, Ltd.(3) 552,004 1,986,080China Merchants Holdings International Co., Ltd.(3) 1,742,000 5,354,131Dalian Port PDA Co., Ltd.(3) 14,196,000 5,289,024Jiangsu Expressway Co., Ltd.(3) 4,726,000 4,229,095Zhejiang Expressway Co., Ltd.(3) 10,236,609 9,375,617
30,661,080
France - 14.84%Aeroports de Paris(3) 195,295 13,269,898Electricite de France(3) 194,054 8,495,703GDF Suez(3) 427,683 13,229,937Vinci SA(3) 149,700 6,679,846
41,675,384
Germany - 4.94%Hamburger Hafen und Logistik AG(2)(3) 438,160 13,862,234
Italy - 5.90%Atlantia SpA(2)(3) 898,237 16,580,293
11See Notes to Financial Statements.
Description Shares Value $
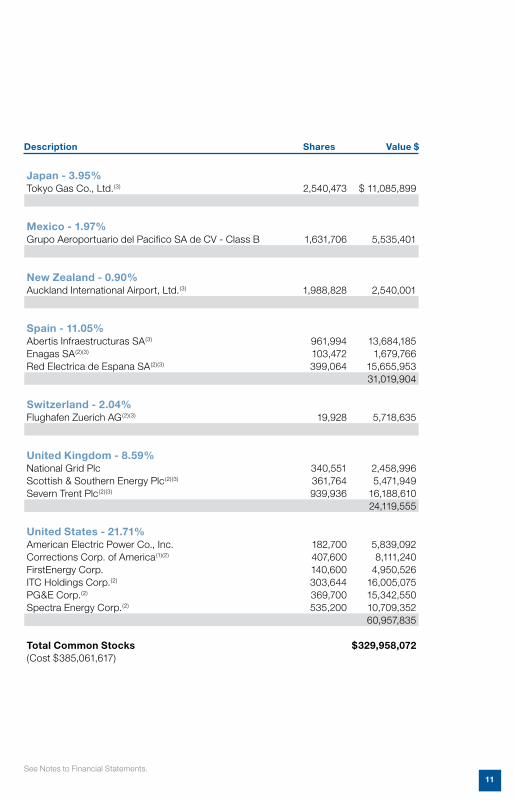
Japan - 3.95%Tokyo Gas Co., Ltd.(3) 2,540,473 $ 11,085,899
Mexico - 1.97%Grupo Aeroportuario del Pacifico SA de CV - Class B 1,631,706 5,535,401
New Zealand - 0.90%Auckland International Airport, Ltd.(3) 1,988,828 2,540,001
Spain - 11.05%Abertis Infraestructuras SA(3) 961,994 13,684,185Enagas SA(2)(3) 103,472 1,679,766Red Electrica de Espana SA(2)(3) 399,064 15,655,953
31,019,904
Switzerland - 2.04%Flughafen Zuerich AG(2)(3) 19,928 5,718,635
United Kingdom - 8.59%National Grid Plc 340,551 2,458,996Scottish & Southern Energy Plc(2)(3) 361,764 5,471,949Severn Trent Plc(2)(3) 939,936 16,188,610
24,119,555
United States - 21.71%American Electric Power Co., Inc. 182,700 5,839,092Corrections Corp. of America(1)(2) 407,600 8,111,240FirstEnergy Corp. 140,600 4,950,526ITC Holdings Corp.(2) 303,644 16,005,075PG&E Corp.(2) 369,700 15,342,550Spectra Energy Corp.(2) 535,200 10,709,352
60,957,835
Total Common Stocks $329,958,072(Cost $385,061,617)
12
Schedule of InvestmentsMAy 31, 2010 (unaudited)(Expressed in U.S. Dollars)
See Notes to Financial Statements.
Description Shares Value $
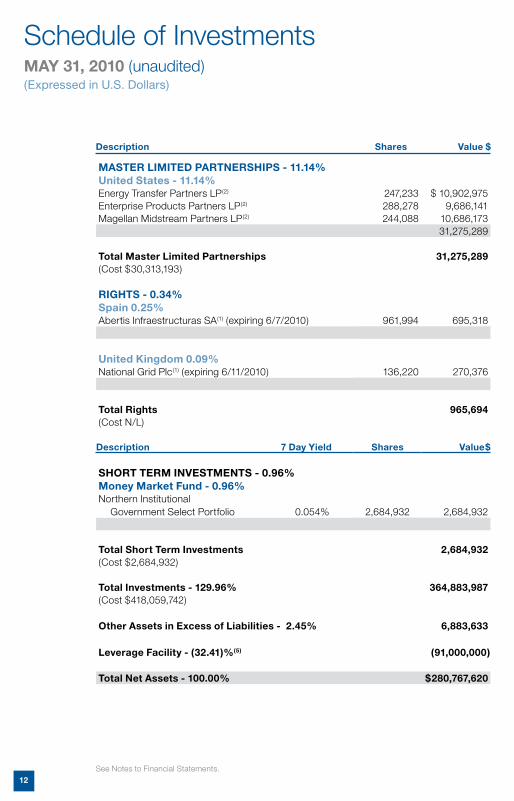
MASTER LIMITED pARTNERSHIpS - 11.14%United States - 11.14%Energy Transfer Partners LP(2) 247,233 $ 10,902,975Enterprise Products Partners LP(2) 288,278 9,686,141Magellan Midstream Partners LP(2) 244,088 10,686,173
31,275,289
Total Master Limited partnerships 31,275,289(Cost $30,313,193)
RIGHTS - 0.34%Spain 0.25%Abertis Infraestructuras SA(1) (expiring 6/7/2010) 961,994 695,318
United Kingdom 0.09%National Grid Plc(1) (expiring 6/11/2010) 136,220 270,376
Total Rights 965,694(Cost N/L)
Description 7 Day yield Shares Value$
SHORT TERM INVESTMENTS - 0.96%Money Market Fund - 0.96%Northern Institutional
Government Select Portfolio 0.054% 2,684,932 2,684,932
Total Short Term Investments 2,684,932(Cost $2,684,932)
Total Investments - 129.96% 364,883,987(Cost $418,059,742)
Other Assets in Excess of Liabilities - 2.45% 6,883,633
Leverage Facility - (32.41)%(5) (91,000,000)
Total Net Assets - 100.00% $280,767,620
13
SWAp AGREEMENT(6):
Interest Rate Swap Counterparty
Notional Amount
Fixed Rate paid
by the Fund
Floating Rate Received by the Fund (7)
Floating Rate Index
Termination Date
Unrealized Depreciation
% of Net
Assets
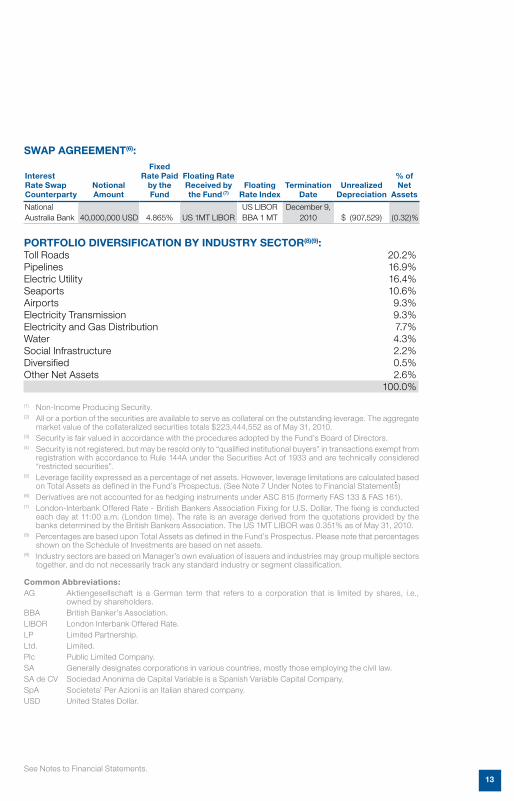
National Australia Bank 40,000,000 USD 4.865% US 1MT LIBOR
US LIBOR BBA 1 MT
December 9, 2010 $ (907,529) (0.32)%
pORTFOLIO DIVERSIFICATION By INDUSTRy SECTOR(8)(9):Toll Roads 20.2%Pipelines 16.9%Electric Utility 16.4%Seaports 10.6%Airports 9.3%Electricity Transmission 9.3%Electricity and Gas Distribution 7.7%Water 4.3%Social Infrastructure 2.2%Diversified 0.5%Other Net Assets 2.6% 100.0%
(1) Non-Income Producing Security.(2) All or a portion of the securities are available to serve as collateral on the outstanding leverage. The aggregate
market value of the collateralized securities totals $223,444,552 as of May 31, 2010.(3) Security is fair valued in accordance with the procedures adopted by the Fund’s Board of Directors.(4) Security is not registered, but may be resold only to “qualified institutional buyers” in transactions exempt from
registration with accordance to Rule 144A under the Securities Act of 1933 and are technically considered “restricted securities”.
(5) Leverage facility expressed as a percentage of net assets. However, leverage limitations are calculated based on Total Assets as defined in the Fund’s Prospectus. (See Note 7 Under Notes to Financial Statements)
(6) Derivatives are not accounted for as hedging instruments under ASC 815 (formerly FAS 133 & FAS 161).(7) London-Interbank Offered Rate - British Bankers Association Fixing for U.S. Dollar. The fixing is conducted
each day at 11:00 a.m. (London time). The rate is an average derived from the quotations provided by the banks determined by the British Bankers Association. The US 1MT LIBOR was 0.351% as of May 31, 2010.
(8) Percentages are based upon Total Assets as defined in the Fund’s Prospectus. Please note that percentages shown on the Schedule of Investments are based on net assets.
(9) Industry sectors are based on Manager’s own evaluation of issuers and industries may group multiple sectors together, and do not necessarily track any standard industry or segment classification.
Common Abbreviations:AG Aktiengesellschaft is a German term that refers to a corporation that is limited by shares, i.e.,
owned by shareholders.BBA British Banker’s Association.LIBOR London Interbank Offered Rate.LP Limited Partnership.Ltd. Limited.Plc Public Limited Company.SA Generally designates corporations in various countries, mostly those employing the civil law.SA de CV Sociedad Anonima de Capital Variable is a Spanish Variable Capital Company.SpA Societeta’ Per Azioni is an Italian shared company.USD United States Dollar.
See Notes to Financial Statements.
14
Statement of Assets and Liabilities MAy 31, 2010 (unaudited)(Expressed in U.S. Dollars)
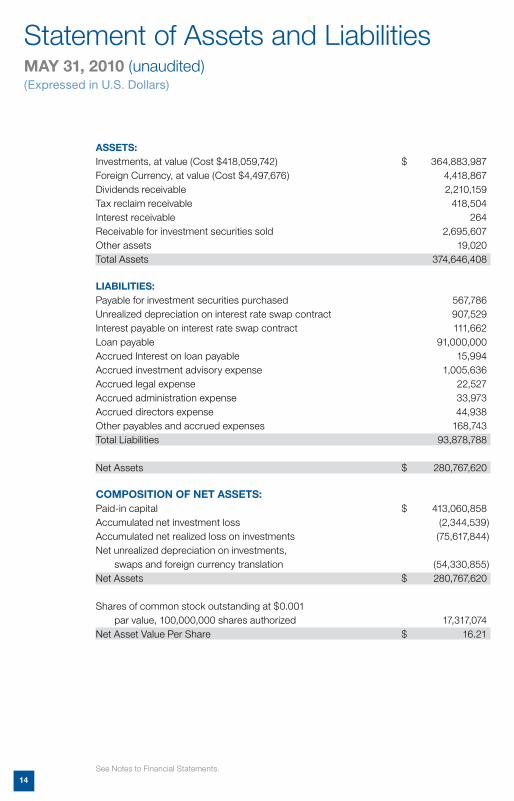
ASSETS:Investments, at value (Cost $418,059,742) $ 364,883,987 Foreign Currency, at value (Cost $4,497,676) 4,418,867Dividends receivable 2,210,159 Tax reclaim receivable 418,504Interest receivable 264Receivable for investment securities sold 2,695,607Other assets 19,020Total Assets 374,646,408 LIABILITIES:Payable for investment securities purchased 567,786Unrealized depreciation on interest rate swap contract 907,529Interest payable on interest rate swap contract 111,662 Loan payable 91,000,000Accrued Interest on loan payable 15,994Accrued investment advisory expense 1,005,636Accrued legal expense 22,527Accrued administration expense 33,973Accrued directors expense 44,938Other payables and accrued expenses 168,743Total Liabilities 93,878,788
Net Assets $ 280,767,620
COMpOSITION OF NET ASSETS:Paid-in capital $ 413,060,858Accumulated net investment loss (2,344,539)Accumulated net realized loss on investments (75,617,844)Net unrealized depreciation on investments, swaps and foreign currency translation (54,330,855)Net Assets $ 280,767,620
Shares of common stock outstanding at $0.001 par value, 100,000,000 shares authorized 17,317,074Net Asset Value Per Share $ 16.21
See Notes to Financial Statements.
15
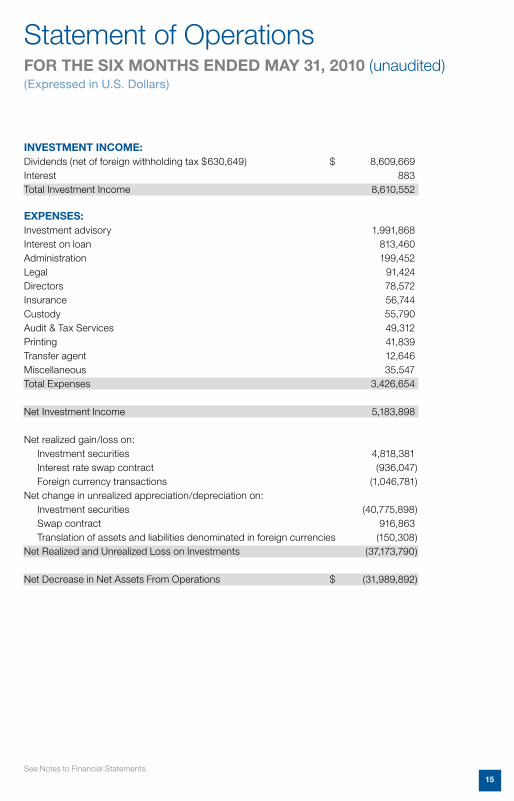
Statement of OperationsFOR THE SIX MONTHS ENDED MAy 31, 2010 (unaudited)(Expressed in U.S. Dollars)
INVESTMENT INCOME: Dividends (net of foreign withholding tax $630,649) $ 8,609,669Interest 883Total Investment Income 8,610,552 EXpENSES: Investment advisory 1,991,868Interest on loan 813,460Administration 199,452Legal 91,424Directors 78,572Insurance 56,744Custody 55,790Audit & Tax Services 49,312Printing 41,839Transfer agent 12,646Miscellaneous 35,547Total Expenses 3,426,654
Net Investment Income 5,183,898 Net realized gain/loss on: Investment securities 4,818,381 Interest rate swap contract (936,047) Foreign currency transactions (1,046,781)Net change in unrealized appreciation/depreciation on: Investment securities (40,775,898) Swap contract 916,863 Translation of assets and liabilities denominated in foreign currencies (150,308)Net Realized and Unrealized Loss on Investments (37,173,790)
Net Decrease in Net Assets From Operations $ (31,989,892)
See Notes to Financial Statements.
16See Notes to Financial Statements.
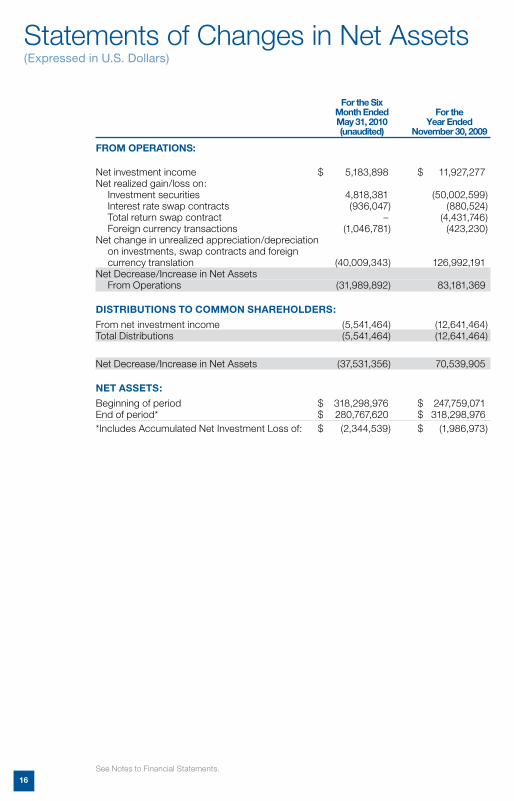
Statements of Changes in Net Assets(Expressed in U.S. Dollars)
For the Six Month Ended For the May 31, 2010 year Ended (unaudited) November 30, 2009
FROM OpERATIONS: Net investment income $ 5,183,898 $ 11,927,277Net realized gain/loss on: Investment securities 4,818,381 (50,002,599) Interest rate swap contracts (936,047) (880,524) Total return swap contract – (4,431,746) Foreign currency transactions (1,046,781) (423,230)Net change in unrealized appreciation/depreciation on investments, swap contracts and foreign currency translation (40,009,343) 126,992,191Net Decrease/Increase in Net Assets From Operations (31,989,892) 83,181,369 DISTRIBUTIONS TO COMMON SHAREHOLDERS: From net investment income (5,541,464) (12,641,464)Total Distributions (5,541,464) (12,641,464)
Net Decrease/Increase in Net Assets (37,531,356) 70,539,905 NET ASSETS: Beginning of period $ 318,298,976 $ 247,759,071End of period* $ 280,767,620 $ 318,298,976*Includes Accumulated Net Investment Loss of: $ (2,344,539) $ (1,986,973)
17See Notes to Financial Statements.
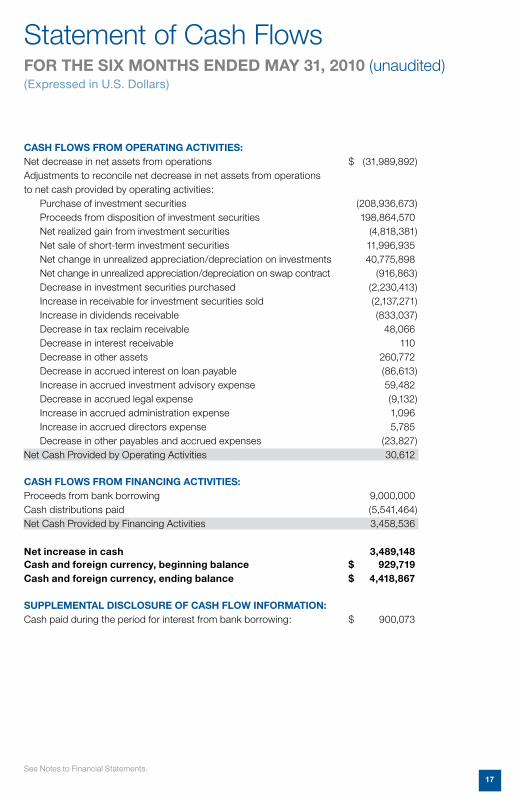
Statement of Cash FlowsFOR THE SIX MONTHS ENDED MAy 31, 2010 (unaudited)(Expressed in U.S. Dollars)
CASH FLOWS FROM OpERATING ACTIVITIES:Net decrease in net assets from operations $ (31,989,892)Adjustments to reconcile net decrease in net assets from operations to net cash provided by operating activities: Purchase of investment securities (208,936,673) Proceeds from disposition of investment securities 198,864,570 Net realized gain from investment securities (4,818,381) Net sale of short-term investment securities 11,996,935 Net change in unrealized appreciation/depreciation on investments 40,775,898 Net change in unrealized appreciation/depreciation on swap contract (916,863) Decrease in investment securities purchased (2,230,413) Increase in receivable for investment securities sold (2,137,271) Increase in dividends receivable (833,037) Decrease in tax reclaim receivable 48,066 Decrease in interest receivable 110 Decrease in other assets 260,772 Decrease in accrued interest on loan payable (86,613) Increase in accrued investment advisory expense 59,482 Decrease in accrued legal expense (9,132) Increase in accrued administration expense 1,096 Increase in accrued directors expense 5,785 Decrease in other payables and accrued expenses (23,827)Net Cash Provided by Operating Activities 30,612 CASH FLOWS FROM FINANCING ACTIVITIES: Proceeds from bank borrowing 9,000,000Cash distributions paid (5,541,464)Net Cash Provided by Financing Activities 3,458,536 Net increase in cash 3,489,148Cash and foreign currency, beginning balance $ 929,719Cash and foreign currency, ending balance $ 4,418,867 SUppLEMENTAL DISCLOSURE OF CASH FLOW INFORMATION: Cash paid during the period for interest from bank borrowing: $ 900,073
18
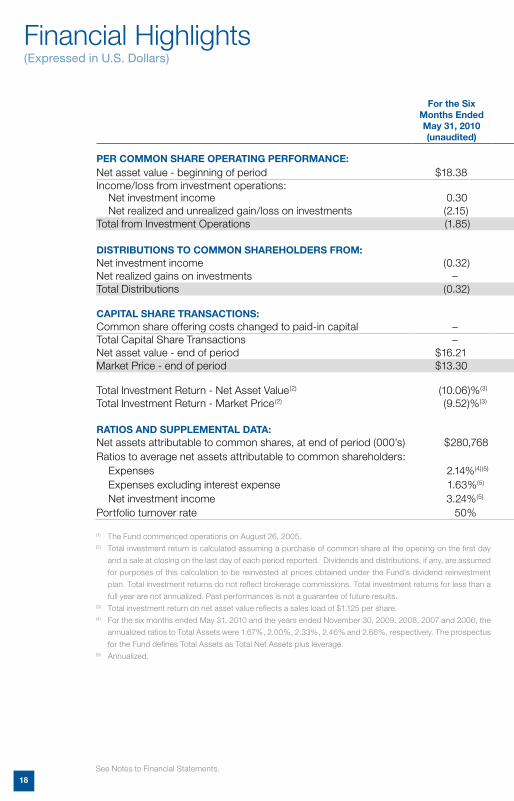
Financial Highlights(Expressed in U.S. Dollars)
For the Six Months Ended May 31, 2010 (unaudited)
For the years Ended November 30, For the period
August 26, 2005 to November 30,
2005(1)2009 2008 2007 2006
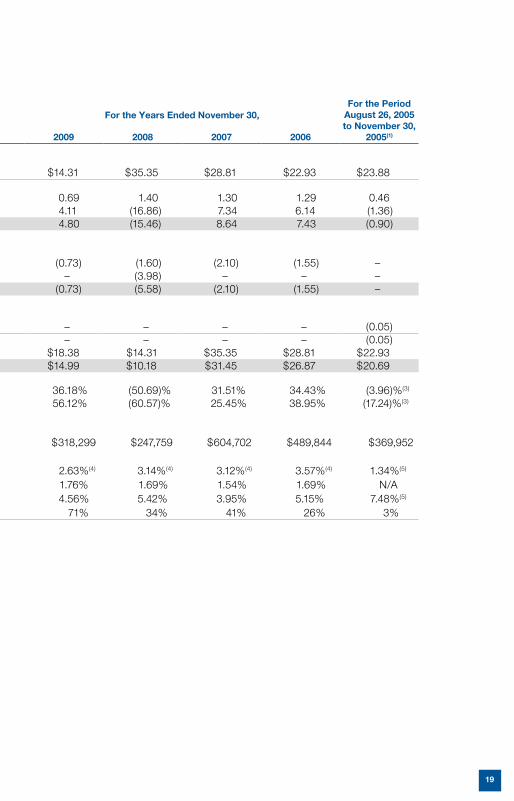
pER COMMON SHARE OpERATING pERFORMANCE:Net asset value - beginning of period $18.38 $14.31 $35.35 $28.81 $22.93 $23.88Income/loss from investment operations: Net investment income 0.30 0.69 1.40 1.30 1.29 0.46 Net realized and unrealized gain/loss on investments (2.15) 4.11 (16.86) 7.34 6.14 (1.36)Total from Investment Operations (1.85) 4.80 (15.46) 8.64 7.43 (0.90)
DISTRIBUTIONS TO COMMON SHAREHOLDERS FROM:Net investment income (0.32) (0.73) (1.60) (2.10) (1.55) –Net realized gains on investments – – (3.98) – – –Total Distributions (0.32) (0.73) (5.58) (2.10) (1.55) –
CApITAL SHARE TRANSACTIONS: Common share offering costs changed to paid-in capital – – – – – (0.05)Total Capital Share Transactions – – – – – (0.05)Net asset value - end of period $16.21 $18.38 $14.31 $35.35 $28.81 $22.93Market Price - end of period $13.30 $14.99 $10.18 $31.45 $26.87 $20.69
Total Investment Return - Net Asset Value(2) (10.06)%(3) 36.18% (50.69)% 31.51% 34.43% (3.96)%(3)
Total Investment Return - Market Price(2) (9.52)%(3) 56.12% (60.57)% 25.45% 38.95% (17.24)%(3)
RATIOS AND SUppLEMENTAL DATA:Net assets attributable to common shares, at end of period (000’s) $280,768 $318,299 $247,759 $604,702 $489,844 $369,952Ratios to average net assets attributable to common shareholders: Expenses 2.14%(4)(5) 2.63%(4) 3.14%(4) 3.12%(4) 3.57%(4) 1.34%(5)
Expenses excluding interest expense 1.63%(5) 1.76% 1.69% 1.54% 1.69% N/A Net investment income 3.24%(5) 4.56% 5.42% 3.95% 5.15% 7.48%(5)
Portfolio turnover rate 50% 71% 34% 41% 26% 3%
(1) The Fund commenced operations on August 26, 2005.(2) Total investment return is calculated assuming a purchase of common share at the opening on the first day
and a sale at closing on the last day of each period reported. Dividends and distributions, if any, are assumed
for purposes of this calculation to be reinvested at prices obtained under the Fund’s dividend reinvestment
plan. Total investment returns do not reflect brokerage commissions. Total investment returns for less than a
full year are not annualized. Past performances is not a guarantee of future results.(3) Total investment return on net asset value reflects a sales load of $1.125 per share.(4) For the six months ended May 31, 2010 and the years ended November 30, 2009, 2008, 2007 and 2006, the
annualized ratios to Total Assets were 1.67%, 2.00%, 2.33%, 2.46% and 2.66%, respectively. The prospectus
for the Fund defines Total Assets as Total Net Assets plus leverage.(5) Annualized.
See Notes to Financial Statements.
19
For the Six Months Ended May 31, 2010 (unaudited)
For the years Ended November 30, For the period
August 26, 2005 to November 30,
2005(1)2009 2008 2007 2006
pER COMMON SHARE OpERATING pERFORMANCE:Net asset value - beginning of period $18.38 $14.31 $35.35 $28.81 $22.93 $23.88Income/loss from investment operations: Net investment income 0.30 0.69 1.40 1.30 1.29 0.46 Net realized and unrealized gain/loss on investments (2.15) 4.11 (16.86) 7.34 6.14 (1.36)Total from Investment Operations (1.85) 4.80 (15.46) 8.64 7.43 (0.90)
DISTRIBUTIONS TO COMMON SHAREHOLDERS FROM:Net investment income (0.32) (0.73) (1.60) (2.10) (1.55) –Net realized gains on investments – – (3.98) – – –Total Distributions (0.32) (0.73) (5.58) (2.10) (1.55) –
CApITAL SHARE TRANSACTIONS: Common share offering costs changed to paid-in capital – – – – – (0.05)Total Capital Share Transactions – – – – – (0.05)Net asset value - end of period $16.21 $18.38 $14.31 $35.35 $28.81 $22.93Market Price - end of period $13.30 $14.99 $10.18 $31.45 $26.87 $20.69
Total Investment Return - Net Asset Value(2) (10.06)%(3) 36.18% (50.69)% 31.51% 34.43% (3.96)%(3)
Total Investment Return - Market Price(2) (9.52)%(3) 56.12% (60.57)% 25.45% 38.95% (17.24)%(3)
RATIOS AND SUppLEMENTAL DATA:Net assets attributable to common shares, at end of period (000’s) $280,768 $318,299 $247,759 $604,702 $489,844 $369,952Ratios to average net assets attributable to common shareholders: Expenses 2.14%(4)(5) 2.63%(4) 3.14%(4) 3.12%(4) 3.57%(4) 1.34%(5)
Expenses excluding interest expense 1.63%(5) 1.76% 1.69% 1.54% 1.69% N/A Net investment income 3.24%(5) 4.56% 5.42% 3.95% 5.15% 7.48%(5)
Portfolio turnover rate 50% 71% 34% 41% 26% 3%
(1) The Fund commenced operations on August 26, 2005.(2) Total investment return is calculated assuming a purchase of common share at the opening on the first day
and a sale at closing on the last day of each period reported. Dividends and distributions, if any, are assumed
for purposes of this calculation to be reinvested at prices obtained under the Fund’s dividend reinvestment
plan. Total investment returns do not reflect brokerage commissions. Total investment returns for less than a
full year are not annualized. Past performances is not a guarantee of future results.(3) Total investment return on net asset value reflects a sales load of $1.125 per share.(4) For the six months ended May 31, 2010 and the years ended November 30, 2009, 2008, 2007 and 2006, the
annualized ratios to Total Assets were 1.67%, 2.00%, 2.33%, 2.46% and 2.66%, respectively. The prospectus
for the Fund defines Total Assets as Total Net Assets plus leverage.(5) Annualized.
20
Notes to Financial StatementsMAy 31, 2010 (unaudited)
1. Organization and Significant Accounting policies
Macquarie Global Infrastructure Total Return Fund Inc. (“MGU” or the “Fund”) is a non-diversified, closed-end investment management company registered under the Investment Company Act of 1940 and organized under the laws of the State of Maryland. The Fund’s investment objective is to provide to its common stockholders a high level of total return consisting of dividends and other income, and capital appreciation. The Fund commenced operations on August 26, 2005. The Fund had no operations prior to August 26, 2005 except for the sale of shares to Macquarie Capital Investment Management LLC (“MCIM” or the “Manager”) (formerly named Macquarie Fund Adviser, LLC). The Fund’s common shares are listed on the New York Stock Exchange (“NYSE”) under the ticker “MGU”.
The Fund has elements of risk, including the risk of loss of principal. There is no assurance that the investment process will consistently lead to successful results. An investment concentrated in sectors and industries may involve greater risk and volatility than a more diversified investment.
The Fund’s financial statements are prepared in accordance with accounting principles generally accepted in the United States of
America (“GAAP”). This requires management to make estimates and assumptions that affect the reported amounts of assets and liabilities and disclosure of contingent assets and liabilities at the date of the financial statements and the reported amounts of increases and decreases in net assets from operations during the reporting period. Actual results could differ from these estimates.
The following summarizes the significant accounting policies of the Fund.
Cash and Cash Equivalents: Cash equivalents are funds (proceeds) temporarily invested in original maturities of ninety days or less.
Restricted Cash: As of May 31, 2010, the Fund did not classify funds (proceeds) as restricted.
portfolio Valuation: The net asset value (“NAV”) of the common shares will be computed based upon the value of the securities and other assets and liabilities held by the Fund. The NAV is determined as of the close of regular trading on the NYSE (normally 4:00 p.m. Eastern Standard Time) on each day the NYSE is open for trading. U.S. debt securities and non-U.S. securities will normally be priced using data reflecting the earlier closing of the principal markets for those securities (subject to the fair value policies described below).
21
Readily marketable portfolio securities listed on any U.S. exchange other than the NASDAQ National Market are valued, except as indicated below, at the last sale price on the business day as of which such value is being determined, or if no sale price, at the mean of the most recent bid and asked prices on such day. Securities admitted to trade on the NASDAQ National Market are valued at the NASDAQ official closing price as determined by NASDAQ. Securities traded on more than one securities exchange are valued at the last sale price on the business day as of which such value is being determined at the close of the exchange representing the principal market for such securities. U.S. equity securities traded in the over-the-counter market, but excluding securities admitted to trading on the NASDAQ National Market, are valued at the closing bid prices.
Non-U.S. exchange-listed securities will generally be valued using information provided by an independent third party pricing service. The official non-U.S. security price is determined using the last sale price at the official close of the security’s respective non-U.S. market, which is usually different from the close of the NYSE. Occasionally, events affecting the value of such securities may occur between such times and the close of NYSE that will not always be reflected in the computation of the value of such
securities. If events materially affecting the value of such securities occur during such period, these securities will be valued at their fair value according to the procedures adopted by the Fund’s Board of Directors. Although there are observable inputs assigned on security level, prices are derived from factors using Interactive Data Corporation’s (“IDC”) Fair Value Information Service (“FVIS”) model. For this reason, significant events will cause movements between Level 1 and Level 2 (see detailed description of inputs and levels on the next page). Non-U.S. securities, currencies and other assets denominated in non-U.S. currencies are translated into U.S. Dollars at the exchange rate of such currencies against the U.S. Dollar as provided by a pricing service. When price quotes are not available, fair market value may be based on prices of comparable securities.
Forward currency exchange contracts are valued by calculating the mean between the last bid and asked quotation supplied to a pricing service by certain independent dealers in such contracts. Non-U.S. traded forward currency contracts are valued using the same method as the U.S. traded contracts. Exchange traded options and futures contracts are valued at the closing price in the market where such contracts are principally traded. These contracts may involve market risk in excess of the unrealized gain or loss reflected in the Fund’s Statement of Assets & Liabilities. In addition, the Fund
22
could be exposed to risk if the counterparties are unable to meet the terms of the contract or if the value of the currencies changes unfavorably to the U.S. Dollar.
In the event that the pricing service cannot or does not provide a valuation for a particular security, or such valuation is deemed unreliable, especially with unlisted securities or instruments, fair value is determined by the Valuation committee comprised of the Board of Directors or a designee of the Board. In fair valuing the Fund’s investments, consideration is given to several factors, which may include, among others, the following:
• the projected cash flows for the issuer;
• the fundamental business data relating to the issuer;
• an evaluation of the forces that influence the market in which these securities are purchased and sold;
• the type, size and cost of holding;
• the financial statements of the issuer;
• the credit quality and cash flow of the issuer, based on the Manager’s or external analysis;
• the information as to any transactions in or offers for the holding;
• the price and extent of public trading in similar securities (or equity securities) of the issuer, or comparable companies;
• the business prospects of the
issuer/ borrower, including any ability to obtain money or resources from a parent or affiliate and an assessment of the issuer’s or borrower’s management; and
• the prospects for the issuer’s or borrower’s industry, and multiples (of earnings and/or cash flow) being paid for similar businesses in that industry.
Fair Value Measurements: In September 2006, the Financial Accounting Standards Board (“FASB”) issued “Fair Value Measurements and Disclosures” (“Fair Value Statement” or “ASC 820.10.5,” formerly FAS 157) effective for fiscal years beginning after November 15, 2007. The Fair Value Statement defines fair value, establishes a framework for measuring fair value in GAAP, and expands disclosures about fair value measurements. The Fund adopted the Fair Value Statement as of the beginning of its fiscal year on December 1, 2008. Under the Fair Value Statement, various inputs are used in determining the value of the Fund’s investments.
In accordance with GAAP, the Fund uses a three-tier hierarchy to establish classification of fair value measurements for disclosure purposes. Inputs refer broadly to the assumptions that market participants would use in pricing the asset or liability, including assumptions about risk. Inputs may be observable or unobservable. Observable
Notes to Financial StatementsMAy 31, 2010 (unaudited)
23
inputs are inputs that reflect the assumptions market participants would use in pricing the asset or liability that are developed based on market data obtained from sources independent of the reporting entity. Unobservable inputs are inputs that reflect the reporting entity’s own assumptions about the assumptions market participants would use in pricing the asset or liability that are developed based on the best information available.
Level 1—Unadjusted quoted prices in active markets for identical assets or liabilities that the Fund has the ability to access.
Level 2—Observable inputs other than quoted prices included in level 1 that are observable for the asset or liability, either directly or indirectly. These inputs may include quoted prices for the identical instrument on an inactive market, prices for similar instruments, interest rates, prepayment speeds, credit risk, yield curves, default rates and similar data.
Level 3—Unobservable inputs for the asset or liability, to the extent relevant observable inputs are not available; representing the Fund’s own assumptions about the assumptions a market participant would use in valuing the asset or liability, and would be based on the best information available.
The availability of observable inputs can vary from security to security and is affected by a wide variety of factors, including, for example, the type of security, whether the security is new and not yet established in the marketplace, the liquidity of markets, and other characteristics particular to the security. To the extent that valuation is based on models or inputs that are less observable or unobservable in the market, the determination of fair value requires more judgment. Accordingly, the degree of judgment exercised in determining fair value is greatest for instruments categorized in Level 3.
The inputs used to measure fair value may fall into different levels of the fair value hierarchy. In such cases, for disclosure purposes, the level in the fair value hierarchy within which the fair value measurement falls in its entirety, is determined based on the lowest level input that is significant to the fair value measurement in its entirety.
Various inputs are used in determining the value of the Fund’s investments as of the reporting period end. The designated input levels are not necessarily an indication of the risk or liquidity associated with these investments.
The valuation techniques used by the Fund to measure fair value during the six months ended May 31, 2010 maximized the use of observable inputs and minimized the use of unobservable inputs.
24
In January, 2010, FASB issued “Improving Disclosures about Fair Value Measurements Update” (“ASU 2010-06”, or “Update”) which amends ASC 820.10.5, formerly FAS 157, effective for the annual periods beginning after December 15, 2009. The Fund has adopted ASU 2010-06 during the semi-annual period ending May 31, 2010. This Update applies to Fund’s disclosures for transfers in and out of Level 1 and Level 2 of the fair value hierarchy and the reasons for the transfers as well as to disclosures about the valuation techniques and inputs used to measure fair value for investments that fall in either Level 2 or Level 3 of the fair value hierarchy. This Update excludes disclosures for transfers triggered by fair valuation derived from the fair value pricing models.
At May 31, 2010 certain non-U.S. exchange listed securities were fair valued using IDC’s FVIS model that caused a significant movement
between Level 1 and Level 2 fair value tiers.
Foreign Currency Translation:The accounting records of the Fund are maintained in U.S. Dollars. Prices of securities and other assets and liabilities denominated in non-U.S. currencies are translated into U.S. Dollars using the exchange rate at 4:00 p.m., Eastern Standard Time. Amounts related to the purchases and sales of securities, investment income and expenses are translated at the rates of exchange prevailing on the respective dates of such transactions.
Net realized gain or loss on foreign currency transactions represents net foreign exchange gains or losses from the closure of forward currency contracts, disposition of foreign currencies, currency gains or losses realized between the trade and settlement dates
Notes to Financial StatementsMAy 31, 2010 (unaudited)
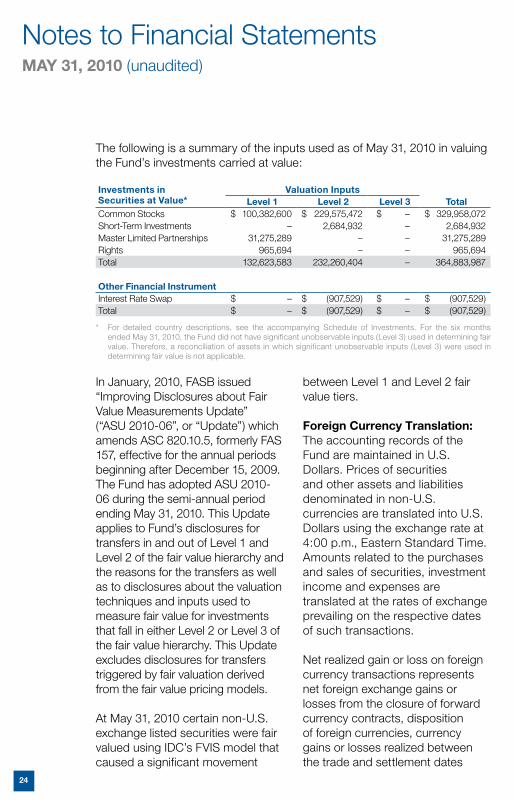
The following is a summary of the inputs used as of May 31, 2010 in valuing the Fund’s investments carried at value:
Investments in Securities at Value*
Valuation Inputs Total Level 1 Level 2 Level 3
Common Stocks $ 100,382,600 $ 229,575,472 $ – $ 329,958,072Short-Term Investments – 2,684,932 – 2,684,932Master Limited Partnerships 31,275,289 – – 31,275,289Rights 965,694 – – 965,694Total 132,623,583 232,260,404 – 364,883,987
Other Financial InstrumentInterest Rate Swap $ – $ (907,529) $ – $ (907,529)Total $ – $ (907,529) $ – $ (907,529)
* For detailed country descriptions, see the accompanying Schedule of Investments. For the six months ended May 31, 2010, the Fund did not have significant unobservable inputs (Level 3) used in determining fair value. Therefore, a reconciliation of assets in which significant unobservable inputs (Level 3) were used in determining fair value is not applicable.
25
on security transactions and the difference between the amount of dividends, interest and foreign withholding taxes recorded on the Fund’s books and the U.S. Dollar equivalent amount actually received or paid. Net unrealized currency gains and losses arising from valuing foreign currency denominated assets and liabilities, other than security investments, at the current exchange rate are reflected as part of unrealized appreciation/depreciation on foreign currency translation.
The Fund does not isolate that portion of the results of operations arising as a result of changes in the foreign exchange rates from the changes in the market prices of securities held at Period end. The Fund does not isolate the effect of changes in foreign exchange rates from changes in market prices of securities sold during the year. The Fund may invest in foreign securities and foreign currency transactions that may involve risks not associated with domestic investments as a result of the level of governmental supervision and regulation of foreign securities markets and the possibility of political or economic instability, among others.
Distributions to Shareholders: The Fund intends to distribute to holders of its common shares quarterly distributions of all or a portion of its net income and/ or realized gains after payment
of interest in connection with any leverage used by the Fund. Distributions to shareholders are recorded by the Fund on the ex-dividend date.
Income Taxes: The Fund’s policy is to comply with the provisions of the Internal Revenue Code applicable to regulated investment companies.
The Fund has qualified and intends to continue to qualify as a regulated investment company under Subchapter M of the Internal Revenue Code for federal income tax purposes and to distribute substantially all of its taxable income and net capital gains. Accordingly, no provision has been made for federal income taxes. Master limited partnerships, swaps, foreign currency, and certain other investments could create book tax differences that may have an impact on the character of the Fund’s distributions.
Securities Transactions and Investment Income: Investment security transactions are accounted for as of trade date. Dividend income is recorded on the ex-dividend date. Interest income, which includes amortization of premium and accretion of discount, is accrued as earned. Realized gains and losses from securities transactions are determined on the basis of identified cost for both financial reporting and income tax purposes.
26
Notes to Financial StatementsMAy 31, 2010 (unaudited)
Repurchase Agreements: Securities pledged as collateral for repurchase agreements are held by a custodian bank until the agreements mature. Each agreement requires the market value of the collateral to exceed payments of interest and principal. In the event of default by the other party to the agreement, retention of the collateral may be subject to legal proceedings. As of May 31, 2010, the Fund did not hold any repurchase agreements in its portfolio.
2. Income Taxes
The Fund adopted the provisions of Accounting for Uncertainty in Income Taxes (the “Income Tax Statement” or “ASC 740.10.25,” formerly FIN 48) on December 1, 2007. The Income Tax Statement requires an evaluation of tax positions taken (or expected to be taken) in the course of preparing a Fund’s tax returns to determine whether these positions meet a “more-likely-than not” standard that, based on the technical merits, have a more than fifty percent likelihood of being sustained by a taxing authority upon examination. A tax position that meets the “more-likely-than-not” recognition threshold is measured to determine the amount of benefit to recognize in the financial statements. The Fund recognizes interest and penalties, if any, related to unrecognized tax benefits as income tax expense in the Statement of Operations. The
Income Tax Statement requires management of the Fund to analyze all open tax years, fiscal years 2005-2009 as defined by IRS statute of limitations for all major jurisdictions, including federal tax authorities and certain state tax authorities. As of and during the year ended November 30, 2009, the Fund did not have a liability for any unrecognized tax benefits. The Fund has no examination in progress and is not aware of any tax positions for which it is reasonably possible that the total amounts of unrecognized tax benefits will significantly change in the next twelve months.
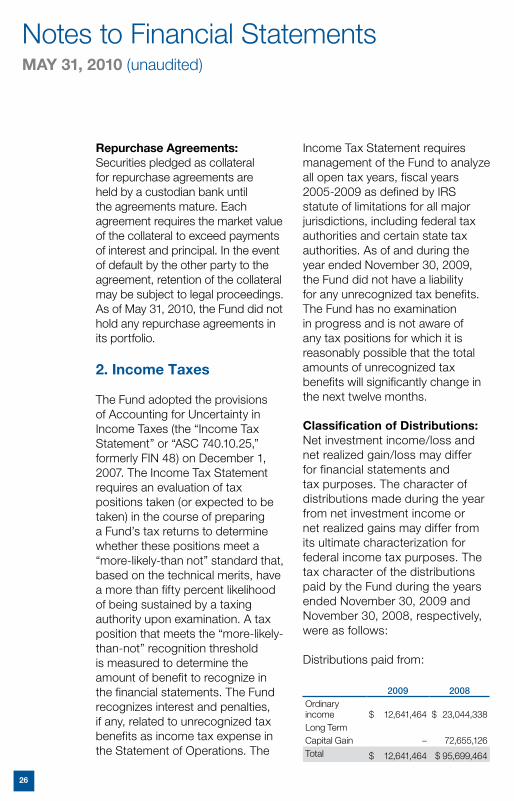
Classification of Distributions: Net investment income/loss and net realized gain/loss may differ for financial statements and tax purposes. The character of distributions made during the year from net investment income or net realized gains may differ from its ultimate characterization for federal income tax purposes. The tax character of the distributions paid by the Fund during the years ended November 30, 2009 and November 30, 2008, respectively, were as follows:
Distributions paid from:
2009 2008Ordinary income $ 12,641,464 $ 23,044,338Long Term Capital Gain – 72,655,126Total $ 12,641,464 $ 95,699,464
27
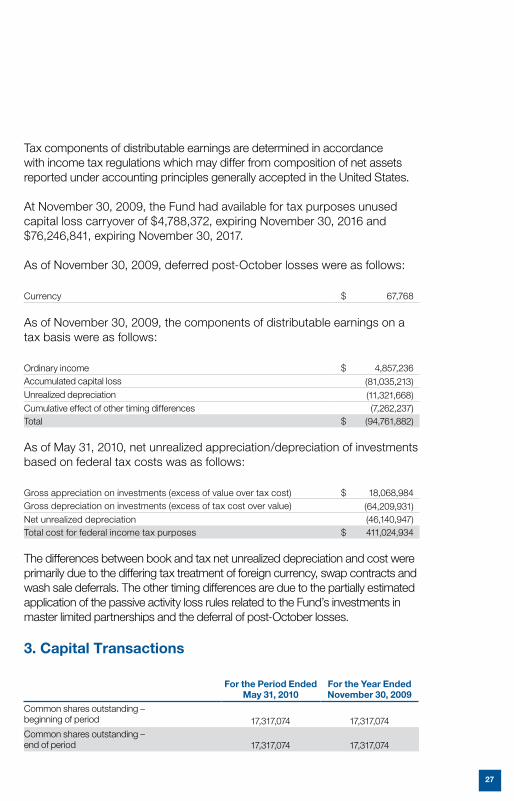
Tax components of distributable earnings are determined in accordance with income tax regulations which may differ from composition of net assets reported under accounting principles generally accepted in the United States.
At November 30, 2009, the Fund had available for tax purposes unused capital loss carryover of $4,788,372, expiring November 30, 2016 and $76,246,841, expiring November 30, 2017.
As of November 30, 2009, deferred post-October losses were as follows:
Currency $ 67,768
As of November 30, 2009, the components of distributable earnings on a tax basis were as follows:
Ordinary income $ 4,857,236Accumulated capital loss (81,035,213)Unrealized depreciation (11,321,668)Cumulative effect of other timing differences (7,262,237)Total $ (94,761,882)
As of May 31, 2010, net unrealized appreciation/depreciation of investments based on federal tax costs was as follows:
Gross appreciation on investments (excess of value over tax cost) $ 18,068,984Gross depreciation on investments (excess of tax cost over value) (64,209,931)Net unrealized depreciation (46,140,947)Total cost for federal income tax purposes $ 411,024,934
The differences between book and tax net unrealized depreciation and cost were primarily due to the differing tax treatment of foreign currency, swap contracts and wash sale deferrals. The other timing differences are due to the partially estimated application of the passive activity loss rules related to the Fund’s investments in master limited partnerships and the deferral of post-October losses.
3. Capital Transactions
For the period Ended May 31, 2010
For the year Ended November 30, 2009
Common shares outstanding – beginning of period 17,317,074 17,317,074 Common shares outstanding – end of period 17,317,074 17,317,074
28
4. portfolio Securities
Purchases and sales of investment securities, other than short-term securities, for the six months ended May 31, 2010 aggregated to $208,936,673 and $198,864,570, respectively.
Purchases and sales of U.S. government securities, for the six months ended May 31, 2010 were $0 and $0, respectively. 5. Investment Advisory and Management Agreement On July 21, 2009 the Board of Directors approved the renewal of the Investment Management Agreement with MCIM, pursuant to which MCIM serves as the Fund’s investment manager and is responsible for determining the Fund’s overall investment strategy and implementation through day-to-day portfolio management, subject to the general supervision of the Fund’s Board of Directors. MCIM is also responsible for managing the Fund’s business affairs, overseeing other service providers and providing management services. As compensation for its services to the Fund, MCIM receives an annual management fee, payable on a quarterly basis, equal to the annual rate of 1.00% of the Fund’s Total Assets (as defined below) up to and including $300 million, 0.90% of the Fund’s Total Assets over $300 million up to and including $500
million, and 0.65% of the Fund’s Total Assets over $500 million. Total Assets of the Fund, for the purpose of this calculation, include the aggregate of the Fund’s average daily net assets plus proceeds from any outstanding borrowings used for leverage. Brokerage Commissions: The Fund placed a portion of its portfolio transactions with a brokerage firm which is an affiliate of the MCIM. The commissions paid to the affiliated firm totaled $10,649 for the six months ended May 31, 2010. 6. Derivative Instruments In March 2008, the FASB issued “Disclosure about Derivative Instruments and Hedging Activities” (the “Derivatives Statement” or “ASC 815.10.5” and “ASC 815.10.15,” formerly FAS 133 and FAS 161, respectively). The Derivatives Statement is effective for interim and annual periods beginning after November 15, 2008. The Derivatives Statement requires enhanced disclosures about the Fund’s derivative and hedging activities, including how such activities are accounted for and their effects on the Fund’s financial position, performance and cash flows. The Fund adopted the Derivatives Statement in the current reporting period.
Notes to Financial StatementsMAy 31, 2010 (unaudited)
29
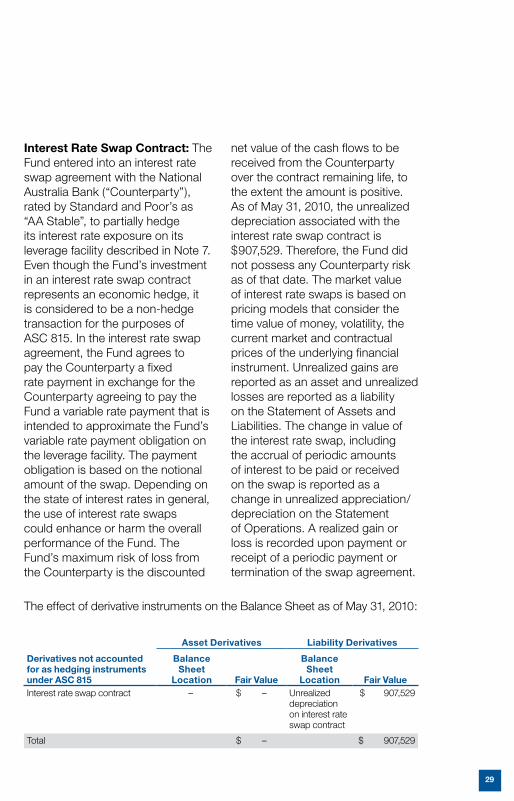
Interest Rate Swap Contract: The Fund entered into an interest rate swap agreement with the National Australia Bank (“Counterparty”), rated by Standard and Poor’s as “AA Stable”, to partially hedge its interest rate exposure on its leverage facility described in Note 7. Even though the Fund’s investment in an interest rate swap contract represents an economic hedge, it is considered to be a non-hedge transaction for the purposes of ASC 815. In the interest rate swap agreement, the Fund agrees to pay the Counterparty a fixed rate payment in exchange for the Counterparty agreeing to pay the Fund a variable rate payment that is intended to approximate the Fund’s variable rate payment obligation on the leverage facility. The payment obligation is based on the notional amount of the swap. Depending on the state of interest rates in general, the use of interest rate swaps could enhance or harm the overall performance of the Fund. The Fund’s maximum risk of loss from the Counterparty is the discounted
net value of the cash flows to be received from the Counterparty over the contract remaining life, to the extent the amount is positive. As of May 31, 2010, the unrealized depreciation associated with the interest rate swap contract is $907,529. Therefore, the Fund did not possess any Counterparty risk as of that date. The market value of interest rate swaps is based on pricing models that consider the time value of money, volatility, the current market and contractual prices of the underlying financial instrument. Unrealized gains are reported as an asset and unrealized losses are reported as a liability on the Statement of Assets and Liabilities. The change in value of the interest rate swap, including the accrual of periodic amounts of interest to be paid or received on the swap is reported as a change in unrealized appreciation/depreciation on the Statement of Operations. A realized gain or loss is recorded upon payment or receipt of a periodic payment or termination of the swap agreement.
The effect of derivative instruments on the Balance Sheet as of May 31, 2010:
Asset Derivatives Liability Derivatives
Derivatives not accounted for as hedging instruments under ASC 815
Balance Sheet
Location Fair Value
Balance Sheet
Location Fair ValueInterest rate swap contract – $ – Unrealized
depreciation on interest rate swap contract
$ 907,529
Total $ – $ 907,529
30
Notes to Financial StatementsMAy 31, 2010 (unaudited)
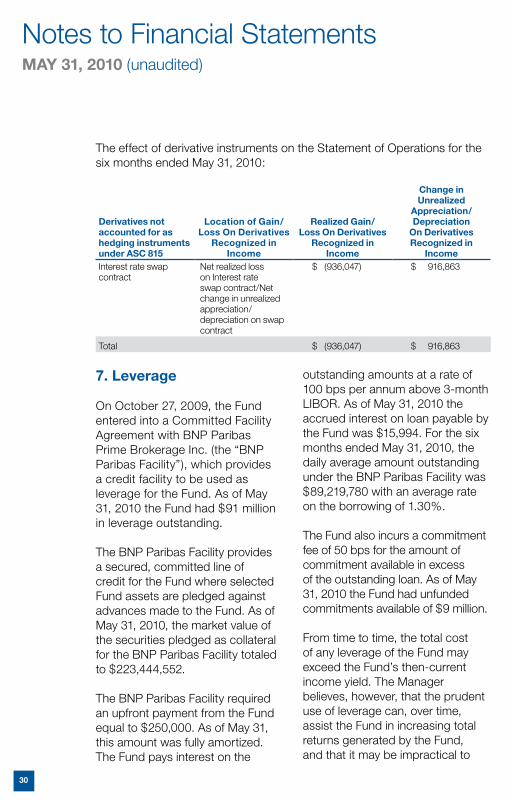
The effect of derivative instruments on the Statement of Operations for the six months ended May 31, 2010:
Derivatives not accounted for as hedging instruments under ASC 815
Location of Gain/Loss On Derivatives
Recognized in Income
Realized Gain/Loss On Derivatives
Recognized in Income
Change in Unrealized
Appreciation/ Depreciation
On Derivatives Recognized in
IncomeInterest rate swap contract
Net realized loss on Interest rate swap contract/Net change in unrealized appreciation/depreciation on swap contract
$ (936,047) $ 916,863
Total $ (936,047) $ 916,863
7. Leverage
On October 27, 2009, the Fund entered into a Committed Facility Agreement with BNP Paribas Prime Brokerage Inc. (the “BNP Paribas Facility”), which provides a credit facility to be used as leverage for the Fund. As of May 31, 2010 the Fund had $91 million in leverage outstanding. The BNP Paribas Facility provides a secured, committed line of credit for the Fund where selected Fund assets are pledged against advances made to the Fund. As of May 31, 2010, the market value of the securities pledged as collateral for the BNP Paribas Facility totaled to $223,444,552.
The BNP Paribas Facility required an upfront payment from the Fund equal to $250,000. As of May 31, this amount was fully amortized. The Fund pays interest on the
outstanding amounts at a rate of 100 bps per annum above 3-month LIBOR. As of May 31, 2010 the accrued interest on loan payable by the Fund was $15,994. For the six months ended May 31, 2010, the daily average amount outstanding under the BNP Paribas Facility was $89,219,780 with an average rate on the borrowing of 1.30%. The Fund also incurs a commitment fee of 50 bps for the amount of commitment available in excess of the outstanding loan. As of May 31, 2010 the Fund had unfunded commitments available of $9 million. From time to time, the total cost of any leverage of the Fund may exceed the Fund’s then-current income yield. The Manager believes, however, that the prudent use of leverage can, over time, assist the Fund in increasing total returns generated by the Fund, and that it may be impractical to
31
terminate and add leverage on a frequent basis due to, among other things, transaction costs incurred in selling and purchasing underlying securities, the cost of negotiating new facilities, and the limited availability of these facilities.
8. Other Compensation of Directors: The non-interested Directors of the Fund receive a quarterly retainer of $8,750, an additional $2,500 for each meeting attended, and $1,500 for each telephonic meeting. Additional out-of-pocket expenses may be paid as incurred.
9. Indemnifications
In the normal course of business, the Fund enters into contracts that contain a variety of representations which provide general indemnifications. The Fund’s maximum exposure under these arrangements is unknown as this would involve future claims that may be made against the Fund that have not yet occurred.
10. Subsequent Events
Distributions: On June 9, 2010 the Board of Directors approved a regular quarterly distribution to $0.16 per common share. The distribution was paid on June 30, 2010 to shareholders of record on June 24, 2010.
Directors: On June 24, 2010 Thomas W. Hunersen was re-elected as class II non-interested Director of the Fund for a three-year term.
Investment Advisory and Management Agreement: On July 20, 2010, the Board of Directors approved the renewal of the investment advisory and management agreement with MCIM.
Securities Lending: On May 26, 2010, the Fund entered into a securities lending agency arrangement with Brown Brothers Harriman and Co. and commenced lending in June 2010.
Leverage: On July 20, 2010, the Board of Directors approved an amendment to the BNP Paribas Committed Facility Agreement to allow the Fund to borrow an additional 20 million denominated in Euro. In the future, the Fund may incur leverage denominated in currencies other then the US dollar and the Euro.

32
Additional InformationMAy 31, 2010 (unaudited)
Dividend Reinvestment plan Unless a stockholder of MGU (“Stockholder”) elects to receive cash distributions, all dividends, including any capital gain dividends, on the Stockholder’s Common Shares will be automatically reinvested by BNY Mellon (the “Plan Agent”), in additional Common Shares under the Dividend Reinvestment Plan (the “Plan”). If a Stockholder elects to receive cash distributions, the Stockholder will receive all distributions in cash paid by check mailed directly to the Stockholder by BNY Mellon, as dividend paying agent. If a Stockholder decides to participate in the Plan, the number of Common Shares the Stockholder will receive will be determined as follows: • If Common Shares are trading
at or above NAV at the time of valuation, the Fund will issue new shares at a price equal to the greater of (i) NAV per Common Share on that date or (ii) 95% of the market price on that date.
• If Common Shares are trading below NAV at the time of valuation, the Plan Agent will receive the dividend or distribution in cash and will purchase Common Shares in the open market, on the NYSE or elsewhere, for the participants’ accounts. It is possible that the market price for the Common Shares may increase before the Plan Agent
has completed its purchases. Therefore, the average purchase price per share paid by the Plan Agent may exceed the market price at the time of valuation, resulting in the purchase of fewer shares than if the dividend or distribution had been paid in Common Shares issued by the Fund. The Plan Agent will use all dividends and distributions received in cash to purchase Common Shares in the open market within 30 days of the valuation date except where temporary curtailment or suspension of purchases is necessary to comply with federal securities laws. Interest will not be paid on any uninvested cash payments.
A Stockholder may withdraw from the Plan at any time by giving written notice to the Plan Agent, or by telephone in accordance with such reasonable requirements as the Plan Agent and Fund may agree upon. If a Stockholder withdraws or the Plan is terminated, the Stockholder will receive a certificate for each whole share in its account under the Plan and the Stockholder will receive a cash payment for any fraction of a share in its account. If the Stockholder wishes, the Plan Agent will sell the Stockholder’s shares and send the proceeds, minus brokerage commissions, if any, to the Stockholder. The Plan Agent maintains all Stockholders’ accounts in the Plan

33
and gives written confirmation of all transactions in the accounts, including information a Stockholder may need for tax records. Common Shares in an account will be held by the Plan Agent in non-certificated form. The Plan Agent will forward to each participant any proxy solicitation material and will vote any shares so held only in accordance with proxies returned to the Fund. Any proxy a Stockholder receives will include all Common Shares received under the Plan. There is no brokerage charge for reinvestment of a Stockholder’s dividends or distributions in Common Shares. However, all participants will pay a pro rata share of brokerage commissions incurred by the Plan Agent when it makes open market purchases. Automatically reinvesting dividends and distributions does not mean that a Stockholder does not have to pay income taxes due upon receiving dividends and distributions. If a Stockholder holds Common Shares with a brokerage firm that does not participate in the Plan, the Stockholder will not be able to participate in the Plan and any dividend reinvestment may be effected on different terms than those described above. Stockholders should consult their financial advisor for more information. The Fund reserves the right to amend or terminate the Plan if
in the judgment of the Board of Directors the change is warranted. There is no direct service charge to participants in the Plan; however, the Fund reserves the right to amend the Plan to include a service charge payable by the participants. All correspondence or questions concerning the Plan should be directed to the Plan administrator, The Bank of New York Mellon, 101 Barclay Street, New York, NY 10286, 20th Floor, Transfer Agent Services, 1-800-433-8191.
Fund proxy Voting policies & procedures
Policies and procedures used in determining how to vote proxies relating to portfolio securities and a summary of proxies voted by the Fund are available without a charge, upon request, by contacting the Fund at 1-800-910-1434 and on the Commission’s web site at http://www.sec.gov.
portfolio Holdings
The Fund files its complete schedule of portfolio holdings with the Commission for the first and third quarters of each fiscal year on Form N-Q within 60 days after the end of the period. Copies of the Fund’s Forms N-Q are available without a charge, upon request, by contacting the Fund at 1-800-910-1434 and on the Commission’s web site at http://www.sec.gov. You may also
34
Additional InformationMAy 31, 2010 (unaudited)
review and copy Form N-Q at the Commission’s Public Reference Room in Washington, D.C. For more information about the operation of the Public Reference Room, please call the Commission at 1-800-SEC-0330.
Notice
Notice is hereby given in accordance with Section 23(c) of the Investment Company Act of 1940 that the Fund may purchase at market prices from time to time shares of its common stock in the open market.
Shareholder Meeting
On June 24, 2010, the Fund held its Annual Meeting of Shareholders for the purpose of voting on a proposal to elect one director of the Fund. The results of the proposal are as follows:
proposal 1: to Elect one (1) Class II Director of the Fund:
Thomas W. Hunersen
For 81.19%
Witheld 7.32%

35
INTENTIONALLY LEFT BLANK
36
Directors & OfficersMAy 31, 2010 (unaudited)
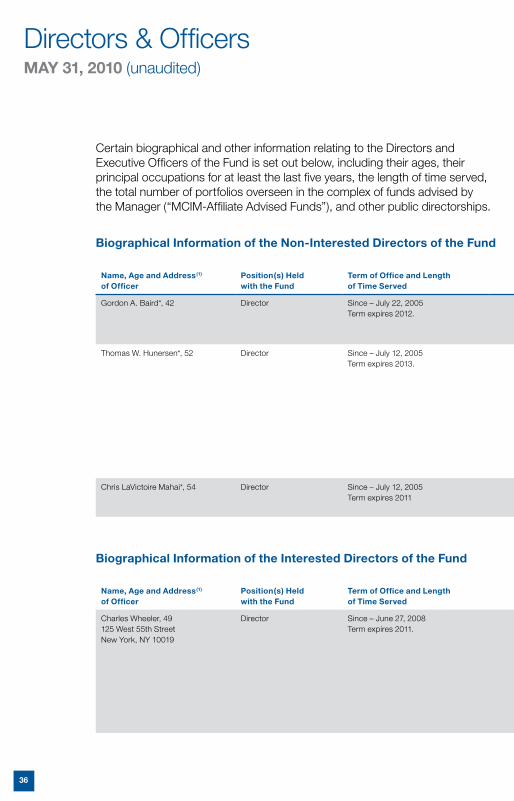
Certain biographical and other information relating to the Directors and Executive Officers of the Fund is set out below, including their ages, their principal occupations for at least the last five years, the length of time served, the total number of portfolios overseen in the complex of funds advised by the Manager (“MCIM-Affiliate Advised Funds”), and other public directorships.
Biographical Information of the Non-Interested Directors of the Fund
Name, Age and Address(1) of Officer
position(s) Held with the Fund
Term of Office and Length of Time Served
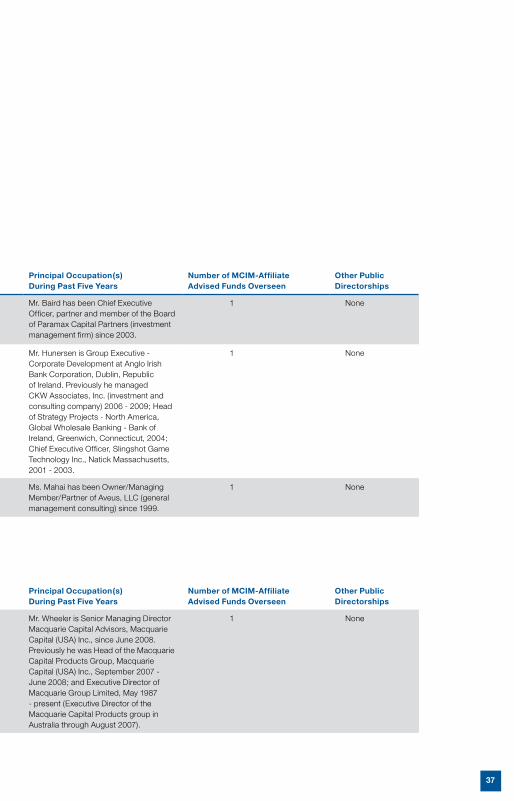
principal Occupation(s) During past Five years
Number of MCIM-Affiliate Advised Funds Overseen
Other public Directorships
Gordon A. Baird*, 42 Director Since – July 22, 2005 Term expires 2012.
Mr. Baird has been Chief Executive Officer, partner and member of the Board of Paramax Capital Partners (investment management firm) since 2003.
1 None
Thomas W. Hunersen*, 52 Director Since – July 12, 2005 Term expires 2013.
Mr. Hunersen is Group Executive - Corporate Development at Anglo Irish Bank Corporation, Dublin, Republic of Ireland. Previously he managed CKW Associates, Inc. (investment and consulting company) 2006 - 2009; Head of Strategy Projects - North America, Global Wholesale Banking - Bank of Ireland, Greenwich, Connecticut, 2004; Chief Executive Officer, Slingshot Game Technology Inc., Natick Massachusetts, 2001 - 2003.
1 None
Chris LaVictoire Mahai*, 54 Director Since – July 12, 2005 Term expires 2011
Ms. Mahai has been Owner/Managing Member/Partner of Aveus, LLC (general management consulting) since 1999.
1 None
Biographical Information of the Interested Directors of the Fund
Name, Age and Address(1) of Officer
position(s) Held with the Fund
Term of Office and Length of Time Served
principal Occupation(s) During past Five years
Number of MCIM-Affiliate Advised Funds Overseen
Other public Directorships
Charles Wheeler, 49125 West 55th Street New York, NY 10019
Director Since – June 27, 2008Term expires 2011.
Mr. Wheeler is Senior Managing Director Macquarie Capital Advisors, Macquarie Capital (USA) Inc., since June 2008. Previously he was Head of the Macquarie Capital Products Group, Macquarie Capital (USA) Inc., September 2007 - June 2008; and Executive Director of Macquarie Group Limited, May 1987 - present (Executive Director of the Macquarie Capital Products group in Australia through August 2007).
1 None
37
Biographical Information of the Non-Interested Directors of the Fund
Name, Age and Address(1) of Officer
position(s) Held with the Fund
Term of Office and Length of Time Served
principal Occupation(s) During past Five years
Number of MCIM-Affiliate Advised Funds Overseen
Other public Directorships
Gordon A. Baird*, 42 Director Since – July 22, 2005 Term expires 2012.
Mr. Baird has been Chief Executive Officer, partner and member of the Board of Paramax Capital Partners (investment management firm) since 2003.
1 None
Thomas W. Hunersen*, 52 Director Since – July 12, 2005 Term expires 2013.
Mr. Hunersen is Group Executive - Corporate Development at Anglo Irish Bank Corporation, Dublin, Republic of Ireland. Previously he managed CKW Associates, Inc. (investment and consulting company) 2006 - 2009; Head of Strategy Projects - North America, Global Wholesale Banking - Bank of Ireland, Greenwich, Connecticut, 2004; Chief Executive Officer, Slingshot Game Technology Inc., Natick Massachusetts, 2001 - 2003.
1 None
Chris LaVictoire Mahai*, 54 Director Since – July 12, 2005 Term expires 2011
Ms. Mahai has been Owner/Managing Member/Partner of Aveus, LLC (general management consulting) since 1999.
1 None
Biographical Information of the Interested Directors of the Fund
Name, Age and Address(1) of Officer
position(s) Held with the Fund
Term of Office and Length of Time Served
principal Occupation(s) During past Five years
Number of MCIM-Affiliate Advised Funds Overseen
Other public Directorships
Charles Wheeler, 49125 West 55th Street New York, NY 10019
Director Since – June 27, 2008Term expires 2011.
Mr. Wheeler is Senior Managing Director Macquarie Capital Advisors, Macquarie Capital (USA) Inc., since June 2008. Previously he was Head of the Macquarie Capital Products Group, Macquarie Capital (USA) Inc., September 2007 - June 2008; and Executive Director of Macquarie Group Limited, May 1987 - present (Executive Director of the Macquarie Capital Products group in Australia through August 2007).
1 None
38
Directors & OfficersMAy 31, 2010 (unaudited)
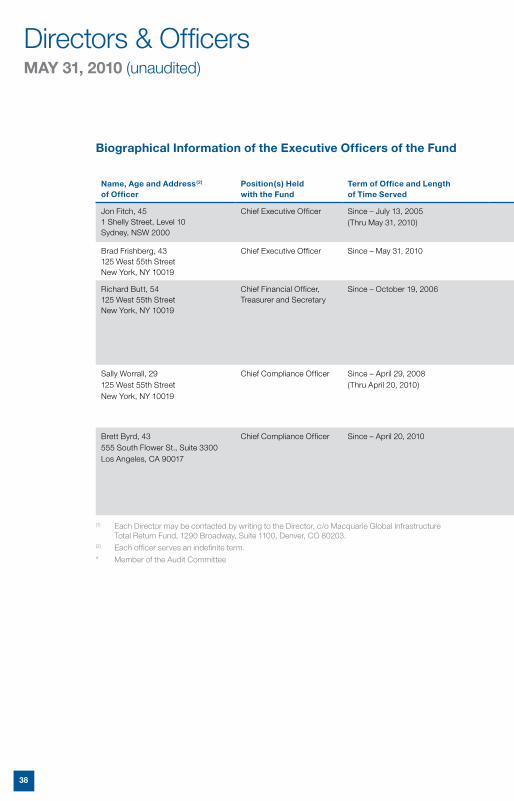
Biographical Information of the Executive Officers of the Fund
Name, Age and Address(2) of Officer
position(s) Held with the Fund
Term of Office and Length of Time Served principal Occupation(s) During past Five years
Jon Fitch, 451 Shelly Street, Level 10Sydney, NSW 2000
Chief Executive Officer Since – July 13, 2005 (Thru May 31, 2010)
CEO, Macquarie Capital Investment Management LLC, February 2004 – present. Equity Analyst, Macquarie Equities Limited, 1995 - 2003.
Brad Frishberg, 43 125 West 55th Street New York, NY 10019
Chief Executive Officer Since – May 31, 2010 Managing Director of MCIM since December 2009 - present; Managing Director and US equity portfoliomanager at J.P. Morgan Asset Management January 1996 - June 2008.
Richard Butt, 54125 West 55th Street New York, NY 10019
Chief Financial Officer, Treasurer and Secretary
Since – October 19, 2006 Mr. Butt is Director and Chairman, Macquarie Capital Investment Management LLC, since September 2006; and President, Macquarie Capital Investment Management LLC, December 2006 - present. Previously he was Director, Macquarie Capital Investment Management (Australia) Limited, November 2006 - February 2008; President Refco Fund Holdings, LLC, November 2003 - August 2006; Senior Vice President, Refco Alternative Investments, LLC, October 2003 - November 2003; President, Refco Alternative Investments, LLC, November 2003 - August 2006; and President, Refco Commodity Management, Inc., September 2005 - August 2006.
Sally Worrall, 29 125 West 55th Street New York, NY 10019
Chief Compliance Officer Since – April 29, 2008 (Thru April 20, 2010)
CCO, Macquarie Capital Investment Management LLC, September 2008 - April 2010; CCO, Globalis Investments, LLC, July 2008 - May 2009; CCO, Macquarie Funds Management (USA) Inc., April 2009 - April 2010; CCO, Macquarie Global Infrastructure Total Return Fund Inc., April 2008 to April 2010; Compliance Executive, macquarie Capital Investment Management LLC, January 2007 to September 2008; Previously acted as compliance Associate, Macquarie Group Limited’s Fuunds Management Group.
Brett Byrd, 43555 South Flower St., Suite 3300 Los Angeles, CA 90017
Chief Compliance Officer Since – April 20, 2010 Mr. Byrd is Associate Director, Macquarie Funds Group, since October 2008 and Chief Compliance Officer of Macquarie Capital Investment Management LLC since April 2010; Chief Compliance Officer, Macquarie Funds Management (USA) Inc. since April 2010. Chief Compliance Officer, Four Corners Capital Management, LLC (investment management firm), September 2004 - present; and Chief Compliance Officer, Macquarie Allegiance Capital, LLC (investment management firm), January 2009 - present. Previously he was Chief Compliance Officer, Four Corners - Meyerhoff Investment Management, LLC (fund of hedge fund manager), April 2006 - December 2007.
(1) Each Director may be contacted by writing to the Director, c/o Macquarie Global Infrastructure Total Return Fund, 1290 Broadway, Suite 1100, Denver, CO 80203.
(2) Each officer serves an indefinite term.
* Member of the Audit Committee
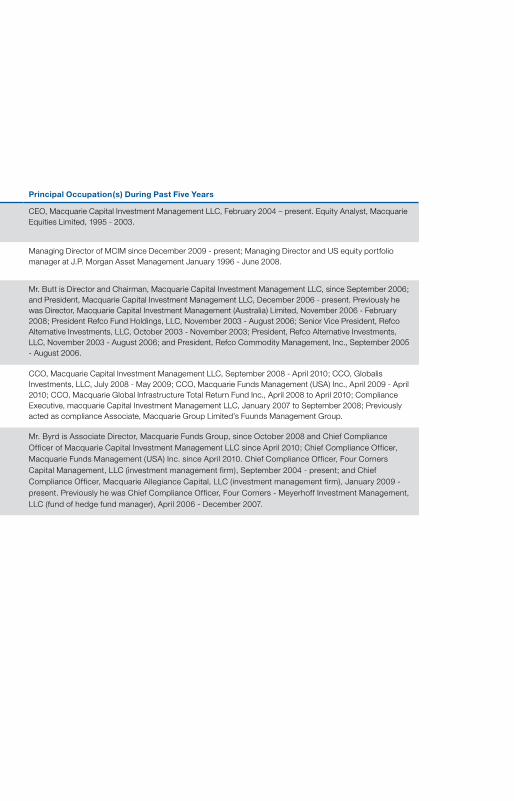

INTENTIONALLY LEFT BLANK


1-800-910-1434
Macquarie Global Infrastructure Total Return Fund Inc. 125 West 55th Street New York, NY 10019
www.macquarie.com/mgu


![MKIF - Investment Overview [Eng]...MACQUARIE KOREA INFRASTRUCTURE FUND 2008 INVESTMENT OVERVIEW 2008 INVESTMENT OVERVIEW | MACQUARIE KOREA INFRASTRUCTURE FUND | PAGE 1 fåîÉëíãÉåí=lîÉêîáÉï=](https://img.pdfslide.us/doc/110x75/5f43265310154310672004f7/mkif-investment-overview-eng-macquarie-korea-infrastructure-fund-2008-investment.jpg)