Embed Size (px)
Citation preview

1 1 1 1
Macquarie Corporate Day
Cameron Williamson, Group Chief Financial Officer
7-9 September 2016
Hong Kong and Singapore

2 2 2 2
About BT Investment Management A growing and successful global asset manager
Listed Australian company (since 2007)
An investment business that attracts and retains investment talent to deliver superior returns for clients
Significant equity participation by fund managers and staff
Stable investment teams with long-term track record
Diversified across investment strategies, geographies and clients
BT Investment Management (ASX: BTT)
Market capitalisation1 A$2.7 billion (US$2.0 billion)
Shareholders Westpac: 29% Employees: 15% Free float: 56%
AUM2 A$79.7 billion
Investment capabilities
Equities – Australian, UK, European, Asia, US, Global, Emerging Markets
Income and Fixed Interest Multi-asset
Employees 286 employees in Australia, UK, Europe, US and Asia
Financial year end 30 September
1. As at 1 September 2016 2. As at 30 June 2016

3 3 3 3
Business model attracts and retains talent … and drives investment performance
Investment independence
Transparent remuneration structure
Capacity management discipline
Active management
Performance driven
Strong investment culture
Strong team of independent investment professionals 79 investment professionals 22 investment teams
Strong operational platform with management, sales and marketing, distribution, compliance and back office support across Australia, Asia, UK, Europe and US 207 FT employees
4 4 4 4
Well positioned globally Global AUM forecast to exceed A$100tn by 2020
Sources: BCG Global Asset Management 2016 and PWC – Asset Management 2020 Note: FUM in $ represents BTIM Group AUM where client is domiciled
Distributing investment strategies in markets that make up over 90% of global AUM
North America $10.4bn
27.3 36.1 49.4
2007 2015 2020
Latin America
0.8 1.8 6.7
2007 2015 2020
Europe $7.1bn
16.1 19.6 27.9
2007 2015 2020UK $18.3bn
7.9 10.4 16.2
2007 2015 2020
Asia Pacific
5.4 5.2
2007 2015
Japan $0.1bn Australia $40.2bn
Asia $0.8bn (excl. Japan & Aust.)
2.5 5.2
2007 2015
Middle East & Africa $0.3bn
1 1.3 1.5
2007 2015 2020
5 5 5 5
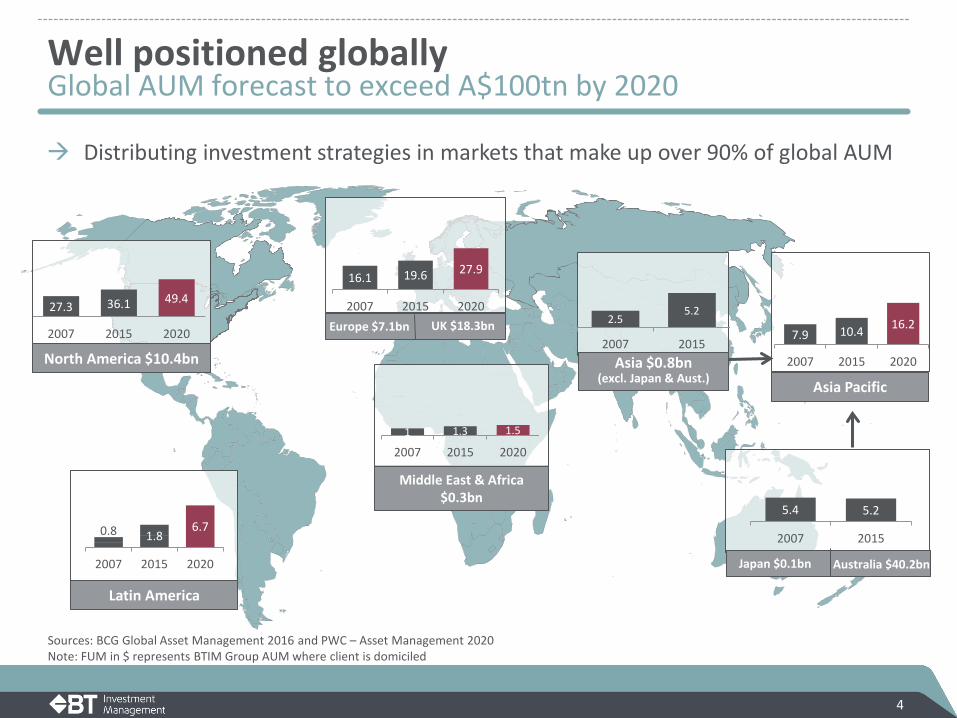
192.4
260.4
420.7 436.6
278.7
0
100
200
300
400
500
2012 2013 2014 2015 1H 2016Base management fees Performance fees Other fees
41.5
61.9
127.0 132.5
88.6
0
25
50
75
100
125
150
2012 2013 2014 2015 1H 2016
14.6
21.3
42.6 44.0
29.1
0
10
20
30
40
50
2012 2013 2014 2015 1H 2016
Growth rewarding shareholders
12.5 18.0
35.0 44.0
18.0
0
10
20
30
40
50
2012 2013 2014 2015 1H 2016
Revenue (A$m) Cash net profit after tax (A$m)
Cash earnings per share (A$cps) Dividends per share (A$cps)

6 6 6 6
Business diversity
AUM of A$77.2 billion (at 31 March 2016)
Diverse across asset class, geography and channel
68% 2%
8%
7%
15%
Equities PropertyCash Fixed IncomeMulti-asset
10%
24%
13%
0%
53%
Europe UK USAsia Australia
34%
43%
23%
Institutional WholesaleWestpac
Asset class Geography (client domicile) Distribution channel
7 7 7 7
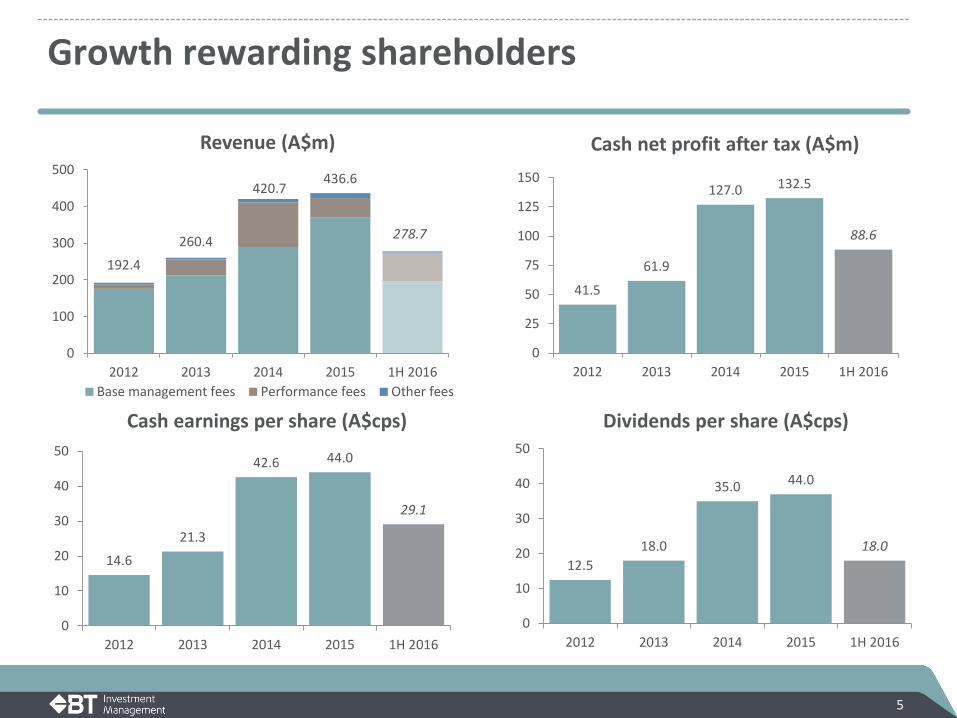
27.6%
31.0%
18.6%
12.9%
4.9% 4.9%
Australian Equities Global EquitiesUK Equities European EquitiesEmerging Market Equities Asian Equities
Equities1 AUM by strategy (A$b)
Diverse strategies across equities leading to broad-based currency exposure
Equities portfolio Exposure across strategies and currency
1. Includes Multi Asset allocation to equities; Represents closing AUM at 31 March 2016 2. Other includes c.20 other currencies, largely emerging markets
29%
12%
22%
18%
6%
13%
AUD USD GBP EUR JPY Other2
$US
$A
£
€
¥
Equities1 AUM by currency

8 8 8 8
Multiple drivers of growth
— Strong long-term investment performance
— Positive market performance and favourable currency movements
— Strong cumulative net flows
— Increasing capacity to earn performance fees
— New products growing AUM
— Fee margin expansion via channel mix
— Expansion into the US market
— Growing global equity and fixed income books
Growth drivers Multiple drivers of growth across the business

9 9 9 9
1 Year (pa)
3 Years (pa)
5 Years (pa)
BT Wholesale Core Australian Share Fund -2.26% +0.85% +1.04%
BT Wholesale Focus Australian Share Fund -0.85% +2.81% +1.91%
BT Wholesale Imputation Fund -3.89% -0.94% -0.25%
BT Wholesale Australian Long Short Fund -0.97% +0.99% +1.77%
BT Wholesale Mid Cap Fund -2.49% +3.34% +4.99%
BT Wholesale Smaller Companies Fund +2.01% +4.69% +10.17%
BT Wholesale MicroCap Opportunities Fund +8.52% +20.48% +22.44%
BT Wholesale Property Securities Fund +0.00% -0.02% +0.14%
BT Wholesale Core Global Share Fund -2.33% +0.00% +0.73%
BT Wholesale Active Balanced Fund -1.40% +0.87% +0.67%
BT Wholesale Conservative Outlook Fund -0.29% +0.63% +0.48%
BT Wholesale Fixed Interest Fund -0.18% +0.38% +0.32%
BT Wholesale Monthly Income Plus Fund +3.27% +3.84% +3.31%
BT Pure Alpha Fixed Income Fund -1.32% +0.80% N/A
BT Wholesale Enhanced Cash Fund +0.26% +0.64% +0.97%
1 Year (pa)
3 Years (pa)
5 Years (pa)
JOHCM UK Equity Income Fund -7.93% +0.46% +3.32%
JOHCM UK Opportunities Fund +11.08% +5.16% +5.23%
JOHCM UK Growth Fund -13.24% -0.46% +2.13%
JOHCM UK Dynamic Fund -4.86% +2.41% +4.36%
JOHCM Continental European Fund +3.91% +4.90% +4.45%
JOHCM European Select Values Fund +13.14% +6.03% +5.77%
JOHCM Global Select Fund -5.23% +3.71% +2.59%
JOHCM International Select Fund +3.63% +7.65% +6.36%
JOHCM Global Opportunities Fund +14.05% +7.17% N/A
JOHCM Emerging Markets Fund +5.39% +3.00% +3.02%
JOHCM Global Emerging Markets Opportunities Fund +1.00% +4.97% +2.61%
JOHCM Japan Fund -9.08% -4.57% -0.41%
JOHCM Asia ex Japan Fund +5.56% +1.86% N/A
JOHCM Asia ex Japan Small & Mid Cap Fund +8.97% +7.08% N/A
Investment performance relative to benchmarks Continued long-term outperformance
Note: Fund performance is pre-fee, pre-tax and relative to the fund benchmark. Australian domestic funds represent the flagship fund for the asset class. As at 30 June 2016

10 10 10 10
Growth in Assets under Management Strong growth in net flows
1. Includes JOHCM at 30 September 2011, prior to acquisition
-2
0
2
4
6
8
10
12
Sep 11 Sep 12 Sep 13 Sep 14 Sep 15
Net flows
42.31 45.8 46.6
50.4
58.3 62.1
66.4
77.1 78.4 77.2
Sep-11 Sep-13 Sep-15
BTIM Australia JOHCM
AUM (A$b) Cumulative flows (AUM $Ab)

11 11 11 11
JOHCM Performance fees (A$m) 4.3
34.5
113.6
37.6
73.7
A$7.1b A$9.1b A$16.0b
A$22.7b A$22.6b
1H12 1H13 1H14 1H15 1H16
Total JOHCM FUM
FUM capable of earningperformance fee
% of JOHCM AUM capable of earning performance fees 63% 63% 66% 65% 61%
No. of strategies1 capable of earning performance fees 15 16 17 19 19
Increasing capacity to earn performance fees JOHCM funds
1. Strategies refers to funds and separate mandates

12 12 12 12
Note: New initiatives are new products and investment strategies launched since March 2011
-
2.0
4.0
6.0
8.0
Sep 11 Mar 12 Sep 12 Mar 13 Sep 13 Mar 14 Sep 14 Mar 15 Sep 15 Mar 16
New initiatives Cumulative net flows (A$b)
BTIM JOHCM
Investment in new initiatives adding to AUM
Proven capability in bringing product to market
Current annualised revenue of new initiatives launched over the last five years is $40m
Organic growth Investment in new initiatives has raised A$7.6b in AUM

13 13 13 13
Continued increase in average base management fee margins.
Increased percentage of flows through higher margin wholesale channel
Average base management fee margin (bps)
Base management fee by channel
31 Mar 16 Fee Margin
$b Closing AUM BTIM JOHCM
Institutional 27.0 0.25% 0.58% Wholesale
Australia 5.6 0.76% - OEICs 20.2 - 0.65% US Pooled 6.6 - 0.81%
Westpac – Other1 9.9 0.29% - BTIM Group Core Funds 69.3 0.35% 0.66%
Westpac - Legacy 7.9 0.30% - Total BTIM Group AUM 77.2 0.34% 0.66%
40% 40% 41% 43% 51% 52% 56% 58% 60%
32% 32% 33% 32% 28% 28% 26% 26% 26%
28% 28% 26% 25% 21% 20% 18% 16% 14%
1H12 FY12 1H13 FY13 1H14 FY14 1H15 FY15 1H16Wholesale Institutional Westpac
39 39 40 41 45 46
48 49 50
1H12 FY12 1H13 FY13 1H14 FY14 1H15 FY15 1H16
Increasing revenue margins Progressively shifting to higher margin channels
1. Westpac Other: represents institutional IMA managing retail and corporate superannuation and managed accounts

14 14 14 14
Further global expansion Building a strong US platform
1. BCG Global Asset Management 2016
US funds management market estimated at A$36.1 trillion1 – largest region globally
Total AUM from US business A$10.4 bn (30 June 2016)
7 mutual funds — International Smallcap — International Select — Global Select — US SMID — Emerging Markets SMID — Emerging Markets Opportunities — Asia ex-Japan
Building-out the US business. Currently 20 FT employees:
— 5 investment professionals — 8 sales and distribution — 7 operations and support
-
1.0
2.0
3.0
4.0
5.0
6.0
Sep 12 Mar 13 Sep 13 Mar 14 Sep 14 Mar 15 Sep 15 Mar 16
US Mutual Funds Cumulative net flows (US$b)

15 15 15 15
10.4 12.2
4.8
16.1 4.1
10.9
2.7
7.6
1.0
2.7
0.8
2.9
1H12 FY12 1H13 FY13 1H14 FY14 1H15 FY15 1H16
Australian Global UK European Emerging Market Asian
A$52.4bn
A$23.8bn
CAGR 22% Equities AUM by strategy (A$b)
Growing global equities portfolio Significant growth in Global, UK and European equities

16 16 16 16
0.8 1.2
2.0
2.6 2.7
3.1
3.6
4.3
4.7
Mar 12 Sep 12 Mar 13 Sep 13 Mar 14 Sep 14 Mar 15 Sep 15 Mar 16
Australian Bonds International Bonds Absolute Return
AUM1 by strategy (A$b)
Demographic changes driving increased demand for income products
Growth of new products — Absolute return — Diversified income
Strong investment performance
CAGR 57%
Growing fixed income book Developing products to meet increasing demand
1. Excludes cash-like mandates

17 17 17 17
£30.0b
FY12 FY13 FY14 FY15 1H16
£12.1b
FY12 FY13 FY14 FY15 1H16
£8.1b
£13.9b
£22.0b
FY12 FY13 FY14 FY15 1H16
Preserving Performance
AUM of soft closed strategies Capacity of strategies with >3yr track record
AUM of open strategies
Capacity of strategies with <3yr track record
Current Growth Future Growth 2
Managing fund capacity while continuing to build for growth — Capacity is managed to ensure investment performance is not compromised — Funds are soft-closed at pre-determined AUM levels1 — Ongoing investment in new teams and extension strategies provides for future growth — Strong investment performance not compromised by asset growth whilst providing for future
growth
Capacity management discipline Preserving investment performance and building for growth
1. Fund capacity levels are set at inception and beta adjusted over time 2. Includes £10.7b (A$20.0b) of Sydney based global equity team but excludes Australian equities and fixed interest As at 31 March 2016
18 18 18 18
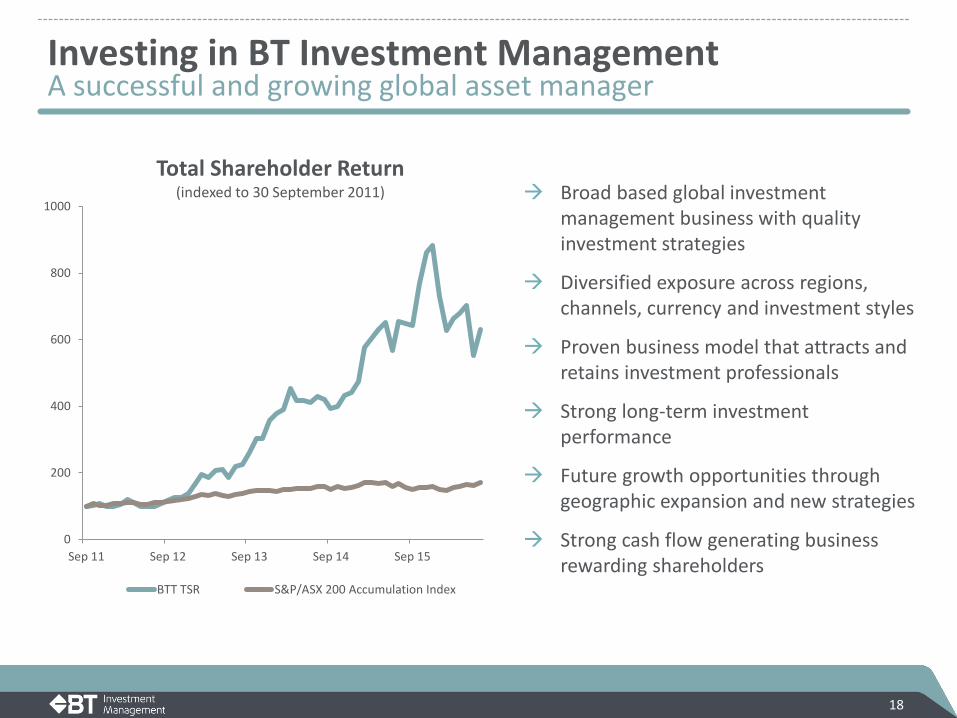
Investing in BT Investment Management A successful and growing global asset manager
0
200
400
600
800
1000
Sep 11 Sep 12 Sep 13 Sep 14 Sep 15
Total Shareholder Return (indexed to 30 September 2011)
BTT TSR S&P/ASX 200 Accumulation Index
Broad based global investment management business with quality investment strategies
Diversified exposure across regions, channels, currency and investment styles
Proven business model that attracts and retains investment professionals
Strong long-term investment performance
Future growth opportunities through geographic expansion and new strategies
Strong cash flow generating business rewarding shareholders
Appendix 1H 2016 Result Summary

20 20 20 20
Average AUM +11% — Strong net inflows — Lower $A versus pcp
Base management fees +15% driven by higher average AUM and expanding fee margins
Performance fees significantly higher
Growth in transaction fees from demand for Significant Investor Visa (SIV) product
Operating expenses higher with increase in variable employee costs on higher revenue
Increased fixed costs expected in 2H16 vs 1H16
Cash NPAT +33%, Cash EPS +32%
A$m 1H15 1H16 Change Avg AUM (A$b) 71.2 78.8 +11% Base fee margin 0.48% 0.50% +4% Base management fees 170.4 195.7 +15% Performance fees 38.0 74.9 +97% Transaction fees 2.2 7.5 +242% Other fee revenue 1.2 0.9 -28% Total fee revenue 211.8 279.0 +32% Employee expenses (100.1) (134.1) +34% Operating expenses (30.9) (33.5) +8% Total cash operating expenses (131.0) (167.6) +28% Operating profit 80.8 111.4 +38% Net investment income 3.5 2.2 -36% Financing charges (0.6) (0.4) -40% Tax (17.2) (24.6) +43% Cash NPAT 66.5 88.6 +33% Operating profit margin 38% 40% +5% Cash EPS 22.1 29.1 +32%
Financial highlights Key performance drivers continuing to grow

21 21 21 21
Net inflows of A$1.5b despite market volatility JOHCM equity funds inflows of A$2.0b – driven by US pooled funds and segregated mandates Stronger A$ negatively impacted AUM – A$ appreciated 16% vs GBP from 30 September 2015
30-Sep-15 Net FX 31-Mar-16 Breakdown of Net Flows Fee Margin
A$b Closing AUM Flows Other1 Impact Closing
AUM BTIM JOHCM BTIM JOHCM
Institutional 26.2 1.0 1.3 (1.5) 27.0 0.0 1.0 0.25% 0.58% Wholesale
Australia 5.4 0.1 0.1 - 5.6 0.1 - 0.76% - OEICs 22.5 0.0 0.9 (3.2) 20.2 - 0.0 - 0.65% US Pooled 6.0 1.0 0.5 (0.9) 6.6 - 1.0 - 0.81%
Westpac - Other2 9.9 0.0 0.0 - 9.9 0.0 - 0.29% - BTIM Group Core Funds 70.0 2.1 2.8 (5.6) 69.3 0.1 2.0 0.35% 0.66%
Westpac - Legacy 8.4 (0.6) 0.1 - 7.9 (0.6) - 0.30% - Total BTIM Group AUM 78.4 1.5 2.9 (5.6) 77.2 (0.5) 2.0 0.34% 0.66%
Continued net inflows Positive inflows and market performance offset by stronger AUD
1. Other: includes market movement, investment performance & distributions 2. Westpac Other: represents institutional IMA managing retail and corporate superannuation and managed accounts

22 22 22 22
30-Sep-15 Net Flows 31-Mar-16 A$b Closing AUM Core Legacy Other1 Closing AUM Equities
Australian 11.6 0.4 (0.1) 0.3 12.2 Global/International 16.0 0.7 0.0 (0.6) 16.1 UK 12.1 0.3 - (1.5) 10.9 European 7.7 0.4 0.0 (0.5) 7.6 Emerging Markets 2.3 0.5 - (0.1) 2.7 Asian 3.1 0.2 0.0 (0.4) 2.9
Property 1.7 0.0 0.0 0.1 1.8 Cash 6.1 0.2 0.0 0.0 6.3 Fixed Income 5.5 (0.7) 0.0 (0.1) 4.7 Diversified 11.9 0.0 (0.5) 0.1 11.5 Other 0.4 0.1 0.0 0.0 0.5 Total AUM 78.4 2.1 (0.6) (2.7) 77.2
Positive flows across all equities categories Global equities +A$0.7b, European equities +A$0.4b, and Australian equities +A$0.3b Fixed income AUM impacted by redemption of low margin cash-like mandate (A$1.1b)
AUM and flows by asset class Net inflows of A$2.1 billion in Core funds
1. Other includes market movement, investment performance, distributions & FX

23 23 23 23
92.0
133.8
255.3
211.8
279.0
1H12 1H13 1H14 1H15 1H16
31.5 34.5 38.4 45.3
52.7 32.8
54.2
114.2
85.7
114.9
1H12 1H13 1H14 1H15 1H16
Fixed Variable
19.4 21.6 24.1 27.3 31.6 23.6
45.0
101.0
72.8
102.5
1H12 1H13 1H14 1H15 1H16
Total operating expenses2 (A$m) Total employee expenses (A$m)
Revenue (A$m) and operating margin (%)
30%
34%
40% 38%
40%
% Breakdown 1H12 1H13 1H14 1H15 1H16 Fixed expenses 49% 39% 25% 35% 31% Variable expenses1 51% 61% 75% 65% 69% Total 100% 100% 100% 100% 100%
Fixed vs. variable expenses Revenue growing faster than expenses
1. Variable expenses include fund expenses that are linked to AUM & employee expenses that are linked to profit 2. Total operating expenses includes employee expenses

24 24 24 24
Balance sheet strong with continued upward NTA trend
Cash balance seasonally lower however net cash position improving year-on-year
Loan notes fully redeemed as at 31 March 2016
Debt facility available for seeding and operational purposes, subject to re-finance by 30 Sep 2016
Comfortable gearing ratios provide platform for growth
No significant change to regulatory capital requirements – c.A$17m
A$m Mar 2015 Sep 2015 Mar 2016 Change1
Cash and cash equivalents 111.0 166.8 147.0 (19.8) Bank debt and loan notes (43.0) (18.0) (26.4) (8.4) Net cash 68.0 148.8 120.6 (28.2) Undrawn debt facilities 51.3 86.7 58.1 (28.6) Total equity 688.4 761.9 731.1 (30.8)
Less: Intangibles and equity settled converting notes
(583.4) (622.5) (578.6) 43.9
Net tangible assets (NTA) 105.0 139.4 152.5 13.1 Gearing Ratios Debt / equity 6% 2% 4% 2% Debt / operating profit 31% 11% 13% 2% Debt / NTA 41% 13% 17% 4% Interest coverage 100x 133x 202x 69x
Balance sheet strength
1. Change represents variance between March 2016 and September 2015

25 25 25 25
Disclaimer
This presentation has been prepared by BT Investment Management Limited (BTIM).
While the information in this presentation has been prepared in good faith and with reasonable care, no representation or warranty, express or implied, is made as to the accuracy, adequacy or reliability of any statements, estimates, opinions or other information contained in the presentation.
This presentation contains forward looking statements. These forward looking statements have been made based upon BTIM’s expectations and beliefs concerning future developments and their potential effect upon BTIM and are subject to risks and uncertainty which are, in many instances, beyond BTIM’s control. No assurance is given that future developments will be in accordance with BTIM’s expectations. Actual results could differ materially from those expected by BTIM.
The information contained in this presentation is not intended to be relied upon as advice to investors or potential investors, who should consider seeking independent professional advice depending upon their specific investment objectives, financial situation or particular needs.
In this presentation, unless otherwise stated or the context otherwise requires, references to 'dollar amounts', '$', 'AUD' or 'A$' are to Australian dollars.