Embed Size (px)
Citation preview
Mackenzie Timber Supply Area
Timber Supply Review
Data Package
September 2012

Mackenzie TSA TSR Data Package September 2012
ii
Mackenzie TSA TSR Data Package September 2012
iii
Contents 1. Introduction 1
1.1 Description of the Timber Supply Area 1 2. Current Forest Management Considerations and Issues 2
2.1 Base case management assumptions 2 2.2 Major forest management considerations and issues 2
3. Inventories 5 4. Division of the Area into Management Zones 8
4.1. Management zones and objectives 8
4.2. Analysis units 8 5. Timber Harvesting Land Base Definition 10
5.1. Non-forest 11 5.2. Existing Roads, Rail, Airstrips, Powerlines and Pipelines 12 5.3. Future Roads 12
5.4. Ownership/Tenure contributions to CFLB and THLB 13 5.5. Areas with high recreation values 14
5.6. Inoperable areas 14
5.7. Problem forest types 18 5.8. Wildlife habitat reductions 18 5.9. Cultural heritage resources 19
5.10. Exclusion of specific, geographically defined areas 20 5.11. Riparian reserve and management areas and wildlife tree patches 21
6. Current Forest Management Assumptions 21 6.1. Harvesting 21
6.1.1. Utilization levels 21
6.1.2. Volume exclusions for the deciduous component of stands 22 6.1.3. Minimum harvestable volumes 22
6.1.4. Harvest scheduling priorities 22 6.1.5. Silvicultural systems 23
6.2. Unsalvaged losses 23 6.3. Balsam Decline 23 6.4. Mountain pine beetle 24
6.5. Young pine mortality 24 6.6 Shelf life of Dead Pine 26
6.7. Silviculture 26 6.7.1. Regeneration activities 26 6.7.2. Immature plantation history 28
6.7.3. Hard Pine Rusts 29 6.8. Integrated resource management 29
6.8.1. Visual Quality Objectives 29 6.8.2. Landscape Biodiversity 30
6.8.3. Ungulate Winter Ranges 31 6.9 Natural Disturbance 33
7. Sensitivity Analyses 34 7.1. Data uncertainties 34
7.1.1. Operability: 34 7.1.2. Mountain pine beetle 34 7.1.3. Stand growth: 34
7.2. Possible policy changes 34
Mackenzie TSA TSR Data Package September 2012
iv
7.2.1. Non-legal but recommended visual quality polygons 34 7.2.2. Best management practices (BMPs) for grizzly bear 35
7.2.3. Best management practices for caribou 35 7.2.4. Best management practices for bull trout 35
7.3. Exploring new economic opportunities 35 7.3.1. Fibre opportunities 35
7.3.2. Utilizing marginally economic stands 36
Mackenzie TSA TSR Data Package September 2012
v
Table of Figures and Tables
Table 1. Major forest management considerations ............................................................................... 3 Table 2. Inventory information ............................................................................................................. 5 Table 3. Objectives to be tracked ......................................................................................................... 8
Table 4. Definition of analysis units for existing natural stands .......................................................... 9 Table 5. Description of non forest ...................................................................................................... 11 Table 6: Non-forested widths for existing roads, rail, airstrips, power and pipe lines ....................... 12 Table 7. Ownership contributions ...................................................................................................... 13 Table 8: Distribution of slope and haul (including barge) distance across harvested cutblocks in the
Mackenzie TSA. The cutoffs used to define the timber harvesting land base are
highlighted. ........................................................................................................................... 15 Table 9: Distribution of maximum inventory, stand volume across harvested cutblocks in the
Mackenzie TSA. The cutoffs used to define the timber harvesting land base are
highlighted. ........................................................................................................................... 15
Table 10: Estimated barge distance for each log dump in the analysis area. ....................................... 16
Figure 1. Known log dumps and exit points (both numbered), cutblocks (red) and protected areas
within the Mackenzie TSA. .................................................................................................. 17
Table 11. Ungulate Winter Range reductions to the timber harvesting land base ............................... 18 Table 12. Wildlife Habitat area reductions to the timber harvesting land base .................................... 19 Table 13. Exclusion of specific, geographically defined areas ............................................................ 20
Table 14. Utilization levels ................................................................................................................... 21 Table 15. Unsalvaged losses ................................................................................................................. 23
Table 16. Young pine stand mortality survey ....................................................................................... 25 Table 17. Regeneration assumptions for future managed stands and stands established since 2000. .. 27 Table 18. Regeneration assumptions for managed stands established prior to 2000. .......................... 28
Table 19. Assignment of visual quality objectives ............................................................................... 29
Table20. Slope classes for calculating P2P ratio and VEG height ...................................................... 30 Table 21. Definition of the Biogeoclimatic groups .............................................................................. 31 Table 22. Modeling of ungulate winter range forest cover requirements ............................................. 32
Table 23. Annual probability of natural stand replacement by Natural Disturbance Unit ................... 33
Mackenzie TSA TSR Data Package September 2012
1
1. Introduction
This data package summarizes the information and assumptions that were used to conduct timber supply
analysis for the Mackenzie Timber Supply Area (TSA). The information and assumptions represent current
performance, which is defined by:
the current forest management regime — the productive forest land available for timber harvesting, the
silviculture treatments, the harvesting systems and the integrated resource management practices used in
the area, including objectives and practice requirements contained in the Forest and Range Practices
Act;
land-use plans approved by Cabinet (i.e., Mackenzie Land and Resource Management Plan);
legal objectives established under the Forest and Range Practices Act and the Land Act (i.e., wildlife
habitat areas, and ungulate winter ranges).
The purpose of the timber supply review program is to model “what is”, as opposed to “what if.” Changes in
forest management objectives and data, when and if they occur, will be captured in future timber supply
analyses.
In most cases, each section of this data package contains:
1) a short explanation of the data required,
2) a data table or list of modelling assumptions, and
3) a description of data sources and other comments.
1.1 Description of the Timber Supply Area
The Mackenzie timber supply area (TSA) is situated in the northeast interior of the province and is the fourth
largest TSA in the province, covering approximately 6.41 million hectares. The TSA is one of 2 in the Omenica
Region and is administered by the Ministry of Forest Lands and Natural Resources Operations District office
located in Mackenzie.
The Rocky Mountain Trench, with flat to gentle terrain, runs north-south through the center of the timber supply
area, with the rugged Rocky Mountains on the east side and the more rounded Omenica Mountains to the west.
Within the central portion of the TSA and within the Rocky Mountain Trench is the Williston Lake. This hydro
power reservoir and dominate feature, was created by the W.A.C Bennett Dam on the Peace River, is
approximately 360 kilometres long and is the largest fresh water body in the province.
Despite the diverse terrain of mountains and river valleys, which contributes to the distinct ecological features
and high biodiversity values, the forests of Mackenzie are fairly homogeneous. The primary tree species are
lodgepole pine, spruce and subalpine fir. These along with several deciduous species make up the forests of the
TSA. For example, forests of hybrid white spruce, lodgepole pine, alpine fir and boreal black spruce
characterize the lower elevation areas. In flat terrain, the forest typically consists of hybrid spruce, and
lodgepole pine with trembling aspen. The high elevation mountain-tops are blanketed with alpine shrubs, herbs,
mosses and lichens.
The dominant factor influencing forest management and harvest activities in the TSA is the unprecedented
mountain pine beetle infestation. This infestation has devastated hundreds of thousands of hectares of lodgepole
pine stands. Due to the vast numbers of mountain pine beetle within the TSA, extreme behaviours by the beetle
have occurred. Previously harvested stands, as young as 25 years, have been successfully attacked and killed.
To date no large infestation in spruce, the alternate host tree, have been noted within the TSA.
Mackenzie TSA TSR Data Package September 2012
2
The Mackenzie timber supply area is sparsely populated. Most of the population lives in the community of
Mackenzie. Small settlements within the timber supply area include Germansen Landing, Manson Creek, Tsay
Keh, and Fort Ware. There is very little dispersed rural settlement within the area. Roads access extends along
both sides of Williston Lake. Most of the northern third of the TSA is without road access and is mainly
contained in the Muskwa-Kechika Management Area.
Ten First Nations have asserted traditional territory within the Mackenzie timber supply area. The timber supply
area almost entirely encompasses the traditional territories for the Kwadacha and Tsay Keh Dene First Nations,
and includes their main communities of Fort Ware and Tsay Keh, respectively. The traditional territories of the
McLeod Lake Indian Band, Takla Lake First Nation, and Nak’azdli First Nation, overlap a portion of the timber
supply area as do small portions of West Moberly First Nation, Saulteau First Nation and Halfway River First
Nation. In addition, significant portions of the Treaty 8 disputed area ofWest Moberly First Nation, Saulteau
First Nation and Halfway River First Nation also overlap the timber supply area. Finally, small portions of the
timber supply area near Thutade Lake are asserted to be within the traditional territories of the Gitxsan and the
Tahltan First Nations.
2. Current Forest Management Considerations and Issues
2.1 Base case management assumptions
The assumptions described in this data package reflect current performance with respect to the status of forest
land, forest management practices and knowledge of timber growth and yield. The harvest forecast developed
from these assumptions is the reference harvest forecast – or base case - and is used as a baseline for assessing
the impacts of uncertainties on the projected harvest. Section 7, “Sensitivity Analysis” identifies areas of
uncertainty in the data and assumptions and outlines sensitivity analyses that are carried out.
2.2 Major forest management considerations and issues
Table 1 (overleaf) lists major forest management issues and considerations. Where possible, the issues are
assessed directly in the timber supply analysis. If the issue does not fall within the definition of current
management as described in Section 1, “Introduction”, the related timber supply impacts are assessed in a
sensitivity analysis. There may be significant uncertainties in defining some current management issues. In
such cases, sensitivity analysis can assist in assessing the timber supply implications and assigning degrees of
risk to timber supply during allowable annual cut (AAC) determination.
Mackenzie TSA TSR Data Package September 2012
3
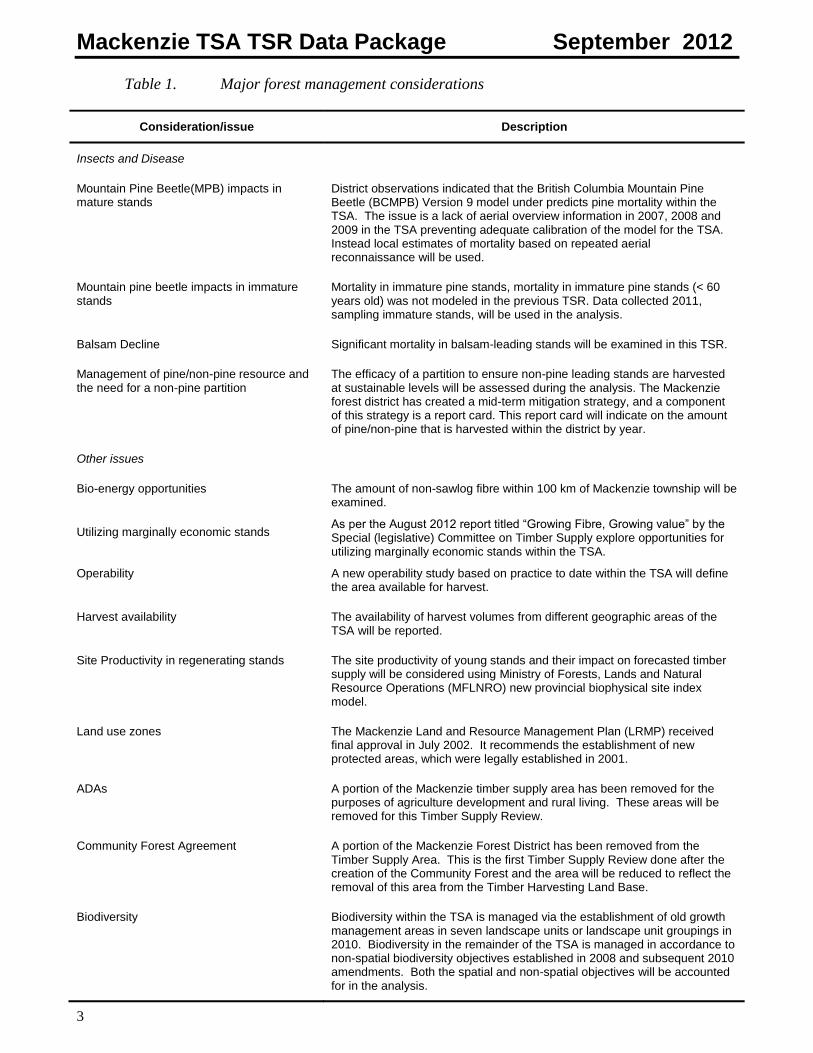
Table 1. Major forest management considerations
Consideration/issue Description
Insects and Disease
Mountain Pine Beetle(MPB) impacts in mature stands
District observations indicated that the British Columbia Mountain Pine Beetle (BCMPB) Version 9 model under predicts pine mortality within the TSA. The issue is a lack of aerial overview information in 2007, 2008 and 2009 in the TSA preventing adequate calibration of the model for the TSA. Instead local estimates of mortality based on repeated aerial reconnaissance will be used.
Mountain pine beetle impacts in immature stands
Mortality in immature pine stands, mortality in immature pine stands (< 60 years old) was not modeled in the previous TSR. Data collected 2011, sampling immature stands, will be used in the analysis.
Balsam Decline Significant mortality in balsam-leading stands will be examined in this TSR.
Management of pine/non-pine resource and the need for a non-pine partition
The efficacy of a partition to ensure non-pine leading stands are harvested at sustainable levels will be assessed during the analysis. The Mackenzie forest district has created a mid-term mitigation strategy, and a component of this strategy is a report card. This report card will indicate on the amount of pine/non-pine that is harvested within the district by year.
Other issues
Bio-energy opportunities The amount of non-sawlog fibre within 100 km of Mackenzie township will be examined.
Utilizing marginally economic stands As per the August 2012 report titled “Growing Fibre, Growing value” by the Special (legislative) Committee on Timber Supply explore opportunities for utilizing marginally economic stands within the TSA.
Operability A new operability study based on practice to date within the TSA will define the area available for harvest.
Harvest availability The availability of harvest volumes from different geographic areas of the TSA will be reported.
Site Productivity in regenerating stands The site productivity of young stands and their impact on forecasted timber supply will be considered using Ministry of Forests, Lands and Natural Resource Operations (MFLNRO) new provincial biophysical site index model.
Land use zones The Mackenzie Land and Resource Management Plan (LRMP) received final approval in July 2002. It recommends the establishment of new protected areas, which were legally established in 2001.
ADAs A portion of the Mackenzie timber supply area has been removed for the purposes of agriculture development and rural living. These areas will be removed for this Timber Supply Review.
Community Forest Agreement A portion of the Mackenzie Forest District has been removed from the Timber Supply Area. This is the first Timber Supply Review done after the creation of the Community Forest and the area will be reduced to reflect the removal of this area from the Timber Harvesting Land Base.
Biodiversity Biodiversity within the TSA is managed via the establishment of old growth management areas in seven landscape units or landscape unit groupings in 2010. Biodiversity in the remainder of the TSA is managed in accordance to non-spatial biodiversity objectives established in 2008 and subsequent 2010 amendments. Both the spatial and non-spatial objectives will be accounted for in the analysis.
Mackenzie TSA TSR Data Package September 2012
4
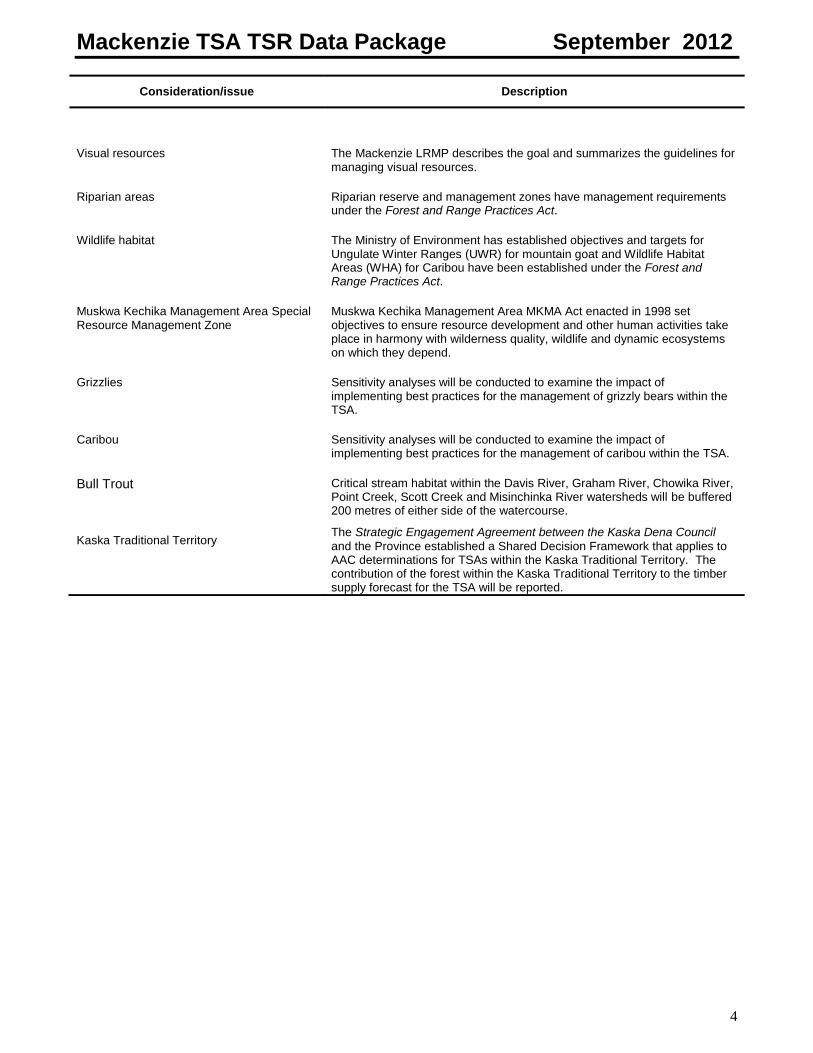
Consideration/issue Description
Visual resources The Mackenzie LRMP describes the goal and summarizes the guidelines for managing visual resources.
Riparian areas Riparian reserve and management zones have management requirements under the Forest and Range Practices Act.
Wildlife habitat The Ministry of Environment has established objectives and targets for Ungulate Winter Ranges (UWR) for mountain goat and Wildlife Habitat Areas (WHA) for Caribou have been established under the Forest and Range Practices Act.
Muskwa Kechika Management Area Special Resource Management Zone
Muskwa Kechika Management Area MKMA Act enacted in 1998 set objectives to ensure resource development and other human activities take place in harmony with wilderness quality, wildlife and dynamic ecosystems on which they depend.
Grizzlies Sensitivity analyses will be conducted to examine the impact of implementing best practices for the management of grizzly bears within the TSA.
Caribou Sensitivity analyses will be conducted to examine the impact of implementing best practices for the management of caribou within the TSA.
Bull Trout Critical stream habitat within the Davis River, Graham River, Chowika River, Point Creek, Scott Creek and Misinchinka River watersheds will be buffered 200 metres of either side of the watercourse.
Kaska Traditional Territory The Strategic Engagement Agreement between the Kaska Dena Council
and the Province established a Shared Decision Framework that applies to AAC determinations for TSAs within the Kaska Traditional Territory. The contribution of the forest within the Kaska Traditional Territory to the timber supply forecast for the TSA will be reported.
Mackenzie TSA TSR Data Package September 2012
5
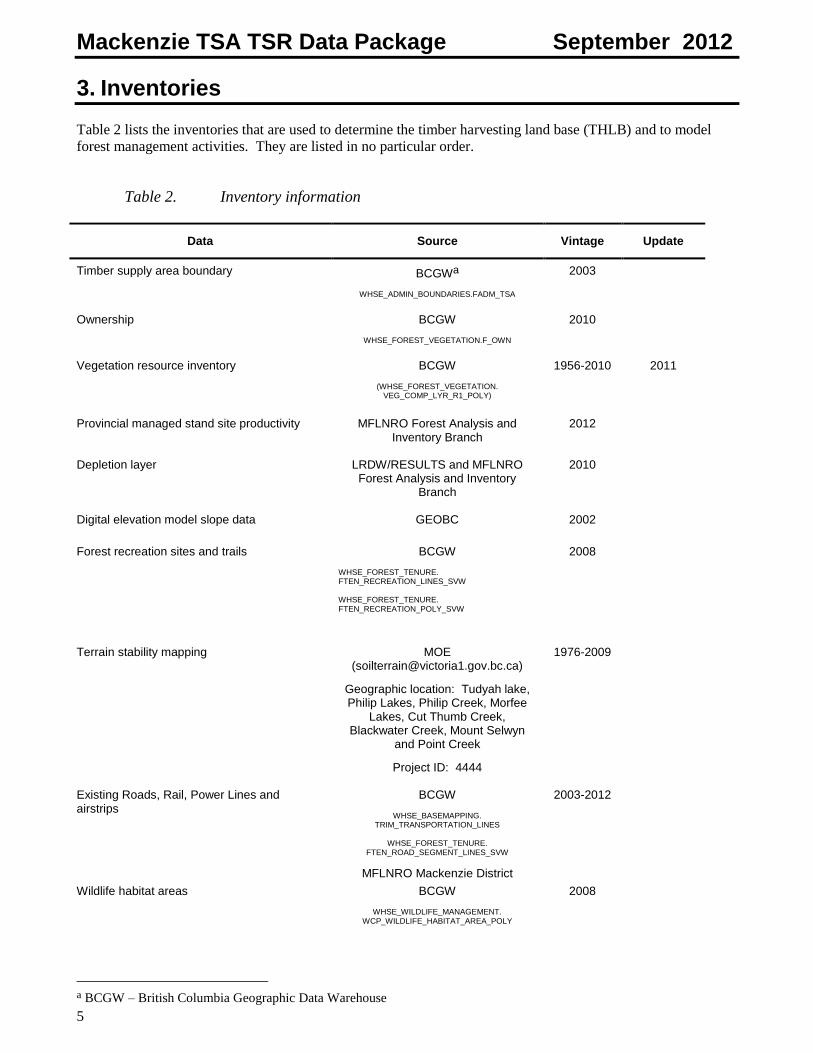
3. Inventories
Table 2 lists the inventories that are used to determine the timber harvesting land base (THLB) and to model
forest management activities. They are listed in no particular order.
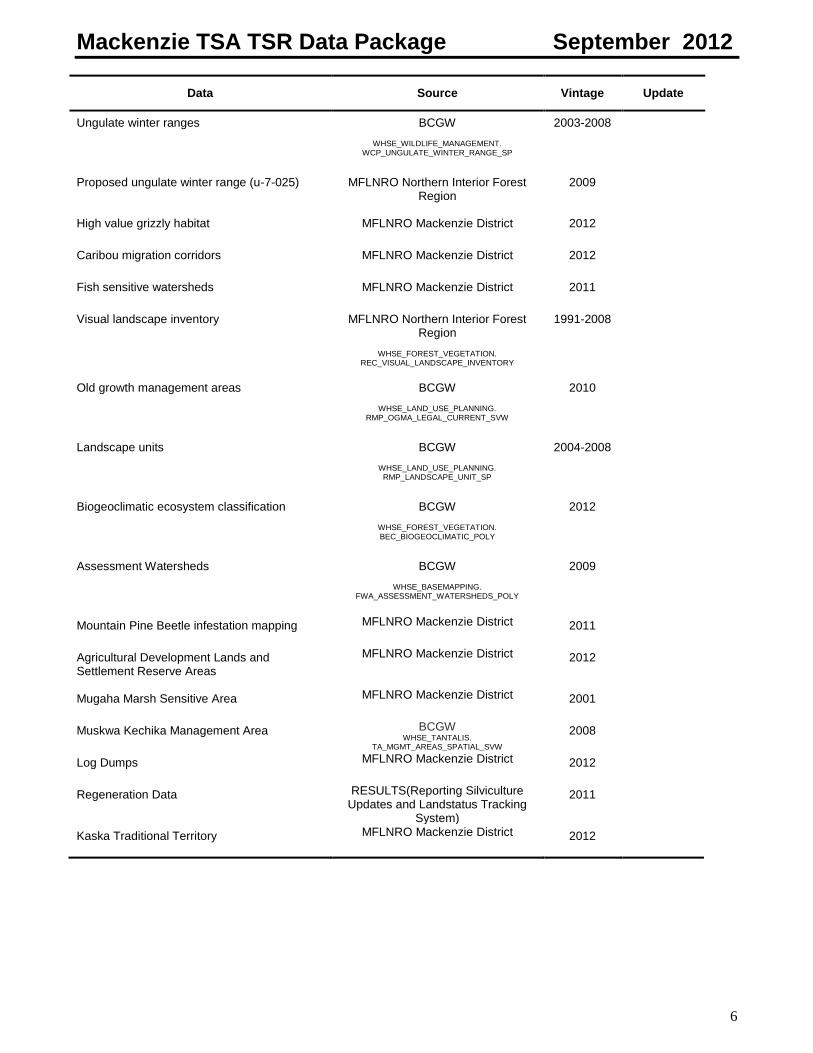
Table 2. Inventory information
Data Source Vintage Update
Timber supply area boundary BCGWa
WHSE_ADMIN_BOUNDARIES.FADM_TSA
2003
Ownership BCGW
WHSE_FOREST_VEGETATION.F_OWN
2010
Vegetation resource inventory BCGW
(WHSE_FOREST_VEGETATION. VEG_COMP_LYR_R1_POLY)
1956-2010 2011
Provincial managed stand site productivity MFLNRO Forest Analysis and Inventory Branch
2012
Depletion layer LRDW/RESULTS and MFLNRO Forest Analysis and Inventory
Branch
2010
Digital elevation model slope data GEOBC 2002
Forest recreation sites and trails BCGW
WHSE_FOREST_TENURE. FTEN_RECREATION_LINES_SVW WHSE_FOREST_TENURE. FTEN_RECREATION_POLY_SVW
2008
Terrain stability mapping MOE ([email protected])
Geographic location: Tudyah lake, Philip Lakes, Philip Creek, Morfee
Lakes, Cut Thumb Creek, Blackwater Creek, Mount Selwyn
and Point Creek
Project ID: 4444
1976-2009
Existing Roads, Rail, Power Lines and airstrips
BCGW
WHSE_BASEMAPPING. TRIM_TRANSPORTATION_LINES
WHSE_FOREST_TENURE.
FTEN_ROAD_SEGMENT_LINES_SVW
MFLNRO Mackenzie District
2003-2012
Wildlife habitat areas BCGW
WHSE_WILDLIFE_MANAGEMENT. WCP_WILDLIFE_HABITAT_AREA_POLY
2008
a BCGW – British Columbia Geographic Data Warehouse
Mackenzie TSA TSR Data Package September 2012
6
Data Source Vintage Update
Ungulate winter ranges BCGW
WHSE_WILDLIFE_MANAGEMENT. WCP_UNGULATE_WINTER_RANGE_SP
2003-2008
Proposed ungulate winter range (u-7-025) MFLNRO Northern Interior Forest Region
2009
High value grizzly habitat MFLNRO Mackenzie District 2012
Caribou migration corridors MFLNRO Mackenzie District 2012
Fish sensitive watersheds MFLNRO Mackenzie District 2011
Visual landscape inventory MFLNRO Northern Interior Forest Region
WHSE_FOREST_VEGETATION. REC_VISUAL_LANDSCAPE_INVENTORY
1991-2008
Old growth management areas BCGW
WHSE_LAND_USE_PLANNING. RMP_OGMA_LEGAL_CURRENT_SVW
2010
Landscape units BCGW
WHSE_LAND_USE_PLANNING. RMP_LANDSCAPE_UNIT_SP
2004-2008
Biogeoclimatic ecosystem classification BCGW
WHSE_FOREST_VEGETATION. BEC_BIOGEOCLIMATIC_POLY
2012
Assessment Watersheds BCGW
WHSE_BASEMAPPING. FWA_ASSESSMENT_WATERSHEDS_POLY
2009
Mountain Pine Beetle infestation mapping MFLNRO Mackenzie District 2011
Agricultural Development Lands and Settlement Reserve Areas
MFLNRO Mackenzie District 2012
Mugaha Marsh Sensitive Area MFLNRO Mackenzie District 2001
Muskwa Kechika Management Area BCGW WHSE_TANTALIS.
TA_MGMT_AREAS_SPATIAL_SVW
2008
Log Dumps MFLNRO Mackenzie District 2012
Regeneration Data RESULTS(Reporting Silviculture Updates and Landstatus Tracking
System)
2011
Kaska Traditional Territory MFLNRO Mackenzie District 2012
Mackenzie TSA TSR Data Package September 2012
7
Data source and comments:
Ownership is a custom layer created by Forest Analysis and Inventory Branch using information from the
Crown Land Registry and the Integrated Cadastral Information Society. It includes woodlot licences and
community forest licences (which have their AACs set outside of the timber supply review process for TSAs),
UREP/recreation reserves, private lands, federal lands, Indian Reserves, and parks and protected areas.
Despite the fact that the photography upon which the inventory is based was acquired as far back as 1956 in
some areas of the TSA, 67% of the TSA has photography acquired between 1999 and 2010. This photography
covers the southern two thirds of the TSA. Using a growth model, the inventory attributes have been projected
to 2011. The inventory is updated for recent harvest and fire using a forest cover depletion layer created from
RESULTS openings and harvest history and a remote sensing change detection layer.
Provincial managed stand site productivity mapping will be used to assign site indices to managed stands.
Terrain stability mapping only existed for a small area along the eastern boundary of the TSA, south of the
Peace Arm of Williston Lake.
In the absence of terrain stability data slope data from GEOBC’s digital elevation model (DEM) used in
conjunction with the location of existing cutblocks to determine the maximum slopes that licensees have
historically logged.
Existing Roads, Rail, Power Lines and airstrips are required as they form part of the non-forested portion of the
TSA. The roads are also used to help estimate future roading requirements for harvesting.
Wildlife habitat areas and ungulate winter ranges are mapped and established by Ministry of Environment and
have various harvest restrictions within them.
High value grizzly habitat mapping and caribou migration corridor mapping commissioned by FLNRO staff will
be used in sensitivity analyses to determine the impact on timber supply of implementing best management
practices with regard to these species.
Visual landscape inventory identifies areas to be managed using visual quality objectives. Slope data from
GEOBC’s DEM are used to determine the maximum allowable disturbance for each area.
Old growth management areas (OGMAs) established in 2010 through the Sustainable Resource Management
Plan (SRMP) will be accounted for in the analysis. The OGMA’s represent ‘old seral’ requirements of the
SRMP for the following landscape units or landscape unit groups: Twenty Mile, Gaffney-Manson River,
Misinchinka-Tudyah B, Gillis-Klawli, Parsnip, Connaghan Creek-Eklund-Jackfish South Germansen-Upper
Manson and Kennedy. Old seral requirements for the remaining landscape units within the TSA will be
modeled in accordance to the Amendment Order for the Non-spatial Landscape Biodiversity Objectives in the
Mackenzie Forest District signed September 23, 2010.
Landscape unit (LU) and Biogeoclimatic ecosystem classification (BEC) mapping will be used to implement the
Non-spatial Landscape Biodiversity objectives within the forest estate model.
Assessment watersheds will be used to control and monitor the model runs at a finer scale than a landscape unit.
They will be managed to track the impact of harvesting on grizzly bear habitat.
Estimates of the extent, severity and timing of the mountain pine beetle epidemic (MPB) provided by the
Mackenzie Resource District will be used to represent the impacts dues to MPB.
Mackenzie TSA TSR Data Package September 2012
8
4. Division of the Area into Management Zones
4.1. Management zones and objectives
Management zones are used to differentiate areas with distinct management emphasis. For example, a zone may
be based on a harvesting or silviculture system, visual quality objective or wildlife consideration. Sometimes an
area of forest is subject to more than one management objective. In the timber supply model, each type of zone
can be tracked separately, thereby allowing application of overlapping management objectives. Forest land that
is unavailable for timber harvesting may contribute toward meeting objectives for other forest values.
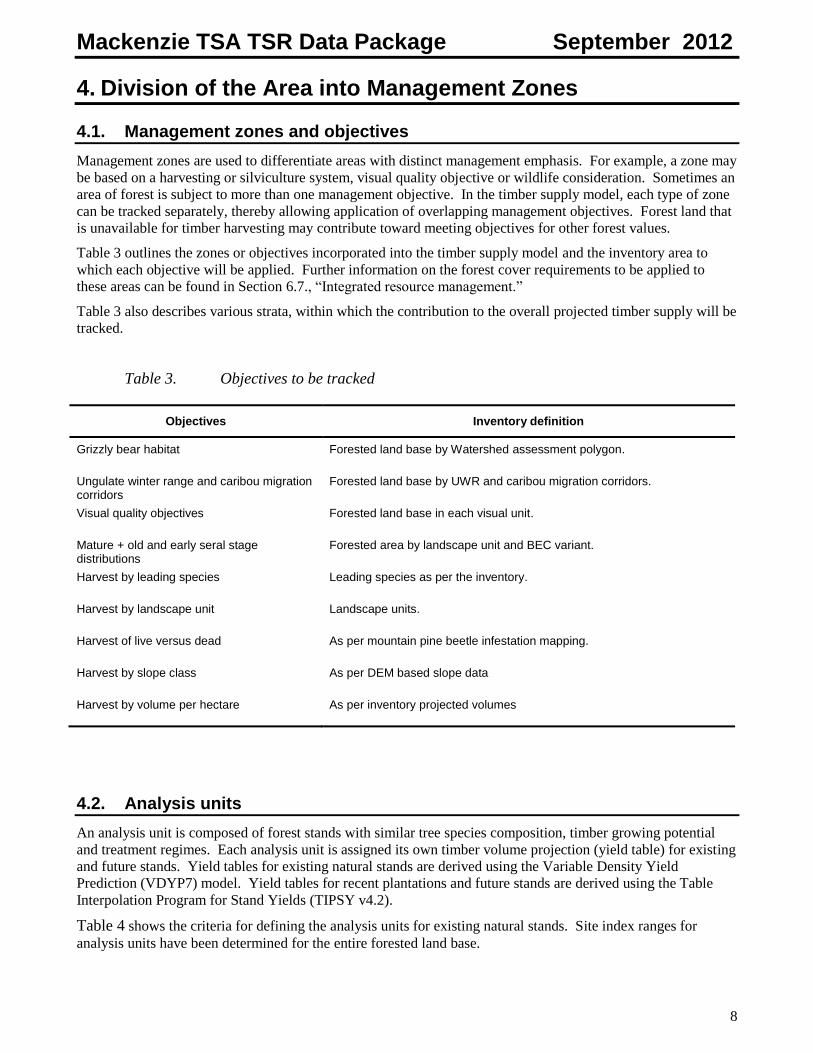
Table 3 outlines the zones or objectives incorporated into the timber supply model and the inventory area to
which each objective will be applied. Further information on the forest cover requirements to be applied to
these areas can be found in Section 6.7., “Integrated resource management.”
Table 3 also describes various strata, within which the contribution to the overall projected timber supply will be
tracked.
Table 3. Objectives to be tracked
Objectives Inventory definition
Grizzly bear habitat Forested land base by Watershed assessment polygon.
Ungulate winter range and caribou migration corridors
Forested land base by UWR and caribou migration corridors.
Visual quality objectives Forested land base in each visual unit.
Mature + old and early seral stage distributions
Forested area by landscape unit and BEC variant.
Harvest by leading species Leading species as per the inventory.
Harvest by landscape unit Landscape units.
Harvest of live versus dead As per mountain pine beetle infestation mapping.
Harvest by slope class As per DEM based slope data
Harvest by volume per hectare As per inventory projected volumes
4.2. Analysis units
An analysis unit is composed of forest stands with similar tree species composition, timber growing potential
and treatment regimes. Each analysis unit is assigned its own timber volume projection (yield table) for existing
and future stands. Yield tables for existing natural stands are derived using the Variable Density Yield
Prediction (VDYP7) model. Yield tables for recent plantations and future stands are derived using the Table
Interpolation Program for Stand Yields (TIPSY v4.2).
Table 4 shows the criteria for defining the analysis units for existing natural stands. Site index ranges for
analysis units have been determined for the entire forested land base.
Mackenzie TSA TSR Data Package September 2012
9
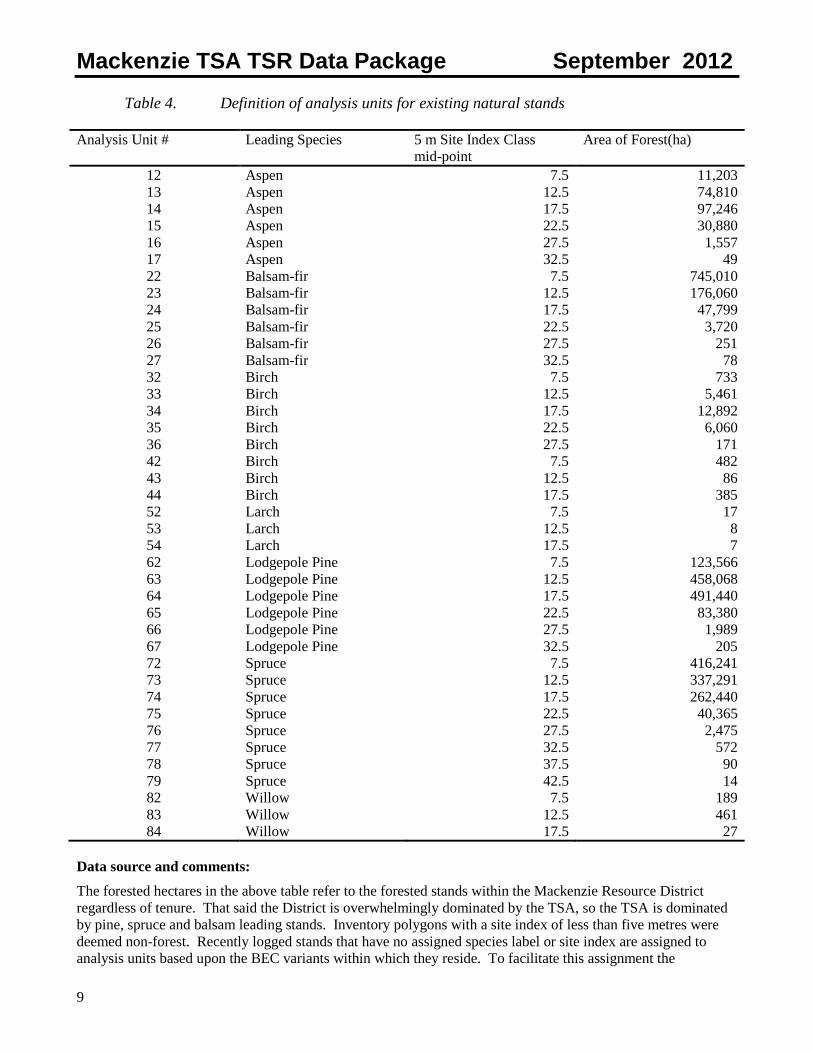
Table 4. Definition of analysis units for existing natural stands
Analysis Unit # Leading Species 5 m Site Index Class
mid-point
Area of Forest(ha)
12 Aspen 7.5 11,203
13 Aspen 12.5 74,810
14 Aspen 17.5 97,246
15 Aspen 22.5 30,880
16 Aspen 27.5 1,557
17 Aspen 32.5 49
22 Balsam-fir 7.5 745,010
23 Balsam-fir 12.5 176,060
24 Balsam-fir 17.5 47,799
25 Balsam-fir 22.5 3,720
26 Balsam-fir 27.5 251
27 Balsam-fir 32.5 78
32 Birch 7.5 733
33 Birch 12.5 5,461
34 Birch 17.5 12,892
35 Birch 22.5 6,060
36 Birch 27.5 171
42 Birch 7.5 482
43 Birch 12.5 86
44 Birch 17.5 385
52 Larch 7.5 17
53 Larch 12.5 8
54 Larch 17.5 7
62 Lodgepole Pine 7.5 123,566
63 Lodgepole Pine 12.5 458,068
64 Lodgepole Pine 17.5 491,440
65 Lodgepole Pine 22.5 83,380
66 Lodgepole Pine 27.5 1,989
67 Lodgepole Pine 32.5 205
72 Spruce 7.5 416,241
73 Spruce 12.5 337,291
74 Spruce 17.5 262,440
75 Spruce 22.5 40,365
76 Spruce 27.5 2,475
77 Spruce 32.5 572
78 Spruce 37.5 90
79 Spruce 42.5 14
82 Willow 7.5 189
83 Willow 12.5 461
84 Willow 17.5 27
Data source and comments:
The forested hectares in the above table refer to the forested stands within the Mackenzie Resource District
regardless of tenure. That said the District is overwhelmingly dominated by the TSA, so the TSA is dominated
by pine, spruce and balsam leading stands. Inventory polygons with a site index of less than five metres were
deemed non-forest. Recently logged stands that have no assigned species label or site index are assigned to
analysis units based upon the BEC variants within which they reside. To facilitate this assignment the
Mackenzie TSA TSR Data Package September 2012
10
predominant leading species by BEC variant was determined and an area weighted site index calculated for each
variant.
Analysis units have been created for both ‘natural stands’, and ‘managed stands’. It has been assumed that
existing ‘natural stands’ will regenerate as ‘managed stands’ if harvested and will remain as ‘natural stands’ if
disturbed by a natural agent and are not salvaged.
The same assumption applies to ‘managed stands’. If harvested they will regenerate to ‘managed stands’. If
attacked by a natural agent and not salvaged they will revert back to ‘natural stands’.
The definition of managed stand analysis units are described in Section 6.6.1., “Regeneration activities”.
5. Timber Harvesting Land Base Definition
This part of the data package outlines the steps used to identify the Crown forested land base and the timber
harvesting land base (THLB). The Crown forested land base consists of provincial Crown land with forest
cover that is either available for harvest or satisfies a non-timber objective. The Crown forested land base
excludes:
community forests;
tree farm licences;
woodlot licences;
federal lands; and
private lands.
The THLB is that portion of the Crown forested land base that is available for timber harvesting. The THLB
excludes:
parks and protected areas;
areas that are not suitable for timber production; and
areas where timber harvesting is incompatible with management objectives for other resource values.
Land is considered outside the THLB only where harvesting is not expected to occur. Any area in which some
timber harvesting will occur remains in the THLB, even if the area is subject to other management objectives,
such as wildlife habitat and biodiversity. These objectives are modelled in the timber supply analysis. The
Crown forested land base outside of the THLB contributes to these non-timber objectives.
Land may be added to the THLB in the following situations:
where management activities improve productivity or operability (e.g., the stocking of land currently
classified as non-commercial brush with commercial tree species);
through the acquisition of productive forest land (e.g., timber licence reversions).
After identifying all areas that are not part of the THLB, any additional lands are added to the THLB. The result
defines the current timber harvesting land base.
Mackenzie TSA TSR Data Package September 2012
11
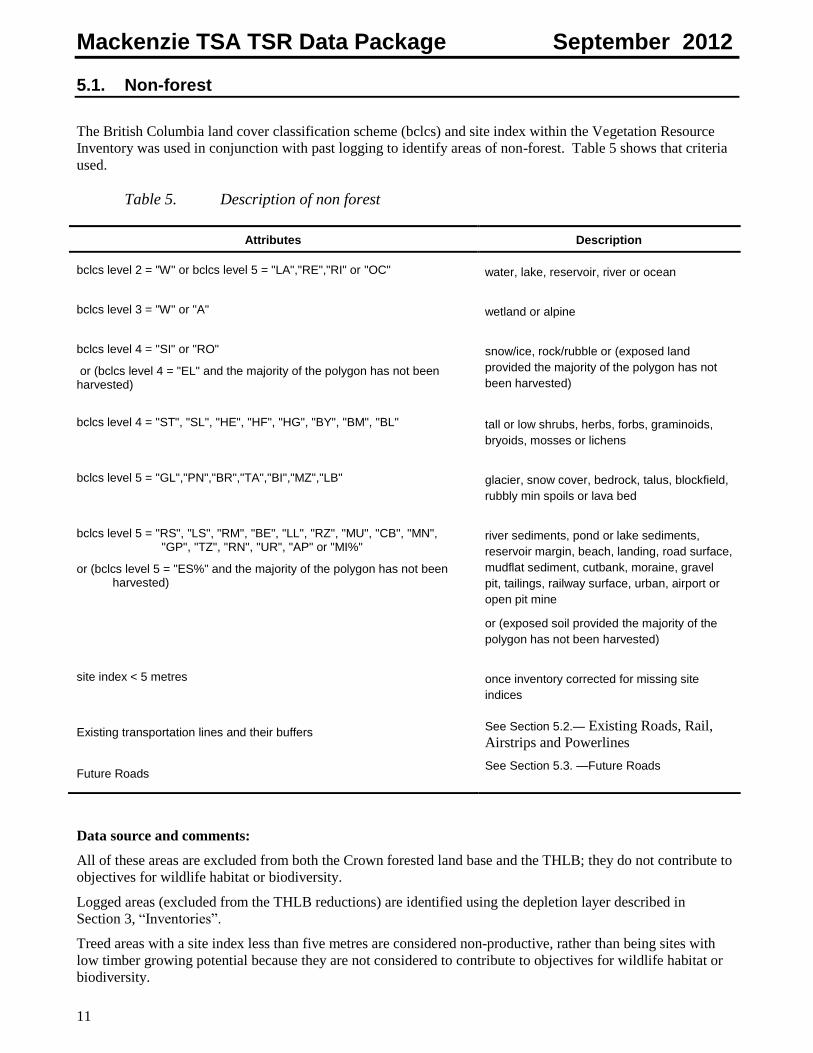
5.1. Non-forest
The British Columbia land cover classification scheme (bclcs) and site index within the Vegetation Resource
Inventory was used in conjunction with past logging to identify areas of non-forest. Table 5 shows that criteria
used.
Table 5. Description of non forest
Attributes Description
bclcs level 2 = "W" or bclcs level 5 = "LA","RE","RI" or "OC" water, lake, reservoir, river or ocean
bclcs level 3 = "W" or "A" wetland or alpine
bclcs level 4 = "SI" or "RO"
or (bclcs level 4 = "EL" and the majority of the polygon has not been harvested)
snow/ice, rock/rubble or (exposed land
provided the majority of the polygon has not
been harvested)
bclcs level 4 = "ST", "SL", "HE", "HF", "HG", "BY", "BM", "BL" tall or low shrubs, herbs, forbs, graminoids,
bryoids, mosses or lichens
bclcs level 5 = "GL","PN","BR","TA","BI","MZ","LB" glacier, snow cover, bedrock, talus, blockfield,
rubbly min spoils or lava bed
bclcs level 5 = "RS", "LS", "RM", "BE", "LL", "RZ", "MU", "CB", "MN", "GP", "TZ", "RN", "UR", "AP" or "MI%"
or (bclcs level 5 = "ES%" and the majority of the polygon has not been harvested)
river sediments, pond or lake sediments,
reservoir margin, beach, landing, road surface,
mudflat sediment, cutbank, moraine, gravel
pit, tailings, railway surface, urban, airport or
open pit mine
or (exposed soil provided the majority of the
polygon has not been harvested)
site index < 5 metres once inventory corrected for missing site
indices
Existing transportation lines and their buffers See Section 5.2.— Existing Roads, Rail,
Airstrips and Powerlines
Future Roads See Section 5.3. —Future Roads
Data source and comments:
All of these areas are excluded from both the Crown forested land base and the THLB; they do not contribute to
objectives for wildlife habitat or biodiversity.
Logged areas (excluded from the THLB reductions) are identified using the depletion layer described in
Section 3, “Inventories”.
Treed areas with a site index less than five metres are considered non-productive, rather than being sites with
low timber growing potential because they are not considered to contribute to objectives for wildlife habitat or
biodiversity.
Mackenzie TSA TSR Data Package September 2012
12
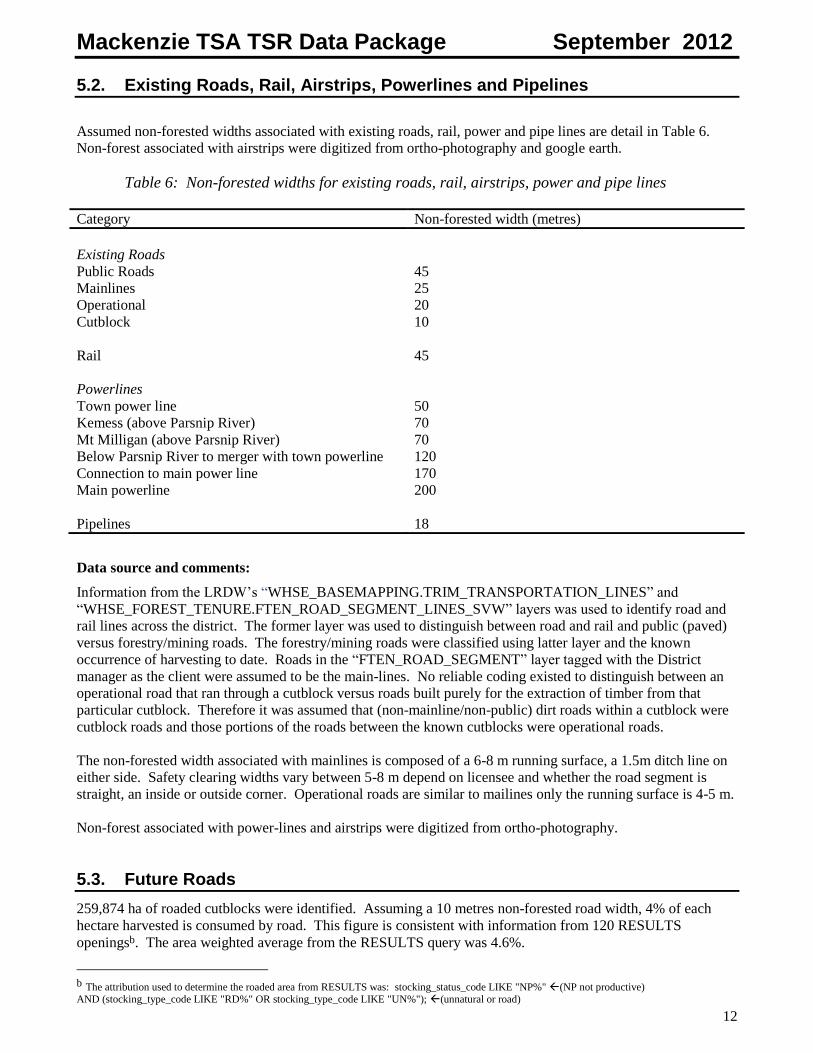
5.2. Existing Roads, Rail, Airstrips, Powerlines and Pipelines
Assumed non-forested widths associated with existing roads, rail, power and pipe lines are detail in Table 6.
Non-forest associated with airstrips were digitized from ortho-photography and google earth.
Table 6: Non-forested widths for existing roads, rail, airstrips, power and pipe lines
Category Non-forested width (metres)
Existing Roads
Public Roads 45
Mainlines 25
Operational 20
Cutblock 10
Rail 45
Powerlines
Town power line 50
Kemess (above Parsnip River) 70
Mt Milligan (above Parsnip River) 70
Below Parsnip River to merger with town powerline 120
Connection to main power line 170
Main powerline 200
Pipelines 18
Data source and comments:
Information from the LRDW’s “WHSE_BASEMAPPING.TRIM_TRANSPORTATION_LINES” and
“WHSE_FOREST_TENURE.FTEN_ROAD_SEGMENT_LINES_SVW” layers was used to identify road and
rail lines across the district. The former layer was used to distinguish between road and rail and public (paved)
versus forestry/mining roads. The forestry/mining roads were classified using latter layer and the known
occurrence of harvesting to date. Roads in the “FTEN_ROAD_SEGMENT” layer tagged with the District
manager as the client were assumed to be the main-lines. No reliable coding existed to distinguish between an
operational road that ran through a cutblock versus roads built purely for the extraction of timber from that
particular cutblock. Therefore it was assumed that (non-mainline/non-public) dirt roads within a cutblock were
cutblock roads and those portions of the roads between the known cutblocks were operational roads.
The non-forested width associated with mainlines is composed of a 6-8 m running surface, a 1.5m ditch line on
either side. Safety clearing widths vary between 5-8 m depend on licensee and whether the road segment is
straight, an inside or outside corner. Operational roads are similar to mailines only the running surface is 4-5 m.
Non-forest associated with power-lines and airstrips were digitized from ortho-photography.
5.3. Future Roads
259,874 ha of roaded cutblocks were identified. Assuming a 10 metres non-forested road width, 4% of each
hectare harvested is consumed by road. This figure is consistent with information from 120 RESULTS
openingsb. The area weighted average from the RESULTS query was 4.6%.
b The attribution used to determine the roaded area from RESULTS was: stocking_status_code LIKE "NP%" (NP not productive) AND (stocking_type_code LIKE "RD%" OR stocking_type_code LIKE "UN%"); (unnatural or road)
Mackenzie TSA TSR Data Package September 2012
13
This 4% reduction will be made for that portion of the THLB in excess of 300 metres from the existing road
network upon first harvest. After harvest this area would then be classified as non-forest.
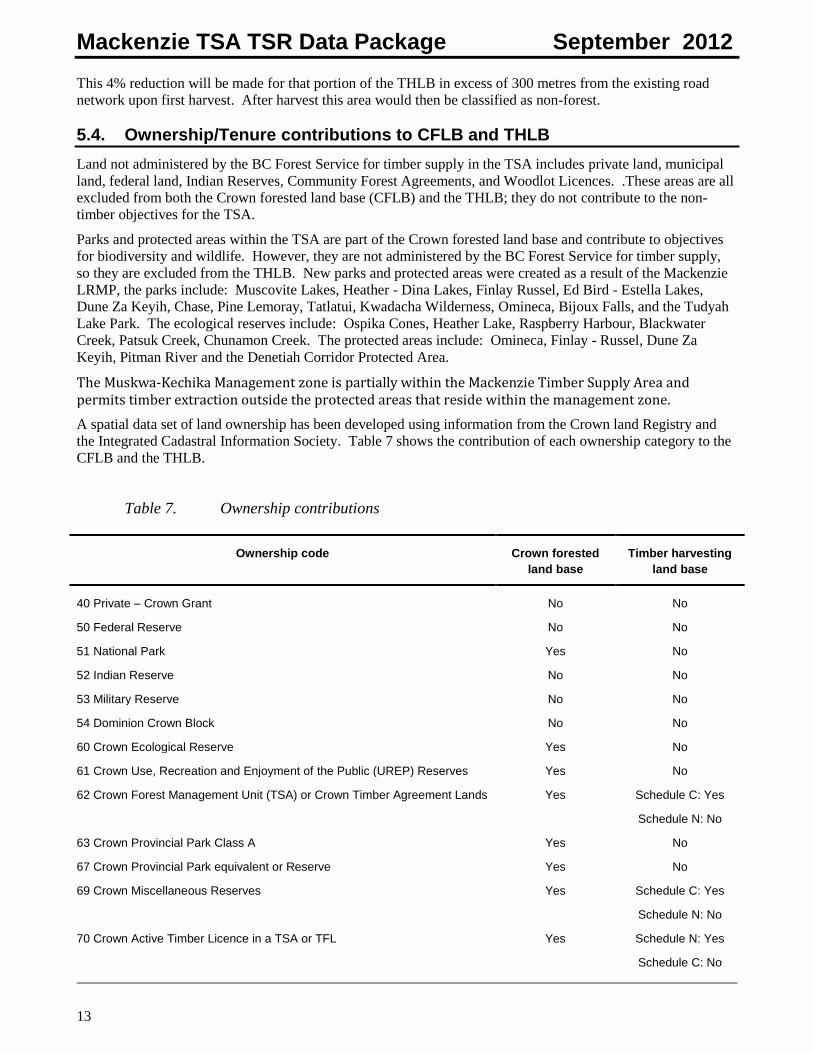
5.4. Ownership/Tenure contributions to CFLB and THLB
Land not administered by the BC Forest Service for timber supply in the TSA includes private land, municipal
land, federal land, Indian Reserves, Community Forest Agreements, and Woodlot Licences. .These areas are all
excluded from both the Crown forested land base (CFLB) and the THLB; they do not contribute to the non-
timber objectives for the TSA.
Parks and protected areas within the TSA are part of the Crown forested land base and contribute to objectives
for biodiversity and wildlife. However, they are not administered by the BC Forest Service for timber supply,
so they are excluded from the THLB. New parks and protected areas were created as a result of the Mackenzie
LRMP, the parks include: Muscovite Lakes, Heather - Dina Lakes, Finlay Russel, Ed Bird - Estella Lakes,
Dune Za Keyih, Chase, Pine Lemoray, Tatlatui, Kwadacha Wilderness, Omineca, Bijoux Falls, and the Tudyah
Lake Park. The ecological reserves include: Ospika Cones, Heather Lake, Raspberry Harbour, Blackwater
Creek, Patsuk Creek, Chunamon Creek. The protected areas include: Omineca, Finlay - Russel, Dune Za
Keyih, Pitman River and the Denetiah Corridor Protected Area.
The Muskwa-Kechika Management zone is partially within the Mackenzie Timber Supply Area and permits timber extraction outside the protected areas that reside within the management zone.
A spatial data set of land ownership has been developed using information from the Crown land Registry and
the Integrated Cadastral Information Society. Table 7 shows the contribution of each ownership category to the
CFLB and the THLB.
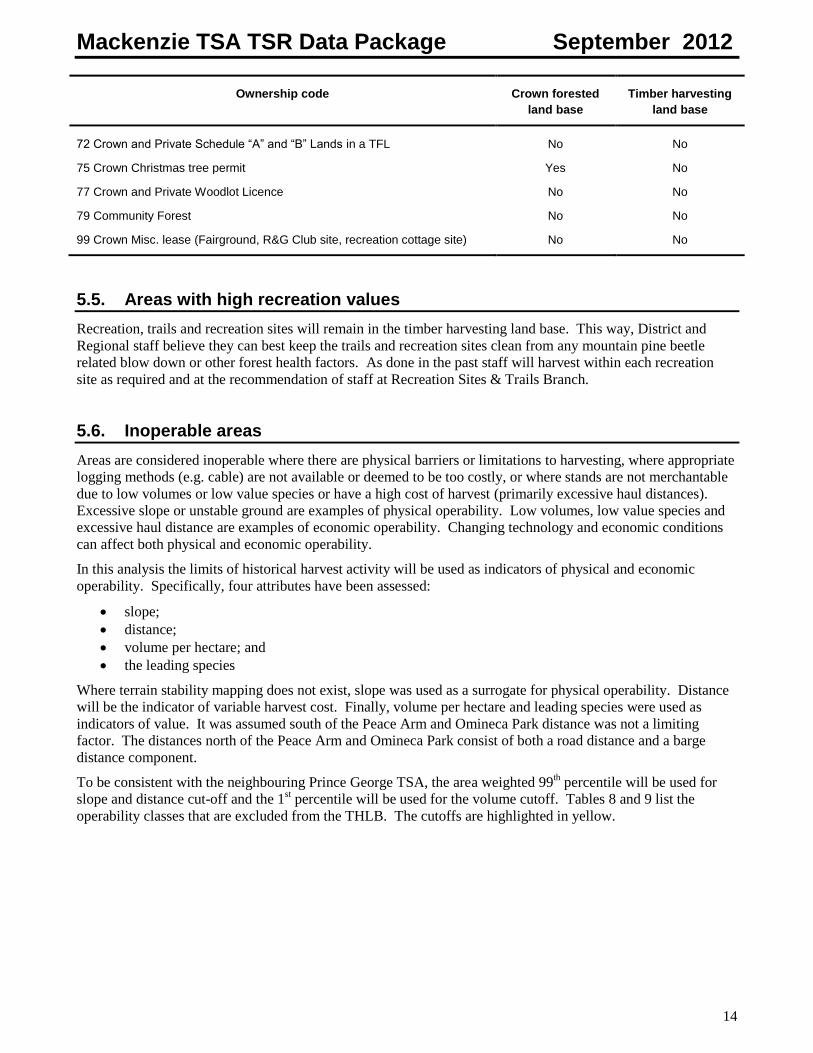
Table 7. Ownership contributions
Ownership code Crown forested
land base
Timber harvesting
land base
40 Private – Crown Grant No No
50 Federal Reserve No No
51 National Park Yes No
52 Indian Reserve No No
53 Military Reserve No No
54 Dominion Crown Block No No
60 Crown Ecological Reserve Yes No
61 Crown Use, Recreation and Enjoyment of the Public (UREP) Reserves Yes No
62 Crown Forest Management Unit (TSA) or Crown Timber Agreement Lands Yes Schedule C: Yes
Schedule N: No
63 Crown Provincial Park Class A Yes No
67 Crown Provincial Park equivalent or Reserve Yes No
69 Crown Miscellaneous Reserves Yes Schedule C: Yes
Schedule N: No
70 Crown Active Timber Licence in a TSA or TFL Yes Schedule N: Yes
Schedule C: No
Mackenzie TSA TSR Data Package September 2012
14
Ownership code Crown forested
land base
Timber harvesting
land base
72 Crown and Private Schedule “A” and “B” Lands in a TFL No No
75 Crown Christmas tree permit Yes No
77 Crown and Private Woodlot Licence No No
79 Community Forest No No
99 Crown Misc. lease (Fairground, R&G Club site, recreation cottage site) No No
5.5. Areas with high recreation values
Recreation, trails and recreation sites will remain in the timber harvesting land base. This way, District and
Regional staff believe they can best keep the trails and recreation sites clean from any mountain pine beetle
related blow down or other forest health factors. As done in the past staff will harvest within each recreation
site as required and at the recommendation of staff at Recreation Sites & Trails Branch.
5.6. Inoperable areas
Areas are considered inoperable where there are physical barriers or limitations to harvesting, where appropriate
logging methods (e.g. cable) are not available or deemed to be too costly, or where stands are not merchantable
due to low volumes or low value species or have a high cost of harvest (primarily excessive haul distances).
Excessive slope or unstable ground are examples of physical operability. Low volumes, low value species and
excessive haul distance are examples of economic operability. Changing technology and economic conditions
can affect both physical and economic operability.
In this analysis the limits of historical harvest activity will be used as indicators of physical and economic
operability. Specifically, four attributes have been assessed:
slope;
distance;
volume per hectare; and
the leading species
Where terrain stability mapping does not exist, slope was used as a surrogate for physical operability. Distance
will be the indicator of variable harvest cost. Finally, volume per hectare and leading species were used as
indicators of value. It was assumed south of the Peace Arm and Omineca Park distance was not a limiting
factor. The distances north of the Peace Arm and Omineca Park consist of both a road distance and a barge
distance component.
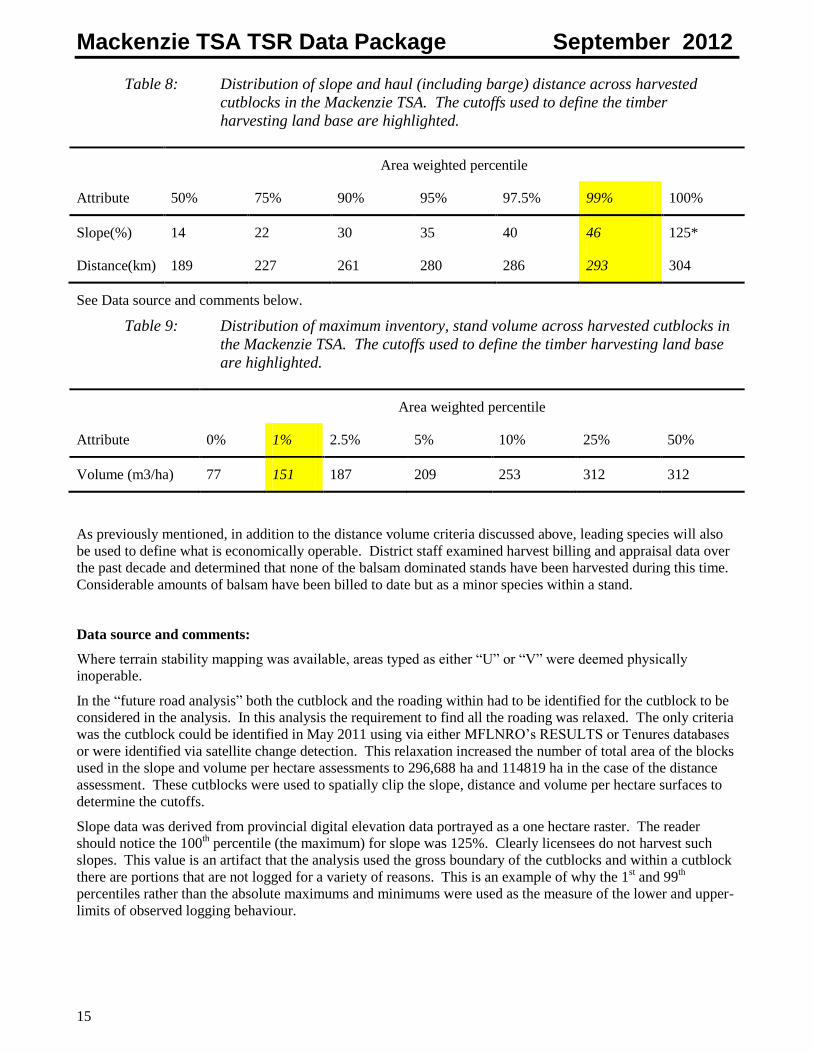
To be consistent with the neighbouring Prince George TSA, the area weighted 99th percentile will be used for
slope and distance cut-off and the 1st percentile will be used for the volume cutoff. Tables 8 and 9 list the
operability classes that are excluded from the THLB. The cutoffs are highlighted in yellow.
Mackenzie TSA TSR Data Package September 2012
15
Table 8: Distribution of slope and haul (including barge) distance across harvested
cutblocks in the Mackenzie TSA. The cutoffs used to define the timber
harvesting land base are highlighted.
Area weighted percentile
Attribute 50% 75% 90% 95% 97.5% 99% 100%
Slope(%) 14 22 30 35 40 46 125*
Distance(km) 189 227 261 280 286 293 304
See Data source and comments below.
Table 9: Distribution of maximum inventory, stand volume across harvested cutblocks in
the Mackenzie TSA. The cutoffs used to define the timber harvesting land base
are highlighted.
Area weighted percentile
Attribute 0% 1% 2.5% 5% 10% 25% 50%
Volume (m3/ha) 77 151 187 209 253 312 312
As previously mentioned, in addition to the distance volume criteria discussed above, leading species will also
be used to define what is economically operable. District staff examined harvest billing and appraisal data over
the past decade and determined that none of the balsam dominated stands have been harvested during this time.
Considerable amounts of balsam have been billed to date but as a minor species within a stand.
Data source and comments:
Where terrain stability mapping was available, areas typed as either “U” or “V” were deemed physically
inoperable.
In the “future road analysis” both the cutblock and the roading within had to be identified for the cutblock to be
considered in the analysis. In this analysis the requirement to find all the roading was relaxed. The only criteria
was the cutblock could be identified in May 2011 using via either MFLNRO’s RESULTS or Tenures databases
or were identified via satellite change detection. This relaxation increased the number of total area of the blocks
used in the slope and volume per hectare assessments to 296,688 ha and 114819 ha in the case of the distance
assessment. These cutblocks were used to spatially clip the slope, distance and volume per hectare surfaces to
determine the cutoffs.
Slope data was derived from provincial digital elevation data portrayed as a one hectare raster. The reader
should notice the 100th percentile (the maximum) for slope was 125%. Clearly licensees do not harvest such
slopes. This value is an artifact that the analysis used the gross boundary of the cutblocks and within a cutblock
there are portions that are not logged for a variety of reasons. This is an example of why the 1st and 99
th
percentiles rather than the absolute maximums and minimums were used as the measure of the lower and upper-
limits of observed logging behaviour.
Mackenzie TSA TSR Data Package September 2012
16
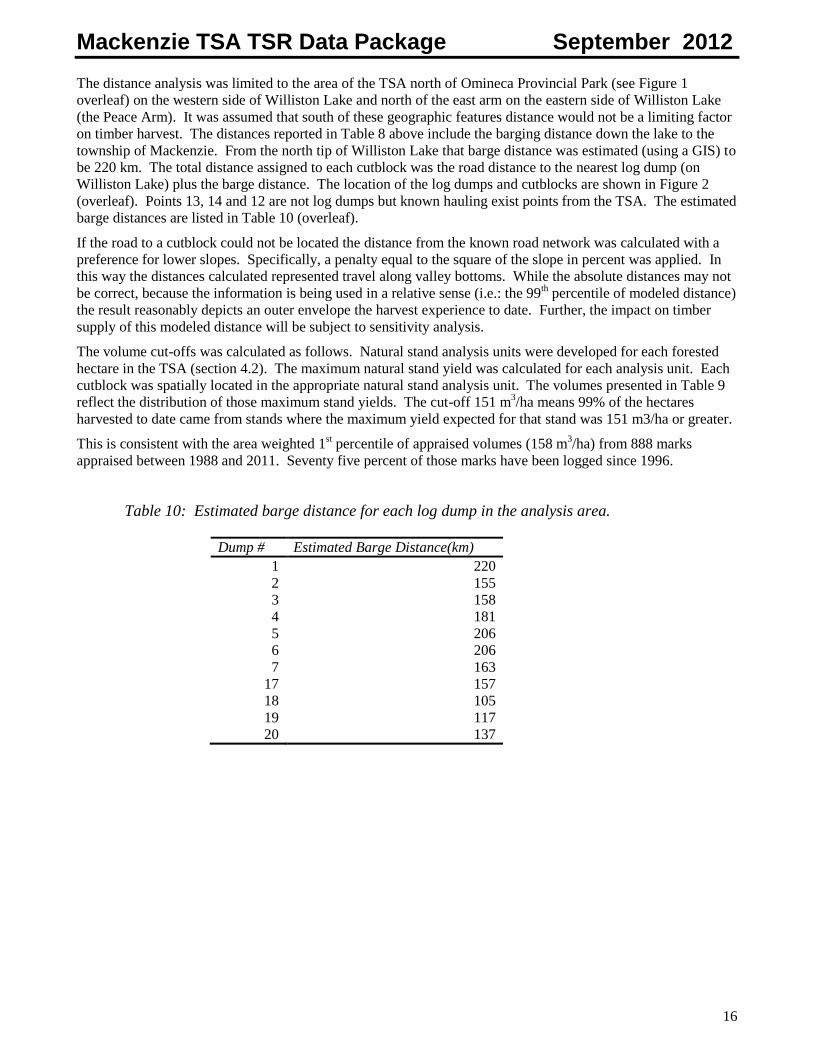
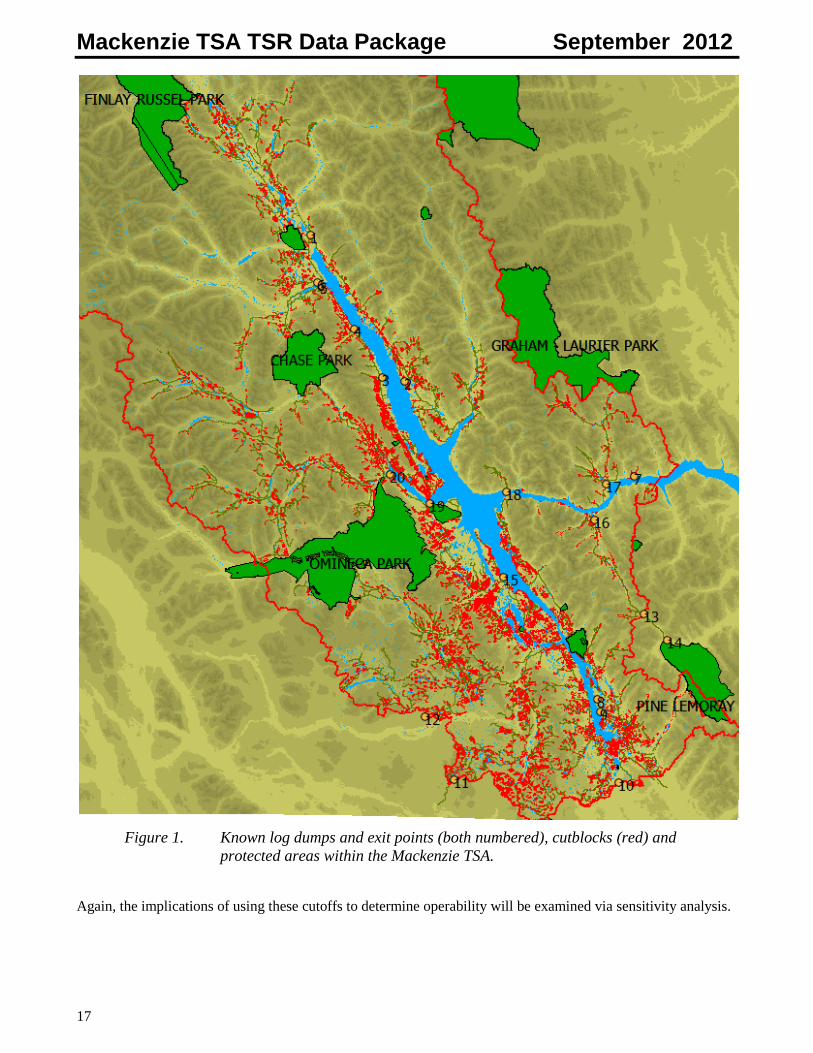
The distance analysis was limited to the area of the TSA north of Omineca Provincial Park (see Figure 1
overleaf) on the western side of Williston Lake and north of the east arm on the eastern side of Williston Lake
(the Peace Arm). It was assumed that south of these geographic features distance would not be a limiting factor
on timber harvest. The distances reported in Table 8 above include the barging distance down the lake to the
township of Mackenzie. From the north tip of Williston Lake that barge distance was estimated (using a GIS) to
be 220 km. The total distance assigned to each cutblock was the road distance to the nearest log dump (on
Williston Lake) plus the barge distance. The location of the log dumps and cutblocks are shown in Figure 2
(overleaf). Points 13, 14 and 12 are not log dumps but known hauling exist points from the TSA. The estimated
barge distances are listed in Table 10 (overleaf).
If the road to a cutblock could not be located the distance from the known road network was calculated with a
preference for lower slopes. Specifically, a penalty equal to the square of the slope in percent was applied. In
this way the distances calculated represented travel along valley bottoms. While the absolute distances may not
be correct, because the information is being used in a relative sense (i.e.: the 99th percentile of modeled distance)
the result reasonably depicts an outer envelope the harvest experience to date. Further, the impact on timber
supply of this modeled distance will be subject to sensitivity analysis.
The volume cut-offs was calculated as follows. Natural stand analysis units were developed for each forested
hectare in the TSA (section 4.2). The maximum natural stand yield was calculated for each analysis unit. Each
cutblock was spatially located in the appropriate natural stand analysis unit. The volumes presented in Table 9
reflect the distribution of those maximum stand yields. The cut-off 151 m3/ha means 99% of the hectares
harvested to date came from stands where the maximum yield expected for that stand was 151 m3/ha or greater.
This is consistent with the area weighted 1st percentile of appraised volumes (158 m
3/ha) from 888 marks
appraised between 1988 and 2011. Seventy five percent of those marks have been logged since 1996.
Table 10: Estimated barge distance for each log dump in the analysis area.
Dump # Estimated Barge Distance(km)
1 220
2 155
3 158
4 181
5 206
6 206
7 163
17 157
18 105
19 117
20 137
Mackenzie TSA TSR Data Package September 2012
17
Figure 1. Known log dumps and exit points (both numbered), cutblocks (red) and
protected areas within the Mackenzie TSA.
Again, the implications of using these cutoffs to determine operability will be examined via sensitivity analysis.
Mackenzie TSA TSR Data Package September 2012
18
5.7. Problem forest types
Unlike previous Timber Supply reviews there is no specific accounting for problem forest types. It is believed
they have been adequately accounted using the criteria to define inoperable areas (section 5.6).
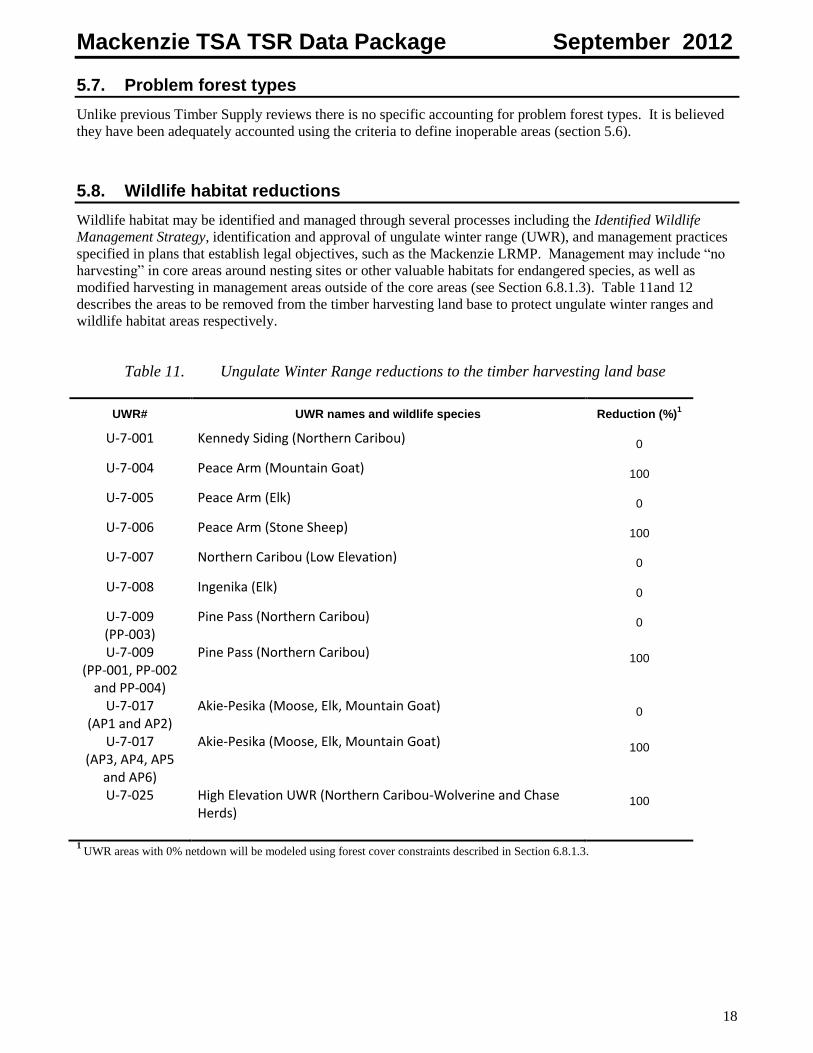
5.8. Wildlife habitat reductions
Wildlife habitat may be identified and managed through several processes including the Identified Wildlife
Management Strategy, identification and approval of ungulate winter range (UWR), and management practices
specified in plans that establish legal objectives, such as the Mackenzie LRMP. Management may include “no
harvesting” in core areas around nesting sites or other valuable habitats for endangered species, as well as
modified harvesting in management areas outside of the core areas (see Section 6.8.1.3). Table 11and 12
describes the areas to be removed from the timber harvesting land base to protect ungulate winter ranges and
wildlife habitat areas respectively.
Table 11. Ungulate Winter Range reductions to the timber harvesting land base
UWR# UWR names and wildlife species Reduction (%)1
U-7-001 Kennedy Siding (Northern Caribou) 0
U-7-004 Peace Arm (Mountain Goat) 100
U-7-005 Peace Arm (Elk) 0
U-7-006 Peace Arm (Stone Sheep) 100
U-7-007 Northern Caribou (Low Elevation) 0
U-7-008 Ingenika (Elk) 0
U-7-009 (PP-003)
Pine Pass (Northern Caribou)
0
U-7-009 (PP-001, PP-002
and PP-004)
Pine Pass (Northern Caribou)
100
U-7-017 (AP1 and AP2)
Akie-Pesika (Moose, Elk, Mountain Goat)
0
U-7-017 (AP3, AP4, AP5
and AP6)
Akie-Pesika (Moose, Elk, Mountain Goat)
100
U-7-025 High Elevation UWR (Northern Caribou-Wolverine and Chase Herds)
100
1 UWR areas with 0% netdown will be modeled using forest cover constraints described in Section 6.8.1.3.
Mackenzie TSA TSR Data Package September 2012
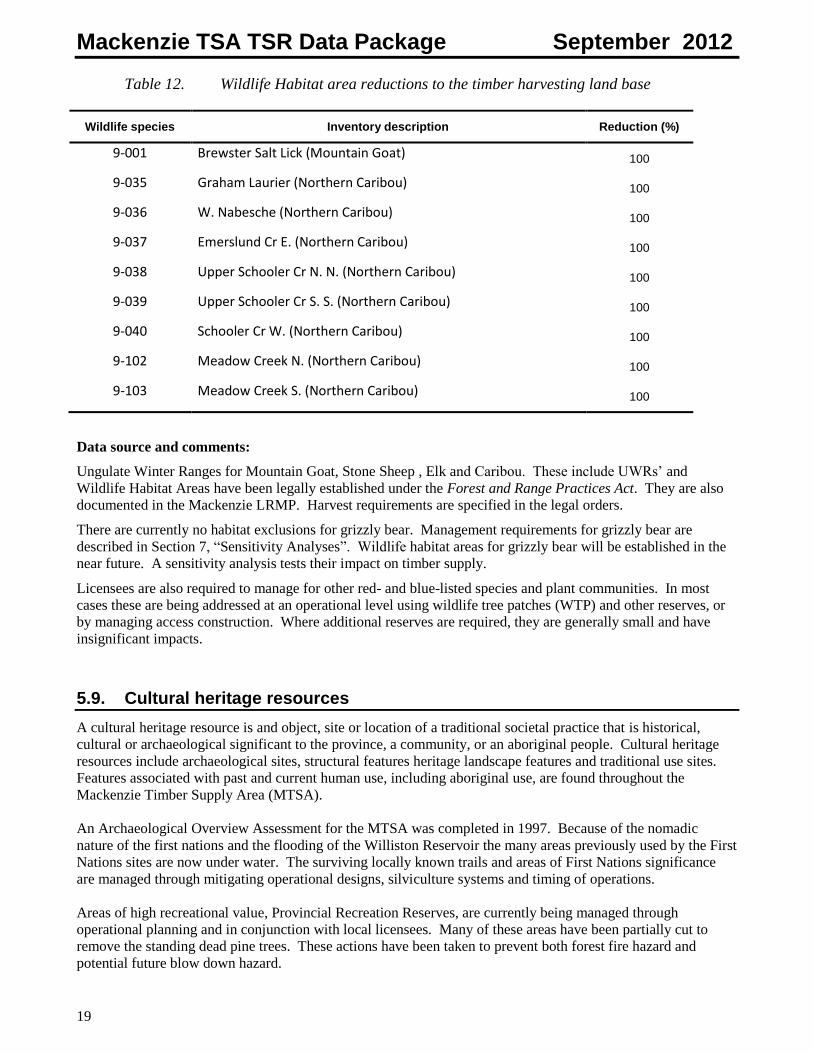
19
Table 12. Wildlife Habitat area reductions to the timber harvesting land base
Wildlife species Inventory description Reduction (%)
9-001 Brewster Salt Lick (Mountain Goat) 100
9-035 Graham Laurier (Northern Caribou) 100
9-036 W. Nabesche (Northern Caribou) 100
9-037 Emerslund Cr E. (Northern Caribou) 100
9-038 Upper Schooler Cr N. N. (Northern Caribou) 100
9-039 Upper Schooler Cr S. S. (Northern Caribou) 100
9-040 Schooler Cr W. (Northern Caribou) 100
9-102 Meadow Creek N. (Northern Caribou) 100
9-103 Meadow Creek S. (Northern Caribou) 100
Data source and comments:
Ungulate Winter Ranges for Mountain Goat, Stone Sheep , Elk and Caribou. These include UWRs’ and
Wildlife Habitat Areas have been legally established under the Forest and Range Practices Act. They are also
documented in the Mackenzie LRMP. Harvest requirements are specified in the legal orders.
There are currently no habitat exclusions for grizzly bear. Management requirements for grizzly bear are
described in Section 7, “Sensitivity Analyses”. Wildlife habitat areas for grizzly bear will be established in the
near future. A sensitivity analysis tests their impact on timber supply.
Licensees are also required to manage for other red- and blue-listed species and plant communities. In most
cases these are being addressed at an operational level using wildlife tree patches (WTP) and other reserves, or
by managing access construction. Where additional reserves are required, they are generally small and have
insignificant impacts.
5.9. Cultural heritage resources
A cultural heritage resource is and object, site or location of a traditional societal practice that is historical,
cultural or archaeological significant to the province, a community, or an aboriginal people. Cultural heritage
resources include archaeological sites, structural features heritage landscape features and traditional use sites.
Features associated with past and current human use, including aboriginal use, are found throughout the
Mackenzie Timber Supply Area (MTSA).
An Archaeological Overview Assessment for the MTSA was completed in 1997. Because of the nomadic
nature of the first nations and the flooding of the Williston Reservoir the many areas previously used by the First
Nations sites are now under water. The surviving locally known trails and areas of First Nations significance
are managed through mitigating operational designs, silviculture systems and timing of operations.
Areas of high recreational value, Provincial Recreation Reserves, are currently being managed through
operational planning and in conjunction with local licensees. Many of these areas have been partially cut to
remove the standing dead pine trees. These actions have been taken to prevent both forest fire hazard and
potential future blow down hazard.
Mackenzie TSA TSR Data Package September 2012
20
With the limited amount of area associated with the cultural resources negligible impact is foreseen on the
timber harvesting land base.
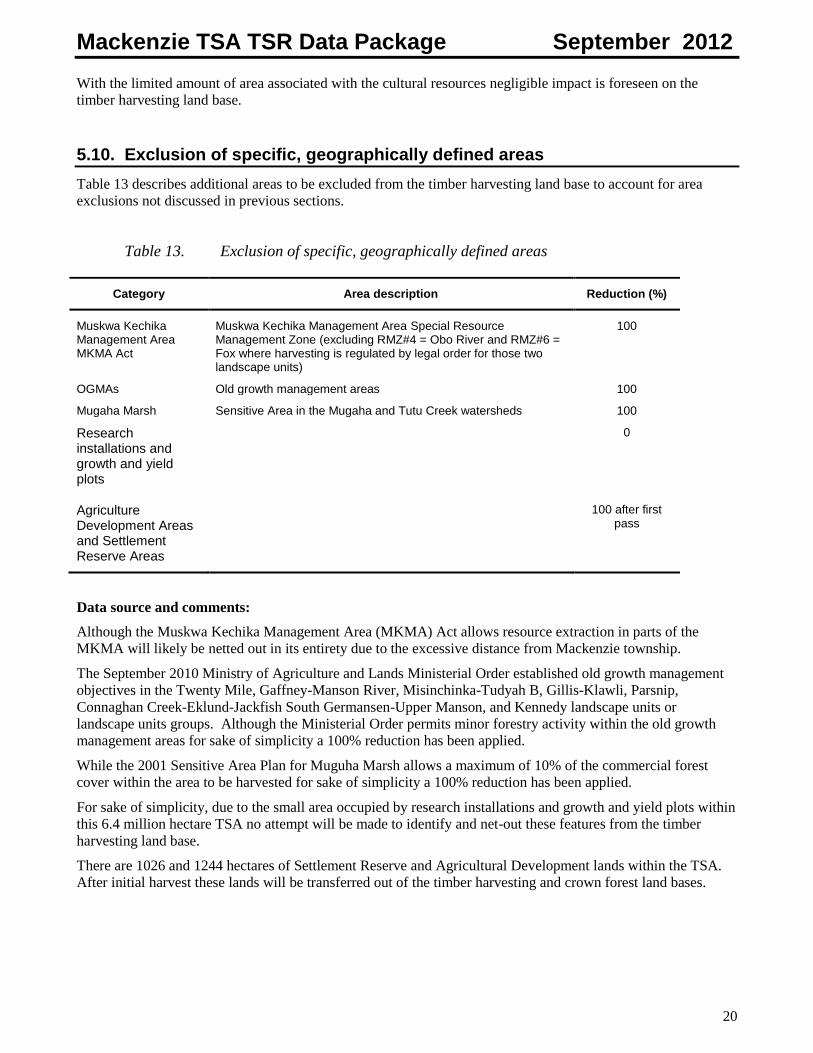
5.10. Exclusion of specific, geographically defined areas
Table 13 describes additional areas to be excluded from the timber harvesting land base to account for area
exclusions not discussed in previous sections.
Table 13. Exclusion of specific, geographically defined areas
Category Area description Reduction (%)
Muskwa Kechika Management Area MKMA Act
Muskwa Kechika Management Area Special Resource Management Zone (excluding RMZ#4 = Obo River and RMZ#6 = Fox where harvesting is regulated by legal order for those two landscape units)
100
OGMAs Old growth management areas 100
Mugaha Marsh Sensitive Area in the Mugaha and Tutu Creek watersheds 100
Research installations and growth and yield plots
0
Agriculture Development Areas and Settlement Reserve Areas
100 after first pass
Data source and comments:
Although the Muskwa Kechika Management Area (MKMA) Act allows resource extraction in parts of the
MKMA will likely be netted out in its entirety due to the excessive distance from Mackenzie township.
The September 2010 Ministry of Agriculture and Lands Ministerial Order established old growth management
objectives in the Twenty Mile, Gaffney-Manson River, Misinchinka-Tudyah B, Gillis-Klawli, Parsnip,
Connaghan Creek-Eklund-Jackfish South Germansen-Upper Manson, and Kennedy landscape units or
landscape units groups. Although the Ministerial Order permits minor forestry activity within the old growth
management areas for sake of simplicity a 100% reduction has been applied.
While the 2001 Sensitive Area Plan for Muguha Marsh allows a maximum of 10% of the commercial forest
cover within the area to be harvested for sake of simplicity a 100% reduction has been applied.
For sake of simplicity, due to the small area occupied by research installations and growth and yield plots within
this 6.4 million hectare TSA no attempt will be made to identify and net-out these features from the timber
harvesting land base.
There are 1026 and 1244 hectares of Settlement Reserve and Agricultural Development lands within the TSA.
After initial harvest these lands will be transferred out of the timber harvesting and crown forest land bases.
Mackenzie TSA TSR Data Package September 2012
21
5.11. Riparian reserve and management areas and wildlife tree patches
Under the Forest and Range Practices Act, Forest Planning and Practices Regulation there are specified
management requirements for riparian reserve zones and riparian management zones along streams and around
lakes and wetlands. It also details the requirements for wildlife tree retention. The regulation specifies riparian
requirements by stream, wetland and lake class. However, there is no mapping of these classes, making it
impossible to explicitly model those riparian requirements in the Timber Supply Review. Further, areas
excluded from harvesting for riparian purposes can also function as wildlife tree patches.
Given the above problems, Ministry staff decided to consider riparian and wildlife tree requirements by
assessing the total amount of within cut block retention. Two sources of data were used—RESULTS data and
FREP data. FREP is British Columbia’s Forest and Range Evaluation Program led by the Ministry of Forests,
Lands, and Natural Resource Operations (MFLNR) in partnership with the Ministry of Environment (MOE).
The “retention” FREP program surveyed 61 cutblocks within the Mackenzie Resource District and reported out
5.8% of the gross cutblock area as either riparian and/or wildlife related retention of mature forest. Given on
average 4% of the cutblock is consumed by roads this implies approximately 6% of the forested area within the
forest portion of the cutblock being retained as mature forest cover.
RESULTS is FLNRO’s Reporting Silviculture Updates and Landstatus Tracking System. It is used to track
licensee’s regeneration obligations and to update the inventory for harvest depletions. 1339 cutblocks harvested
in the Mackenzie Resource District since 2000 were identified using the database. On average, 4.7% of the
forested area within the cutblock was identified as mature forest cover. Given the 1339 blocks was close to a
complete enumeration while the FREP data was a sample, FLNRO staff decided the figure of 4.7% better
represented current levels of retention for riparian and wildlife tree patches.
The 2002 “Order to Establish the Obo and Fox Landscape Units and Objectives” (Obo/Fox order)
(http://archive.ilmb.gov.bc.ca/slrp/srmp/north/mackenzie/legalobj_Fox-Obo_Final.pdf ) has specific
requirements with regard to wildlife tree retention (Table 3 in that document). However, as discussed
previously in this section there is no way of reliably differentiating between retention for wildlife tree patches
(WTP) and riparian management. In light of this the specific WTP requirements for the Obo and Fox landscape
units will not be modeled.
6. Current Forest Management Assumptions
6.1. Harvesting
6.1.1. Utilization levels
The utilization levels define the maximum stump height, minimum top diameter inside bark (inside bark) and
minimum diameter at breast height by species. Table 14 shows the utilization levels used in the analysis to
calculate merchantable volume.
Table 14. Utilization levels
Utilization
Analysis unit Minimum stump diameter (cm)
Corresponding minimum DBH (cm)
Maximum stump height (cm) Minimum top dib (cm)
Pine 15 12.5 30 10
Deciduous 20 17.5 30 10
All other 20 17.5 30 10
Mackenzie TSA TSR Data Package September 2012
22
Data source and comments:
Table 1-2 Interior Timber Merchantability Specifications of the Provincial Logging Residue and Waste
Measurement Procedures Manual specifies the utilization levels for billing of harvested timber. These levels
are also used in assessing cut control for licence AACs.
The specifications for minimum stump diameter are converted to the nearest corresponding breast height
diameter for use with yield models. The specification for minimum top diameter inside bark is ignored because
the yield models do not address it.
Utilization levels will be lowered to access bio-energy opportunities within 100 km of Mackenzie town-ship.
6.1.2. Volume exclusions for the deciduous component of stands
There is no specific volume exclusion for the deciduous component of stands. Its contribution to the harvest
forecast will be tracked. For further details please refer to the next section.
6.1.3. Minimum harvestable volumes
The minimum harvestable volume is the minimum volume considered economic to harvest. While harvesting
may occur in stands at the minimum volume in order to meet forest level objectives (e.g., maintaining overall
harvest levels for a short period of time or avoiding large inter-decadal changes in harvest levels), most stands
are harvested with volumes well in excess of the minimum because of management objectives for other resource
values (e.g., requirements for the retention of older forest). The minimum harvest volume assumed in this
analysis will be the same as that calculated to derive the timber harvesting landbase—151 m3/ha. Where
deciduous is a minor component in the stand the deciduous component will be allowed to contribute to the
harvest but the minimum harvest volume requirement will be based on the coniferous component.
6.1.4. Harvest scheduling priorities
As evidenced by Figure 2 (Section 5.6. Inoperable Areas) there would appear to be a significant preference for
logging in the southern portion of the TSA (presumably due to proximity of the mills in Mackenzie and mills
further south and west). There would also be a preference for logging stands in the valley bottoms and flatter
ground which usually has high productivity and standing volumes. Normal skidders can work on slopes up to
35% and rubber tired skidders can go as high as 45 if the company has a Work Safe BC plan on how they will
safely extract the wood. These plans are based on based on section 26.16 of the Work Safe BC harvesting
guidelines.
Given to low value of dead pine stands, it will be assumed that no salvage of dead pine will occur on slopes in
excess of 35%. Harvest in other stand types will be allowed to occur on slopes up to 46%--the historical 99th
percentile.
Finally, economics would suggest that licensee will try and maximize the extraction of timber from the existing
road network before expanding it. These factors in combination will determine the harvest queue. What weight
each individual factor will be given in the final harvest queue will be detailed in the final technical record.
Layered over the harvest queue will be separate harvest targets for pine leadings stands versus non-pine leading
stands. A limit will be placed on the harvest of non-pine leading stands in the short term (during the potential
salvage period) based on recent harvest billing and stumpage appraisal data.
In 2011 (including waste) the total harvested scaled was 2.03 million cubic metres with 0.56 million cubic
metres of the scaled volume being non-pine. During the salvage period the non-pine harvest would be capped
either at this figure or some lower figure that better reflects recent harvest in non-pine leading stands.
Mackenzie TSA TSR Data Package September 2012
23
6.1.5. Silvicultural systems
Most harvesting within the Mackenzie TSA involves a clearcut silviculture system. Although forest district
staff anticipate some increased use of partial or selection harvest systems in the future, there is currently little
partial cutting occurring, and accounting for these approaches in the Mackenzie TSA timber supply is not
warranted at this time.
No commercial thinning has been carried out within the Mackenzie TSA in the past five years and none is
forecast to be carried out based on licensee information. Considering the poor local market for small wood, the
cost of commercial thinning, and the supply of larger mature wood for conventional harvesting, it is unlikely
that the application of this harvest method will increase significantly in the near future.
6.2. Unsalvaged losses
Table 15 shows the estimated average annual unsalvaged volume loss to fires and wind damage on the timber
harvesting land base. The unsalvaged loss column only reflects those areas in which the volume is not
recovered or salvaged.
Table 15. Unsalvaged losses
Cause of loss Annual total loss (m³/year) Annual unsalvaged loss (m³/year)
Wind 60 000 30 000
Fire 220 000 165 000
Total 280 000 195 000
Data source and comments:
Over the past decade approximately 600,000 cubic metres of timber have blown down on the THLB and it is
expected about half of it will be salvaged. A similar amount is assumed to occur outside the THLB as the
THLB is approximately half the gross area of the TSA.
With regard to fire, between 2000 and 2010 within the Mackenzie TSA, 25,257 hectares have been mapped as
inside fire perimeters. Using the 2001 analysis report figure of 75% of the TSA being forest the area of forest
burned it estimated as 19,000 hectares. Again, using 2001 analysis report figures, approximately half of the
TSA is expected to contribute to the THLB. The mapped fires are well distributed throughout the TSA, so it is
estimated that the area of forested THLB consumed between 2000 and 2010 as 9500 hectares. Assuming an
average volume of 250 cubic metres per hectare this translates to about 2,400,000 cubic metres or about 220,000
cubic metres per year. Historically only about one quarter of the burned timber within the THLB is salvaged.
The unsalvaged loss for Mountain Pine Beetle is explained in the section 6.4.
6.3. Balsam Decline
According to District staff, like the Fort Saint James Resource District, older balsam stands within the
Mackenzie TSA are experiencing considerable mortality. However, no formal survey has been completed. To
account for the observed mortality (in some fashion) it was decided to apply the average balsam mortality of
28% (from the Fort Saint James Resource District) to all balsam leading stands greater than 140 years of age
within the TSA.
Mackenzie TSA TSR Data Package September 2012
24
6.4. Mountain pine beetle
The Mountain Pine Beetle entered the Mackenzie Resource District in 2004 peaked in 2009 and has since
sharply declined.
According to version nine of the British Columbia Mountain Pine Beetle model (BCMPBv9) approximately
56% of the pine volume (on what was thought to be THLB in 2002) was killed by 2011. An additional 12%
mortality is forecast to occur before the projected end of the epidemic. However, weather conditions did not
allow aerial overview surveys to be conducted across the entire TSA in 2007 and 2008. Similarly the northern
half of the TSA was not surveyed in 2009. These surveys are fundamental to the calibration of the British
Columbia Mountain Pine Beetle model, so it could be argued BCMPBv9 is poorly calibrated for the TSA.
District estimates (based on repeated aerial reconnaisance by district staff) indicate the three quarters of the pine
within the TSA has been killed to date.
This major discrepancy and lack of calibration data for the model has led staff to not use BCMPBv9 for this
timber supply review. District estimates of mortality will be used instead.
It will be assumed that 75% of the pine trees within each mature forest stand have been killed by 2012. No
further death will be assumed. According to District staff the development of the MPB epidemic had two
distinct phases. The first phase predominately occurred in 2005 and was limited to the area of the TSA west of
Williston Lake and south of the Omineca arm of the lake. The outbreak appeared contained in this area of the
TSA until 2009. In 2009, it spread (essentially instantaneously) to the rest of the TSA.
Sensitivity analysis will be used to test the impact of these assumptions.
Pine mortality in stands less than 60 years old is discussed in the next section.
6.5. Young pine mortality
Observations by district staff suggest that death in younger stands less than 60 years old was considerably lower
than that observed in mature stands. Stands less than 29 years old were formally surveyed. Consistent with the
March 2008, “Mackenzie Forest District Midterm Mitigation Timber Supply Analysis” report pine mortality in
age class 2 (and greater than 28 years) stands and age class 3 stands was assumed to be 55 and 70% respectively.
Sensitivity analysis will be used to test the impact of these assumptions.
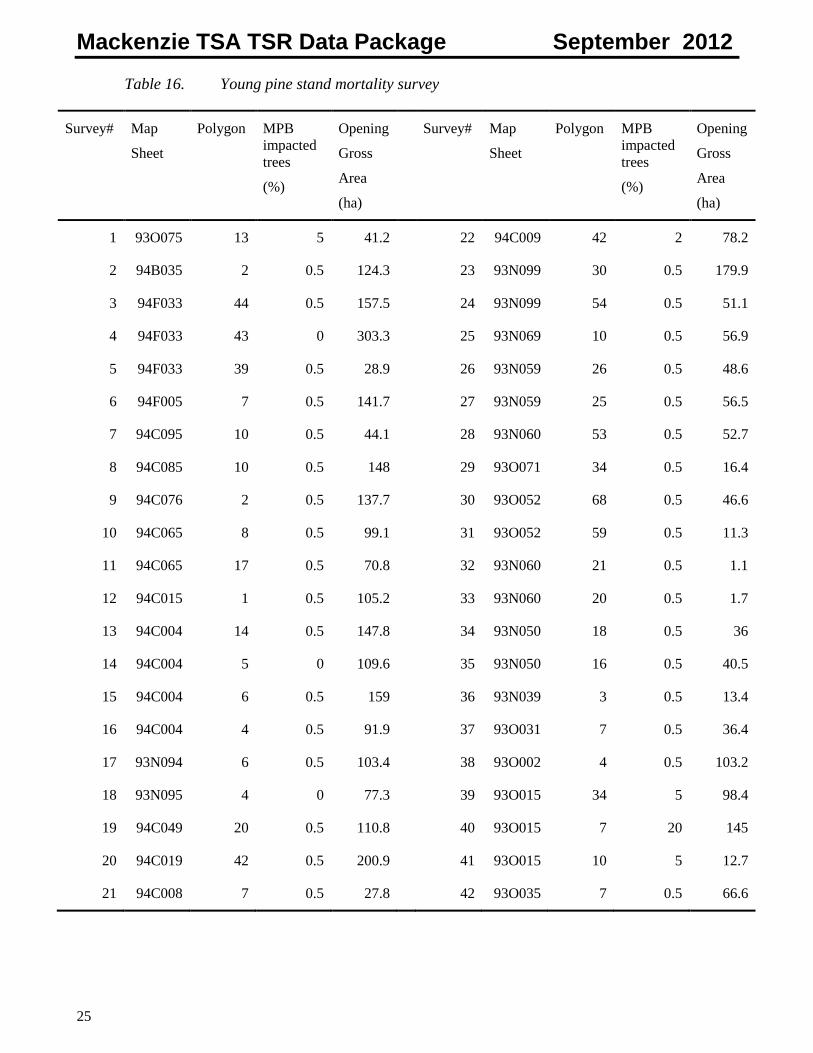
To determine rates of mortality in stands less than 29 years a helicopter survey of 42 randomly chosen pine
leading openings was conducted in fall 2011. Stands surveyed were a maximum of 28 years old. Survey results
are presented in Table 16 overleaf.
The survey showed 41 stands were of trace to light intensity with one stand at the moderate level. Very young
stands (<24 years), even with adjacent pressure, were not being attacked. However, 25 to 28 year old stands
were being damaged. The area weighted average mortality for stands less than 28 years was 1.4%. This figure
will be applied to the yields of all pine leading stands 28 years or younger in 2011.
For stands 59 years or less no attempt will be made to project the development of the epidemic any further.
Mackenzie TSA TSR Data Package September 2012
25
Table 16. Young pine stand mortality survey
Survey# Map
Sheet
Polygon MPB
impacted
trees
(%)
Opening
Gross
Area
(ha)
Survey# Map
Sheet
Polygon MPB
impacted
trees
(%)
Opening
Gross
Area
(ha)
1 93O075 13 5 41.2 22 94C009 42 2 78.2
2 94B035 2 0.5 124.3 23 93N099 30 0.5 179.9
3 94F033 44 0.5 157.5 24 93N099 54 0.5 51.1
4 94F033 43 0 303.3 25 93N069 10 0.5 56.9
5 94F033 39 0.5 28.9 26 93N059 26 0.5 48.6
6 94F005 7 0.5 141.7 27 93N059 25 0.5 56.5
7 94C095 10 0.5 44.1 28 93N060 53 0.5 52.7
8 94C085 10 0.5 148 29 93O071 34 0.5 16.4
9 94C076 2 0.5 137.7 30 93O052 68 0.5 46.6
10 94C065 8 0.5 99.1 31 93O052 59 0.5 11.3
11 94C065 17 0.5 70.8 32 93N060 21 0.5 1.1
12 94C015 1 0.5 105.2 33 93N060 20 0.5 1.7
13 94C004 14 0.5 147.8 34 93N050 18 0.5 36
14 94C004 5 0 109.6 35 93N050 16 0.5 40.5
15 94C004 6 0.5 159 36 93N039 3 0.5 13.4
16 94C004 4 0.5 91.9 37 93O031 7 0.5 36.4
17 93N094 6 0.5 103.4 38 93O002 4 0.5 103.2
18 93N095 4 0 77.3 39 93O015 34 5 98.4
19 94C049 20 0.5 110.8 40 93O015 7 20 145
20 94C019 42 0.5 200.9 41 93O015 10 5 12.7
21 94C008 7 0.5 27.8 42 93O035 7 0.5 66.6
Mackenzie TSA TSR Data Package September 2012
26
6.6 Shelf life of Dead Pine
Over the past number of years and in various TSAs around the province, shelf life of dead pine has been
discussed. Since each TSA time threshold has been different and due to the relative recent attack of the MPB
coupled to current changes in milling technology, shelf life of pine was set to fifteen (15) years. Due to the size
of and the local variation of the climate within the TSA the shelf life may vary. This 15 year shelf life is not
necessarily a sawlog shelf life but rather the length of time the fibre may be available for some commercial
purpose.
6.7. Silviculture
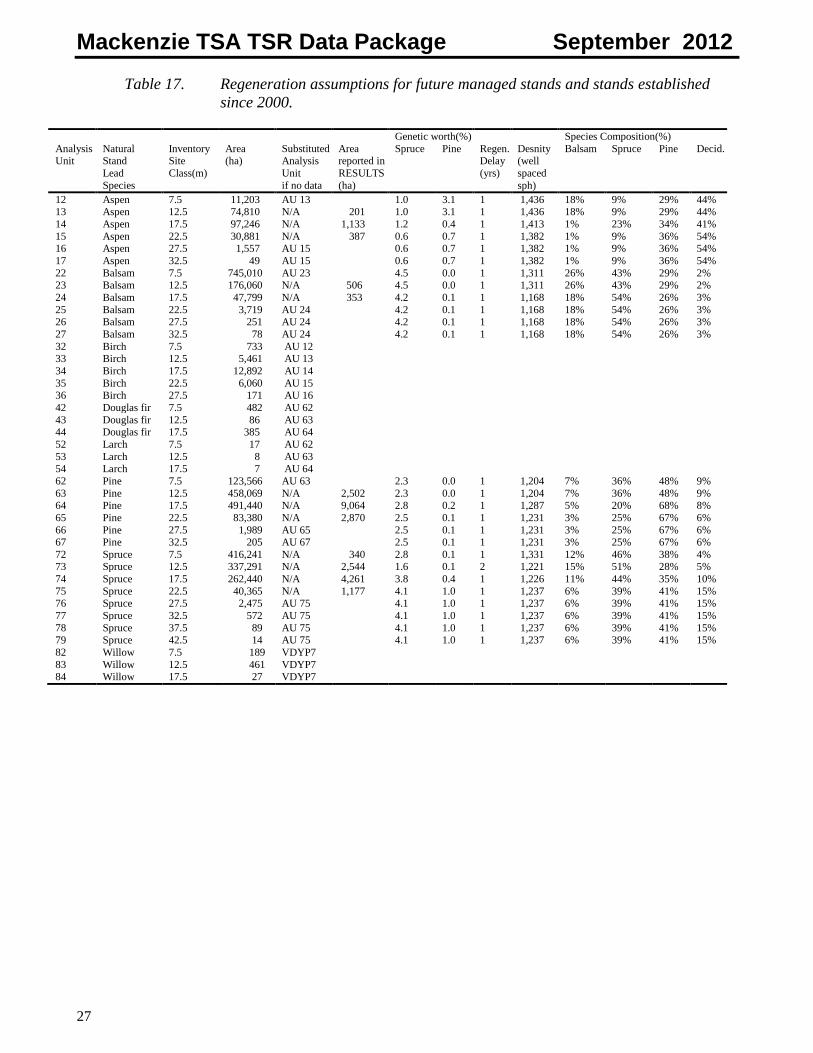
6.7.1. Regeneration activities
FLNRO’s “Reporting Silviculture Updates and Landstatus Tracking System” (RESULTS) was queried to
establish regeneration practices since 2000. RESULTS cutblocks were overlaid with a map of the analysis units
to determine membership. The regeneration information was then summarized for each (natural stand) analysis
unit. This summary is presented in Table 17 (overleaf).
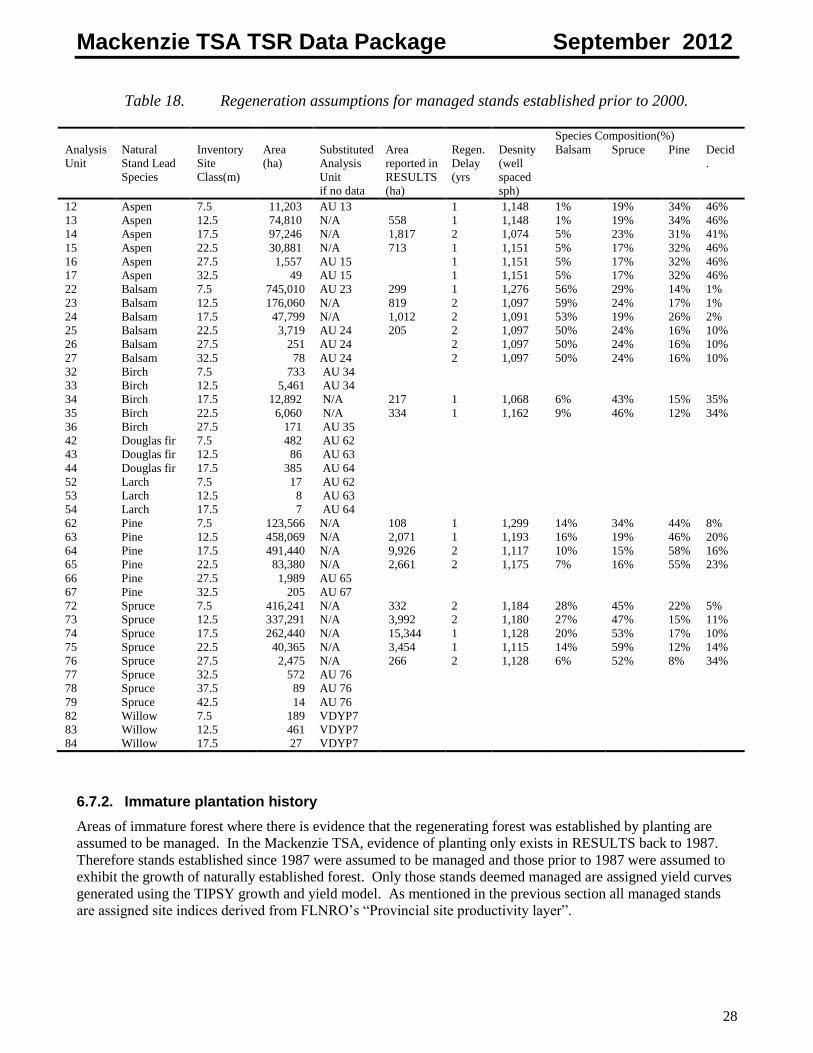
Again, using RESULTS, a similar summary was produced for those stands harvested prior to 2000. Those
results are presented in Table 18 (overleaf). Separate yield curves will be produced for both cohorts (pre and
since 2000).
Data source and comments:
The following passages apply to both the pre-2000 and since 2000 managed stand cohorts.
Many analysis units have little (less than 100 hectares) or no history of logging. In that case, species
composition, regeneration delay, and establishment density is substituted from the closest (in terms of
attribution) known neighbour.
In the case of site index, the “Provincial site productivity layer” will be used. This layer was developed in 2011
and early 2012 as a collaborative effort between the Ministry of Environment and the Ministry of Forests, Lands
and Natural Resource Operations. Where “Terrestrial Ecosystem Mapping” (TEM) or “Predictive Ecosystem
Mapping” (PEM) exists the site indices are SIBEC (http://www.for.gov.bc.ca/hre/sibec/) based. Where neither
TEM nor PEM mapping exist the source of the site indices is FLNROs biophysical site index modelc.
The density figures presented in Tables 17 and 18 are the well spaced number. Use of this density measure was
advised by FLNROs TASS/TIPSY growth and yield research group. The well spaced number implies a regular
spatial configuration. Therefore the appropriate regeneration method to assume is “planted” regardless of actual
stand origin.
Historically, in the absence of any better information, an OAF1 of 15% and an OAF2 of 5% has been applied to
the managed stand yield curves. The rationale behind OAFs is to scale the projected yields from those of
research plots to typical stands. In 2011, under the Forest and Range Evaluation Program (FREP), 30 openings
ranging in age from 14 to 31 years were surveyed in the Mackenzie TSA. It is hoped this information can be
used to derive custom OAFs for managed stands in the TSA. If this attempt is unsuccessful the default OAFs of
15 and 5 will be used. The result of this analysis will be detailed in the technical report.
c Nigh, G. 2012. A Biophysical Model for Estimating Site Index for the Major Commercial Species in British Columbia. Draft.
Mackenzie TSA TSR Data Package September 2012
27
Table 17. Regeneration assumptions for future managed stands and stands established
since 2000.
Genetic worth(%) * Species Composition(%)
Analysis Unit
Natural Stand
Lead
Species
Inventory Site
Class(m)
Area (ha)
Substituted Analysis
Unit
if no data
Area reported in
RESULTS
(ha)
Spruce Pine Regen. Delay
(yrs)
Desnity (well
spaced
sph)
Balsam Spruce Pine Decid.
12 Aspen 7.5 11,203 AU 13 1.0 3.1 1 1,436 18% 9% 29% 44% 13 Aspen 12.5 74,810 N/A 201 1.0 3.1 1 1,436 18% 9% 29% 44%
14 Aspen 17.5 97,246 N/A 1,133 1.2 0.4 1 1,413 1% 23% 34% 41%
15 Aspen 22.5 30,881 N/A 387 0.6 0.7 1 1,382 1% 9% 36% 54% 16 Aspen 27.5 1,557 AU 15 0.6 0.7 1 1,382 1% 9% 36% 54%
17 Aspen 32.5 49 AU 15 0.6 0.7 1 1,382 1% 9% 36% 54%
22 Balsam 7.5 745,010 AU 23 4.5 0.0 1 1,311 26% 43% 29% 2% 23 Balsam 12.5 176,060 N/A 506 4.5 0.0 1 1,311 26% 43% 29% 2%
24 Balsam 17.5 47,799 N/A 353 4.2 0.1 1 1,168 18% 54% 26% 3%
25 Balsam 22.5 3,719 AU 24 4.2 0.1 1 1,168 18% 54% 26% 3% 26 Balsam 27.5 251 AU 24 4.2 0.1 1 1,168 18% 54% 26% 3%
27 Balsam 32.5 78 AU 24 4.2 0.1 1 1,168 18% 54% 26% 3%
32 Birch 7.5 733 AU 12 33 Birch 12.5 5,461 AU 13
34 Birch 17.5 12,892 AU 14
35 Birch 22.5 6,060 AU 15 36 Birch 27.5 171 AU 16
42 Douglas fir 7.5 482 AU 62
43 Douglas fir 12.5 86 AU 63 44 Douglas fir 17.5 385 AU 64
52 Larch 7.5 17 AU 62
53 Larch 12.5 8 AU 63 54 Larch 17.5 7 AU 64
62 Pine 7.5 123,566 AU 63 2.3 0.0 1 1,204 7% 36% 48% 9%
63 Pine 12.5 458,069 N/A 2,502 2.3 0.0 1 1,204 7% 36% 48% 9% 64 Pine 17.5 491,440 N/A 9,064 2.8 0.2 1 1,287 5% 20% 68% 8%
65 Pine 22.5 83,380 N/A 2,870 2.5 0.1 1 1,231 3% 25% 67% 6%
66 Pine 27.5 1,989 AU 65 2.5 0.1 1 1,231 3% 25% 67% 6% 67 Pine 32.5 205 AU 67 2.5 0.1 1 1,231 3% 25% 67% 6%
72 Spruce 7.5 416,241 N/A 340 2.8 0.1 1 1,331 12% 46% 38% 4% 73 Spruce 12.5 337,291 N/A 2,544 1.6 0.1 2 1,221 15% 51% 28% 5%
74 Spruce 17.5 262,440 N/A 4,261 3.8 0.4 1 1,226 11% 44% 35% 10%
75 Spruce 22.5 40,365 N/A 1,177 4.1 1.0 1 1,237 6% 39% 41% 15% 76 Spruce 27.5 2,475 AU 75 4.1 1.0 1 1,237 6% 39% 41% 15%
77 Spruce 32.5 572 AU 75 4.1 1.0 1 1,237 6% 39% 41% 15%
78 Spruce 37.5 89 AU 75 4.1 1.0 1 1,237 6% 39% 41% 15% 79 Spruce 42.5 14 AU 75 4.1 1.0 1 1,237 6% 39% 41% 15%
82 Willow 7.5 189 VDYP7
83 Willow 12.5 461 VDYP7 84 Willow 17.5 27 VDYP7
Mackenzie TSA TSR Data Package September 2012
28
Table 18. Regeneration assumptions for managed stands established prior to 2000.
Species Composition(%)
Analysis
Unit
Natural
Stand Lead
Species
Inventory
Site
Class(m)
Area
(ha)
Substituted
Analysis
Unit
if no data
Area
reported in
RESULTS
(ha)
Regen.
Delay
(yrs
Desnity
(well
spaced
sph)
Balsam Spruce Pine Decid
.
12 Aspen 7.5 11,203 AU 13 1 1,148 1% 19% 34% 46%
13 Aspen 12.5 74,810 N/A 558 1 1,148 1% 19% 34% 46%
14 Aspen 17.5 97,246 N/A 1,817 2 1,074 5% 23% 31% 41%
15 Aspen 22.5 30,881 N/A 713 1 1,151 5% 17% 32% 46%
16 Aspen 27.5 1,557 AU 15 1 1,151 5% 17% 32% 46%
17 Aspen 32.5 49 AU 15 1 1,151 5% 17% 32% 46%
22 Balsam 7.5 745,010 AU 23 299 1 1,276 56% 29% 14% 1%
23 Balsam 12.5 176,060 N/A 819 2 1,097 59% 24% 17% 1%
24 Balsam 17.5 47,799 N/A 1,012 2 1,091 53% 19% 26% 2%
25 Balsam 22.5 3,719 AU 24 205 2 1,097 50% 24% 16% 10%
26 Balsam 27.5 251 AU 24 2 1,097 50% 24% 16% 10%
27 Balsam 32.5 78 AU 24 2 1,097 50% 24% 16% 10%
32 Birch 7.5 733 AU 34
33 Birch 12.5 5,461 AU 34
34 Birch 17.5 12,892 N/A 217 1 1,068 6% 43% 15% 35%
35 Birch 22.5 6,060 N/A 334 1 1,162 9% 46% 12% 34%
36 Birch 27.5 171 AU 35
42 Douglas fir 7.5 482 AU 62
43 Douglas fir 12.5 86 AU 63
44 Douglas fir 17.5 385 AU 64
52 Larch 7.5 17 AU 62
53 Larch 12.5 8 AU 63
54 Larch 17.5 7 AU 64
62 Pine 7.5 123,566 N/A 108 1 1,299 14% 34% 44% 8%
63 Pine 12.5 458,069 N/A 2,071 1 1,193 16% 19% 46% 20%
64 Pine 17.5 491,440 N/A 9,926 2 1,117 10% 15% 58% 16%
65 Pine 22.5 83,380 N/A 2,661 2 1,175 7% 16% 55% 23%
66 Pine 27.5 1,989 AU 65
67 Pine 32.5 205 AU 67
72 Spruce 7.5 416,241 N/A 332 2 1,184 28% 45% 22% 5%
73 Spruce 12.5 337,291 N/A 3,992 2 1,180 27% 47% 15% 11%
74 Spruce 17.5 262,440 N/A 15,344 1 1,128 20% 53% 17% 10%
75 Spruce 22.5 40,365 N/A 3,454 1 1,115 14% 59% 12% 14%
76 Spruce 27.5 2,475 N/A 266 2 1,128 6% 52% 8% 34%
77 Spruce 32.5 572 AU 76
78 Spruce 37.5 89 AU 76
79 Spruce 42.5 14 AU 76
82 Willow 7.5 189 VDYP7
83 Willow 12.5 461 VDYP7
84 Willow 17.5 27 VDYP7
6.7.2. Immature plantation history
Areas of immature forest where there is evidence that the regenerating forest was established by planting are
assumed to be managed. In the Mackenzie TSA, evidence of planting only exists in RESULTS back to 1987.
Therefore stands established since 1987 were assumed to be managed and those prior to 1987 were assumed to
exhibit the growth of naturally established forest. Only those stands deemed managed are assigned yield curves
generated using the TIPSY growth and yield model. As mentioned in the previous section all managed stands
are assigned site indices derived from FLNRO’s “Provincial site productivity layer”.
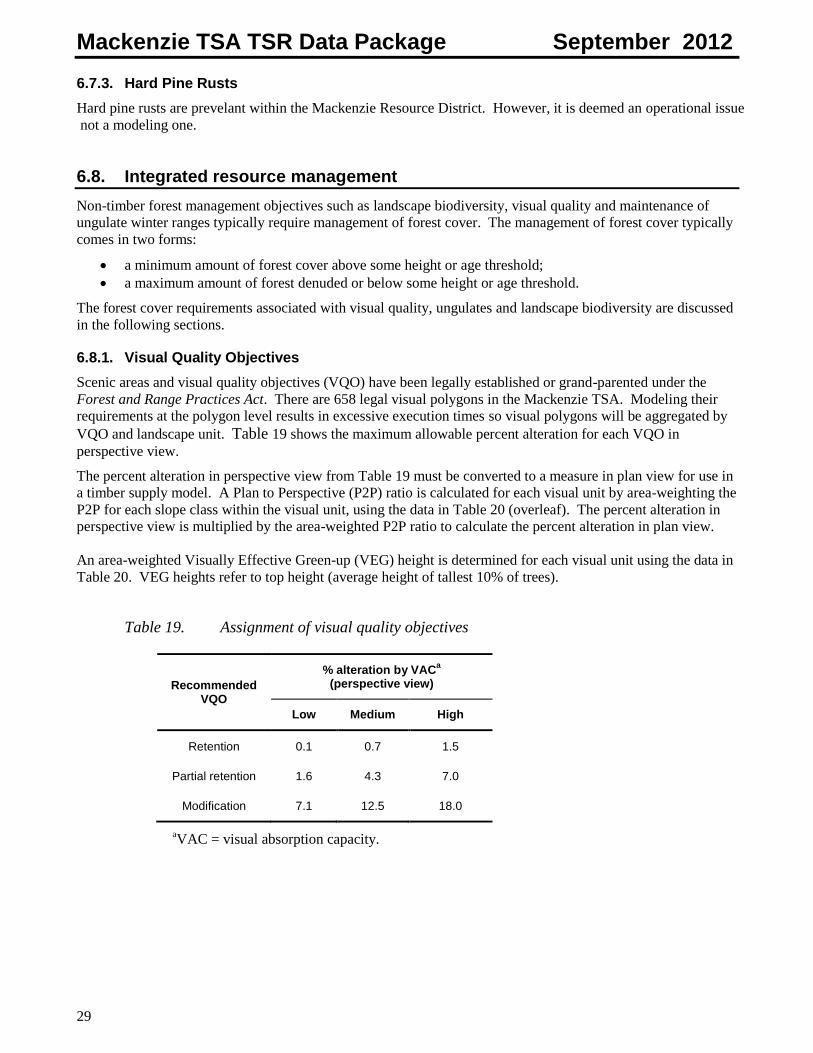
Mackenzie TSA TSR Data Package September 2012
29
6.7.3. Hard Pine Rusts
Hard pine rusts are prevelant within the Mackenzie Resource District. However, it is deemed an operational issue
not a modeling one.
6.8. Integrated resource management
Non-timber forest management objectives such as landscape biodiversity, visual quality and maintenance of
ungulate winter ranges typically require management of forest cover. The management of forest cover typically
comes in two forms:
a minimum amount of forest cover above some height or age threshold;
a maximum amount of forest denuded or below some height or age threshold.
The forest cover requirements associated with visual quality, ungulates and landscape biodiversity are discussed
in the following sections.
6.8.1. Visual Quality Objectives
Scenic areas and visual quality objectives (VQO) have been legally established or grand-parented under the
Forest and Range Practices Act. There are 658 legal visual polygons in the Mackenzie TSA. Modeling their
requirements at the polygon level results in excessive execution times so visual polygons will be aggregated by
VQO and landscape unit. Table 19 shows the maximum allowable percent alteration for each VQO in
perspective view.
The percent alteration in perspective view from Table 19 must be converted to a measure in plan view for use in
a timber supply model. A Plan to Perspective (P2P) ratio is calculated for each visual unit by area-weighting the
P2P for each slope class within the visual unit, using the data in Table 20 (overleaf). The percent alteration in
perspective view is multiplied by the area-weighted P2P ratio to calculate the percent alteration in plan view.
An area-weighted Visually Effective Green-up (VEG) height is determined for each visual unit using the data in
Table 20. VEG heights refer to top height (average height of tallest 10% of trees).
Table 19. Assignment of visual quality objectives
Recommended VQO
% alteration by VACa
(perspective view)
Low Medium High
Retention 0.1 0.7 1.5
Partial retention 1.6 4.3 7.0
Modification 7.1 12.5 18.0
aVAC = visual absorption capacity.
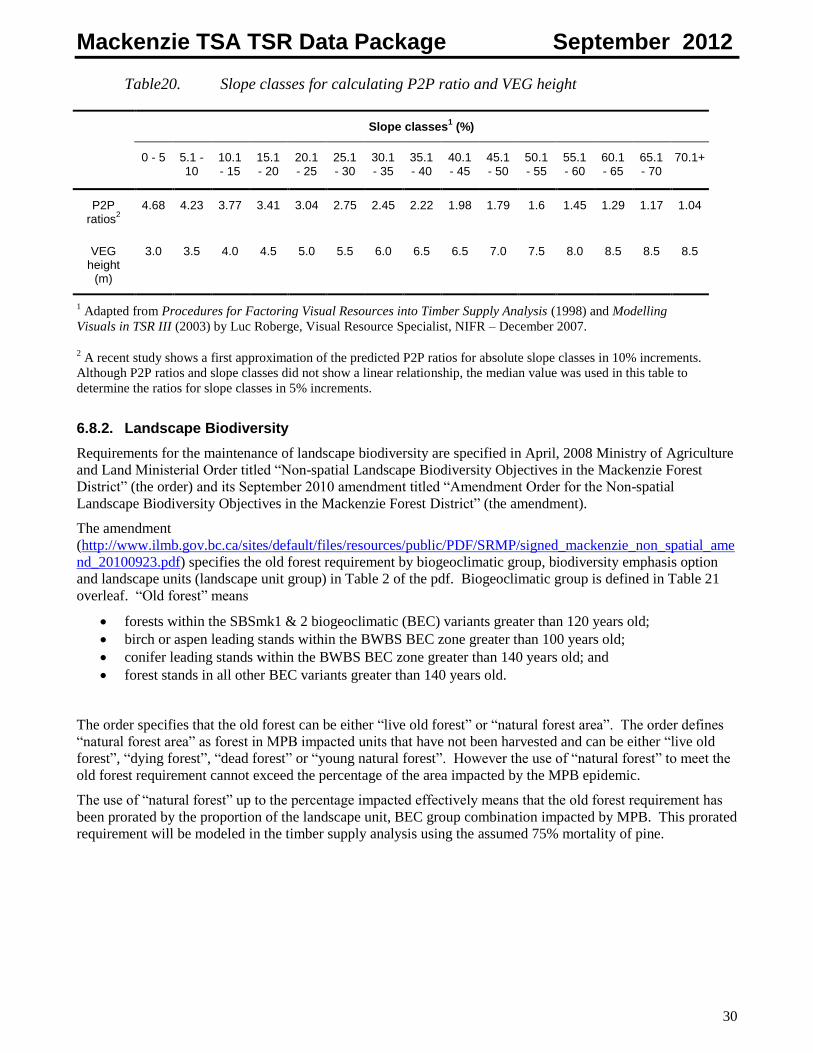
Mackenzie TSA TSR Data Package September 2012
30
Table20. Slope classes for calculating P2P ratio and VEG height
Slope classes1 (%)
0 - 5 5.1 - 10
10.1 - 15
15.1 - 20
20.1 - 25
25.1 - 30
30.1 - 35
35.1 - 40
40.1 - 45
45.1 - 50
50.1 - 55
55.1 - 60
60.1 - 65
65.1 - 70
70.1+
P2P ratios
2
4.68 4.23 3.77 3.41 3.04 2.75 2.45 2.22 1.98 1.79 1.6 1.45 1.29 1.17 1.04
VEG height
(m)
3.0 3.5 4.0 4.5 5.0 5.5 6.0 6.5 6.5 7.0 7.5 8.0 8.5 8.5 8.5
1 Adapted from Procedures for Factoring Visual Resources into Timber Supply Analysis (1998) and Modelling
Visuals in TSR III (2003) by Luc Roberge, Visual Resource Specialist, NIFR – December 2007.
2 A recent study shows a first approximation of the predicted P2P ratios for absolute slope classes in 10% increments.
Although P2P ratios and slope classes did not show a linear relationship, the median value was used in this table to
determine the ratios for slope classes in 5% increments.
6.8.2. Landscape Biodiversity
Requirements for the maintenance of landscape biodiversity are specified in April, 2008 Ministry of Agriculture
and Land Ministerial Order titled “Non-spatial Landscape Biodiversity Objectives in the Mackenzie Forest
District” (the order) and its September 2010 amendment titled “Amendment Order for the Non-spatial
Landscape Biodiversity Objectives in the Mackenzie Forest District” (the amendment).
The amendment
(http://www.ilmb.gov.bc.ca/sites/default/files/resources/public/PDF/SRMP/signed_mackenzie_non_spatial_ame
nd_20100923.pdf) specifies the old forest requirement by biogeoclimatic group, biodiversity emphasis option
and landscape units (landscape unit group) in Table 2 of the pdf. Biogeoclimatic group is defined in Table 21
overleaf. “Old forest” means
forests within the SBSmk1 & 2 biogeoclimatic (BEC) variants greater than 120 years old;
birch or aspen leading stands within the BWBS BEC zone greater than 100 years old;
conifer leading stands within the BWBS BEC zone greater than 140 years old; and
forest stands in all other BEC variants greater than 140 years old.
The order specifies that the old forest can be either “live old forest” or “natural forest area”. The order defines
“natural forest area” as forest in MPB impacted units that have not been harvested and can be either “live old
forest”, “dying forest”, “dead forest” or “young natural forest”. However the use of “natural forest” to meet the
old forest requirement cannot exceed the percentage of the area impacted by the MPB epidemic.
The use of “natural forest” up to the percentage impacted effectively means that the old forest requirement has
been prorated by the proportion of the landscape unit, BEC group combination impacted by MPB. This prorated
requirement will be modeled in the timber supply analysis using the assumed 75% mortality of pine.
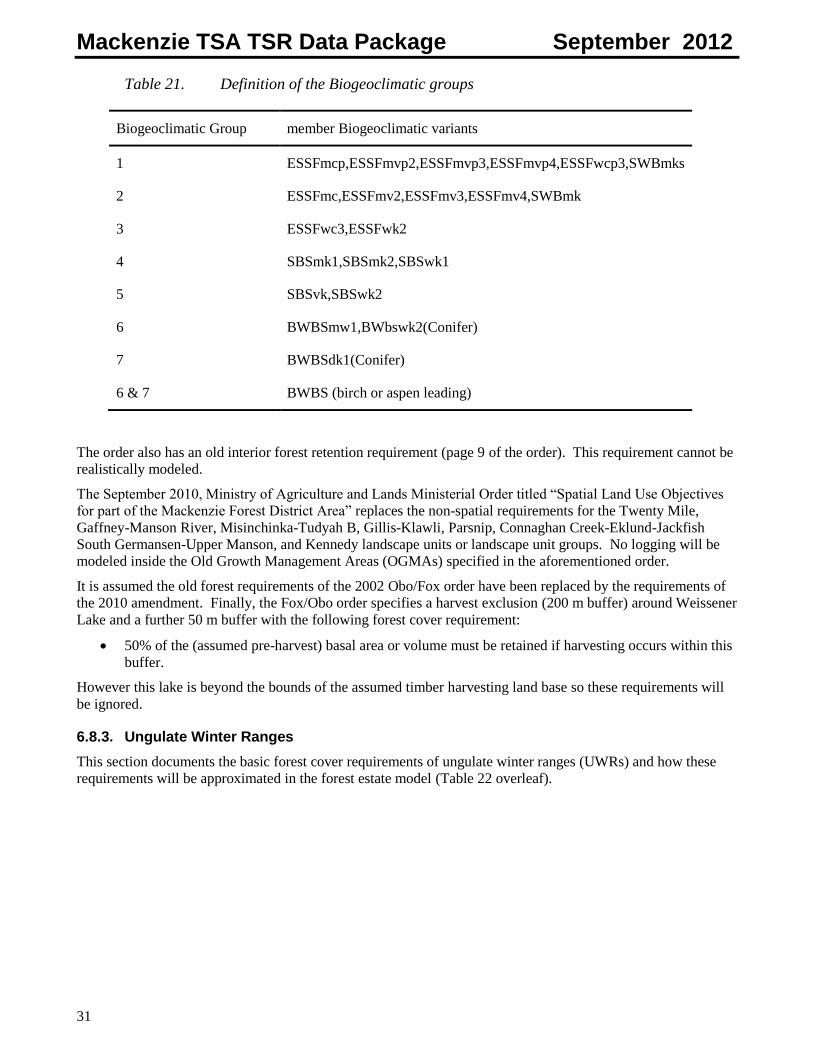
Mackenzie TSA TSR Data Package September 2012
31
Table 21. Definition of the Biogeoclimatic groups
Biogeoclimatic Group member Biogeoclimatic variants
1 ESSFmcp,ESSFmvp2,ESSFmvp3,ESSFmvp4,ESSFwcp3,SWBmks
2 ESSFmc,ESSFmv2,ESSFmv3,ESSFmv4,SWBmk
3 ESSFwc3,ESSFwk2
4 SBSmk1,SBSmk2,SBSwk1
5 SBSvk,SBSwk2
6 BWBSmw1,BWbswk2(Conifer)
7 BWBSdk1(Conifer)
6 & 7 BWBS (birch or aspen leading)
The order also has an old interior forest retention requirement (page 9 of the order). This requirement cannot be
realistically modeled.
The September 2010, Ministry of Agriculture and Lands Ministerial Order titled “Spatial Land Use Objectives
for part of the Mackenzie Forest District Area” replaces the non-spatial requirements for the Twenty Mile,
Gaffney-Manson River, Misinchinka-Tudyah B, Gillis-Klawli, Parsnip, Connaghan Creek-Eklund-Jackfish
South Germansen-Upper Manson, and Kennedy landscape units or landscape unit groups. No logging will be
modeled inside the Old Growth Management Areas (OGMAs) specified in the aforementioned order.
It is assumed the old forest requirements of the 2002 Obo/Fox order have been replaced by the requirements of
the 2010 amendment. Finally, the Fox/Obo order specifies a harvest exclusion (200 m buffer) around Weissener
Lake and a further 50 m buffer with the following forest cover requirement:
50% of the (assumed pre-harvest) basal area or volume must be retained if harvesting occurs within this
buffer.
However this lake is beyond the bounds of the assumed timber harvesting land base so these requirements will
be ignored.
6.8.3. Ungulate Winter Ranges
This section documents the basic forest cover requirements of ungulate winter ranges (UWRs) and how these
requirements will be approximated in the forest estate model (Table 22 overleaf).
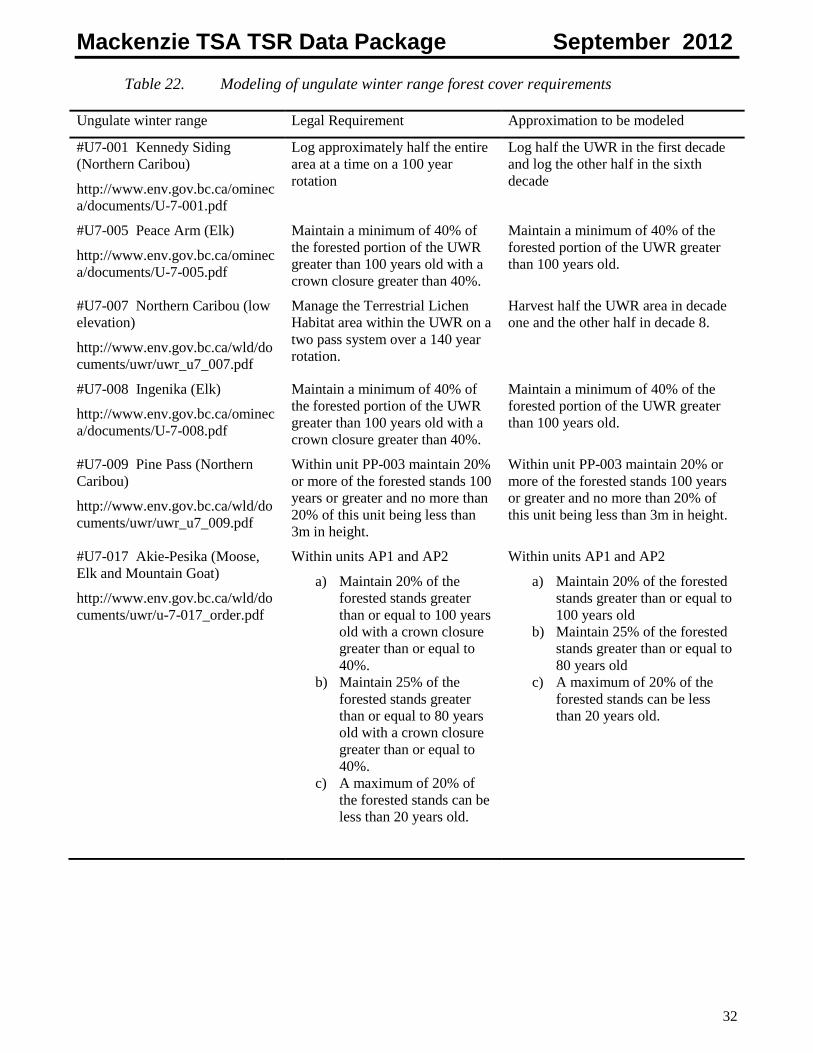
Mackenzie TSA TSR Data Package September 2012
32
Table 22. Modeling of ungulate winter range forest cover requirements
Ungulate winter range Legal Requirement Approximation to be modeled
#U7-001 Kennedy Siding
(Northern Caribou)
http://www.env.gov.bc.ca/ominec
a/documents/U-7-001.pdf
Log approximately half the entire
area at a time on a 100 year
rotation
Log half the UWR in the first decade
and log the other half in the sixth
decade
#U7-005 Peace Arm (Elk)
http://www.env.gov.bc.ca/ominec
a/documents/U-7-005.pdf
Maintain a minimum of 40% of
the forested portion of the UWR
greater than 100 years old with a
crown closure greater than 40%.
Maintain a minimum of 40% of the
forested portion of the UWR greater
than 100 years old.
#U7-007 Northern Caribou (low
elevation)
http://www.env.gov.bc.ca/wld/do
cuments/uwr/uwr_u7_007.pdf
Manage the Terrestrial Lichen
Habitat area within the UWR on a
two pass system over a 140 year
rotation.
Harvest half the UWR area in decade
one and the other half in decade 8.
#U7-008 Ingenika (Elk)
http://www.env.gov.bc.ca/ominec
a/documents/U-7-008.pdf
Maintain a minimum of 40% of
the forested portion of the UWR
greater than 100 years old with a
crown closure greater than 40%.
Maintain a minimum of 40% of the
forested portion of the UWR greater
than 100 years old.
#U7-009 Pine Pass (Northern
Caribou)
http://www.env.gov.bc.ca/wld/do
cuments/uwr/uwr_u7_009.pdf
Within unit PP-003 maintain 20%
or more of the forested stands 100
years or greater and no more than
20% of this unit being less than
3m in height.
Within unit PP-003 maintain 20% or
more of the forested stands 100 years
or greater and no more than 20% of
this unit being less than 3m in height.
#U7-017 Akie-Pesika (Moose,
Elk and Mountain Goat)
http://www.env.gov.bc.ca/wld/do
cuments/uwr/u-7-017_order.pdf
Within units AP1 and AP2
a) Maintain 20% of the
forested stands greater
than or equal to 100 years
old with a crown closure
greater than or equal to
40%.
b) Maintain 25% of the
forested stands greater
than or equal to 80 years
old with a crown closure
greater than or equal to
40%.
c) A maximum of 20% of
the forested stands can be
less than 20 years old.
Within units AP1 and AP2
a) Maintain 20% of the forested
stands greater than or equal to
100 years old
b) Maintain 25% of the forested
stands greater than or equal to
80 years old
c) A maximum of 20% of the
forested stands can be less
than 20 years old.
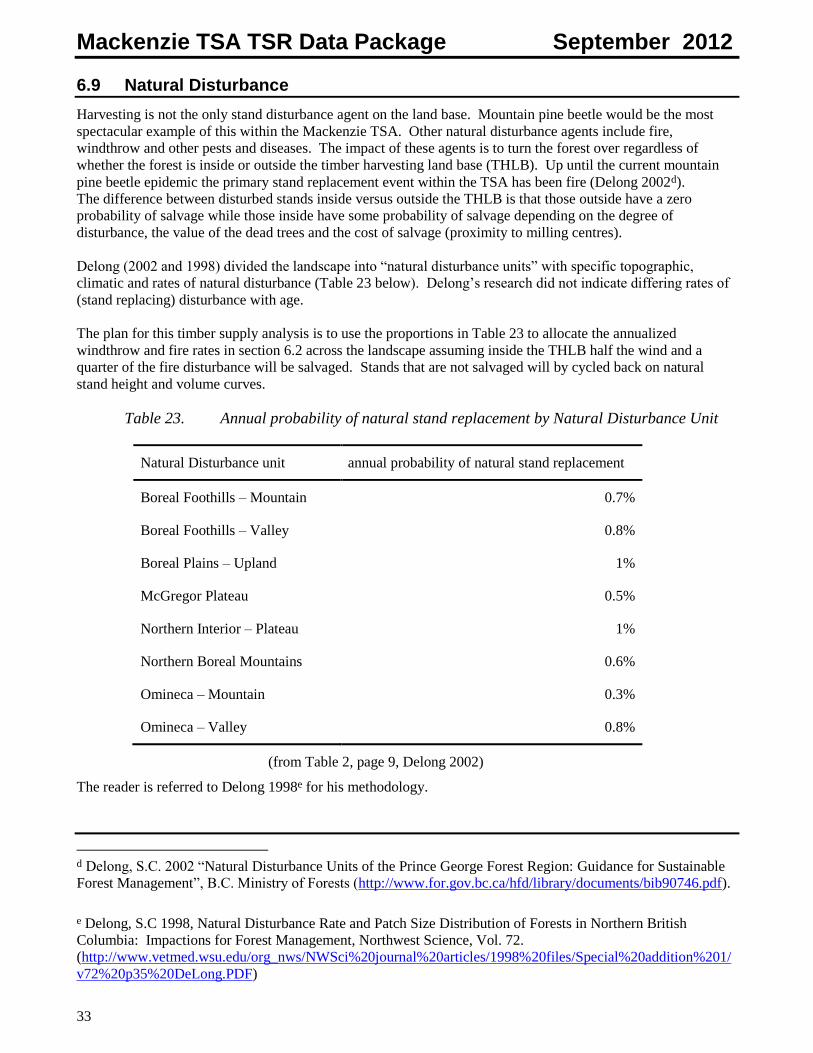
Mackenzie TSA TSR Data Package September 2012
33
6.9 Natural Disturbance
Harvesting is not the only stand disturbance agent on the land base. Mountain pine beetle would be the most
spectacular example of this within the Mackenzie TSA. Other natural disturbance agents include fire,
windthrow and other pests and diseases. The impact of these agents is to turn the forest over regardless of
whether the forest is inside or outside the timber harvesting land base (THLB). Up until the current mountain
pine beetle epidemic the primary stand replacement event within the TSA has been fire (Delong 2002d).
The difference between disturbed stands inside versus outside the THLB is that those outside have a zero
probability of salvage while those inside have some probability of salvage depending on the degree of
disturbance, the value of the dead trees and the cost of salvage (proximity to milling centres).
Delong (2002 and 1998) divided the landscape into “natural disturbance units” with specific topographic,
climatic and rates of natural disturbance (Table 23 below). Delong’s research did not indicate differing rates of
(stand replacing) disturbance with age.
The plan for this timber supply analysis is to use the proportions in Table 23 to allocate the annualized
windthrow and fire rates in section 6.2 across the landscape assuming inside the THLB half the wind and a
quarter of the fire disturbance will be salvaged. Stands that are not salvaged will by cycled back on natural
stand height and volume curves.
Table 23. Annual probability of natural stand replacement by Natural Disturbance Unit
Natural Disturbance unit annual probability of natural stand replacement
Boreal Foothills – Mountain 0.7%
Boreal Foothills – Valley 0.8%
Boreal Plains – Upland 1%
McGregor Plateau 0.5%
Northern Interior – Plateau 1%
Northern Boreal Mountains 0.6%
Omineca – Mountain 0.3%
Omineca – Valley 0.8%
(from Table 2, page 9, Delong 2002)
The reader is referred to Delong 1998e for his methodology.
d Delong, S.C. 2002 “Natural Disturbance Units of the Prince George Forest Region: Guidance for Sustainable
Forest Management”, B.C. Ministry of Forests (http://www.for.gov.bc.ca/hfd/library/documents/bib90746.pdf).
e Delong, S.C 1998, Natural Disturbance Rate and Patch Size Distribution of Forests in Northern British
Columbia: Impactions for Forest Management, Northwest Science, Vol. 72.
(http://www.vetmed.wsu.edu/org_nws/NWSci%20journal%20articles/1998%20files/Special%20addition%201/
v72%20p35%20DeLong.PDF)
Mackenzie TSA TSR Data Package September 2012
34
7. Sensitivity Analyses
Sensitivity analysis can assess the timber supply impact of uncertainty in data and management assumptions. It
can also help determine which variables have the greatest influence on harvest forecasts. Sensitivity analyses
can also be used to assess the timber supply implication of policy changes currently being considered by
government. Finally, it can be used to explore new economic opportunities.
7.1. Data uncertainties
7.1.1. Operability:
Uncertainty regarding the operability assumptions and utilization assumptions will be explicitly examined. As
previously mentioned, while the distance surface is qualitatively reasonable the accuracy of the metric is open to
question. Its impact on the forecast requires examination. While, the calculation of the slope and volume
thresholds is more robust, the choice of percentile to use as a threshold should and will be examined. To
determine the implications of a more conservative landbase the 90th percentile will be used for distance and
slope and the 10th percentile for volume. To determine the implications of a more optimistic landbase slope and
distance values 10% higher than the 99th percentile and 10% lower than the 1
st percentile of volume will be used.
Further the impact of including balsam leading stands back in the THLB will be assessed.
7.1.2. Mountain pine beetle
Three other significant uncertainties that will be examined are:
the amount of the dead pine across the landscape; and
the amount of dead pine that will be salvaged.
7.1.3. Stand growth:
Vegetation Reosurce Inventory (VRI) phase 2 sample has been completed for the TSA. This will allow an
assessment of the mature aerial inventory to be made. This will be discussed in the technical report. As
discussed in section 6.7.1. the FREP sample collected in the TSA will allow some assessment of the growth of
managed stands in the TSA for the early part of the rotation. However, the longer term growth of managed
stands within the TSA is unknown. Uncertainties in timber supply associated with managed stand growth will
be explored.
7.2. Possible policy changes
Four such policy sensitivities will be discussed in the pages that follow:
Visual quality polygons that are not legal but are recommended;
Best management practices for grizzly bear;
Best management practices for caribou; and
Best management practices for bull trout.
7.2.1. Non-legal but recommended visual quality polygons
There are 109 non-legal recommended visual quality polygons within the Mackenzie TSA. Before the District
Manager can make them legal through the Government Actions Regulation (GAR) process if he/she decides to
do so he/she must ascertain whether the proposed visual quality polygons would have an undue impact on
timber supply. This assessment will be made during this timber supply review.
Mackenzie TSA TSR Data Package September 2012
35
7.2.2. Best management practices (BMPs) for grizzly bear
The January, 2012 Wildlife Infometrics reportf documented many measures to minimize the impact of
harvesting on Grizzly Bears, many of those measures will not be modeled due to their operational nature and
have to do with access management. However, the following measures will be modeled:
Within mapped high value habitat mid-seral (40-80 years) forest will be limited to 33% of the forested
area of an assessment watershed. Assuming a uniform age distribution within the watershed this will be
approximated by limiting the area of early seral to 33% of the forested area of a watershed.
On southern aspects within mapped high value habitat, plantation establishment densities will be limited
to 500 sph within the ESSFwk1, ESSFwk2, ESSFwc3 and 600 sph within the SBSmk1, SBSwk1 and
SBSvk.
Southerly avalanche tracks will be have a 50 m buffer where harvest will be excluded. Avalanche
tracks will be identified as follows:
o bclcs_level_1 = "V";
o bclcs_level_2 = "N";
o bclcs_level_3 = "U";
o area(ha)/ perimeter(km) < 5;
o ave_slope >= 35%; and
o the long axis of the polygon runs up and down slope rather than across slope.
7.2.3. Best management practices for caribou
The January, 2012 Wildlife Infometrics reportg identified caribou migration corridors within the TSA. The
goals of the best practices are to maintain the continuity of these migration corridors and minimize encounters
between caribou and their predators within them. The corridors are composed of a core area and an area of
influence surrounding that core. Like the Grizzly Bear BMPs some are operational in nature and will not be
modeled while others will as follows:
Within the core areas no harvest will be allowed
Within the area of influence less than 35% of the forest can be less than 40 years old.
7.2.4. Best management practices for bull trout
Bull Trout are a Blue listed species provincially and a species of “Special Concern”. Critical stream habitat
within the Davis River, Graham River, Chowika River, Point Creek, Scott Creek and Misinchinka River
watersheds will be buffered 200 metres on either side of the watercourse. A 100% reduction to the THLB will
be applied within the riparian buffer.
7.3. Exploring new economic opportunities
7.3.1. Fibre opportunities
There has been considerable interest expressed regarding bio-energy within the Mackenzie TSA. Opportunity
for bio-energy will be explored by utilizing a 4 cm top within 100 km radius of Mackenzie township.
f McCann, R.K. 2012; Best management practices for industrial operations affecting occupied grizzly bear range in north-
central British Columbia. Wildlife infometrics Inc. Report No. 390. Wildlife Infometrics Inc., Mackenzie, British
Columbia, Canada. g Wright, C. and R.S. McNay. 2012. Best management practices for industrial operations affecting caribou migration
corridors in north-central British Columbia. Wildlife infometrics Inc. Report No. 389. Wildlife Infometrics Inc.,
Mackenzie, British Columbia, Canada.

Mackenzie TSA TSR Data Package September 2012
36
7.3.2. Utilizing marginally economic stands
The August 2012 report titled “Growing Fibre, Growing value” by the Special (legislative) Committee on
Timber Supply recommended finding ways of utilizing marginally economic stands as a means of mitigating
expected declines in timber supply in MPB-impacted TSAs. Some light should be shed on the possible
opportunities that may exist within the Mackenzie TSA via the operability sensitivities discussed in section
7.1.1.