Embed Size (px)
Citation preview

Machine Vision for Robots Modeling Cameras• Processing Images
– Geometric/Moment based Features– Other Features

Histograms and Thresholding
Histogram: graphical presentation of the frequency count of the occurrence of each intensity in an image
Magnitude of histogram at a specific pixel value, hist(g), is the probability of the gray value, g, occurring in any picture element in the frame

Histograms and Thresholding
Histogram: determine if image has sufficient contrast equalize image histograms to perform operations
(e.g. subtraction) determine appropriate threshold values

Histograms and Thresholding
Threshold: Segmentation of the image (classify each pixel)
according to gray value – I.e. for threshold, T
Puts pixel into the set of background Sb or foreground Sf pixels
binary segmentation of the image

Connect Component Analysis Identify individual components (blobs) within
the image: Input: a binary image with objects having value 1
and background having value 0. Output: an image with each region having value
equal to the region label (and the background having value 0).
• 4-connected vs. 8-connected• A is not connected to C in 4-connectivity• A is connected to C in 8-connectivity
A
C D
B

Connect Component Algorithm One Algorithm (4-connectivity):
Pass 1: If A==1 and D==1 then EqualLabels (A,D) If A==1 and B==1 then EqualLabels(A,B) If A==1 and Both(B==1) and (D==1) then If (Label(B) != Label(D) then EqualLabels(B,D)
Pass 2: Relabel each pixel within each equivalence class
A
C D
BIn Matlab™ the routine bwlabel performs a connected component analysis

Geometric Properties Assume: binary image with ONE object having
value 1 and background having value 0.
Moment definition:
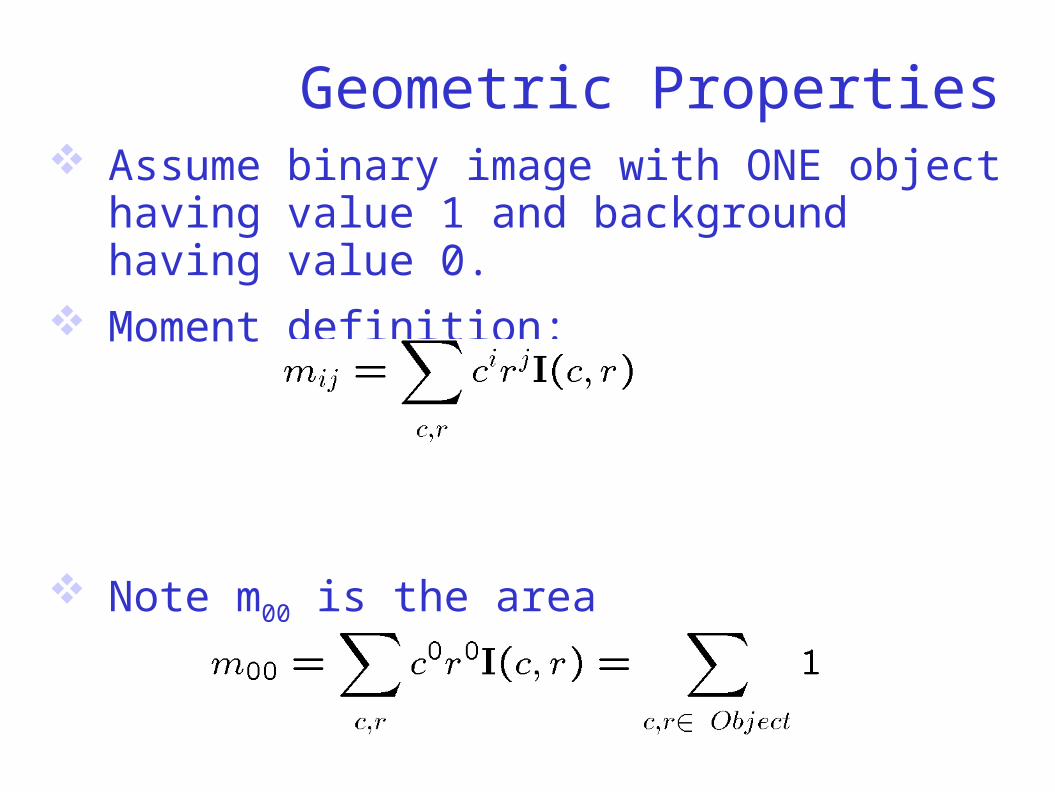
Geometric Properties Assume binary image with ONE object having
value 1 and background having value 0.
Moment definition:
Note m00 is the area

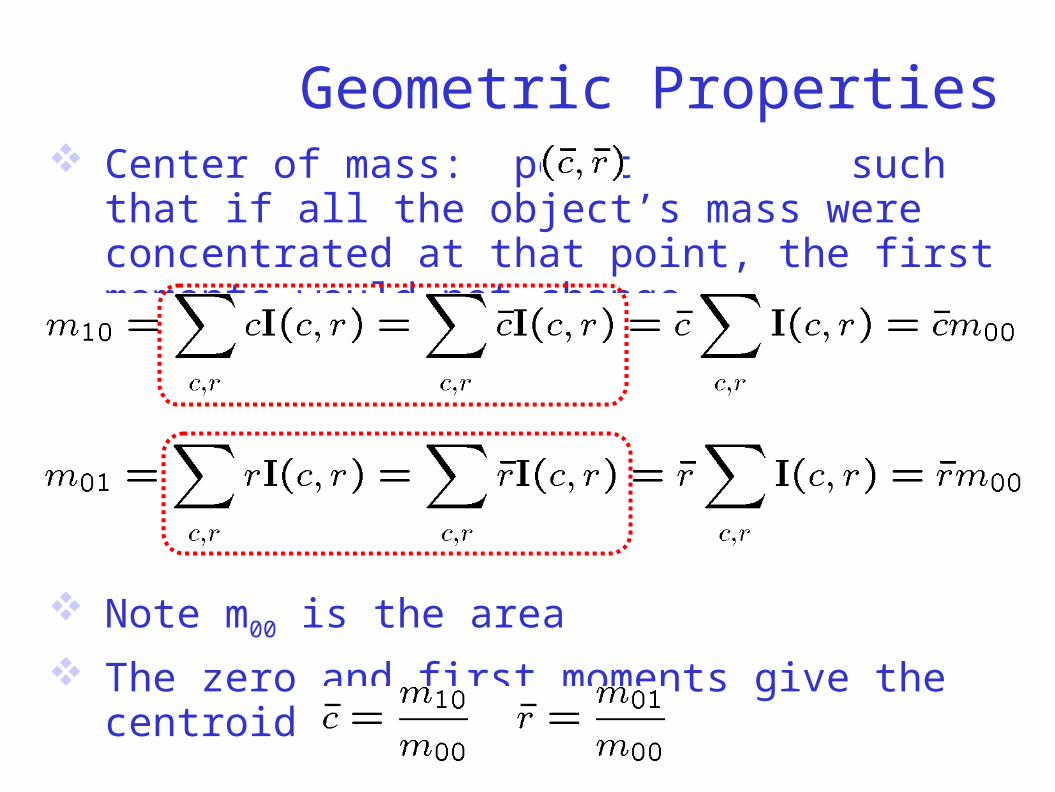
Geometric Properties Center of mass: point such that if all the
object’s mass were concentrated at that point, the first moments would not change
Geometric Properties Center of mass: point such that if all the
object’s mass were concentrated at that point, the first moments would not change
Note m00 is the area
The zero and first moments give the centroid

Geometric Properties Centralized Moment definition:
Note m00 is still the area but the first centralized moments are now zero

Geometric Properties Orientation: axis that passes through the object
such that the second moment of the object about that axis is minimal Or where
= minimum distance from pixel (c,r) to the line
To solve? Parameterize line with (, ) Compute partial derivatives of w.r.t. (, ) Find minima by setting partial derivatives to zero

Geometric Properties Line parameterization
Normal to line is Perpendicular distance from line to origin is
Now our task is to find:

Geometric Properties Derivative
Set to zero
Defines a line through centroid shift origin Line is now

Geometric Properties Derivative, set to zero
Solve (algebra…)
Or, using double angle formulas

Geometric Properties Principal axes from second moments
Orientation of principal axis w.r.t. image x-axis
Or using double angle formula we can also write:

Geometric Properties Alternate point of view
Think ellipses again Eigenvectors along major/minor axes Eigenvalues give length of major/minor axes
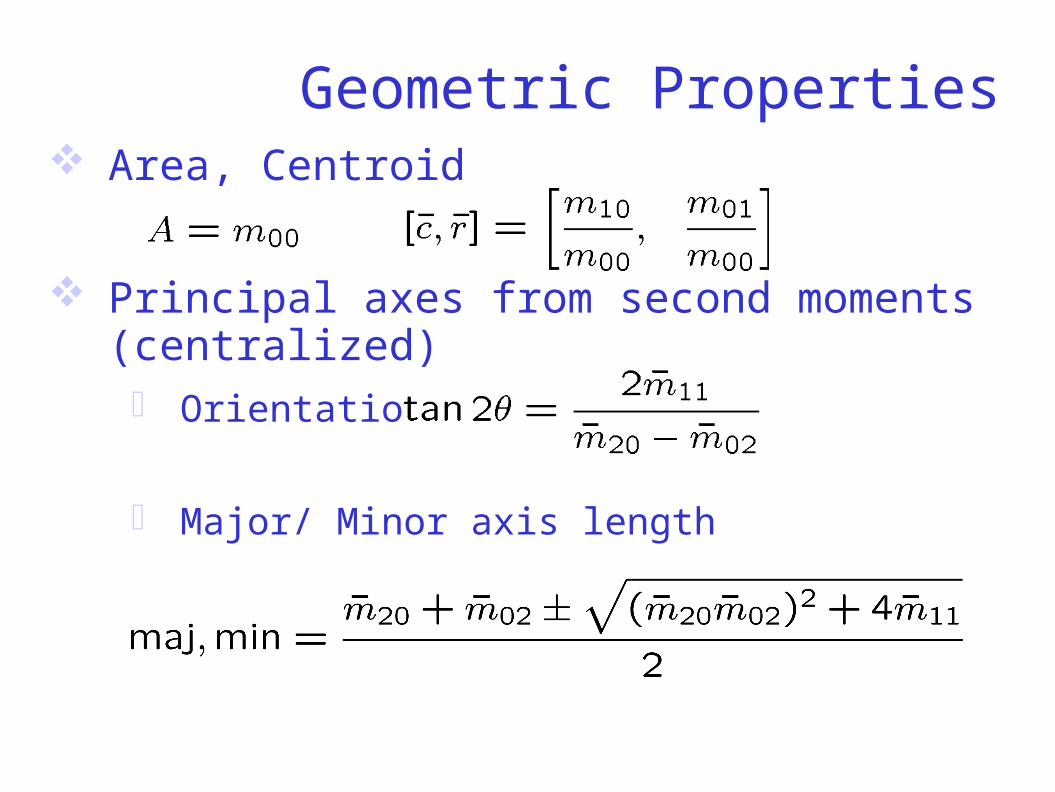
Geometric Properties Area, Centroid
Principal axes from second moments (centralized) Orientation
Major/ Minor axis length

Geometric Properties Normalized moments
Moment Invariants Functions whose values are approximately
constant under various transformations E.g. the zeroth moment does not change under
rotation about the optical axis (i.e. rotation in the image plane)

Geometric Properties Moment Invariants

Image Features
Measured quantities – can be used to “represent” the object Centroid Best fit ellipse (centroid + axes) Area Compactness
Perimeter2/(4 Area) ¸ 1 Eccentricity
(major axis length)/(minor axis length) Moment Invariants # Holes

We can represent the features associated with an object as a vector
Features & Patterns
area compactness Mi4 Mi5

We can represent the features associated with an object as a vector
A set of samples, described by their statistical properties with respect to a number of features defines a pattern.
Features & Patterns

From a set of samples we can find the mean value of each feature
The covariance is
Features & Patterns

The covariance is
Features & Patterns

The statistics (mean & covariance) can be used to classify an object.
Given a set of samples for objects (O1,…,OM) we can compute for each object class
For a new object, onew, we measure the features
Features & Patterns

Pattern classification: Which object (O1,…,OM) is this new object closest
too? How do we measure distance?
Euclidean:
Features & Patterns
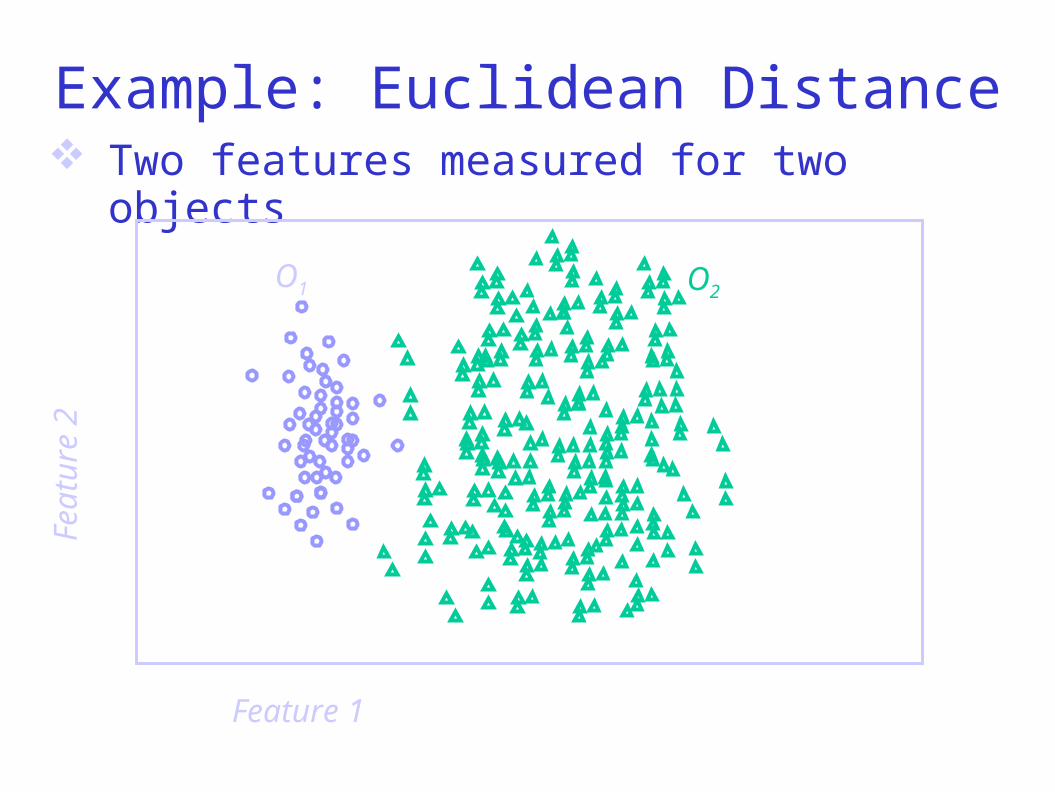
Two features measured for two objects
Example: Euclidean Distance
Feature 1
Fea
ture
2
O1 O2

Compute statistics
Example: Euclidean Distance
Feature 1
Fea
ture
2
O1 O2

Compute statistics
Example: Euclidean Distance
Feature 1
Fea
ture
2
O1 O2

Measure features for new object
Example: Euclidean Distance
Feature 1
Fea
ture
2
O1 O2
Measured feature values for new object

Compute distance
Example: Euclidean Distance
Feature 1
Fea
ture
2
O1 O2
Euclidean distance to mean of features for Objects 1 and 2
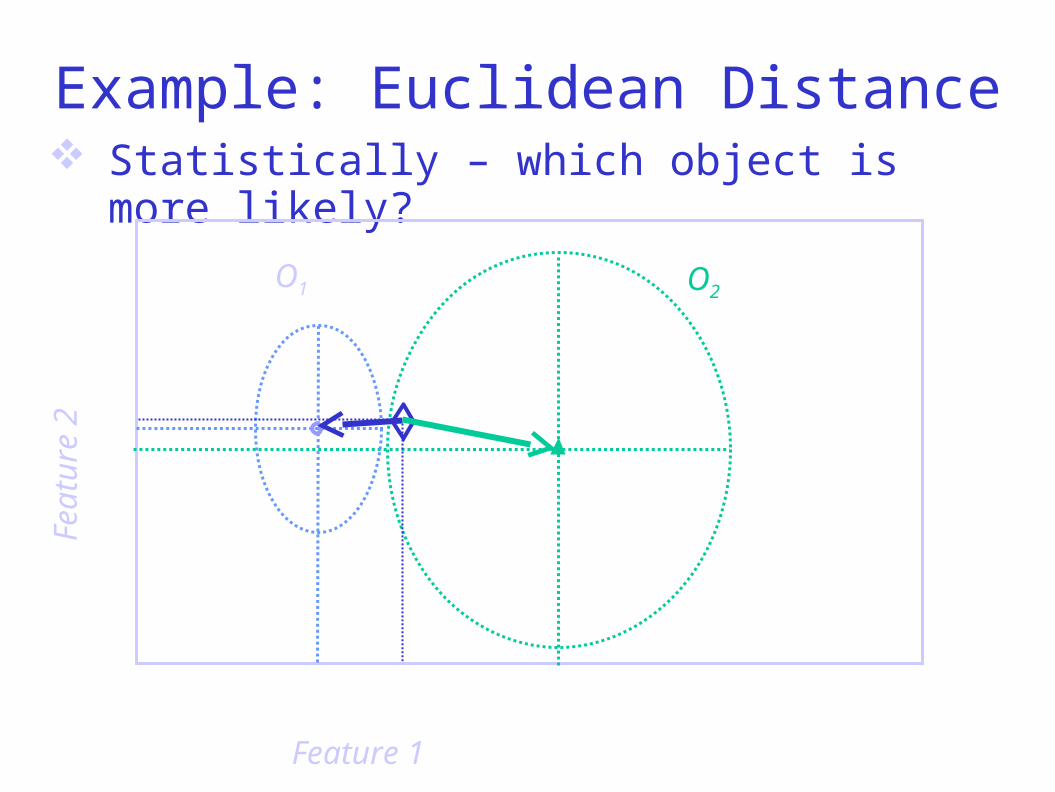
Statistically – which object is more likely?
Example: Euclidean Distance
Feature 1
Fea
ture
2
O1 O2

Pattern classification: How do we measure distance taking into account
statistics? Inversely weight distance with variance Mahalanobis distance:
Features & Patterns
Weights the distance by the inverse of the (co)variance

Two features measured for two objects
Example: Mahalanobis Distance
Feature 1
Fea
ture
2
O1 O2

Compute statistics
Example: Mahalanobis Distance
Feature 1
Fea
ture
2
O1 O2

Use statistics to measure disanceExample: Mahalanobis Distance
Feature 1
Fea
ture
2
O1 O2

For M objects we need to store the mean of the feature vector and the covariance
For a new object, onew, we measure the features and compute the distance to each object class (M distance computations) and find the minimum
Features & Patterns