Embed Size (px)
Citation preview
Astronomy & Astrophysics manuscript no. vdvem-2 ©ESO 2021June 9, 2021
Machine learning technique for morphological classificationof galaxies from SDSS. I. Photometry-based approach
Vavilova I.B.1, Dobrycheva D.V.1, Vasylenko M.Yu.1,2, Elyiv A.A.1, Melnyk O.V. 1, Khramtsov V.3
1Main Astronomical Observatory of the National Academy of Sciences of Ukraine, 27 Zabolotnogo St., Kyiv, 03143, Ukraine2Institute of Physics of the National Academy of Sciences of Ukraine, 46 avenu Nauki, Kyiv, 03028, Ukraine3Institute of Astronomy, V. N. Karazin Kharkiv National University, 35 Sumska St., Kharkiv, 61022, Ukraine
June 9, 2021
ABSTRACT
Context. Machine Learning methods are effective tools in astronomical tasks for classifying objects by their individual features. Oneof the promising utility is related to the morphological classification of galaxies at different redshifts.Aims. 1) To test in details five supervised machine learning techniques to determine their performance and define the most effectiveamong them for the automated morphological classification of the SDSS galaxies. 2) To test the influence of photometry, image,and spectral data on morphology classification. 3) To apply the best fitting machine learning methods for revealing the unknownmorphological types of galaxies from the SDSS DR9 at z < 0.1.Methods. We used different galaxy classification techniques: human labeling, multi-photometry diagrams, Naive Bayes, LogisticRegression, Support Vector Machine, Random Forest, k-Nearest Neighbors, and k-fold validation.Results. We present results of a binary automated morphological classification of galaxies conducted by human labeling, multi-photometry, and supervised Machine Learning methods. We applied its to the sample of galaxies from the SDSS DR9 with redshiftsof 0.02 < z < 0.1 and absolute stellar magnitudes of −24m < Mr < −19.4m. To study the classifier, we used absolute magnitudes:Mu, Mg, Mr, Mi, Mz, Mu − Mr, Mg − Mi, Mu − Mg, Mr − Mz, and inverse concentration index to the center R50/R90. Using theSupport vector machine classifier and the data on color indices, absolute magnitudes, inverse concentration index of galaxies withvisual morphological types, we were able to classify 316 031 galaxies from the SDSS DR9 with unknown morphological types.Conclusions. The methods of Support Vector Machine and Random Forest with Scikit-learn machine learning in Python providethe highest accuracy for the binary galaxy morphological classification: 96.4% correctly classified (96.1% early E and 96.9% late Ltypes) and 95.5% correctly classified (96.7% early E and 92.8% late L types), respectively. Applying the Support Vector Machine forthe sample of 316 031 galaxies from the SDSS DR9 at z < 0.1, we found 141 211 E and 174 820 L types among them.
Key words. Galaxies, galaxy morphology, machine learning methods
1. Introduction
During the 1990s, the Artificial Neural Network (ANN) algo-rithms were intended for automatic morphological classificationof galaxies since the huge extragalactic data sets have been con-ducted. A classification accuracy (or a success rate) of the ANNswas from 65 % to 90 % depending on the mathematical subtletiesof the applied methods and the quality of galaxy samples. One ofthe first such works was made by Storrie-Lombardi et al. (1992)with a feed-forward neural network, which has dealt with theclassification of 5217 galaxies onto five classes (E, SO, Sa-Sb,Sc-Sd, and Irr) with a 64 % accuracy. A detailed comparisonof human and neural classifiers was presented by Naim et al.(1995), who used a Principal Component Analysis to classify831 galaxies: the best result was with rms deviation of 1.8 T-types. Summarizing such first attempts, Lahav (1995), Lahav etal. (1996) resumed that “the ANNs can replicate the classifica-tion by a human expert almost to the same degree of agreementas that between two human experts, to within 2 T-type units”.
An excellent introduction to the classification algorithms forastronomical tasks, including the morphological classificationof galaxies, is given by Ball and Brunner (2010), Way et al.(2012), VanderPlas et al. (2012), Vander Plas, Connolly, andIvezic (2014), Al-Jarrah et al. (2015), Fluke and Jacobs (2020),
El Bouchefry and de Souza (2020), Vavilova et al. (2020) as wellas, see, a classical work by Buta (2011) and a good pedagogicalreview with a discussion of the major methods, in which galax-ies are studied morphologically and structurally, by Conselice etal. (2014).
The Sloan Digital Sky Survey (SDSS), which started in2000, has collected more data in its first few weeks than had beenamassed in astronomy history. Now, 20 years later, its archivecontains about 170 terabytes of information. Soon its successor,the Large Synoptic Survey Telescope, will acquire that quantityof data every five days (York et al. 2000). This provided entrypoints for the computer scientists wanting to get engaged in as-tronomical research and explains why big data mining and ma-chine learning methods are gaining, so popularity to categorizecelestial bodies in big datasets with more accuracy than ever.
In this context, we review several works below, where differ-ent approaches were developed, and great efforts were made toidentify the morphological types of galaxies from the SDSS inthe visual and in the automated modes.
Ball et al. (2004) have tested the Supervised ANN formorphological classifications and obtained that it may be ap-plied without human intervention for the SDSS galaxies (cor-relations between predicted and actual properties were around
Article number, page 1 of 10
arX
iv:1
712.
0895
5v3
[as
tro-
ph.G
A]
8 J
un 2
021
A&A proofs: manuscript no. vdvem-2
0.9 with rms errors of order 10 %). de la Calleja and Fuentes(2004) developed a method that combines two machine learn-ing algorithms: Locally Weighted Regression and ANN. Theytested it with 310 images of galaxies from the NGC catalogueand obtained accuracy 95.11 %, and 90.36 %, respectively. Sid-dhartha et al. (2007) explored Support Vector Machines, Ran-dom Forests, and Naive Bayes as the galaxy image classifiersand Principal Component Analysis for the direct image pixeldata compressing. They resulted in favor of the Random For-est method, but have cited the opinion of several astronomerson the successful perspective of galaxy classification by mor-phic features as: “one of the most cumbersome areas in celes-tial classification, and the one that has proven the most difficultto automate”. Nevertheless, Andrae, Melchior, and Bartelmann(2010) applied a probabilistic classification algorithm to clas-sify the SDSS bright galaxies and obtained that it produces rea-sonable morphological classes and object-to-class assignmentswithout any prior assumptions.
Calderon and Berlind (2019) in their work with a machinelearning approach for the prediction of galaxies’ dark matter halomasses used XGBoost, Random Forest, and neural network. Thesets of synthetic galaxy catalogs were used as training samplesto built by populating dark matter halos in N-body simulations.Matching both the clustering and the joint-distributions of galaxyproperties they were able to obtain halo masses of galaxies fromthe SDSS DR7 sample.
As for the visual morphological classification conducted dur-ing the last years, we note as follows. Nair and Abraham (2010)prepared the detailed visual classifications for 14 034 galaxiesfrom the SDSS DR4 at z < 0.1, which can be used as a goodtraining sample for calibrating the automated galaxy classifica-tion algorithms. A significant study was conducted by Banerji etal. (2010), where galaxies from the Galaxy Zoo Project1 haveformed a training sample for morphological classifications ofgalaxies from the SDSS DR6 into three classes (early types, spi-rals, spam objects). These authors convincingly showed that us-ing a set of certain galaxy parameters, the Neural Network canreproduce the human classifications to better than 90 % for allthese classes and that the Galaxy Zoo catalog (GZ1) can serveas a training sample.
The hundreds of thousands of volunteers were involved intothe Galaxy Zoo project to make visual classification of a mil-lion galaxies in the SDSS (Lintott et al. 2008). Most of their re-sults have found good scientific applications. For example, usingthe raw imaging data from SDSS that was available in the GZ1,and the handpicked galaxy’s features from the SDSS, Kates-Harbeck (2012) applied a logistic regression classifier and at-tained 95.21 % classification accuracy. Willett et al. (2013) is-sued a new catalog of morphological types from the GalaxyZoo Project (GZ2) in the synergy with the SDSS DR7, whichcontains more than 16 million morphological classifications of304 122 galaxies and their finer morphological features (bulges,bars, and the shapes of edge-on disks as well as parameters ofthe relative strengths of galactic bulges and spiral arms).
Kuminski and Shamir (2016) have generated a morphologycatalog of the SDSS galaxies with the Wndchrm image anal-ysis utility using the nearest neighbor classifier. These authorspointed out that about 900 000 of the instances classified as spi-rals and about 600 000 of those classified as ellipticals have astatistical agreement rate of about 98 % with the Galaxy Zooclassification, see, also, Simmons et al. (2017) on synergy ofgalaxy classification from CANDELS. Murrugarra et al. (2017)
1 http://data.galaxyzoo.org
evaluated the Convolutional Neural Network to classify galaxiesfrom the SDSS onto two classes as ellipticals/spirals by imageprocessing and attained accuracy 90 – 91 %. Using the same ma-chine learning technique, the Convolutional Neural Network, es-pecially inception method, Rahman et al. (2018) conducted clas-sification into three general categories: ellipticals, spirals, andirregulars. They used 710 images (206 E, 320 S p, 184 Irr) andobtained that images, which have went through image process-ing, showed a rather poor testing accuracy compared to not us-ing any form of image processing. Their best testing accuracywas 78.3 %. Both supervised and unsupervised methods wereapplied by Gauthier et al. (2016) to study the Galaxy Zoo datasetof 61 578 pre-classified galaxies (spiral, elliptical, round, disk).They found that the variation of galaxy images are correlatedwith brightness and eccentricity, the Random Forest methodgives the best accuracy (67 %), meanwhile its combination withregression to predict the probabilities of galaxies associated witheach class allows to reach a 94 % accuracy.
Wherein the photometric and spectral parameters of each ob-ject, as well as their images, are available through the SDSS web-site. It allows to use a well-known fact that galaxy morphologi-cal type is correlated with the color indices, luminosity, de Vau-couleurs radius, inverse concentration index, etc. In series of ourwork, we have demonstrated an effectiveness of a combinationof the visual classification and the two-dimensional diagrams ofcolor indices g − i and one of the aforementioned parameters(Vavilova, Melnyk, and Elyiv 2009; Melnyk, Dobrycheva, andVavilova 2012; Dobrycheva and Melnyk 2012; Vavilova et al.2015), see, also, for human and machine intelligence in GZooprojects (Beck et al. 2018). Namely, using the “color indices vsinverse concentration indexes” diagrams for each galaxy with ra-dial velocities 3000 < V < 9500 km/s from the SDSS DR5 weobtained criteria for separating the galaxies into three classes,specifically: (E) early types – elliptical and lenticular, (S ) spiralS a − S cd, and (LS ) late spiral S d − S dm and irregular Im/BCGgalaxies. Making a ternary automatic morphological galaxy clas-sification (Fig. 1) we attained a good accuracy 98 % for E, 88 %for S , and only 57 % for LS types. This approach based onthe photometric data only (multi-parametric diagrams) was ap-plied by us to classify a sample of 316 031 SDSS galaxies at0.003 ≤ z ≤ 0.1 from the SDSS DR9 (142 979 E, 112 240 S ,60 812 L type (Dobrycheva 2017, 2013)2). The more detailedexplanation is given by Dobrycheva et al. (2018).
This work deals with the automated morphological classifi-cation of the low redshift galaxies from the SDSS DR9 & DR16.We used the cosmological WMAP7 parameters ΩM = 0.27,ΩΛ = 0.73, Ωk = 0, H0 = 0.71 and put the following tasks:
– to verify various machine learning methods for selection ofmore effective among them to classify galaxies at z < 0.1with unknown morphological types from the SDSS DR9;
– to determine margins where the automated morphology clas-sification based on the photometric parameters of galax-ies gives the best result, including peculiarities of the Hub-ble/Vaucouleurs type of galaxy forms at different redshifts;to reveal typical problem points;
– to apply the developed criteria for the automatic morpholog-ical classification of galaxies at z < 0.1 from the SDSS DR9with unknown morphological types.
2 http://leda.univ-lyon1.fr/fG.cgi?n=hlstatistics&a=htab&z=d&sql=iref==52204
Article number, page 2 of 10

Vavilova, Dobrycheva, Vasylenko et al.: Machine learning for the automated galaxy morphological classification
Fig. 1. (Top) Dependence of the morphological types T on the colorindices g − −i for 730 galaxies from the SDSS DR5. (Down) The in-verse concentration indexes R50/R90 as functions of color indices forthese galaxies; the red circles correspond to early types (-2–0), the bluecircles to spirals (1-6), and the green circles to late type spiral and ir-regular galaxies. The lines define three regions into which a maximumnumber (> 90 %) of galaxies of morphological types (-2–0), (1–6), and(7–10) falls, respectively, with a minimum number of other morpholog-ical types
2. Galaxy samples from the SDSS DR9 for theautomated morphological classification
2.1. Galaxy sample
A preliminary sample of galaxies at z < 0.1 with the absolutestellar magnitudes −24m < Mr < −13m from the SDSS DR9contained of ∼ 724 000 galaxies. Following the SDSS recom-mendation, we input limits mr < 17.7 by visual stellar magni-tude in r-band to avoid typical statistical errors in spectroscopicflux. After excluding the duplicates of galaxy images and “spam”objects the final sample contained of N = 316 031 galaxies. Toclear the sample from duplicates of images of the same galaxywe used own code based on the minimal angle distances betweensuch SDSS objects.
Fig. 2. Diagram of color indices g− i and inverse concentration indexesR50/R90 of training sample (6163 galaxies randomly selected with dif-ferent redshifts and luminosities from the SDSS DR9). The red color in-dicates the visually classified galaxies (human labeling) of early E −S 0types, and the blue color indicates late S a − Irr types.
Fig. 3. Diagram of color indices g− i and inverse concentration indexesR50/R90 of 316 031 galaxies at z < 0.1 from the SDSS DR9 after ap-plying the Support Vector Machine (SVM) method: red color – early E(from elliptical to lenticular) and blue color – late L (from S 0a to irreg-ular Im/BCG) types. Color bar from 0 to 1 shows SVM probability toclassify galaxy as the late to the early morphological type
The absolute stellar magnitude of the galaxy was obtainedby the formula
Mr = mr − 5 · lg(DL) − 25 − Kr(z) − extr,
where mr - visual stellar magnitude in r band, DL - luminositydistance, extr - the Galactic absorption in r band in accordanceto ?, Kr(z) - k-correction in r band according to Chilingarian,Melchior, and Zolotukhin (2010); Chilingarian and Zolotukhin(2012).
The color indices were calculated as
Mg − Mi = (mg − mi) − (extg − exti) − (Kg(z) − Ki(z)),
where mg and mi - visual stellar magnitude in g and i band; extgand exti - the Galactic absorption in g and i band; Kg(z) and Ki(z)- k-correction in g and i band, respectively.
Article number, page 3 of 10

A&A proofs: manuscript no. vdvem-2
A ternary morphological classification with the method ofmulti-parametric diagrams (in-box classification) do not attain areasonable accuracy to classify spiral galaxies of S a − S cd type(see, Section 1 and Fig. 1 as well as Dobrycheva et al. (2015,2018); Vavilova et al. (2020)).
So, for verifying various supervised machine learning meth-ods we decided to provide a binary automated morphologicalclassification: early type galaxies E – from ellipticals to lenticu-lars; late type galaxies L – from S 0a−S dm to irregular Im/BCGgalaxies.
2.2. Training samples
The supervised machine learning methods are searching for rela-tionship between the input and output data, in our case, betweenfeatures of galaxies (photometric parameters) and their morpho-logical types. A training sample should represent as more as pos-sible of these features allowing to generalize and to build themodel for the prediction of the target variables in an unlabeledtest sample (see, for example, Kremer et al. (2017). That is whyour first step before applying the machine learning methods wasto compose a good training sample.
We identified visually the morphological types (E and L ) of6 163 galaxies from the sample described in Section 2.1, whichwere randomly selected at different redshifts and with differentluminosity. This is ∼ 2% of a total number of the studied galaxysample (see, Section 4 for discussion and Fig. 4).
Using one of the three color indices and such parame-ters as the inverse concentration index, absolute stellar magni-tude, de Vaucouleurs radius, and scale radius (color − R50/R90,color − Mr, color − deVRadr, and color − expRadr diagrams,respectively), it is possible to carry out a reliable preliminarymorphological classification without invoking visual inspection.The dependence of the color indices and the parameter R50/R90gives the best fitting because of the values of the parameters donot depend on the radial galaxy velocity and that the selectioneffects are avoid (Dobrycheva and Melnyk 2012). As the exam-ple, see a diagram of inverse concentration indexes R50/R90 asa function of color indices g − i for 6 163 galaxies of the train-ing sample, which is shown in Fig. 2. It demonstrates a goodseparation onto the early and late galaxy types and reveals alsoclearly the well-known bimodality color indices effect (Baloghet al. 2004; Schawinski et al. 2014). The overlap of the types inrange of Mg − Mi from 1.1 to 1.3 is still substantial and will bediscussed in Section 5.
We used the classification criterion for the color indexg − i and R50/R90. In this case, the criterion was determinedvisually by the graph of the relationship between these twovalues. The accuracy of the method for E types was 96%, andfor L types - 67%, however, the training sample at that timewe had a test, which means that the actual accuracy was atleast a few percent lower.
3. The supervised machine learning methods andmorphological classification
The learning can be supervised, semi-supervised, unsupervised,and reinforcement (Burkov, “The Hundred-page Machine Learn-ing Book”, 2019). In our work we used only the supervisedmethods, where the dataset is collection of the labeled examples(xi, yi)N
i=1.In our case, each element xi among N is a galaxy feature vec-
tor, in which each dimension j = 1, ...,D contains a value that de-
scribes yi. That value is called a feature and is denoted as x( j). Forinstance, if each example x in our collection represents a galaxy,then the first feature, x(1), could contain absolute magnitude Mu,the second feature, x(2), could contain color indices Mu − Mr,and x(3) could contain the inverse concentration index R50/R90.Summing up, there are absolute magnitudes Mu,Mg,Mr,Mi,Mz,color indices Mu −Mr,Mg −Mi,Mr −Mz, inverse concentrationindexes R50/R90 to the center. For all examples in the dataset,the feature at position j in the feature vector always contains thesame kind of information. It means that if x(2)
i contains color in-dices Mu − Mr for some example xi, then x(2)
k will also containcolor indices Mu−Mr in each example xk, k = 1, ...,N. The labelyi can be either an element belonging to a finite set of classes1, 2, ...,T , or a real number, or a more complex structure, like avector, a matrix, a tree, or a graph. In our work we have onlytwo classes, E, L, where E means the early type of galaxy and Lmeans the late morphological type.
The goal of a supervised learning algorithm is to use thedataset for producing a model that takes a feature vector x as in-put and output information allowing to deduce the label for thisfeature vector. For instance, the model with a dataset of galaxiescould take a feature vector describing the morphological type ofgalaxy as the input information and a probability that the galaxyhas E or L morphological type as the output information.
We applied software with an open-source KNIME Analyt-ics Platform ver. 3.7.0 3, which is intended for prediction ofdata classification with different machine learning methods andis actively used in the data science. Using KNIME we built andtrained following classifiers: Naive Bayes, Random Forest, Sup-port Vector Machine based on WEKA software, and neutral net-works (RProp MLP). Using Scikit-Learn machine learning li-brary (ver. 0.2.2 for the Python programming language), which isa simple tool for data mining and data analysis (see, for example,Ivezic and Babu, Statistical Challenges in Astronomy, 2014), wetrained Naive Bayes, Random Forest, Support Vector Machine,K-nearest Neighbor, and Logistic Regression.
For training the classifier, we used the absolute magnitudes:Mu,Mg,Mr,Mi,Mz, color indices Mu − Mr,Mg − Mi,Mr − Mz,and inverse concentration index R50/R90 (Section 2.2).
3.1. Naive Bayes
The Naive Bayes classifiers are based on the Bayes theorem andconditional independence of the features to calculate the prob-ability of class G (in our case it is a morphological type ofgalaxies) with a given feature vector (set of galaxy attributes)X = (x1, . . . , xi)
p(G|X) =p(G)p(X|G)
p(X).
If we accept the conditional independence assumption, in-stead of computing the class-conditional probability for eachcombination of X, we only have to estimate the conditionalprobability of each xi, given G. To classify a test record, theNaive Bayes Classifier computes the posterior probability foreach class G:
p(G|X) =p(G)
∏ni=1 p(xi|G)
p(X).
3 https://www.knime.com/
Article number, page 4 of 10
Vavilova, Dobrycheva, Vasylenko et al.: Machine learning for the automated galaxy morphological classification
3.2. Random Forest
The Random Forest classifiers works as follows: the trainingsample contains of N objects (for example, 749 galaxies withmorphological types identified visually, fig.1) dimension of ob-jects feature is M (Mu,Mg,Mr,Mi,Mz,Mu − Mr,Mg − Mi,Mr −
Mz, inverse concentration indexes R50/R90 to the center) andthe parameter m is given (as usually m =
√M) as an incomplete
number of traits for training. Then we built the committee tree,where the most common way is as follows:
– to generate a random subsample with size N likely in thetraining sample. (Thus, some object will hit in two or moretimes, and on average N(1 − 1/N)N , and approximately N/eobjects will not hit in at all);
– to construct the decision tree that classifies the objects of thissubsample. The next node of the tree in the process of creat-ing will use not all M objects feature, but only m, which arerandomly chosen;
– to develop the tree up to the complete exhaustion of the sub-sample.
Classification of objects is conducted by voting: each tree ofthe committee classifies the object to one of the classes, and theclass wins if it has the most significant number of trees voted(Breiman, “Machine Learning”, 2001).
3.3. Support Vector Machine
We get a training dataset of n points of the form(x1, y1), . . . , (xn, yn), where the yi are either 1 or −1 (in our workit is E or L morphological type of the galaxy). Each point indi-cates to which the point xi belongs (set of attributes of galax-ies). Each xi is a p-dimensional real vector. We should find the“maximum-margin hyperplane” that divides the group of pointsxi, for which yi = 1 from the group of points and for whichyi = −1 is defined in such a manner that the distance betweenthe hyperplane and the nearest point xi from either group is max-imized. Any hyperplane can be written as the set of points xisatisfying wixi−b = 0, where wi is the normal vector (not neces-sarily normalized) to the hyperplane. This is much likely Hessenormal form, except that wi is not necessarily a unit vector. Theparameter b
‖w‖ determines the offset of the hyperplane from theorigin along the normal vector w (VanderPlas, “Python Data Sci-ence Handbook: Essential Tools for Working with Data”, 2016).
3.4. K-Nearest Neighbors
The classifier based on K-nearest neighbors is an example ofthe most straightforward machine learning algorithm. It does notcreate class-dividing functions, but remembers the position oftraining sample objects in the hyperspace of features. The disad-vantage of this method is that its productivity linearly dependson the size of the training sample, the dependence from metrics,and the difficulty in selecting statistical weight. To implementthis method, it is enough to choose the number of neighbors -K, the distance metric, find the K nearest neighbors in this met-ric and assign to object the class of the largest number of hisneighbors. This method can be used not only for binary clas-sification. In this case, the neighbors can be assigned a statis-tical weight of 1/d, where d is the distance in the hyperspaceof features. This meter is also sensitive to normalization, as allfeatures must make the same contribution to the distance estima-tion. Finding the number K is important because it allows to de-scribe the model avoiding retraining and undertraining (Raschka,
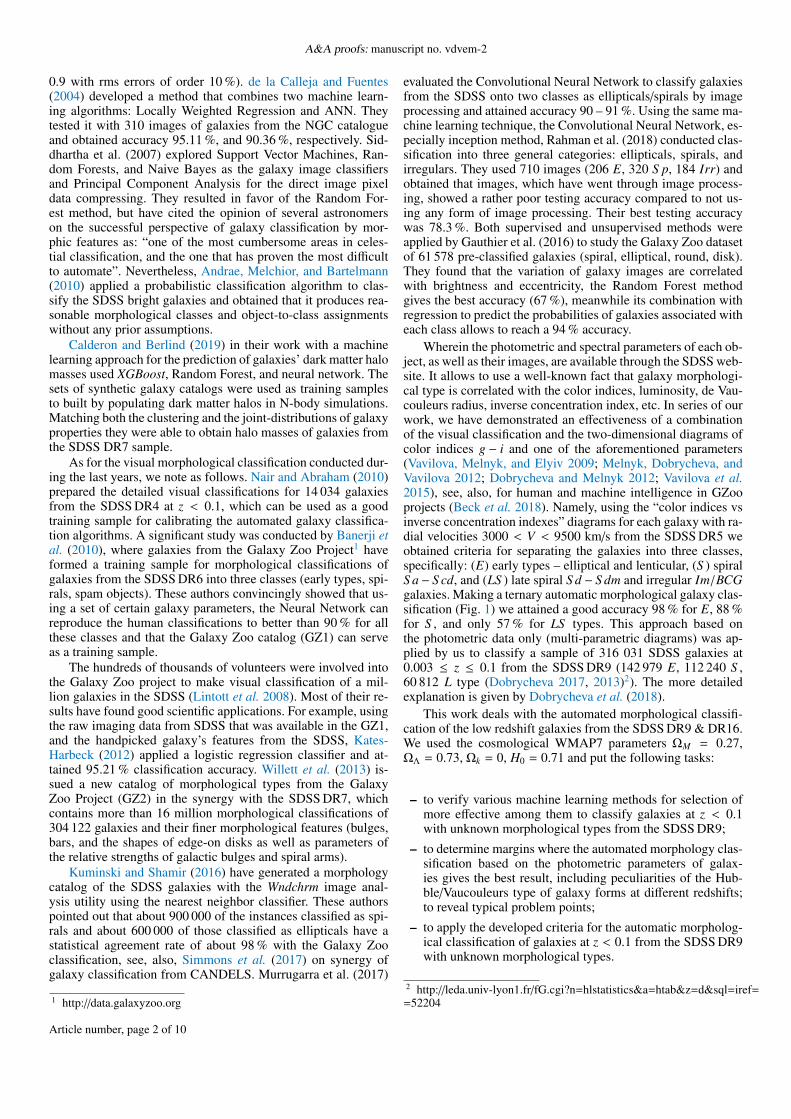
Fig. 4. Verification of whether there are enough galaxies in a trainingsample to build a Machine Learning model. The green line (SupportVector Classifier), the red line (Random Forest), the rose line (LogisticRegression), the blue line (k-Nearest Neighbors), and the orange line(Naive Bayes) show the average accuracy of 10 repetitions of the eval-uation procedure in Scikit-learn machine learning with Python.
“Python Machine Learning”, 2015). Depending on the metric ofspace, the distance will be determined in different ways, for ex-ample, in Euclidean space:
di, j =
√∑k
|xi − x j|2
3.5. Logistic Regression
In Logistic Regression, we can model a morphological type ofgalaxy yi as a linear function of xi. However, with a binary yithis is not straightforward because wxi+b is a function that spansfrom minus infinity to plus infinity, while yi has only two pos-sible values (Burkov (2019), Raschka (2015)). For binary mor-phological classification, we should define a negative label as 0and the positive label as 1, and we would need to find a simplecontinuous function whose codomain is (0, 1). In such a case, ifthe value returned by the model for input x is closer to 0, thenwe assign a negative label to x; otherwise, the example is labeledas positive. One function that has such a property is the standardlogistic function (also known as the sigmoid function):
f (x) =1
1 + e−x .
4. Results
We used the method of k-folds validation to estimate the ac-curacy with KNIME. Namely, we divided the sample into ran-domly selected five pieces, one by one, 4 of which served as atraining and 1 as a test sample. Such a procedure was repeatedfive times and classification accuracy was defined as the aver-age of the test samples. We set aside 20% of the training sampleto verify the accuracy of predicting of morphological types withPython. As a next step, we used the k-folds validation to predictthe types in this delayed valid sample that were used to verifythe accuracy of the method.
We have considered the accuracy change as a function of thesample size: if this function attains a level with the larger sizes,
Article number, page 5 of 10
A&A proofs: manuscript no. vdvem-2
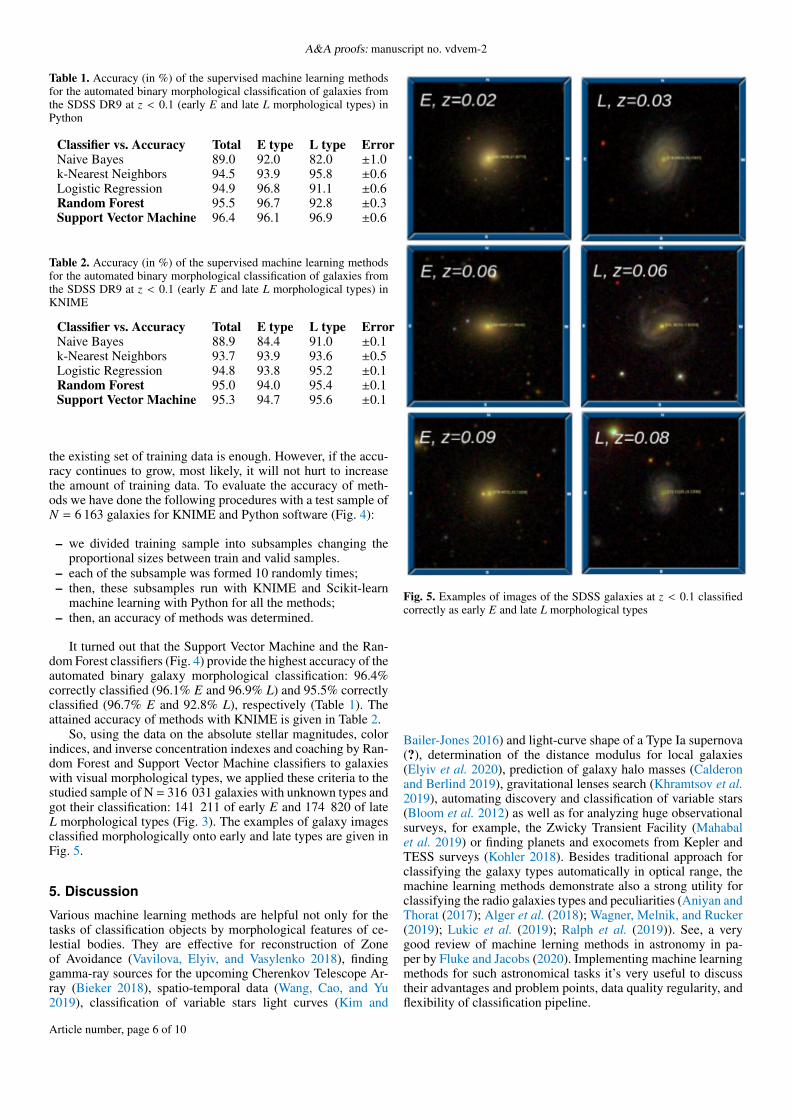
Table 1. Accuracy (in %) of the supervised machine learning methodsfor the automated binary morphological classification of galaxies fromthe SDSS DR9 at z < 0.1 (early E and late L morphological types) inPython
Classifier vs. Accuracy Total E type L type ErrorNaive Bayes 89.0 92.0 82.0 ±1.0k-Nearest Neighbors 94.5 93.9 95.8 ±0.6Logistic Regression 94.9 96.8 91.1 ±0.6Random Forest 95.5 96.7 92.8 ±0.3Support Vector Machine 96.4 96.1 96.9 ±0.6
Table 2. Accuracy (in %) of the supervised machine learning methodsfor the automated binary morphological classification of galaxies fromthe SDSS DR9 at z < 0.1 (early E and late L morphological types) inKNIME
Classifier vs. Accuracy Total E type L type ErrorNaive Bayes 88.9 84.4 91.0 ±0.1k-Nearest Neighbors 93.7 93.9 93.6 ±0.5Logistic Regression 94.8 93.8 95.2 ±0.1Random Forest 95.0 94.0 95.4 ±0.1Support Vector Machine 95.3 94.7 95.6 ±0.1
the existing set of training data is enough. However, if the accu-racy continues to grow, most likely, it will not hurt to increasethe amount of training data. To evaluate the accuracy of meth-ods we have done the following procedures with a test sample ofN = 6 163 galaxies for KNIME and Python software (Fig. 4):
– we divided training sample into subsamples changing theproportional sizes between train and valid samples.
– each of the subsample was formed 10 randomly times;– then, these subsamples run with KNIME and Scikit-learn
machine learning with Python for all the methods;– then, an accuracy of methods was determined.
It turned out that the Support Vector Machine and the Ran-dom Forest classifiers (Fig. 4) provide the highest accuracy of theautomated binary galaxy morphological classification: 96.4%correctly classified (96.1% E and 96.9% L) and 95.5% correctlyclassified (96.7% E and 92.8% L), respectively (Table 1). Theattained accuracy of methods with KNIME is given in Table 2.
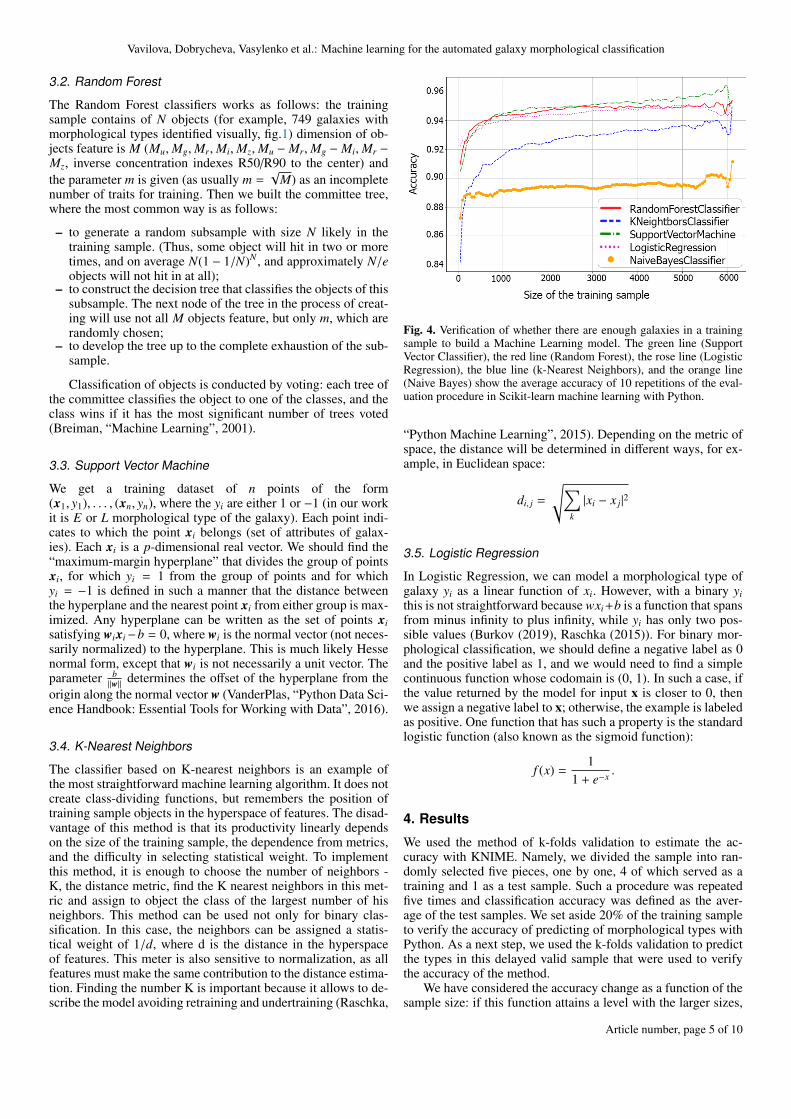
So, using the data on the absolute stellar magnitudes, colorindices, and inverse concentration indexes and coaching by Ran-dom Forest and Support Vector Machine classifiers to galaxieswith visual morphological types, we applied these criteria to thestudied sample of N = 316 031 galaxies with unknown types andgot their classification: 141 211 of early E and 174 820 of lateL morphological types (Fig. 3). The examples of galaxy imagesclassified morphologically onto early and late types are given inFig. 5.
5. Discussion
Various machine learning methods are helpful not only for thetasks of classification objects by morphological features of ce-lestial bodies. They are effective for reconstruction of Zoneof Avoidance (Vavilova, Elyiv, and Vasylenko 2018), findinggamma-ray sources for the upcoming Cherenkov Telescope Ar-ray (Bieker 2018), spatio-temporal data (Wang, Cao, and Yu2019), classification of variable stars light curves (Kim and
Fig. 5. Examples of images of the SDSS galaxies at z < 0.1 classifiedcorrectly as early E and late L morphological types
Bailer-Jones 2016) and light-curve shape of a Type Ia supernova(?), determination of the distance modulus for local galaxies(Elyiv et al. 2020), prediction of galaxy halo masses (Calderonand Berlind 2019), gravitational lenses search (Khramtsov et al.2019), automating discovery and classification of variable stars(Bloom et al. 2012) as well as for analyzing huge observationalsurveys, for example, the Zwicky Transient Facility (Mahabalet al. 2019) or finding planets and exocomets from Kepler andTESS surveys (Kohler 2018). Besides traditional approach forclassifying the galaxy types automatically in optical range, themachine learning methods demonstrate also a strong utility forclassifying the radio galaxies types and peculiarities (Aniyan andThorat (2017); Alger et al. (2018); Wagner, Melnik, and Rucker(2019); Lukic et al. (2019); Ralph et al. (2019)). See, a verygood review of machine lerning methods in astronomy in pa-per by Fluke and Jacobs (2020). Implementing machine learningmethods for such astronomical tasks it’s very useful to discusstheir advantages and problem points, data quality regularity, andflexibility of classification pipeline.
Article number, page 6 of 10
Vavilova, Dobrycheva, Vasylenko et al.: Machine learning for the automated galaxy morphological classification
5.1. Several problem points of the supervised machinelearning methods for the automated morphologicalclassification of galaxies from the SDSS
The main problems of machine learning related to the morpho-logical classification can be divided into two categories. The firstone is related with a sample preparation, which includes: deter-mining the parameters which are the best for dividing objects toclasses, selecting a homogeneous dataset for classification pa-rameters, creating a sub-directory for training algorithms, clean-ing the sub-list of ”undesired” (misclassified) objects, determin-ing the best methods for the task, and selecting the best machinelearning features to build training sample. The second categoryincludes problems related to the individual peculiarities of se-lected objects and to the quality of image/photometry/spectrumgalaxy data.
Selection of the best parameters of machine learning fortraining. To determine the training parameters, we need the re-lationship between the accuracy of the model in training and testsamples. In other words, we need to determine the parametersfor which a) the accuracy on the test data will be maximized, b)the difference between the test and training data is minimal, andc) the accuracy on the training data is less than 100 % to avoidof over fitting (see, for example, Fig. 4). The complexity is thatthese points do not always lie one below the other, So, the av-erage values of the precision ratios on the training and test datashould be analyzed for a large number of cycles to determine thebest parameters (Vasylenko et al. 2019).
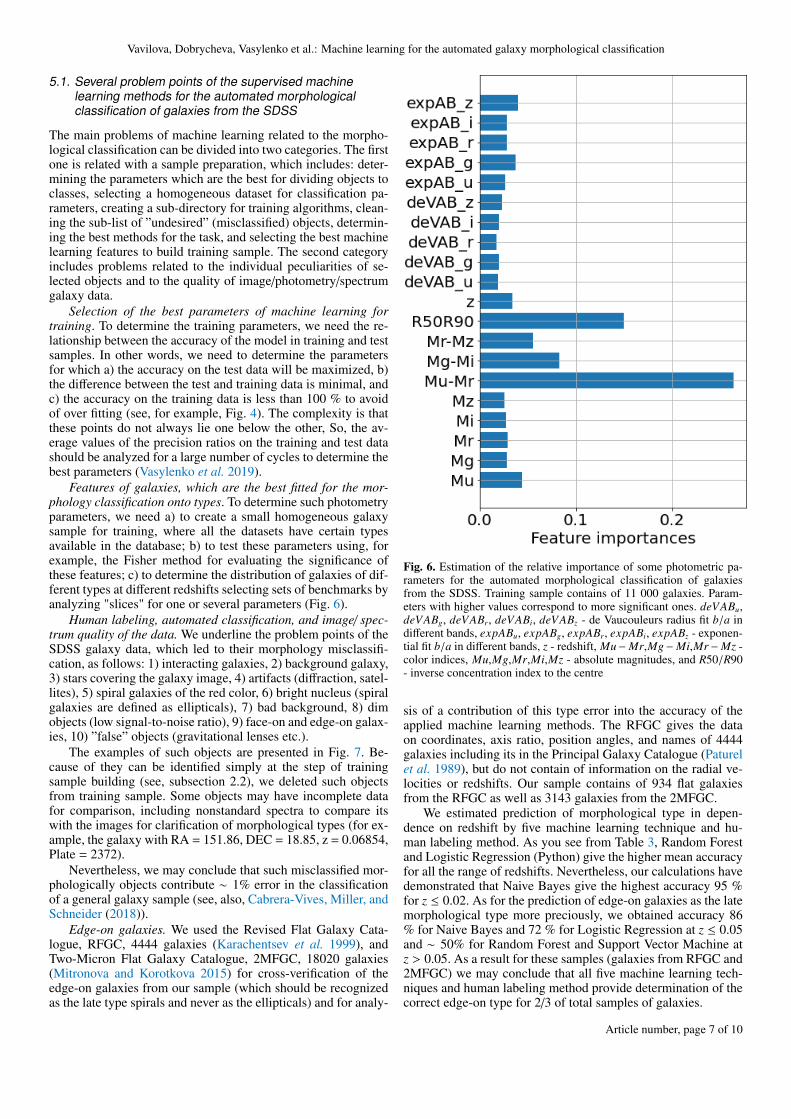
Features of galaxies, which are the best fitted for the mor-phology classification onto types. To determine such photometryparameters, we need a) to create a small homogeneous galaxysample for training, where all the datasets have certain typesavailable in the database; b) to test these parameters using, forexample, the Fisher method for evaluating the significance ofthese features; c) to determine the distribution of galaxies of dif-ferent types at different redshifts selecting sets of benchmarks byanalyzing "slices" for one or several parameters (Fig. 6).
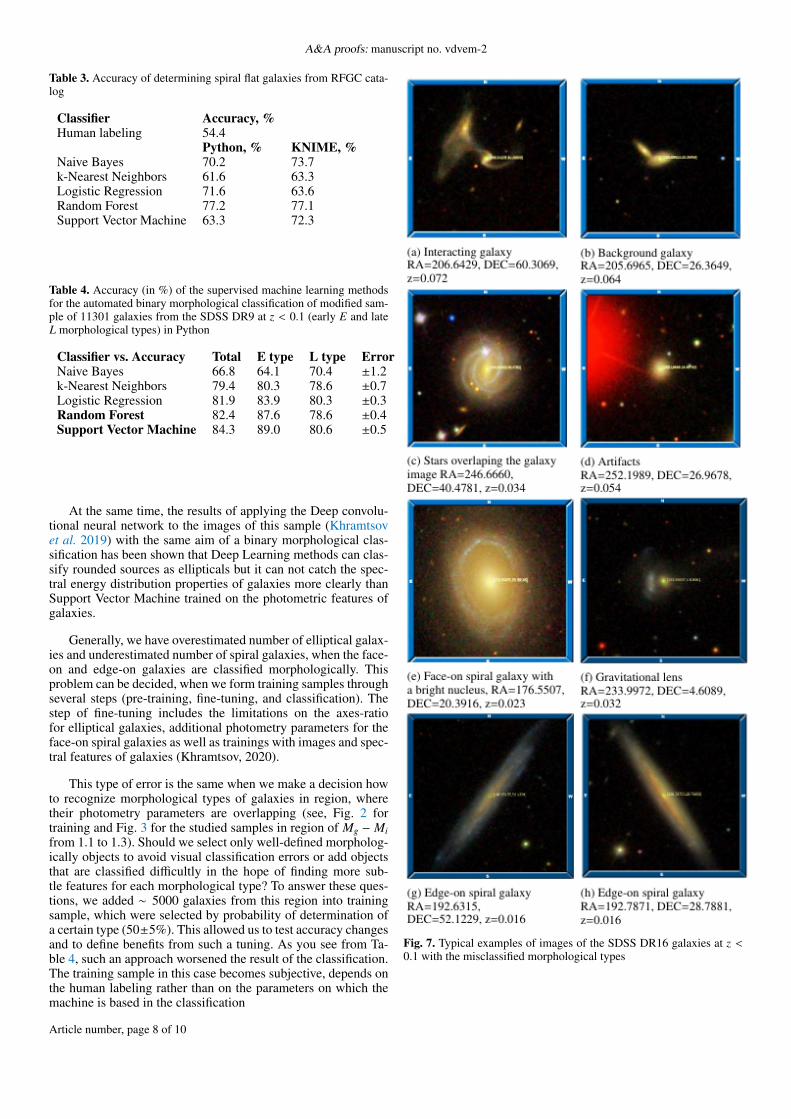
Human labeling, automated classification, and image/ spec-trum quality of the data. We underline the problem points of theSDSS galaxy data, which led to their morphology misclassifi-cation, as follows: 1) interacting galaxies, 2) background galaxy,3) stars covering the galaxy image, 4) artifacts (diffraction, satel-lites), 5) spiral galaxies of the red color, 6) bright nucleus (spiralgalaxies are defined as ellipticals), 7) bad background, 8) dimobjects (low signal-to-noise ratio), 9) face-on and edge-on galax-ies, 10) ”false” objects (gravitational lenses etc.).
The examples of such objects are presented in Fig. 7. Be-cause of they can be identified simply at the step of trainingsample building (see, subsection 2.2), we deleted such objectsfrom training sample. Some objects may have incomplete datafor comparison, including nonstandard spectra to compare itswith the images for clarification of morphological types (for ex-ample, the galaxy with RA = 151.86, DEC = 18.85, z = 0.06854,Plate = 2372).
Nevertheless, we may conclude that such misclassified mor-phologically objects contribute ∼ 1% error in the classificationof a general galaxy sample (see, also, Cabrera-Vives, Miller, andSchneider (2018)).
Edge-on galaxies. We used the Revised Flat Galaxy Cata-logue, RFGC, 4444 galaxies (Karachentsev et al. 1999), andTwo-Micron Flat Galaxy Catalogue, 2MFGC, 18020 galaxies(Mitronova and Korotkova 2015) for cross-verification of theedge-on galaxies from our sample (which should be recognizedas the late type spirals and never as the ellipticals) and for analy-
Fig. 6. Estimation of the relative importance of some photometric pa-rameters for the automated morphological classification of galaxiesfrom the SDSS. Training sample contains of 11 000 galaxies. Param-eters with higher values correspond to more significant ones. deVABu,deVABg, deVABr, deVABi, deVABz - de Vaucouleurs radius fit b/a indifferent bands, expABu, expABg, expABr, expABi, expABz - exponen-tial fit b/a in different bands, z - redshift, Mu−Mr,Mg−Mi,Mr −Mz -color indices, Mu,Mg,Mr,Mi,Mz - absolute magnitudes, and R50/R90- inverse concentration index to the centre
sis of a contribution of this type error into the accuracy of theapplied machine learning methods. The RFGC gives the dataon coordinates, axis ratio, position angles, and names of 4444galaxies including its in the Principal Galaxy Catalogue (Paturelet al. 1989), but do not contain of information on the radial ve-locities or redshifts. Our sample contains of 934 flat galaxiesfrom the RFGC as well as 3143 galaxies from the 2MFGC.
We estimated prediction of morphological type in depen-dence on redshift by five machine learning technique and hu-man labeling method. As you see from Table 3, Random Forestand Logistic Regression (Python) give the higher mean accuracyfor all the range of redshifts. Nevertheless, our calculations havedemonstrated that Naive Bayes give the highest accuracy 95 %for z ≤ 0.02. As for the prediction of edge-on galaxies as the latemorphological type more preciously, we obtained accuracy 86% for Naive Bayes and 72 % for Logistic Regression at z ≤ 0.05and ∼ 50% for Random Forest and Support Vector Machine atz > 0.05. As a result for these samples (galaxies from RFGC and2MFGC) we may conclude that all five machine learning tech-niques and human labeling method provide determination of thecorrect edge-on type for 2/3 of total samples of galaxies.
Article number, page 7 of 10
A&A proofs: manuscript no. vdvem-2
Table 3. Accuracy of determining spiral flat galaxies from RFGC cata-log
Classifier Accuracy, %Human labeling 54.4
Python, % KNIME, %Naive Bayes 70.2 73.7k-Nearest Neighbors 61.6 63.3Logistic Regression 71.6 63.6Random Forest 77.2 77.1Support Vector Machine 63.3 72.3
Table 4. Accuracy (in %) of the supervised machine learning methodsfor the automated binary morphological classification of modified sam-ple of 11301 galaxies from the SDSS DR9 at z < 0.1 (early E and lateL morphological types) in Python
Classifier vs. Accuracy Total E type L type ErrorNaive Bayes 66.8 64.1 70.4 ±1.2k-Nearest Neighbors 79.4 80.3 78.6 ±0.7Logistic Regression 81.9 83.9 80.3 ±0.3Random Forest 82.4 87.6 78.6 ±0.4Support Vector Machine 84.3 89.0 80.6 ±0.5
At the same time, the results of applying the Deep convolu-tional neural network to the images of this sample (Khramtsovet al. 2019) with the same aim of a binary morphological clas-sification has been shown that Deep Learning methods can clas-sify rounded sources as ellipticals but it can not catch the spec-tral energy distribution properties of galaxies more clearly thanSupport Vector Machine trained on the photometric features ofgalaxies.
Generally, we have overestimated number of elliptical galax-ies and underestimated number of spiral galaxies, when the face-on and edge-on galaxies are classified morphologically. Thisproblem can be decided, when we form training samples throughseveral steps (pre-training, fine-tuning, and classification). Thestep of fine-tuning includes the limitations on the axes-ratiofor elliptical galaxies, additional photometry parameters for theface-on spiral galaxies as well as trainings with images and spec-tral features of galaxies (Khramtsov, 2020).
This type of error is the same when we make a decision howto recognize morphological types of galaxies in region, wheretheir photometry parameters are overlapping (see, Fig. 2 fortraining and Fig. 3 for the studied samples in region of Mg − Mifrom 1.1 to 1.3). Should we select only well-defined morpholog-ically objects to avoid visual classification errors or add objectsthat are classified difficultly in the hope of finding more sub-tle features for each morphological type? To answer these ques-tions, we added ∼ 5000 galaxies from this region into trainingsample, which were selected by probability of determination ofa certain type (50±5%). This allowed us to test accuracy changesand to define benefits from such a tuning. As you see from Ta-ble 4, such an approach worsened the result of the classification.The training sample in this case becomes subjective, depends onthe human labeling rather than on the parameters on which themachine is based in the classification
Fig. 7. Typical examples of images of the SDSS DR16 galaxies at z <0.1 with the misclassified morphological types
Article number, page 8 of 10

Vavilova, Dobrycheva, Vasylenko et al.: Machine learning for the automated galaxy morphological classification
6. Conclusions
We present the results of the automated morphological classifica-tion of galaxies from the SDSS with redshifts of 0.02 < z < 0.1and absolute stellar magnitudes of −24m < Mr < −19.4m.
Using the visual classification of galaxies and multi-parametric diagrams color-Mr, color-R50/R90, color-deVRadr,and color-expRadr, we discovered possible criteria for separat-ing the galaxies into three classes: 1) early types, elliptical andlenticular; 2) spiral S a − S cd, and 3) late spiral S d − S dm andirregular Im/BCG types. Due to a low accuracy for the S a−S cdtypes of galaxies, we concentrated our exploration on the auto-mated classification onto two classes, E early and L late types ofgalaxies.
We evaluated the accuracy of different supervised Machinelearning methods to be applied to the binary automated morpho-logical classification of galaxies (Naive Bayes, Random Forest,Support Vector Machines, Logistic Regression, and k-NearestNeighbor algorithm). To study the classifier, we used absolutemagnitudes: Mu, Mg, Mr, Mi, Mz, Mu −Mr, Mg −Mi, Mu −Mgg,Mr−Mz, and inverse concentration index to the center R50/R90.
We obtained that methods of Support Vector Machine andRandom Forest with Scikit-learn machine learning in Pythonprovide the highest accuracy for the binary galaxy morphologi-cal classification: 96.4% correctly classified (96.1% early E and96.9% late L) types and 95.5% correctly classified (96.7% earlyE and 92.8% late L) types, respectively. It allowed us to cre-ate the Catalogue of morphological types of 316 031 galaxiesfrom the SDSS at z < 0.1 applying the Support Vector Machine,namely we revealed 141 211 E-type and 174 820 L-type galaxiesamong them.
Analysis of problem points testifies that Support Vector Ma-chine and Random Forest are the effective tools for the auto-mated galaxy morphology classification.Acknowledgements. We thank Prof. Massimo Capacciolli and Dr. ValentinaKarachentseva for the helpful discussion and remarks. This work was partiallysupported in frame of the budgetary program of the National Academy of Sci-ences of Ukraine ”Support for the development of priority fields of scientificresearch” (CPCEL 6541230). This work was partially supported by the grant forYoung Scientist’s Research Laboratories (2018-2019, Dobrycheva D.V.) and theYouth Scientific Project (2019-2020, Dobrycheva D.V., Vasylenko M.Yu.) of theNational Academy of Sciences of Ukraine. HyperLeda Makarov et al. (2014)and SDSS IV Blanton et al. (2017) were helpful to our study. This research hasmade use of the NASA/IPAC Extragalactic Database (NED), which is operatedby the Jet Propulsion Laboratory, California Institute of Technology, under con-tract with the National Aeronautics and Space Administration.
ReferencesAhn, C.P., Alexandroff, R., Allende Prieto, C., Anderson, S.F., Anderton, T.,
Andrews, B.H., and, ...: 2012, The Astrophysical Journal Supplement Series203, 21. doi:10.1088/0067-0049/203/2/21.
Ahumada, R., Allende Prieto, C., Almeida, A., Anders, F., Anderson, S.F., An-drews, B.H., and, ...: 2020, The Astrophysical Journal Supplement Series 249,3. doi:10.3847/1538-4365/ab929e.
Alger, M.J., Banfield, J.K., Ong, C.S., Rudnick, L., Wong, O.I., Wolf, C., and,...: 2018, Monthly Notices of the Royal Astronomical Society 478, 5547.doi:10.1093/mnras/sty1308.
Al-Jarrah, O.Y., Yoo, P.D., Muhaidat, S., Karagiannidis, G.K., and Taha, K.:2015, arXiv e-prints, arXiv:1503.05296.
Andrae, R., Melchior, P., and Bartelmann, M.: 2010, Astronomy and Astrophysics522, A21. doi:10.1051/0004-6361/201014169.
Aniyan, A.K. and Thorat, K.: 2017, The Astrophysical Journal Supplement Se-ries 230, 20. doi:10.3847/1538-4365/aa7333.
Ball, N.M., Loveday, J., Fukugita, M., Nakamura, O., Okamura, S., Brinkmann,J., and, ...: 2004, Monthly Notices of the Royal Astronomical Society 348,1038. doi:10.1111/j.1365-2966.2004.07429.x.
Ball, N.M. and Brunner, R.J.: 2010, International Journal of Modern Physics D19, 1049. doi:10.1142/S0218271810017160.
Balogh, M.L., Baldry, I.K., Nichol, R., Miller, C., Bower, R., and Glazebrook,K.: 2004, The Astrophysical Journal 615, L101. doi:10.1086/426079.
Banerji, M., Lahav, O., Lintott, C.J., Abdalla, F.B., Schawinski, K., Bamford,S.P., and, ...: 2010, Monthly Notices of the Royal Astronomical Society 406,342. doi:10.1111/j.1365-2966.2010.16713.x.
Beck, M.R., Scarlata, C., Fortson, L.F., Lintott, C.J., Simmons, B.D., Galloway,M.A., and, ...: 2018, Monthly Notices of the Royal Astronomical Society 476,5516. doi:10.1093/mnras/sty503.
Bieker, J.: 2018, American Astronomical Society Meeting Abstracts #232.Blanton, M.R., Bershady, M.A., Abolfathi, B., Albareti, F.D., Allende Pri-
eto, C., Almeida, A., and, ...: 2017, The Astronomical Journal 154, 28.doi:10.3847/1538-3881/aa7567.
Bloom, J.S., Richards, J.W., Nugent, P.E., Quimby, R.M., Kasliwal, M.M., Starr,D.L., and, ...: 2012, Publications of the Astronomical Society of the Pacific124, 1175. doi:10.1086/668468.
Buta, R.J.: 2011, arXiv e-prints, arXiv:1102.0550.Cabrera-Vives, G., Miller, C.J., and Schneider, J.: 2018, The Astronomical Jour-
nal 156, 284. doi:10.3847/1538-3881/aae9f4.Calderon, V.F. and Berlind, A.A.: 2019, Monthly Notices of the Royal Astronom-
ical Society 490, 2367. doi:10.1093/mnras/stz2775.de la Calleja, J. and Fuentes, O.: 2004, Monthly Notices of the Royal Astronomi-
cal Society 349, 87. doi:10.1111/j.1365-2966.2004.07442.x.Chilingarian, I.V., Melchior, A.-L., and Zolotukhin, I.Y.: 2010, Monthly No-
tices of the Royal Astronomical Society 405, 1409. doi:10.1111/j.1365-2966.2010.16506.x.
Chilingarian, I.V. and Zolotukhin, I.Y.: 2012, Monthly Notices of the Royal As-tronomical Society 419, 1727. doi:10.1111/j.1365-2966.2011.19837.x.
Conselice, C.J., Bluck, A.F.L., Mortlock, A., Palamara, D., and Benson,A.J.: 2014, Monthly Notices of the Royal Astronomical Society 444, 1125.doi:10.1093/mnras/stu1385.
Dobrycheva, D. and Melnyk, O.: 2012, Advances in Astronomy and SpacePhysics 2, 42.
Dobrycheva, D.V.: 2013, Odessa Astronomical Publications 26, 187.Dobrycheva, D.V., Melnyk, O.V., Vavilova, I.B., and Elyiv, A.A.: 2015, Astro-
physics 58, 168. doi:10.1007/s10511-015-9373-x.Dobrycheva, D.V.: 2017, Ph.D. Thesis.Dobrycheva, D.V., Vavilova, I.B., Melnyk, O.V., and Elyiv, A.A.:
2018, Kinematics and Physics of Celestial Bodies 34, 290.doi:10.3103/S0884591318060028.
El Bouchefry, K. and de Souza, R.S.: 2020, Knowledge Discovery in BigData from Astronomy and Earth Observation, 225. doi:10.1016/B978-0-12-819154-5.00023-0.
Elyiv, A.A., Melnyk, O.V., Vavilova, I.B., Dobrycheva, D.V., and Karachent-seva, V.E.: 2020, Astronomy and Astrophysics 635, A124. doi:10.1051/0004-6361/201936883.
Fluke, C.J. and Jacobs, C.: 2020, WIREs Data Mining and Knowledge Discovery10, e1349. doi:10.1002/widm.1349.
Karachentsev, I.D., Karachentseva, V.E., Kudrya, Y.N., Sharina, M.E., andParnovskij, S.L.: 1999, Bulletin of the Special Astrophysics Observatory 47,5.
Kates-Harbeck, J.: 2012, APS April Meeting Abstracts.Khramtsov, V., Dobrycheva, D.V., Vasylenko, M.Y., and Akhmetov, V.S.:
2019, Odessa Astronomical Publications 32, 21. doi:10.18524/1810-4215.2019.32.182092.
Khramtsov, V., Sergeyev, A., Spiniello, C., Tortora, C., Napolitano, N.R.,Agnello, A., and, ...: 2019, Astronomy and Astrophysics 632, A56.doi:10.1051/0004-6361/201936006.
Kim, D.-W. and Bailer-Jones, C.A.L.: 2016, Astronomy and Astrophysics 587,A18. doi:10.1051/0004-6361/201527188.
Kohler, S.: 2018, AAS Nova Highlights, 4341.Kremer, J., Stensbo-Smidt, K., Gieseke, F., Steenstrup Pedersen, K., and Igel, C.:
2017, arXiv e-prints, arXiv:1704.04650.Kuminski, E. and Shamir, L.: 2016, The Astrophysical Journal Supplement Se-
ries 223, 20. doi:10.3847/0067-0049/223/2/20.Lahav, O.: 1995, Astrophysical Letters and Communications 31, 73.Lahav, O., Naim, A., Sodré, L., and Storrie-Lombardi, M.C.: 1996,
Monthly Notices of the Royal Astronomical Society 283, 207.doi:10.1093/mnras/283.1.207.
Lintott, C.J., Schawinski, K., Slosar, A., Land, K., Bamford, S., Thomas, D.,and, ...: 2008, Monthly Notices of the Royal Astronomical Society 389, 1179.doi:10.1111/j.1365-2966.2008.13689.x.
Lukic, V., Brüggen, M., Mingo, B., Croston, J.H., Kasieczka, G., and Best,P.N.: 2019, Monthly Notices of the Royal Astronomical Society 487, 1729.doi:10.1093/mnras/stz1289.
Mahabal, A., Rebbapragada, U., Walters, R., Masci, F.J., Blagorodnova, N., vanRoestel, J., and, ...: 2019, Publications of the Astronomical Society of thePacific 131, 038002. doi:10.1088/1538-3873/aaf3fa.
Makarov, D., Prugniel, P., Terekhova, N., Courtois, H., and Vauglin, I.: 2014,Astronomy and Astrophysics 570, A13. doi:10.1051/0004-6361/201423496.
Article number, page 9 of 10

A&A proofs: manuscript no. vdvem-2
Melnyk, O.V., Dobrycheva, D.V., and Vavilova, I.B.: 2012, Astrophysics 55, 293.doi:10.1007/s10511-012-9236-7.
Mitronova, S.N. and Korotkova, G.G.: 2015, Astrophysical Bulletin 70, 24.doi:10.1134/S1990341315010034.
Naim, A., Lahav, O., Sodre, L., and Storrie-Lombardi, M.C.: 1995,Monthly Notices of the Royal Astronomical Society 275, 567.doi:10.1093/mnras/275.3.567.
Nair, P.B. and Abraham, R.G.: 2010, The Astrophysical Journal Supplement Se-ries 186, 427. doi:10.1088/0067-0049/186/2/427.
Paturel, G., Fouque, P., Bottinelli, L., and Gouguenheim, L.: 1989, Astronomyand Astrophysics Supplement Series 80, 299.
Ralph, N.O., Norris, R.P., Fang, G., Park, L.A.F., Galvin, T.J., Alger, M.J., and,...: 2019, Publications of the Astronomical Society of the Pacific 131, 108011.doi:10.1088/1538-3873/ab213d.
Schawinski, K., Urry, C.M., Simmons, B.D., Fortson, L., Kaviraj, S., Keel, W.C.,and, ...: 2014, Monthly Notices of the Royal Astronomical Society 440, 889.doi:10.1093/mnras/stu327.
Simmons, B.D., Lintott, C., Willett, K.W., Masters, K.L., Kartaltepe, J.S.,Häußler, B., and, ...: 2017, Monthly Notices of the Royal Astronomical So-ciety 464, 4420. doi:10.1093/mnras/stw2587.
Stahl, B.E., Martínez-Palomera, J., Zheng, W., de Jaeger, T., Filippenko, A.V.,and Bloom, J.S.: 2020, Monthly Notices of the Royal Astronomical Society496, 3553. doi:10.1093/mnras/staa1706.
Storrie-Lombardi, M.C., Lahav, O., Sodre, L., and Storrie-Lombardi, L.: 1992,American Astronomical Society Meeting Abstracts.
VanderPlas, J., Connolly, A.J., Ivezic, Z., and Gray, A.: 2012, Pro-ceedings of Conference on Intelligent Data Understanding (CIDU, 47.doi:10.1109/CIDU.2012.6382200.
Vander Plas, J., Connolly, A.J., and Ivezic, Z.: 2014, American AstronomicalSociety Meeting Abstracts #223.
Vasylenko, M.Y., Dobrycheva, D.V., Vavilova, I.B., Melnyk, O.V., and Elyiv,A.A.: 2019, Odessa Astronomical Publications 32, 46. doi:10.18524/1810-4215.2019.32.182538.
Vavilova, I.B., Melnyk, O.V., and Elyiv, A.A.: 2009, Astronomische Nachrichten330, 1004. doi:10.1002/asna.200911281.
Vavilova, I.B., Ivashchenko, G.Y., Babyk, I.V., Sergijenko, O., Dobrycheva, D.V.,Torbaniuk, O.O., and, ...: 2015, Kosmichna Nauka i Tekhnologiya 21, 94.doi:10.15407/knit2015.05.094.
Vavilova, I.B., Elyiv, A.A., and Vasylenko, M.Y.: 2018, Russian Radio Physicsand Radio Astronomy 23, 244. doi:10.15407/rpra23.04.244.
Vavilova, I., Dobrycheva, D., Vasylenko, M., Elyiv, A., and Melnyk, O.: 2020,Knowledge Discovery in Big Data from Astronomy and Earth Observation,307. doi:10.1016/B978-0-12-819154-5.00028-X.
Wagner, S., Melnik, V., and Rucker, H.: 2019, EPSC-DPS Joint Meeting 2019.Wang, S., Cao, J., and Yu, P.S.: 2019, arXiv e-prints, arXiv:1906.04928.Way, M.J., Scargle, J.D., Ali, K.M., and Srivastava, A.N.: 2012, Advances in
Machine Learning and Data Mining for Astronomy, CRC Press, Taylor &
Francis Group, Eds.: Michael J. Way, Jeffrey D. Scargle, Kamal M. Ali, AshokN. Srivastava.
Willett, K.W., Lintott, C.J., Bamford, S.P., Masters, K.L., Simmons, B.D., Cas-teels, K.R.V., and, ...: 2013, Monthly Notices of the Royal Astronomical Soci-ety 435, 2835. doi:10.1093/mnras/stt1458.
York, D.G., Adelman, J., Anderson, J.E., Anderson, S.F., Annis, J.,Bahcall, N.A., and, ...: 2000, The Astronomical Journal 120, 1579.doi:10.1086/301513.
Article number, page 10 of 10