Embed Size (px)
Citation preview

0
RESEARCH CENTER FOR ASSISTIVE INFORMATION AND COMMUNICATION SOLUTIONS
Machine Learning @ Fraunhofer Portugal AICOS
Joana Silva, Carina Figueira, Marília Barandas, João Gonçalves, João Costa, Luís Rosado,
Maria Vasconcelos, Filipe Soares and Hugo Gamboa
May, 2017
1
TABLE OF CONTENTS
1. OVERVIEW ............................................................................................................................................. 2
1.1. Paper Outline ................................................................................................................ 2
1.2. Fraunhofer Portugal ...................................................................................................... 2
1.3. Fraunhofer Portugal AICOS Strategic Research Agenda .................................................. 2
1.4. Machine Learning Explained .......................................................................................... 3
1.5. Machine Learning Techniques at FhP-AICOS................................................................... 4
2. APPLICATION AREAS ............................................................................................................................ 7
2.1. Fall and Activity Monitoring ........................................................................................... 7
2.1.1. Fall Detection and Fall Risk Assessment ..................................................................................... 7
2.1.2. Human Activity Monitoring ....................................................................................................... 9
2.1.3. Gestures Recognition .............................................................................................................. 11
2.1.4. Indoor Location....................................................................................................................... 13
2.1.5. Sports Monitoring ................................................................................................................... 14
2.2. Chronic Diseases and Well-Being Management .............................................................15
2.2.1. Early Detection of Diseases ..................................................................................................... 15
2.2.2. EyeFundusScope ..................................................................................................................... 16
2.2.3. SMARTSKINS .......................................................................................................................... 18
2.2.4. MalariaScope .......................................................................................................................... 20
2.3. Assistive Environments .................................................................................................22
2.3.1. ShopView ............................................................................................................................... 22
3. CONCLUSIONS .................................................................................................................................... 24
4. ACKNOWLEDGMENTS ........................................................................................................................ 25
5. BIBLIOGRAPHY .................................................................................................................................... 26
2
1. OVERVIEW
1.1. Paper Outline
There are several areas of application of Machine Learning techniques. In Fraunhofer Portugal Research
Center for Assistive Information and Communication Solutions (FhP-AICOS) there are many projects, master
theses and published papers which are based in these techniques. Thereby, this document aims to evidence
the value of Machine Learning in FhP-AICOS, showing its fullness of application areas, developed work and
results achieved.
1.2. Fraunhofer Portugal
Founded in 2008 – as a result of the long-term Portuguese-German collaboration in Science and Technology
– Associação Fraunhofer Portugal Research (Fraunhofer Portugal) aims at creating scientific knowledge
capable of generating added value for its clients and partners, by exploring technology innovations oriented
towards economic growth, social well-being and the improvement of the quality of life of its end-users.
Currently, Fraunhofer Portugal owns and operates the FhP-AICOS – a partnership between Fraunhofer-
Gesellschaft and the University of Porto.
1.3. Fraunhofer Portugal AICOS Strategic Research Agenda
Fraunhofer Portugal AICOS (FhP-AICOS) aims to develop research of practical utility, focusing its activity on
Ambient Assisted Living (AAL) and Information and Communication Technologies for Development (ICT4D).
FhP-AICOS’ mission is to generate Remarkable Technology, Easy to Use.
AAL business field includes methods, concepts, (electronic) systems, devices and services that provide
unobtrusive support for daily life, based on the context and the situation of the assisted person. FhP-AICOS
currently covers the following sub-fields:
Fall and Activity Monitoring;
Chronic Diseases and Well-Being Management;
Assistive Environments.
FhP-AICOS has also created a senior user test and co-design network – The COLABORAR initiative: the
network for seniors – that is, to our best knowledge, the largest of its kind in Europe and thus contributes to
FhP-AICOS being one of the most advanced places for AAL research.
ICT4D business field focuses on the direct application of information technology approaches to contribute to
poverty reduction and to reduce the digital divide. For ICT4D, one sub-field has been defined:
3
ICT4D on Mobile Devices.
Mobile ICT solutions are jointly developed with African partners for user groups in rural and developing areas
in order to enhance the living standards of those groups. The focusing areas are: agricultural production
chains (mAgriculture), micro-enterprises (ICT for Very Small Enterprises), mobile health (mHealth) and mobile
Government (mGovernment).
1.4. Machine Learning Explained
In Artificial Intelligence, Machine Learning can be defined as a technology to learn autonomously from
training data. It is a branch of computer science concerned with induction problems where an underlying
model for predictive or descriptive purposes has to be discovered, based on known properties learned from a
training set. Machine Learning algorithms can be divided into different categories, depending on the nature
of the learning process:
Supervised learning uses labelled data (data inputs and their desired outputs) to train an algorithm,
which becomes able to map new inputs [1];
Unsupervised learning uses unlabelled data to build recognition models. Generally, the main
objective is to identify and organize a dataset into different clusters trough their similarity, providing
significant information from the original dataset [1, 2];
Semi-supervised learning uses unlabelled data together with labelled data, i.e., in the learning
process the training dataset is composed by, typically, a small amount of labelled data and a large
amount of unlabelled data, falling between unsupervised learning and supervised learning [3].
On the other hand, Deep Learning has also been a big trend in Machine Learning. It is composed of several
Artificial Neural Networks (ANN) processing layers. ANN are based on the biological neurons structure and
functions. An artificial neuron has a finite number of inputs with the respective associated weights and an
activation function. Through the application of the activation function to the weighted sum of inputs, the
output is obtained. The ANN are the result of the connection of many artificial neurons [4, 5].
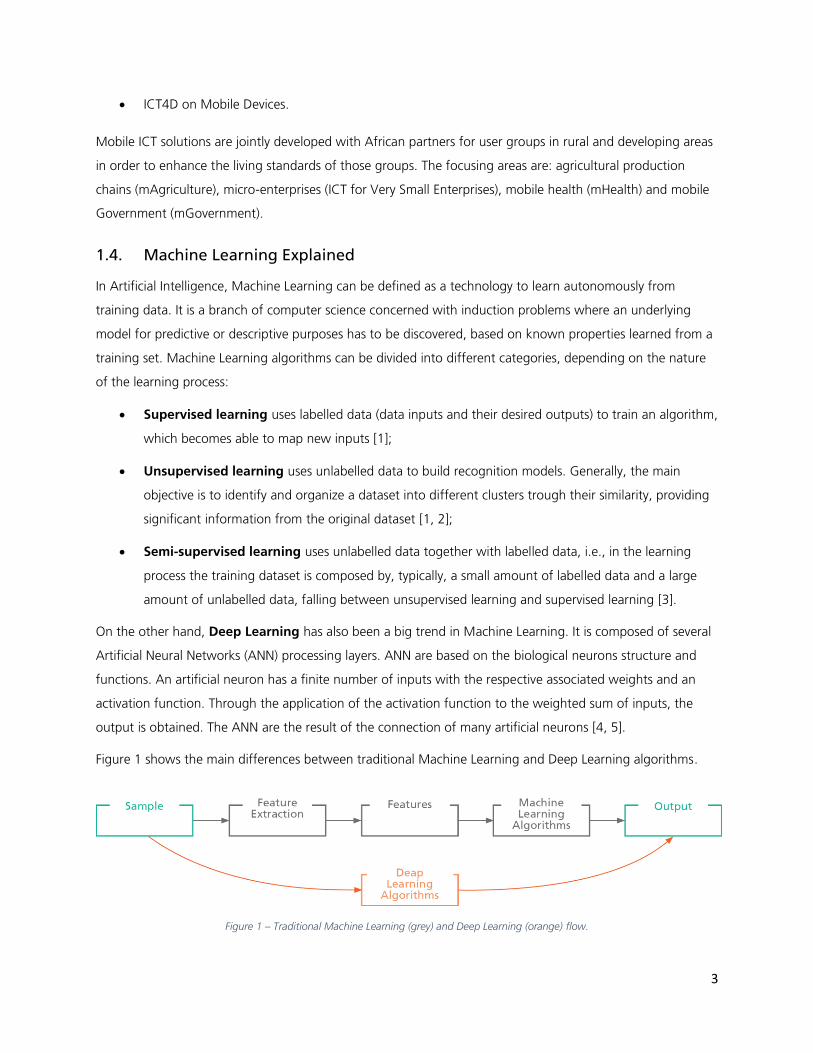
Figure 1 shows the main differences between traditional Machine Learning and Deep Learning algorithms.
Figure 1 – Traditional Machine Learning (grey) and Deep Learning (orange) flow.
4
As can be seen, the main difference lies on the feature engineering. Traditional Machine Learning algorithms
involves a feature extraction process, in order to provide relevant information that will have an essential role
in the classification process (Figure 1 – grey). In the other hand, Deep Learning algorithms perform the
feature engineering in an automatic way (Figure 1 – orange) [5].
After the development of a Machine Learning algorithm, there are several different ways to evaluate its
performance, as K-fold Cross Validation and Leave One Out Cross Validation.
After the validation process, there are several approaches to evaluate the classifier performance. One of the
most used is the accuracy. Accuracy measures how close a value is to the true value and can be calculated
using the following formula:
𝐴 =𝑇𝑃 + 𝑇𝑁
𝑇𝑃 + 𝑇𝑁 + 𝐹𝑃 + 𝐹𝑁
Where TP are the True Positives, TN the True Negatives, FP the False Positives and FN the False Negatives.
1.5. Machine Learning Techniques at FhP-AICOS
The choice of the algorithm depends on the type of dataset available and the objectives of the research. At
FhP-AICOS, several algorithms have been used in different contexts and applications, which will be now
described.
K-Nearest Neighbours (k-NN) find the k closest instances of the training set according to a metric
measure, where the resulting class is the most frequent class label of the k nearest instances [6];
Decision Tree creates a model that classifies instances by sorting them based on data features
values. The major goal is to determine the best decisions [6];
Naïve Bayes predicts class membership probabilities, based on the Bayes Theorem. An
independence between the features and prior probabilities are assumed. Based on previous
experience, this probabilities are then used to predict outcomes before they actually happen [7];
Support Vector Machine (SVM) is a binary classifier that builds a model that assigns new data into
one category or other from a set of training examples. The main objective is to find the maximum
hyperplane that separate two data classes [6];
SVM classifiers requires the solution of a high quadratic programming (QP) optimization problem.
Based on it, a new algorithm to train SVM was created, the Sequential Minimal Optimization
(SMO). With SMO, the QP problem is solved by being divided into smallest QP problems, which are
then solved analytically [8];
5
Markov Models are based in probabilities and are used in cases where certain conditions may happen
repeatedly over time or for modelling predictable events that take place over time. Hidden Markov
Models (HMM) is a special case of Markov Models. In this case, the Markov process shows
unobserved (i.e. hidden) states and there is no knowledge regarding the existing states and transition
probabilities between them [9];
Adaboost is a boosting algorithm, i.e., an algorithm based on the combination of weak and
inaccurate rules in order to construct a prediction rule [10];
Spectral Clustering uses the main eigenvectors of the similarity matrix resulted from points
distance. With this, data dimension is reduced into fewer dimensions [11];
Convolutional Neural Networks (CNN) are a type of neural networks where the input is an image
and the fully connected layers are replaced by layers of convolutional filters. The use of convolutional
filters instead of fully connected layers, with neurons connected to every neuron in the previous
layer, allows to significantly decrease the number of parameters of the network, thus enabling the
network to efficiently learn features in relatively large images. The goal of the training phase is to
learn the weights in those convolutional filters, in order to minimize a given loss function;
Recurrent Neural Networks (RNN) are popular models which, unlike traditional ANN, consider that
inputs and outputs are dependent of each other. Long Short-Term Memory (LSTM) networks are
a type of RNN, which are capable of learning long-term dependencies [12].
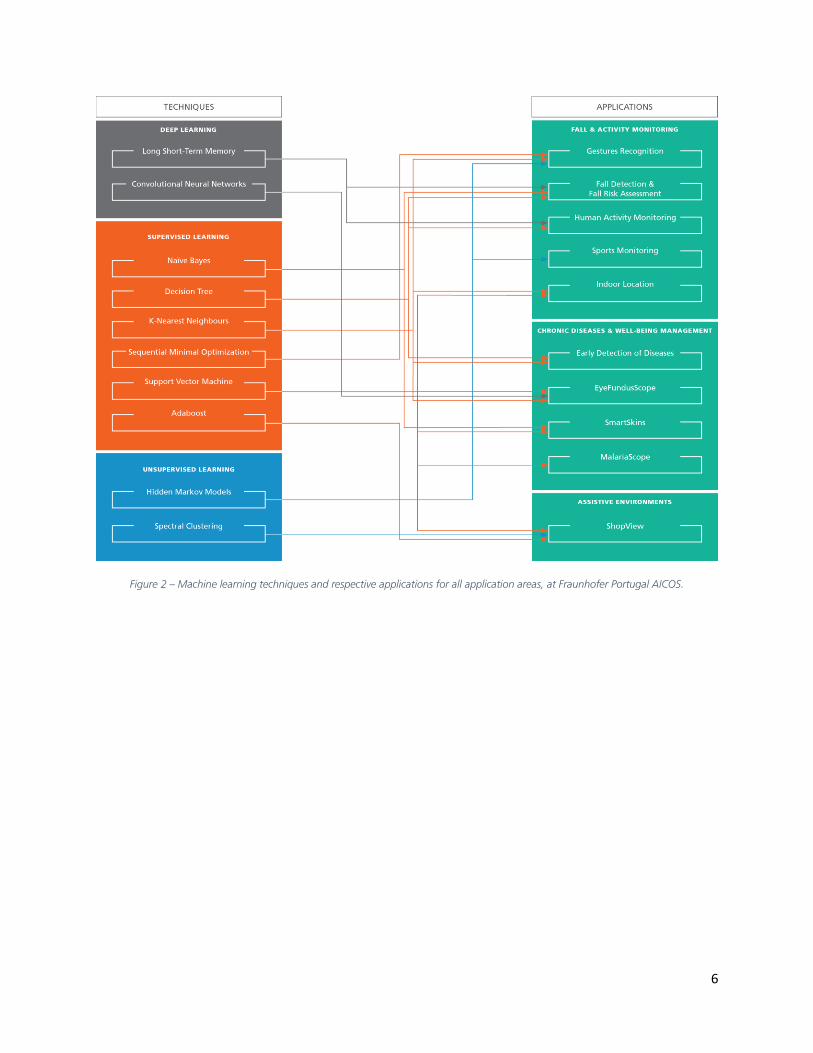
Figure 2 presents the relationship between the described algorithms and its applications at FhP-AICOS.
6
Figure 2 – Machine learning techniques and respective applications for all application areas, at Fraunhofer Portugal AICOS.
7
2. APPLICATION AREAS
The Fraunhofer projects related to Signal Processing uses time series collected from inertial and environmental
sensors, which are embedded into smartphones or wearable sensors. Currently, the followed methodology
for samples collection uses a recording mobile tool developed in FhP-AICOS, the Recorder app. This app can
collect data from smartphones and Pandlets, a wearable platform also developed in FhP-AICOS, which
contains an inertial measurement unit with accelerometer, gyroscope, magnetometer and barometer sensors
[13].
There are also, other projects, related to Computer Vision, which use image as input to Machine Learning
techniques. In the case of a retail solution, image acquisition setup includes a camera cart (imaging sensors)
that shots from multi-viewpoints aiming a parallel motion to the shelf. Some of the solutions for Chronic
Diseases and Well-Being Management use images of the patient, that are acquired with a low cost optical
attachment to a smartphone and subsequently analysed by an expert, and microscopic images, that are
acquired with smartphones coupled to a low cost optical magnification device.
In this chapter a brief description of the developed projects and respective applications, master theses and
papers will be described.
2.1. Fall and Activity Monitoring
2.1.1. Fall Detection and Fall Risk Assessment
Falls are one of the main causes of morbidity and institutionalization in elderly population, representing more
than 50% of hospitalizations due to injuries. Every year, 30% of elderly aged above 65 years old fall. The Fall
Competence Center (FCC) aimed to investigate in-depth all fall-related aspects, including activity monitoring
and human motion analysis. The scientific knowledge developed was applied to viable solutions for fall
detection, fall risk assessment and fall prevention. These technological developments were based on
smartphones, due to its easy access and its continuous presence in everyone daily life.
The smartphone-based fall detection application, Fall Detect, continuously analyses the data from the
smartphone built-in accelerometer in order to detect a fall event. The data from the accelerometer feeds a
state machine that recognizes fall stages in a sequential order. Specific fall-related features and its
correspondent thresholds in the acceleration values have been determined using decision trees, after a
comparison of diverse machine learning classifiers. The fall detection algorithm was developed based on a
dataset with 1879 simulated fall events and 1611 activities of daily living (ADL) tasks that were recorded from
younger volunteers according to the Noury protocol. The decision tree classification algorithm obtained an
accuracy of 93% while the state machine approach presented results of 97% [14], [15].
8
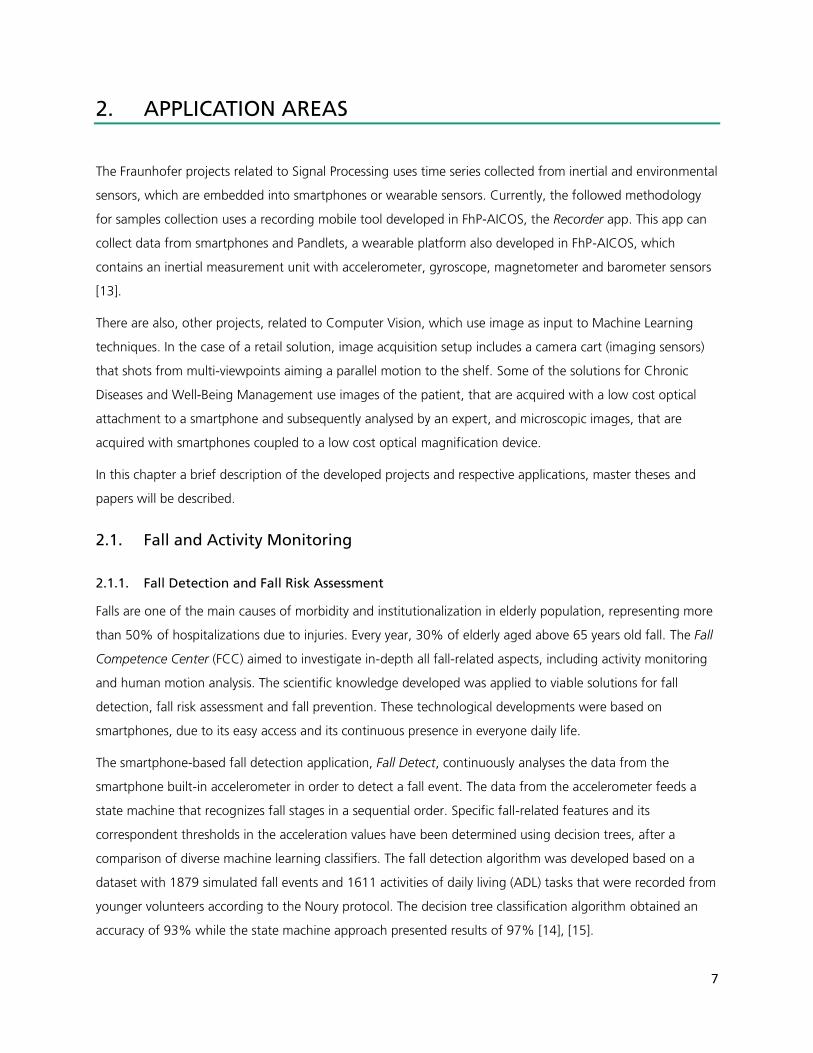
Figure 3 – Fall Detect is a smartphone
application that fits elderly needs.
Following the research line of FCC, FhP-AICOS is currently working in the FallSensing project, which aims to
develop a new technological solution to enable screening and monitoring of the risk of falling and the
implementation of falls prevention programs in the elderly population. The project aims at developing a
multifactorial fall risk scale, focusing on traditional fall risk assessment tests instrumentation, such as the
timed up and go test, the 30-second sit-to-stand and the 4-stage balance test. A systematic comparison of
multifactorial assessment tools and their instrumentation for fall risk classification based on machine learning
approaches were studied for a population of 296 community-dwelling older persons aged above 50 years
old. Several features were extracted from wearable inertial sensors, located on the ankle and at the lower
back, and a pressure platform. The outcome of the classification process was designed to differentiate an
older person in two functional levels (high and low), based on previous history of falls questionnaire.
Comparing to using solely the traditional tests scores and personal metrics, the F-Score of Naïve Bayes
classifier increased from 72.85% to 92.61% [16], [17]. Currently, methods to classify the probability of falling
based on 6-months follow-up for falls are being studied using several algorithms of machine learning and a
larger dataset of 492 elderly, aged above 50 years old.
9
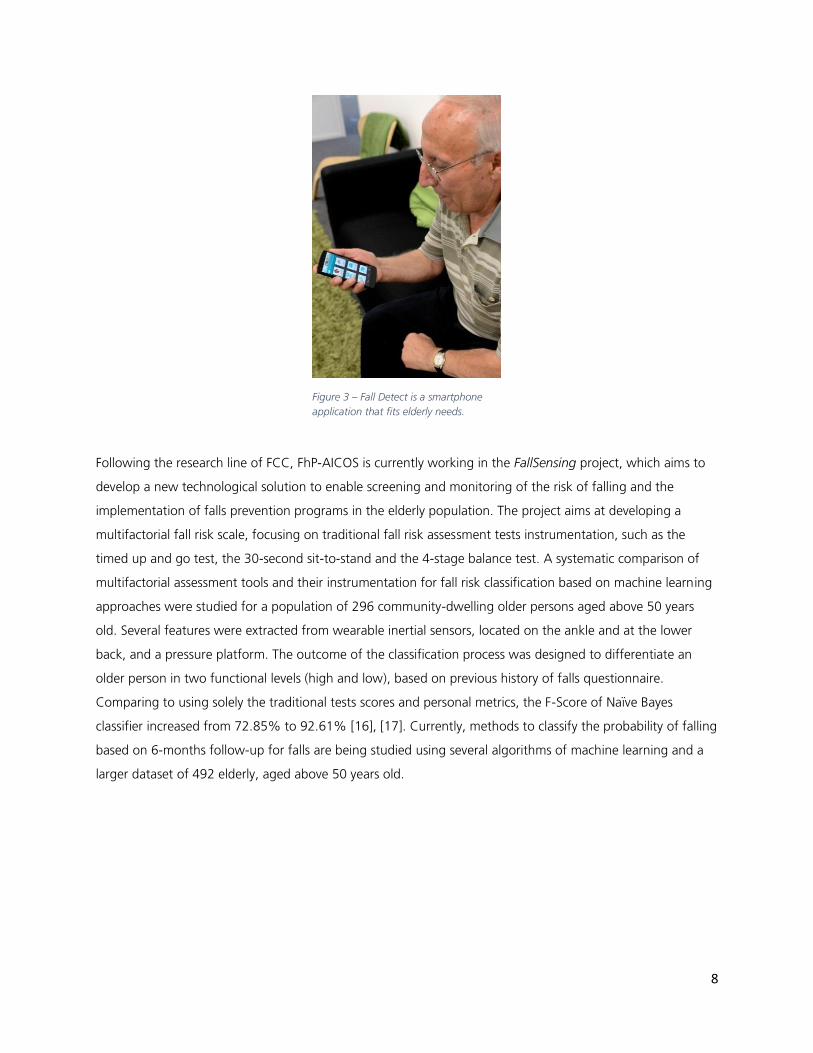
Figure 4 – Fall Sensing clinical solution helps
physioterapists in their clinical pratctise for the
delivery of falls prevention exercises.
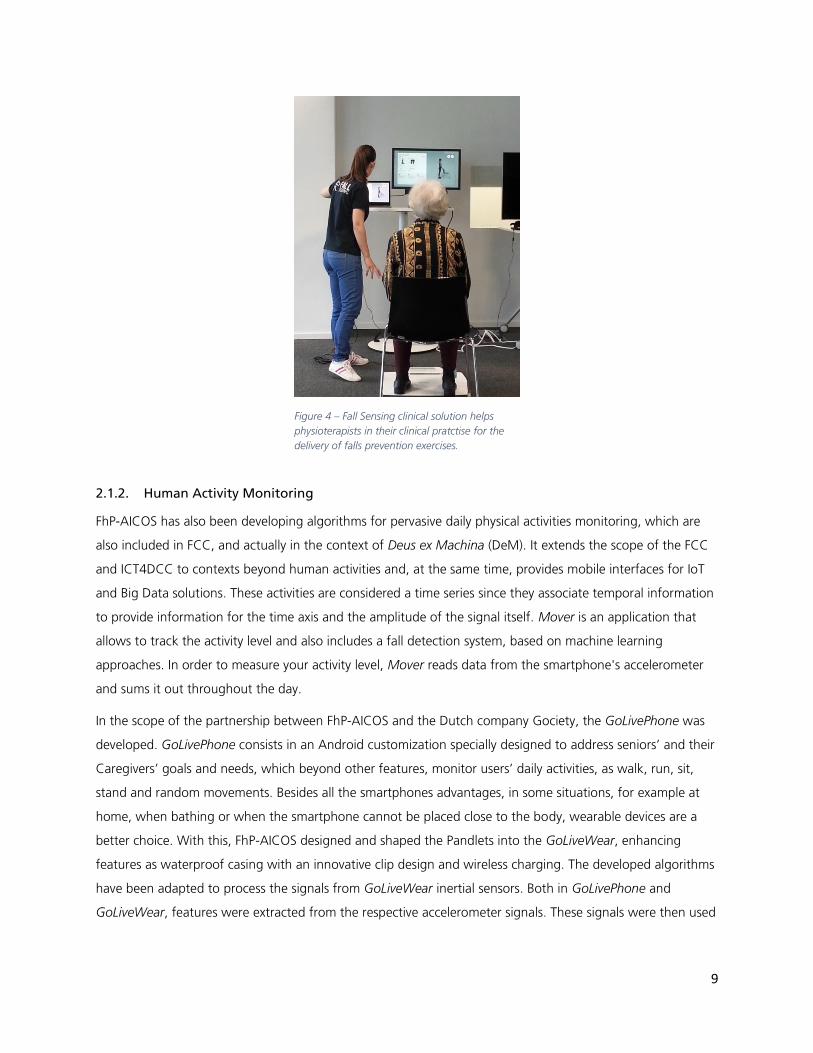
2.1.2. Human Activity Monitoring
FhP-AICOS has also been developing algorithms for pervasive daily physical activities monitoring, which are
also included in FCC, and actually in the context of Deus ex Machina (DeM). It extends the scope of the FCC
and ICT4DCC to contexts beyond human activities and, at the same time, provides mobile interfaces for IoT
and Big Data solutions. These activities are considered a time series since they associate temporal information
to provide information for the time axis and the amplitude of the signal itself. Mover is an application that
allows to track the activity level and also includes a fall detection system, based on machine learning
approaches. In order to measure your activity level, Mover reads data from the smartphone's accelerometer
and sums it out throughout the day.
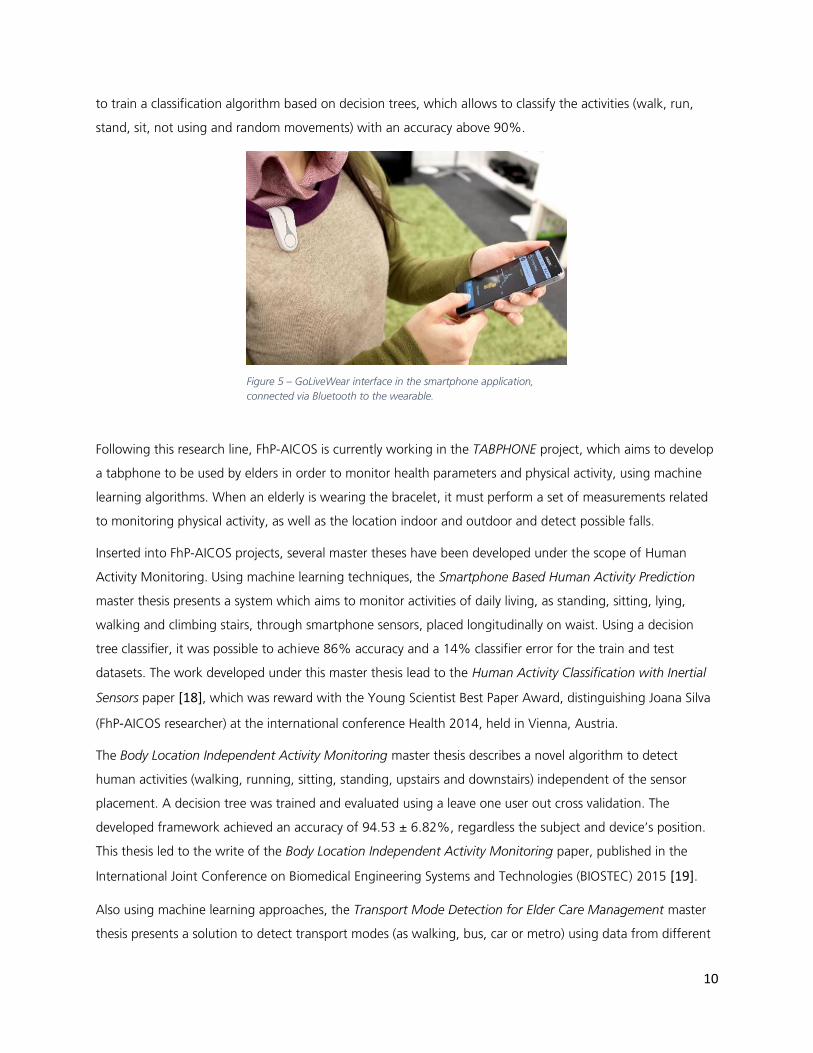
In the scope of the partnership between FhP-AICOS and the Dutch company Gociety, the GoLivePhone was
developed. GoLivePhone consists in an Android customization specially designed to address seniors’ and their
Caregivers’ goals and needs, which beyond other features, monitor users’ daily activities, as walk, run, sit,
stand and random movements. Besides all the smartphones advantages, in some situations, for example at
home, when bathing or when the smartphone cannot be placed close to the body, wearable devices are a
better choice. With this, FhP-AICOS designed and shaped the Pandlets into the GoLiveWear, enhancing
features as waterproof casing with an innovative clip design and wireless charging. The developed algorithms
have been adapted to process the signals from GoLiveWear inertial sensors. Both in GoLivePhone and
GoLiveWear, features were extracted from the respective accelerometer signals. These signals were then used
10
Figure 5 – GoLiveWear interface in the smartphone application,
connected via Bluetooth to the wearable.
to train a classification algorithm based on decision trees, which allows to classify the activities (walk, run,
stand, sit, not using and random movements) with an accuracy above 90%.
Following this research line, FhP-AICOS is currently working in the TABPHONE project, which aims to develop
a tabphone to be used by elders in order to monitor health parameters and physical activity, using machine
learning algorithms. When an elderly is wearing the bracelet, it must perform a set of measurements related
to monitoring physical activity, as well as the location indoor and outdoor and detect possible falls.
Inserted into FhP-AICOS projects, several master theses have been developed under the scope of Human
Activity Monitoring. Using machine learning techniques, the Smartphone Based Human Activity Prediction
master thesis presents a system which aims to monitor activities of daily living, as standing, sitting, lying,
walking and climbing stairs, through smartphone sensors, placed longitudinally on waist. Using a decision
tree classifier, it was possible to achieve 86% accuracy and a 14% classifier error for the train and test
datasets. The work developed under this master thesis lead to the Human Activity Classification with Inertial
Sensors paper [18], which was reward with the Young Scientist Best Paper Award, distinguishing Joana Silva
(FhP-AICOS researcher) at the international conference Health 2014, held in Vienna, Austria.
The Body Location Independent Activity Monitoring master thesis describes a novel algorithm to detect
human activities (walking, running, sitting, standing, upstairs and downstairs) independent of the sensor
placement. A decision tree was trained and evaluated using a leave one user out cross validation. The
developed framework achieved an accuracy of 94.53 ± 6.82%, regardless the subject and device’s position.
This thesis led to the write of the Body Location Independent Activity Monitoring paper, published in the
International Joint Conference on Biomedical Engineering Systems and Technologies (BIOSTEC) 2015 [19].
Also using machine learning approaches, the Transport Mode Detection for Elder Care Management master
thesis presents a solution to detect transport modes (as walking, bus, car or metro) using data from different
11
smartphone’ sensors and Wi-Fi Access Points. Using a decision tree as a classifier, trained with more than 24
hours of transportation data from a group of 15 individuals, the developed system achieved over 96.1%
accuracy. However, a real world validation of the implemented system obtained 88.97% accuracy. The
Smartphone-based Transport Mode Detection for Elderly Care paper demonstrates the work developed in this
thesis. It was submitted and accepted for publication at the 2016 IEEE 18th International Conference on e-
Health Networking, Applications and Services (IEEE Healthcom), held in Munich in September 2016 [20].
Currently, the Eating and Drinking Recognition for Triggering Smart Reminders master thesis is being
developed, with the aim to recognize eating and drinking gestures, in order to trigger smart reminders that
will advise the user to take a medication in the key moment when he/she is eating, or alert that he/she is
skipping a meal, or forgetting to drink water for a long time. Based on signals of inertial sensors used around
the wrist and machine learning techniques, a classifier has been developed to classify the movements
performed during the day.
Besides the papers referenced before, FhP-AICOS has been submitted and published with Human Activity
Monitoring as the main scope. Another example is the Monitoring Physical Activity and Energy Expenditure
with Smartphones paper, published in Proceedings of the IEEE-EMBS International Conferences on Biomedical
and Health Informatics. This paper describes a solution that uses the accelerometer embedded into
smartphones and considers two different positions, the user’s pocket and belt. Daily living activities are
classified through a decision tree, and it was achieved an average accuracy of 99.5% for the pocket usage
and 99.4% when the smartphone is used in the belt. Moreover, using the output of the activity classifier, the
energy expended by the user is also calculated [21], [22].
Deep Learning has also been used in Human Activity Monitoring context. Using Tensorflow (an open-source
software library for Machine Intelligence), an auto-encoder was constructed for each activity, based on deep
learning techniques. The auto-encoder’ weight and bias values were then used as features in a decision tree,
which was validated through a 10-fold cross validation. With this, walk, run, inactive and random movements
were classified with an accuracy of 95.56 ± 3.05%.
2.1.3. Gestures Recognition
FhP-AICOS has also been investigated gestures recognition, inserted into several projects and with different
goals. In this context, several master theses have been developed considering time series data.
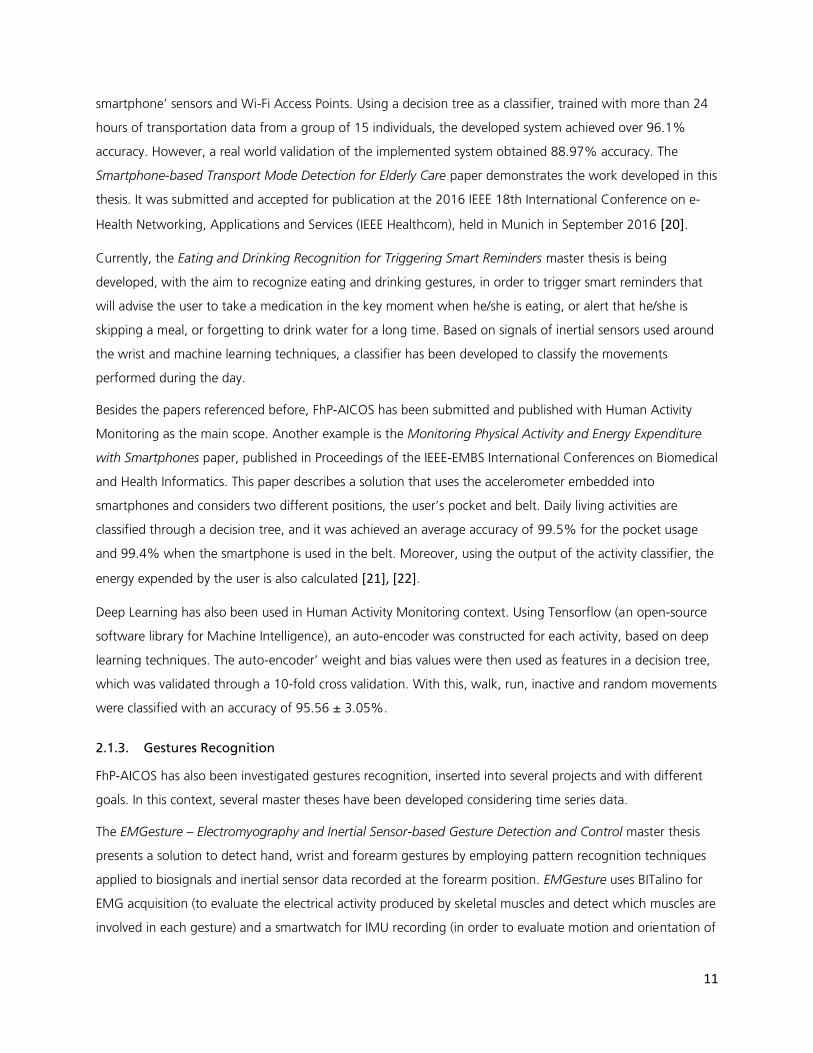
The EMGesture – Electromyography and Inertial Sensor-based Gesture Detection and Control master thesis
presents a solution to detect hand, wrist and forearm gestures by employing pattern recognition techniques
applied to biosignals and inertial sensor data recorded at the forearm position. EMGesture uses BITalino for
EMG acquisition (to evaluate the electrical activity produced by skeletal muscles and detect which muscles are
involved in each gesture) and a smartwatch for IMU recording (in order to evaluate motion and orientation of
12
the forearm) (Figure 5). An accuracy, sensitivity and precision higher than 98% were achieved in the
detection of these gestures using k-NN classifier.
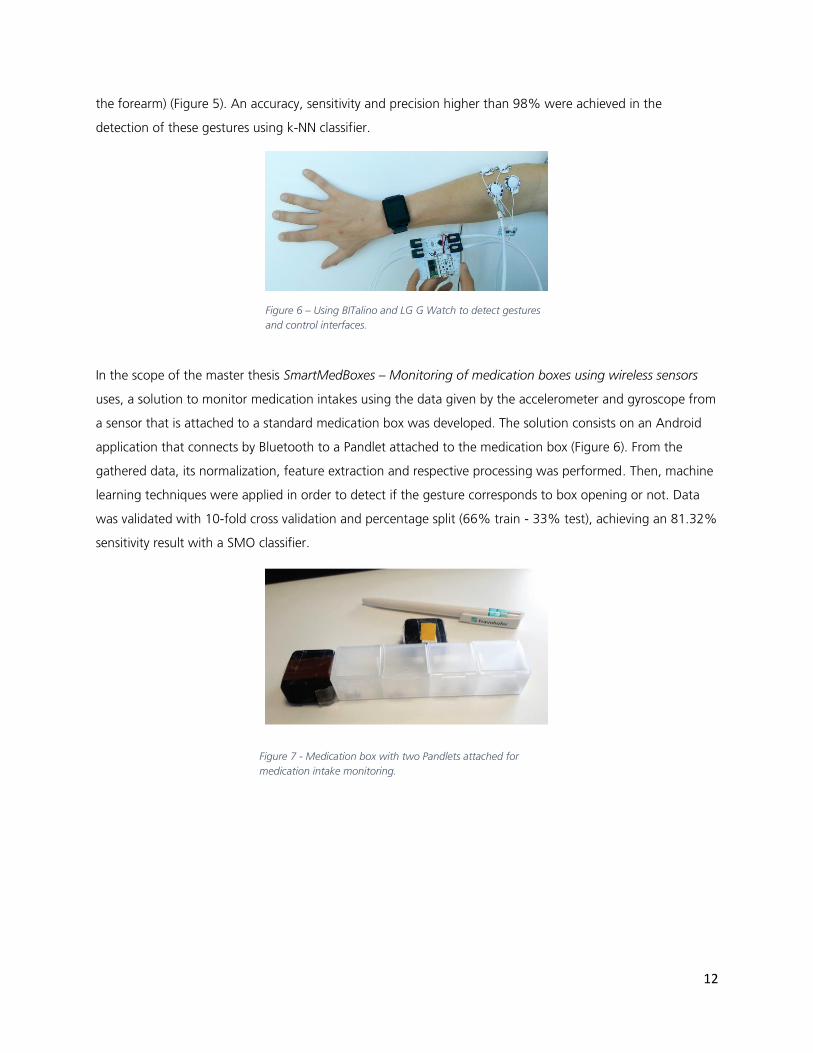
In the scope of the master thesis SmartMedBoxes – Monitoring of medication boxes using wireless sensors
uses, a solution to monitor medication intakes using the data given by the accelerometer and gyroscope from
a sensor that is attached to a standard medication box was developed. The solution consists on an Android
application that connects by Bluetooth to a Pandlet attached to the medication box (Figure 6). From the
gathered data, its normalization, feature extraction and respective processing was performed. Then, machine
learning techniques were applied in order to detect if the gesture corresponds to box opening or not. Data
was validated with 10-fold cross validation and percentage split (66% train - 33% test), achieving an 81.32%
sensitivity result with a SMO classifier.
Figure 6 – Using BITalino and LG G Watch to detect gestures
and control interfaces.
Figure 7 - Medication box with two Pandlets attached for
medication intake monitoring.
13
On the other hand, the SGL – Smartphone Gesture Learning master thesis developed a software framework
in order to detect user’s hand gestures while using the smartphone. The gesture recognition capability was
carried out by a Hidden Markov model approach, in a user independent setting, and it was achieved an
average recognition accuracy of 97.8% using the gyroscope and the linear acceleration sensor on an 8
gestures alphabet, and an average accuracy of 85.1% using the accelerometer and the gyroscope on an of
24 gestures alphabet.
2.1.4. Indoor Location
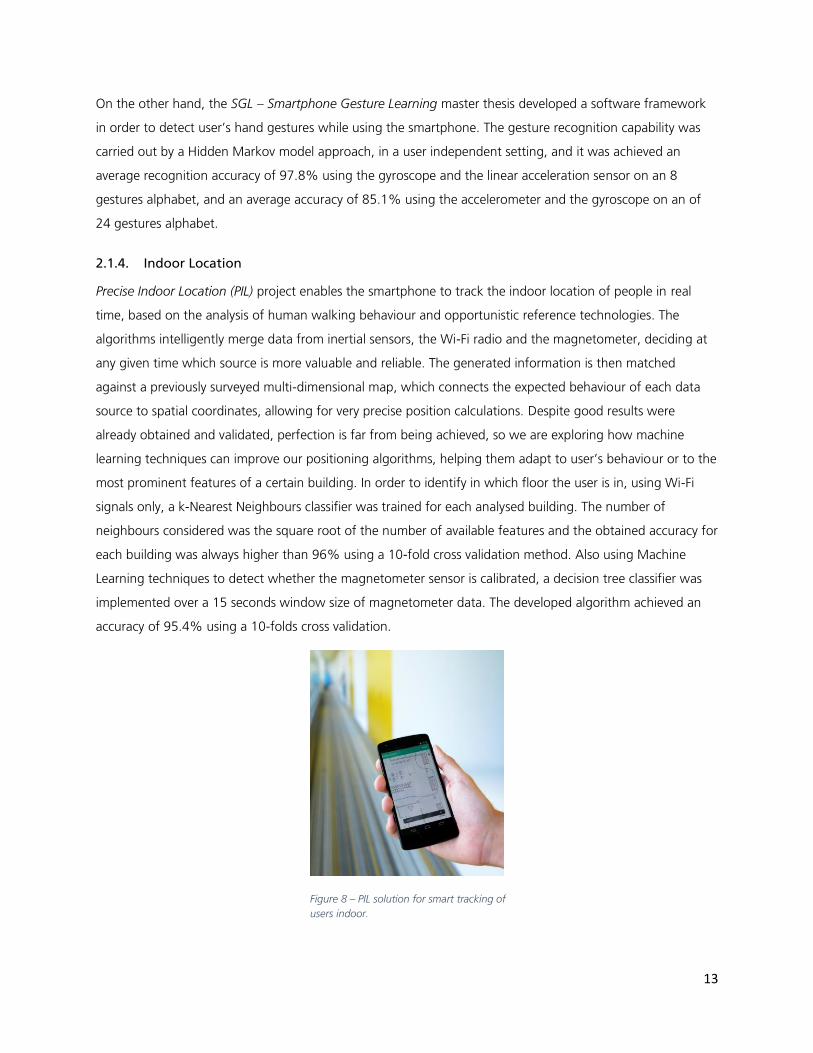
Precise Indoor Location (PIL) project enables the smartphone to track the indoor location of people in real
time, based on the analysis of human walking behaviour and opportunistic reference technologies. The
algorithms intelligently merge data from inertial sensors, the Wi-Fi radio and the magnetometer, deciding at
any given time which source is more valuable and reliable. The generated information is then matched
against a previously surveyed multi-dimensional map, which connects the expected behaviour of each data
source to spatial coordinates, allowing for very precise position calculations. Despite good results were
already obtained and validated, perfection is far from being achieved, so we are exploring how machine
learning techniques can improve our positioning algorithms, helping them adapt to user’s behaviour or to the
most prominent features of a certain building. In order to identify in which floor the user is in, using Wi-Fi
signals only, a k-Nearest Neighbours classifier was trained for each analysed building. The number of
neighbours considered was the square root of the number of available features and the obtained accuracy for
each building was always higher than 96% using a 10-fold cross validation method. Also using Machine
Learning techniques to detect whether the magnetometer sensor is calibrated, a decision tree classifier was
implemented over a 15 seconds window size of magnetometer data. The developed algorithm achieved an
accuracy of 95.4% using a 10-folds cross validation.
Figure 8 – PIL solution for smart tracking of
users indoor.
14
Currently, the Contextual information based on pervasive speech analysis master thesis is being developed,
with the aim of introduce a new layer of information using pervasive sound analysis from the built-in
smartphone’s microphones, applying machine learning techniques to develop positioning algorithms. Sound
is everywhere on daily life and certain actions and environments create well-defined fingerprints that can
enhance the current system’s performance based on their actions and context. For this purposes an acoustic
fingerprint based on background noise was recorded in 9 different locations inside a building and then used
in machine learning algorithms. Based on the sound perceived by smartphone’s microphone and the previous
recorded fingerprint, a SVM classifier was used to distinguish between the 9 places presented in the
fingerprint, obtaining an accuracy of 92.19%. Using a larger dataset with 33 different locations an accuracy
of 88.33% was obtained.
2.1.5. Sports Monitoring
Also in the DeM context, the research line Companion Competence Centre (C3) aims to develop companion
algorithms for pervasive daily physical activities monitoring. DeMSports will focus in activity monitoring in the
context of sports. In that scope, iBoccia project aims at monitoring elderly while playing Boccia gameplay with
wearable and non-wearable sensors. Several performance metrics are expected to be measured during the
gameplay. Using the pandlet inertial sensor we calculate wrist rotation angles and force applied during ball
throw, using the Kinect we recognize facial expressions and from the Mio Fuse band we retrieve heart rate.
All these metrics will provide players with performance feedback during the game that could ultimate be
related with game scores. Gesture recognition algorithms will be used to recognize arm movements during
ball throw, based on Hidden Markov Models.
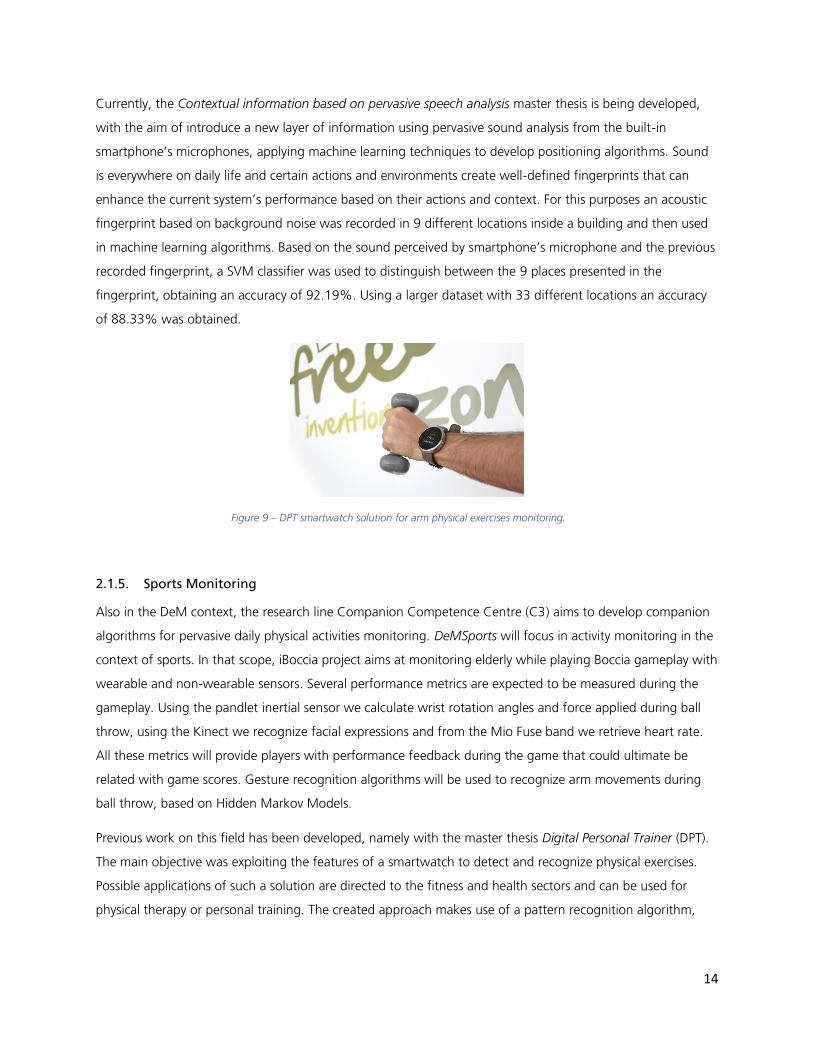
Previous work on this field has been developed, namely with the master thesis Digital Personal Trainer (DPT).
The main objective was exploiting the features of a smartwatch to detect and recognize physical exercises.
Possible applications of such a solution are directed to the fitness and health sectors and can be used for
physical therapy or personal training. The created approach makes use of a pattern recognition algorithm,
Figure 9 – DPT smartwatch solution for arm physical exercises monitoring.
15
Dynamic Time Warping (DTW) to carry out comparison calculation between the trained and tested data from
multiple gestures.
2.2. Chronic Diseases and Well-Being Management
2.2.1. Early Detection of Diseases
Over the past years, FhP-AICOS has foster research for early detection of chronic diseases and well-being
management. Concerning applications that employed machine learning techniques, several master theses
have been developed in this field.
DepSigns master thesis goal was the Detection of Depression Signs through Smartphone Usage Data
Analysis. Using this information DepSigns recognizes behaviour patterns and, consequently, significant
changes to that patterns that may indicate signs of depression, such as a decrease in communications with
friends and family, lack of activity, or variations in mood swings. This study matched personal habits inferred
by statistical techniques with behavioural pattern detection extracted by Machine Learning algorithms. A
decision tree algorithm was used to classify depressive symptoms that learned with the experience of the
psychologist’s feedback based on previous analysed statistics, which then allows predicting new possible
depressive symptoms.
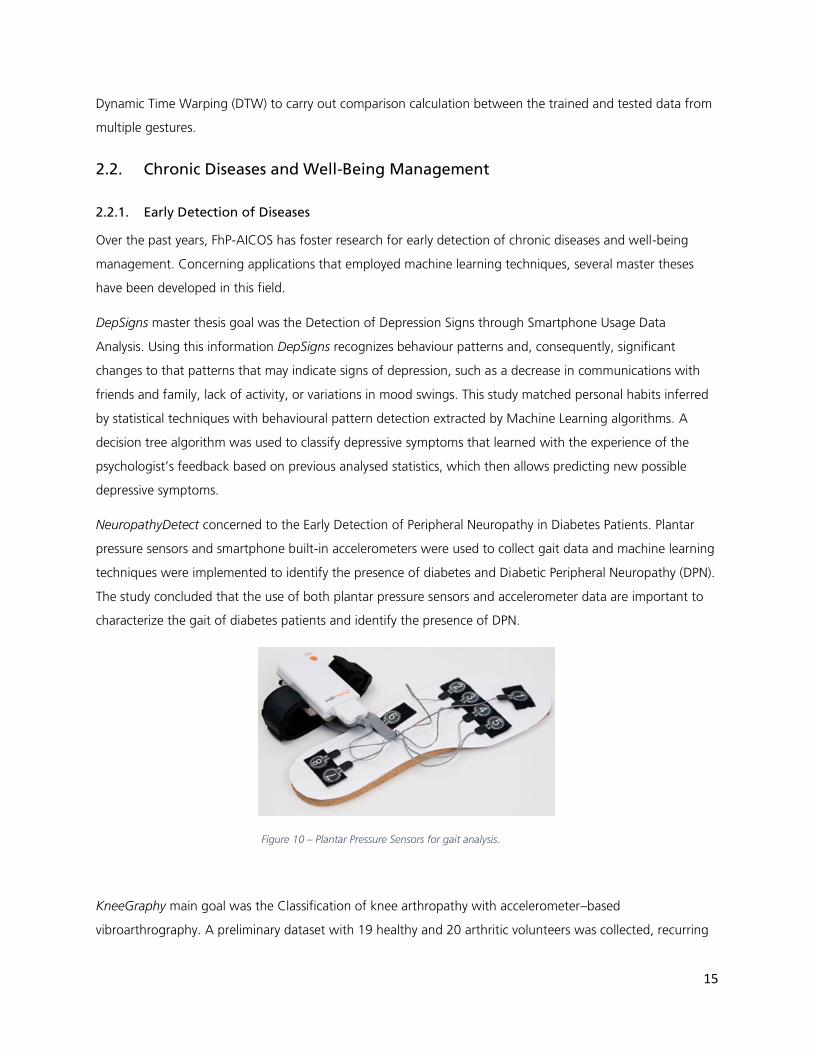
NeuropathyDetect concerned to the Early Detection of Peripheral Neuropathy in Diabetes Patients. Plantar
pressure sensors and smartphone built-in accelerometers were used to collect gait data and machine learning
techniques were implemented to identify the presence of diabetes and Diabetic Peripheral Neuropathy (DPN).
The study concluded that the use of both plantar pressure sensors and accelerometer data are important to
characterize the gait of diabetes patients and identify the presence of DPN.
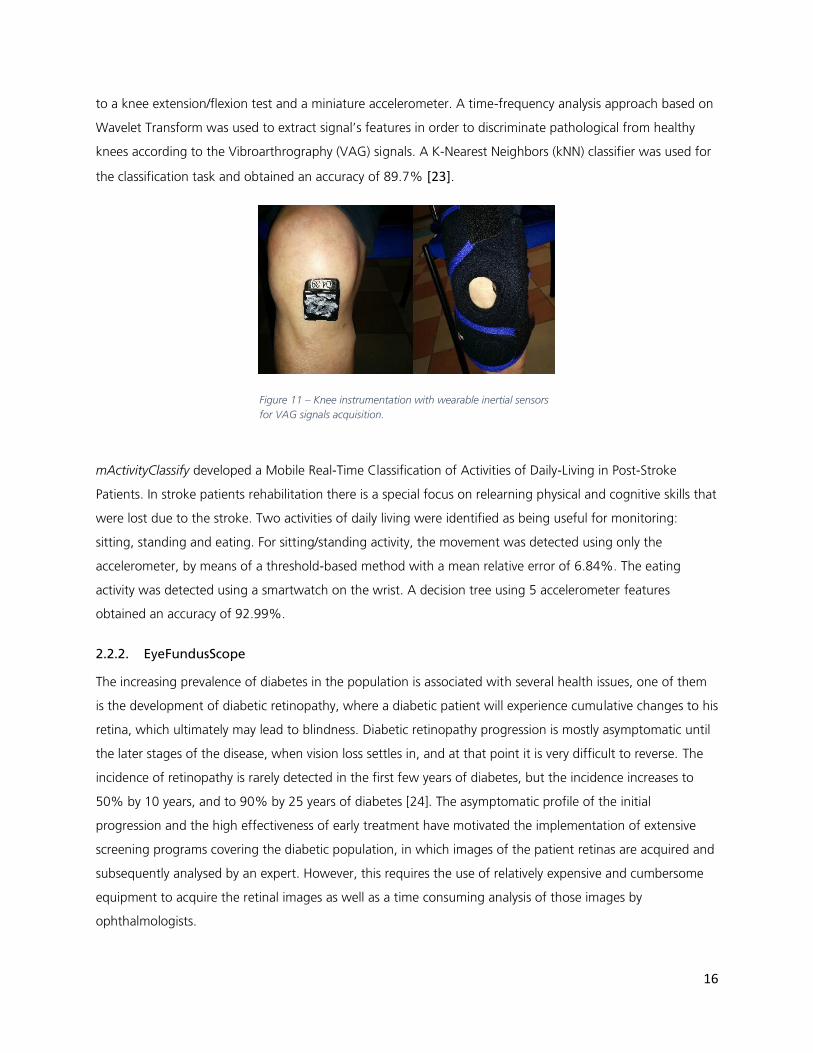
KneeGraphy main goal was the Classification of knee arthropathy with accelerometer–based
vibroarthrography. A preliminary dataset with 19 healthy and 20 arthritic volunteers was collected, recurring
Figure 10 – Plantar Pressure Sensors for gait analysis.
16
to a knee extension/flexion test and a miniature accelerometer. A time-frequency analysis approach based on
Wavelet Transform was used to extract signal’s features in order to discriminate pathological from healthy
knees according to the Vibroarthrography (VAG) signals. A K-Nearest Neighbors (kNN) classifier was used for
the classification task and obtained an accuracy of 89.7% [23].
mActivityClassify developed a Mobile Real-Time Classification of Activities of Daily-Living in Post-Stroke
Patients. In stroke patients rehabilitation there is a special focus on relearning physical and cognitive skills that
were lost due to the stroke. Two activities of daily living were identified as being useful for monitoring:
sitting, standing and eating. For sitting/standing activity, the movement was detected using only the
accelerometer, by means of a threshold-based method with a mean relative error of 6.84%. The eating
activity was detected using a smartwatch on the wrist. A decision tree using 5 accelerometer features
obtained an accuracy of 92.99%.
2.2.2. EyeFundusScope
The increasing prevalence of diabetes in the population is associated with several health issues, one of them
is the development of diabetic retinopathy, where a diabetic patient will experience cumulative changes to his
retina, which ultimately may lead to blindness. Diabetic retinopathy progression is mostly asymptomatic until
the later stages of the disease, when vision loss settles in, and at that point it is very difficult to reverse. The
incidence of retinopathy is rarely detected in the first few years of diabetes, but the incidence increases to
50% by 10 years, and to 90% by 25 years of diabetes [24]. The asymptomatic profile of the initial
progression and the high effectiveness of early treatment have motivated the implementation of extensive
screening programs covering the diabetic population, in which images of the patient retinas are acquired and
subsequently analysed by an expert. However, this requires the use of relatively expensive and cumbersome
equipment to acquire the retinal images as well as a time consuming analysis of those images by
ophthalmologists.
Figure 11 – Knee instrumentation with wearable inertial sensors
for VAG signals acquisition.
17
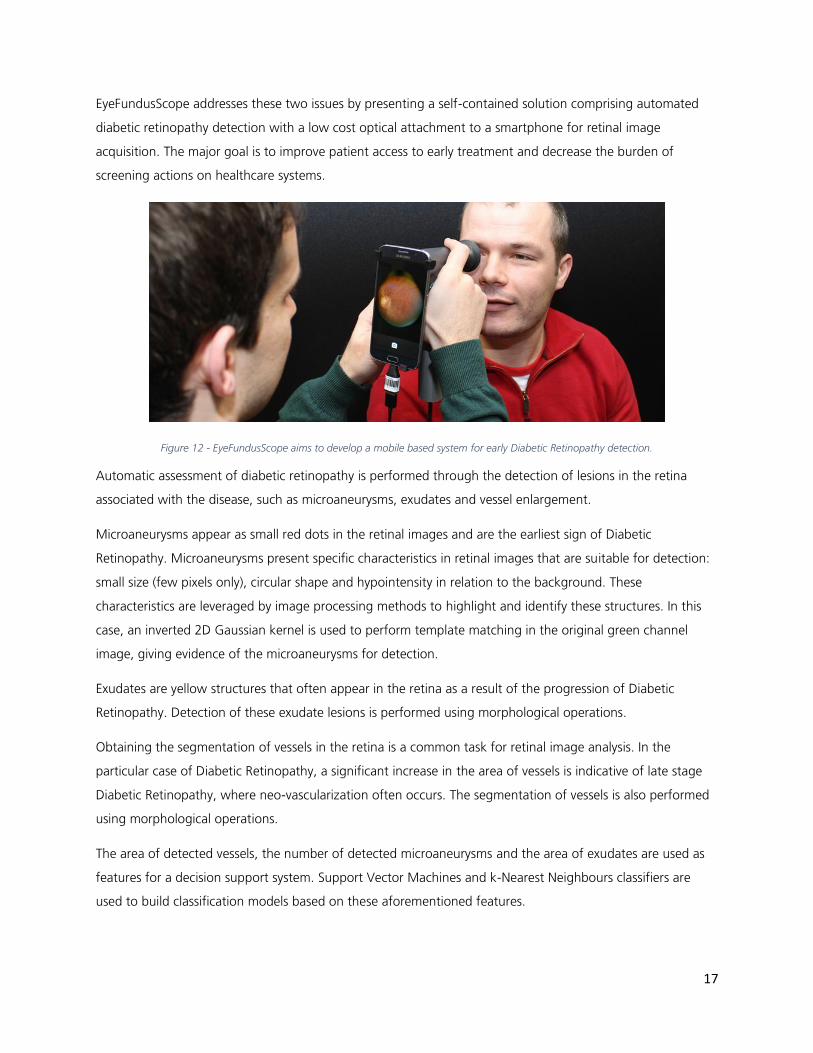
EyeFundusScope addresses these two issues by presenting a self-contained solution comprising automated
diabetic retinopathy detection with a low cost optical attachment to a smartphone for retinal image
acquisition. The major goal is to improve patient access to early treatment and decrease the burden of
screening actions on healthcare systems.
Figure 12 - EyeFundusScope aims to develop a mobile based system for early Diabetic Retinopathy detection.
Automatic assessment of diabetic retinopathy is performed through the detection of lesions in the retina
associated with the disease, such as microaneurysms, exudates and vessel enlargement.
Microaneurysms appear as small red dots in the retinal images and are the earliest sign of Diabetic
Retinopathy. Microaneurysms present specific characteristics in retinal images that are suitable for detection:
small size (few pixels only), circular shape and hypointensity in relation to the background. These
characteristics are leveraged by image processing methods to highlight and identify these structures. In this
case, an inverted 2D Gaussian kernel is used to perform template matching in the original green channel
image, giving evidence of the microaneurysms for detection.
Exudates are yellow structures that often appear in the retina as a result of the progression of Diabetic
Retinopathy. Detection of these exudate lesions is performed using morphological operations.
Obtaining the segmentation of vessels in the retina is a common task for retinal image analysis. In the
particular case of Diabetic Retinopathy, a significant increase in the area of vessels is indicative of late stage
Diabetic Retinopathy, where neo-vascularization often occurs. The segmentation of vessels is also performed
using morphological operations.
The area of detected vessels, the number of detected microaneurysms and the area of exudates are used as
features for a decision support system. Support Vector Machines and k-Nearest Neighbours classifiers are
used to build classification models based on these aforementioned features.
18
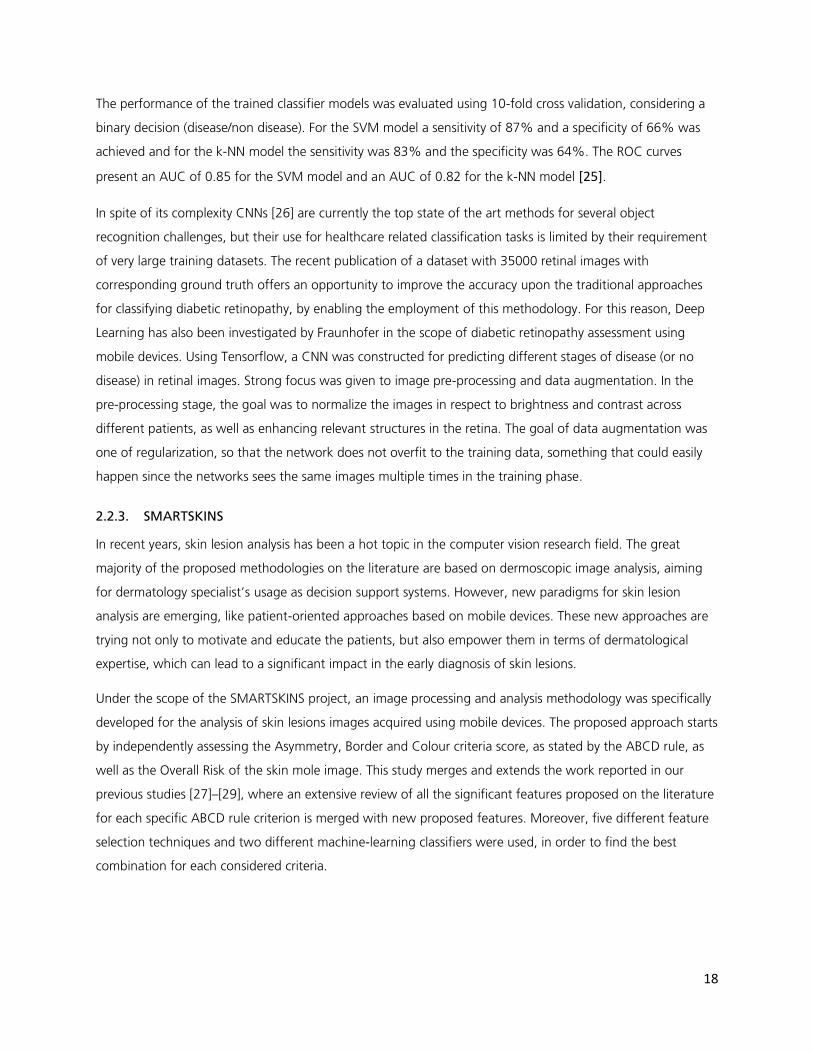
The performance of the trained classifier models was evaluated using 10-fold cross validation, considering a
binary decision (disease/non disease). For the SVM model a sensitivity of 87% and a specificity of 66% was
achieved and for the k-NN model the sensitivity was 83% and the specificity was 64%. The ROC curves
present an AUC of 0.85 for the SVM model and an AUC of 0.82 for the k-NN model [25].
In spite of its complexity CNNs [26] are currently the top state of the art methods for several object
recognition challenges, but their use for healthcare related classification tasks is limited by their requirement
of very large training datasets. The recent publication of a dataset with 35000 retinal images with
corresponding ground truth offers an opportunity to improve the accuracy upon the traditional approaches
for classifying diabetic retinopathy, by enabling the employment of this methodology. For this reason, Deep
Learning has also been investigated by Fraunhofer in the scope of diabetic retinopathy assessment using
mobile devices. Using Tensorflow, a CNN was constructed for predicting different stages of disease (or no
disease) in retinal images. Strong focus was given to image pre-processing and data augmentation. In the
pre-processing stage, the goal was to normalize the images in respect to brightness and contrast across
different patients, as well as enhancing relevant structures in the retina. The goal of data augmentation was
one of regularization, so that the network does not overfit to the training data, something that could easily
happen since the networks sees the same images multiple times in the training phase.
2.2.3. SMARTSKINS
In recent years, skin lesion analysis has been a hot topic in the computer vision research field. The great
majority of the proposed methodologies on the literature are based on dermoscopic image analysis, aiming
for dermatology specialist’s usage as decision support systems. However, new paradigms for skin lesion
analysis are emerging, like patient-oriented approaches based on mobile devices. These new approaches are
trying not only to motivate and educate the patients, but also empower them in terms of dermatological
expertise, which can lead to a significant impact in the early diagnosis of skin lesions.
Under the scope of the SMARTSKINS project, an image processing and analysis methodology was specifically
developed for the analysis of skin lesions images acquired using mobile devices. The proposed approach starts
by independently assessing the Asymmetry, Border and Colour criteria score, as stated by the ABCD rule, as
well as the Overall Risk of the skin mole image. This study merges and extends the work reported in our
previous studies [27]–[29], where an extensive review of all the significant features proposed on the literature
for each specific ABCD rule criterion is merged with new proposed features. Moreover, five different feature
selection techniques and two different machine-learning classifiers were used, in order to find the best
combination for each considered criteria.
19
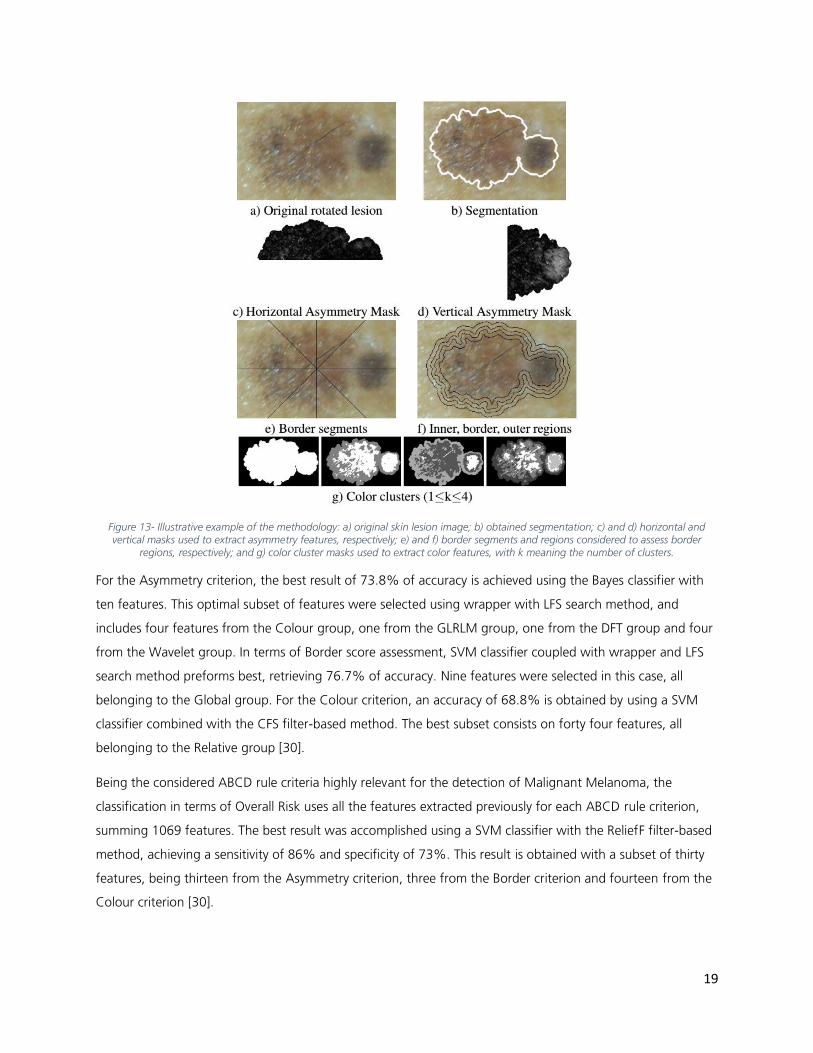
Figure 13- Illustrative example of the methodology: a) original skin lesion image; b) obtained segmentation; c) and d) horizontal and vertical masks used to extract asymmetry features, respectively; e) and f) border segments and regions considered to assess border
regions, respectively; and g) color cluster masks used to extract color features, with k meaning the number of clusters.
For the Asymmetry criterion, the best result of 73.8% of accuracy is achieved using the Bayes classifier with
ten features. This optimal subset of features were selected using wrapper with LFS search method, and
includes four features from the Colour group, one from the GLRLM group, one from the DFT group and four
from the Wavelet group. In terms of Border score assessment, SVM classifier coupled with wrapper and LFS
search method preforms best, retrieving 76.7% of accuracy. Nine features were selected in this case, all
belonging to the Global group. For the Colour criterion, an accuracy of 68.8% is obtained by using a SVM
classifier combined with the CFS filter-based method. The best subset consists on forty four features, all
belonging to the Relative group [30].
Being the considered ABCD rule criteria highly relevant for the detection of Malignant Melanoma, the
classification in terms of Overall Risk uses all the features extracted previously for each ABCD rule criterion,
summing 1069 features. The best result was accomplished using a SVM classifier with the ReliefF filter-based
method, achieving a sensitivity of 86% and specificity of 73%. This result is obtained with a subset of thirty
features, being thirteen from the Asymmetry criterion, three from the Border criterion and fourteen from the
Colour criterion [30].
20
2.2.4. MalariaScope
Malaria is a leading cause of death and disease in many developing countries. In 2015, there were an
estimated 214 million cases of malaria, which caused approximately 438 000 deaths. Around 90% of malaria
cases occurred in Africa, where the lack of access to malaria diagnosis is largely due to a shortage of
expertise, being the shortage of equipment the secondary factor. The WHO considers that the current
funding distribution on malaria control commodities (US$ 1.6 billion in 2014) is not addressing the
fundamental weaknesses in health systems of developing countries, suggesting that innovative ways may be
required to rapidly expand access to malaria interventions.
It´s worth underlining that the mobile phone is currently Africa's most important digital technology, and just
as African telecommunications largely skipped over landline infrastructure and went straight to mobile
phones, some experts say African medicine can skip over centralized labs. Moreover, the combination of
mobile devices with image processing for malaria diagnosis can bring several advantages, like potentially
reduce the dependence of manual microscopic examination, which is an exhaustive and time consuming
activity, simultaneously requiring a considerable expertise of the laboratory technician. Microscopy
examination remains the gold standard for laboratory confirmation of malaria 4, which can be made through
microscopic examination of thin and thick blood smears. While the thin smear consists in a single layer of red
blood cells, the thick smear is 6-20 times thicker, allowing for a greater volume of blood to be examined.
Thus, thick smears are firstly used to check the presence of malaria parasites (MP), while thin smears are
subsequently analysed for the identification of MP species.
Under the scope of the MalariaScope project, a methodology to assess the presence of P.falciparum
trophozoites and white blood cells (WBC) in Giemsa stained thick blood smears was developed. The great
majority of the proposed methodologies to date are based on images acquired under well controlled
conditions and with proper microscopic equipment, so the main differential factor of this work is the usage
of microscopic images exclusively acquired with smartphones coupled to a low cost optical magnification
device, as well as the consequent customization of the proposed methodology for images with such
characteristics. Given the lack of freely available image datasets, a mobile acquired image dataset manually
annotated by a specialist was specifically created and used in this study. Moreover, a wide variety of image
features were used to characterize the candidates in terms of geometry, texture and colour, merging
significant features referred on previous works, with some never used before for this purpose. A two-class
SVM classifier with a RBF kernel was used to create a classification model, using a grid-search approach to
obtain the best γ and C parameters [31].
In terms of results, the automatic detection of WBC in thick blood smears achieved 98.2% of sensitivity and
72.1% specificity, while the P.falciparum trophozoites detection achieved a sensitivity of 80.5% and a
specificity of 93.8%. It should be noted that this work represents only a component of a mobile-based
21
framework for malaria parasites detection currently being developed. As future work in terms of image
processing, we aim to develop methodologies for the analysis of thin blood smears images acquired
exclusively with smartphones, in order to identify and count all possible species-stages combinations of MP
that can potentially infect humans. The main final goal is to develop a system that can provide an effective
pre-diagnosis of malaria to be used in medically underserved areas [31].
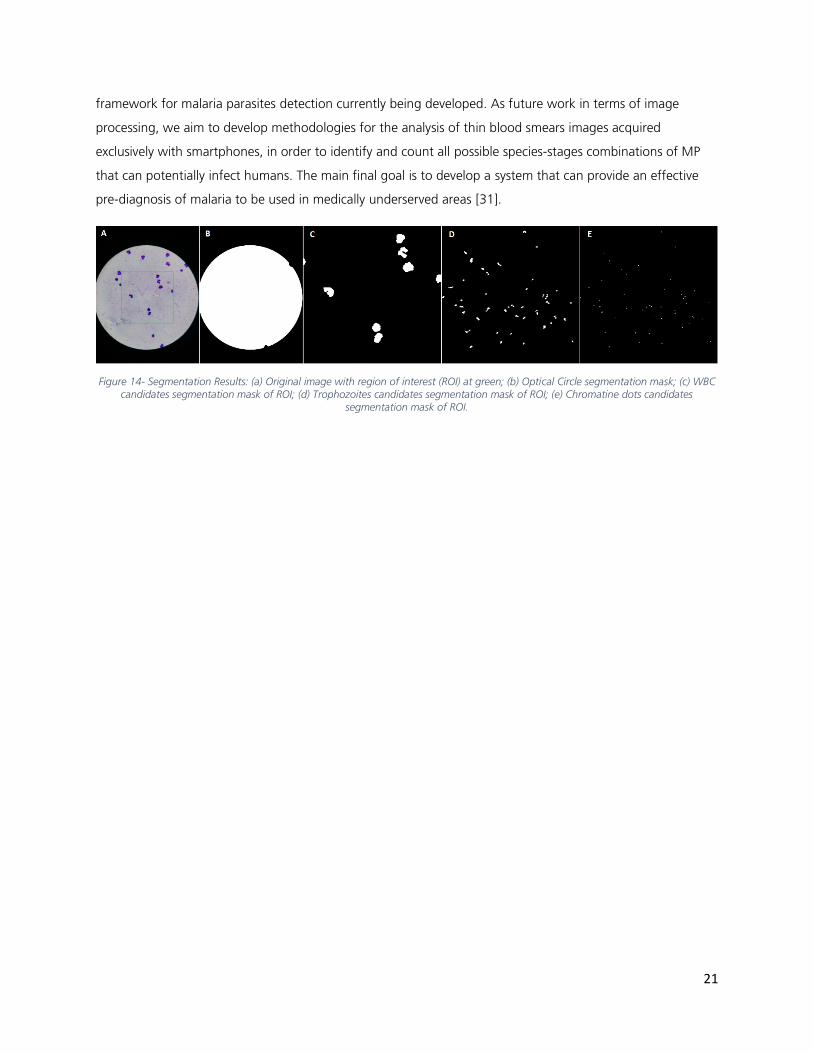
Figure 14- Segmentation Results: (a) Original image with region of interest (ROI) at green; (b) Optical Circle segmentation mask; (c) WBC
candidates segmentation mask of ROI; (d) Trophozoites candidates segmentation mask of ROI; (e) Chromatine dots candidates segmentation mask of ROI.
22
2.3. Assistive Environments
2.3.1. ShopView
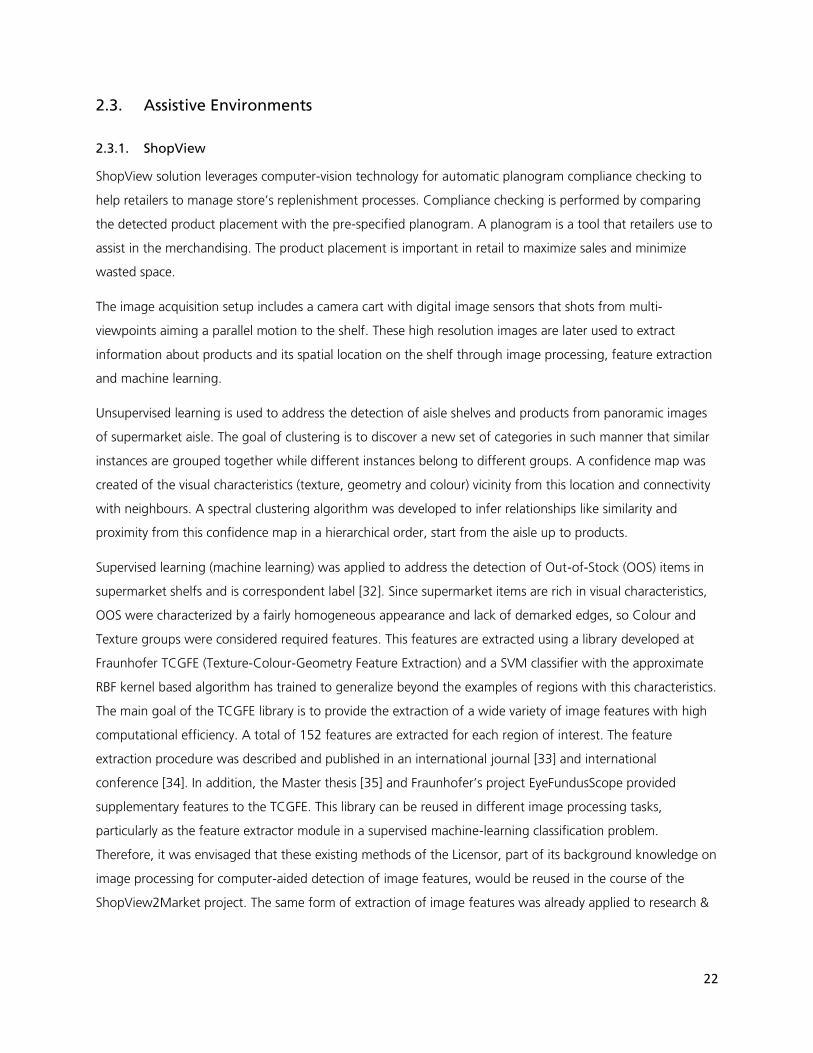
ShopView solution leverages computer-vision technology for automatic planogram compliance checking to
help retailers to manage store’s replenishment processes. Compliance checking is performed by comparing
the detected product placement with the pre-specified planogram. A planogram is a tool that retailers use to
assist in the merchandising. The product placement is important in retail to maximize sales and minimize
wasted space.
The image acquisition setup includes a camera cart with digital image sensors that shots from multi-
viewpoints aiming a parallel motion to the shelf. These high resolution images are later used to extract
information about products and its spatial location on the shelf through image processing, feature extraction
and machine learning.
Unsupervised learning is used to address the detection of aisle shelves and products from panoramic images
of supermarket aisle. The goal of clustering is to discover a new set of categories in such manner that similar
instances are grouped together while different instances belong to different groups. A confidence map was
created of the visual characteristics (texture, geometry and colour) vicinity from this location and connectivity
with neighbours. A spectral clustering algorithm was developed to infer relationships like similarity and
proximity from this confidence map in a hierarchical order, start from the aisle up to products.
Supervised learning (machine learning) was applied to address the detection of Out-of-Stock (OOS) items in
supermarket shelfs and is correspondent label [32]. Since supermarket items are rich in visual characteristics,
OOS were characterized by a fairly homogeneous appearance and lack of demarked edges, so Colour and
Texture groups were considered required features. This features are extracted using a library developed at
Fraunhofer TCGFE (Texture-Colour-Geometry Feature Extraction) and a SVM classifier with the approximate
RBF kernel based algorithm has trained to generalize beyond the examples of regions with this characteristics.
The main goal of the TCGFE library is to provide the extraction of a wide variety of image features with high
computational efficiency. A total of 152 features are extracted for each region of interest. The feature
extraction procedure was described and published in an international journal [33] and international
conference [34]. In addition, the Master thesis [35] and Fraunhofer’s project EyeFundusScope provided
supplementary features to the TCGFE. This library can be reused in different image processing tasks,
particularly as the feature extractor module in a supervised machine-learning classification problem.
Therefore, it was envisaged that these existing methods of the Licensor, part of its background knowledge on
image processing for computer-aided detection of image features, would be reused in the course of the
ShopView2Market project. The same form of extraction of image features was already applied to research &
23
development projects of distinct scopes, and would be a strategic added-value to the ShopView solution, in
particular, to fulfil one of the requirements related with out-of-stock detection.
The automated detection of labels is of utmost importance for ShopView auditing. Since the labels in
supermarket have the same layout and only the information of product change from label to label, the
detection can be modulated as object detection. A cascade classifier has trained to learn the relevant
structure of label layout through local binary pattern (LBP) features parameters. Stages in the cascade are
constructed by training classifiers using Adaboost. A positive result from the previous weak classifier triggers
next weak classifier which has also been adjusted to achieve higher detection rate than the previous one. The
cascade structure allows vast (irrelevant) regions of the image to be immediately discarded at any stage with
minimum effort, focusing heavier computation on the most promising regions.
Figure 15 – ShopView aims to help retailers to manage store’s replenishment processes and planogram compliance.
24
3. CONCLUSIONS
The main research areas where Fraunhofer has been applied machine learning techniques focus on solutions
for falls and activity monitoring, chronic diseases and well-being management and assistive environments.
Most of the solutions that cover the area of falls and activity monitoring, required the acquisition and analysis
of large amounts of time-series data, usually retrieved from inertial sensors (accelerometer, gyroscope,
magnetometer), but also from other biosignals, as plantar pressure sensors and EMG (electromyography)
signals and even contextual signals as the Wi-Fi signals, sound signals and smartphone usage data. The main
goal of FhP-AICOS is to support industry partners with scientific solutions that apply innovative methods of
machine learning to solve emergent problems in our society and world-wide, contributing to the general
well-being and improvement of end-users’ quality of life. Previous collaborations with industry, have
successfully created scientific knowledge capable of generating added value for industry clients and partners,
as Gociety partnership, that is currently commercializing our solutions for falls and activity monitoring based
on smartphones.
For the area of chronic diseases and well-being management, EyeFundusScope proposes a low cost system
for diabetic retinopathy screening using smartphones, leveraging recent advances in smartphone imaging
capabilities as well as state of the art computer vision methods for automated retinal image analysis. This
technology is currently being integrated in a screening workflow management software, in collaboration with
First Solutions. SMARTSKINS research project proposed a mobile-based framework for risk triage and early
diagnosis of skin cancers, with active involvement of dermatologists. The framework uses image processing
and analysis methods as well as machine learning techniques to classify skin lesions images acquired using
mobile phones. Also, in the research project, MalariaScope a new mobile-based framework that can provide
an effective pre-diagnosis of malaria to be used in medically underserved areas was developed, which used
image processing methods as well as supervised learning to analyse microscopic images of malaria-infected
blood smears.
Concerning assistive environments, ShopView image acquisition setup was designed to avoid common
difficulties in supermarket aisles such as - illumination, shadows and reflections. Multi-camera image analysis,
high-resolution data processing and classification have been identified as critical for applied research with the
biggest retailer in Portugal, Sonae. For the development of such computer vision technology, the controlled
image acquisition was essential for the robustness of machine learning techniques, contributing for the
correct location and classification of objects detected, as validated in several retail environments by retail
employees through the partnership with Sonae MC.
25
4. ACKNOWLEDGMENTS
The authors of this white paper would like to thank to all the researchers involved in all projects that were
mentioned, namely the Signal Processing and Computer Vision teams as well as the students that conducted
the Master Thesis.
26
5. BIBLIOGRAPHY
[1] A. G. Wilde, “An Overview of Human Activity Detection Technologies for Pervasive Systems,”
Department of Informatics University of Fribourg, Switzerland, vol. 212, pp. 72–112, 2010.
[2] Z. Ghahramani, “Unsupervised learning,” Advanced Lectures on Machine Learning, 2004.
[3] I. H. Witten and E. Frank, “Data Mining: Practical machine learning tools and techniques,” Morgan
Kaufmann, 2005.
[4] J. E. Dayhoff and J. M. DeLeo, “Artificial neural networks,” Cancer, vol. 91(S8), 1615–1635.
[5] “A Practical Introduction to Deep Learning with Caffe and Python // Adil Moujahid // Data Analytics and
more.” [Online]. Available: http://adilmoujahid.com/posts/2016/06/introduction-deep-learning-python-
caffe/. [Accessed: 27-Jun-2017].
[6] S. B. Kotsiantis, I. Zaharakis, and P. Pintelas, “Supervised machine learning: A review of classification
techniques,” IOS Press, 2007.
[7] “Naive Bayes Classifier.” [Online]. Available: http://www.statsoft.com/textbook/naive-bayes-classifier.
[Accessed: 26-Jun-2017].
[8] J. C. Platt, “Sequential Minimal Optimization: A Fast Algorithm for Training Support Vector Machines,”
Microsoft Research MSR-TR-98-14, 1998.
[9] E. Fosler-Lussier, “Markov models and hidden markov models - a brief tutorial,” International Computer
Science Institute, 1998.
[10] R. Schapire, “Explaining AdaBoost.” .
[11] A. Y. Ng, M. I. Jordan, and Y. Weiss, “On spectral clustering: Analysis and an algorithm,” Advances in
neural information processing systems, p. 2002.
[12] H. Sak, A. Senior, and F. Beaufays, “Long short-term memory recurrent neural network architectures for
large scale acoustic modeling,” Fifteenth Annual Conference of the International Speech Communication
Association, 2014.
[13] “A day with Pandlets.” Fraunhofer Portugal AICOS.
[14] B. Aguiar, T. Rocha, J. Silva, and I. Sousa, “Accelerometer-based fall detection for smartphones,” in 2014
IEEE International Symposium on Medical Measurements and Applications (MeMeA), 2014, pp. 1–6.
[15] J. Vermeulen, S. Willard, B. Aguiar, and L. P. de Witte, “Validity of a smartphone-based fall detection
application on different phones worn on a belt or in a trouser pocket,” Assistive Technology, vol. 27, no.
1, pp. 18–23, Aug. 2014.
[16] J. Silva and I. Sousa, “Instrumented Timed Up and Go: Fall Risk Assessment based on Inertial Wearable
Sensors,” in 2016 IEEE International Symposium on Medical Measurements and Applications (MeMeA)
(MeMeA 2016), Benevento, Italy, 2016.
[17] J. Silva et al., “Comparing Machine Learning Approaches for Fall Risk Assessment,” in Proceedings of the
10th International Joint Conference on Biomedical Engineering Systems and Technologies - Volume 4:
BIOSIGNALS, (BIOSTEC 2017), 2017, pp. 223–230.
27
[18] J. Silva, M. Monteiro, and F. Sousa, “Human Activity Classification with Inertial Sensors,” PHealth:
International Conference on Wearable Micro and Nano Technologies for Personalized Health, vol. 200,
pp. 101–104, 2014.
[19] C. Figueira, R. Matias, and H. Gamboa, “Body Location Independent Activity Monitoring,” Proceedings
of the 9th International Joint Conference on Biomedical Engineering Systems and Technologies (BIOSTEC
2016), vol. 4: BIOSIGNALS, pp. 190–197.
[20] N. Cardoso, J. Madureira, and N. Pereira, “Smartphone-based transport mode detection for elderly
care,” IEEE 18th International Conference on e-Health Networking, Applications and Services (IEEE
Healthcom), 2016.
[21] B. Aguiar, J. Silva, T. Rocha, S. Carneiro, and I. Sousa, “Monitoring Physical Activity and Energy
Expenditure with Smartphones,” Proceedings of the IEEE-EMBS International Conferences on Biomedical
and Health Informatics, pp. 664–667, 2014.
[22] S. Carneiro et al., “Accelerometer-based methods for energy expenditure using the smartphone,” in
2015 IEEE International Symposium on Medical Measurements and Applications (MeMeA), 2015, pp.
151–156.
[23] D. Moreira, “Classification of knee arthropathy with accelerometer-based vibroarthrography,” Faculdade
de Engenharia da Universidade do Porto (FEUP), Porto, 2015.
[24] G. D. Calderon, O. H. Juarez, G. E. Hernandez, S. M. Punzo, and Z. D. De la Cruz, “Oxidative stress and
diabetic retinopathy: development and treatment,” Eye (Lond), vol. 31, no. 8, pp. 1122–1130, Aug.
2017.
[25] J. Costa, I. Sousa, and F. Soares, “Smartphone-Based Decision Support System for Elimination of
Pathology-Free Images in Diabetic Retinopathy Screening,” in Internet of Things Technologies for
HealthCare, 2016, pp. 83–88.
[26] H. Pratt, F. Coenen, D. M. Broadbent, S. P. Harding, and Y. Zheng, “Convolutional Neural Networks for
Diabetic Retinopathy,” Procedia Computer Science, vol. 90, pp. 200–205, Jan. 2016.
[27] M. J. M. Vasconcelos, L. Rosado, and M. Ferreira, “Principal axes-based asymmetry assessment
methodology for skin lesion image analysis,” in Advances in Visual Computing, G. Bebis, R. Boyle, B.
Parvin, D. Koracin, R. McMahan, J. Jerald, H. Zhang, S. M. Drucker, C. Kambhamettu, M. E. Choubassi,
Z. Deng, and M. Carlson, Eds. Springer International Publishing, 2014, pp. 21–31.
[28] M. J. M. Vasconcelos, L. Rosado, and M. Ferreira, “A new color assessment methodology using cluster-
based features for skin lesion analysis,” in 2015 38th International Convention on Information and
Communication Technology, Electronics and Microelectronics (MIPRO), 2015, pp. 373–378.
[29] L. Rosado and M. Vasconcelos, “Automatic Segmentation Methodology for Dermatological Images
Acquired via Mobile Devices,” in Proceedings of the International Conference on Health Informatics,
2015, pp. 246–251.
[30] L. Rosado, M. João, M. Vasconcelos, and M. Ferreira, “Pigmented Skin Lesion Computerized Analysis via
Mobile Devices,” in Proceedings of the 31st Spring Conference on Computer Graphics, New York, NY,
USA, 2015, pp. 105–108.
[31] L. Rosado, J. M. C. da Costa, D. Elias, and J. S. Cardoso, “Automated Detection of Malaria Parasites on
Thick Blood Smears via Mobile Devices,” Procedia Computer Science, vol. 90, pp. 138–144, Jan. 2016.
28
[32] L. Rosado, J. Gonçalves, J. Costa, D. Ribeiro, and F. Soares, “Supervised learning for Out-of-Stock
detection in panoramas of retail shelves,” in 2016 IEEE International Conference on Imaging Systems and
Techniques (IST), 2016, pp. 406–411.
[33] L. Rosado, M. J. Vasconcelos, and M. Ferreira, “A Mobile-Based Prototype for Skin Lesion Analysis:
Towards a Patient-Oriented Design Approach,” International Journal of Online Engineering (iJOE), vol. 9,
no. S8, pp. 27–29, Dec. 2013.
[34] M. J. M. Vasconcelos, L. Rosado, and M. Ferreira, “A new risk assessment methodology for dermoscopic
skin lesion images,” in 2015 IEEE International Symposium on Medical Measurements and Applications
(MeMeA) Proceedings, 2015, pp. 570–575.
[35] J. M. R. da Costa, “Mobile-Based risk assessment of diabetic retinopathy by image processing,” Jul.
2015.