Embed Size (px)
Citation preview

Machine Learning
CUNY Graduate Center
Lecture 21: Graphical Models

Today
• Graphical Models– Representing conditional dependence
graphically
2

Graphical Models and Conditional Independence
• More generally about probabilities, but used in classification and clustering.
• Both Linear Regression and Logistic Regression use probabilistic models.
• Graphical Models allow us to structure, and visualize probabilistic models, and the relationships between variables.
3

(Joint) Probability Tables
• Represent multinomial joint probabilities between K variables as K-dimensional tables
• Assuming D binary variables, how big is this table?
• What is we had multinomials with M entries?
4

Probability Models
• What if the variables are independent?
• If x and y are independent:
• The original distribution can be factored
• How big is this table, if each variable is binary?
5

Conditional Independence
• Independence assumptions are convenient (Naïve Bayes), but rarely true.
• More often some groups of variables are dependent, but others are independent.
• Still others are conditionally independent.
6

Conditional Independence
• If two variables are conditionally independent.
• E.g. y = flu?, x = achiness?, z = headache?
7

Factorization if a joint
• Assume
• How do you factorize:
8

Factorization if a joint
• What if there is no conditional independence?
• How do you factorize:
9

Structure of Graphical Models
• Graphical models allow us to represent dependence relationships between variables visually– Graphical models are directed acyclic graphs
(DAG).– Nodes: random variables– Edges: Dependence relationship– No Edge: Independent variables– Direction of the edge: indicates a parent-child
relationship– Parent: Source – Trigger– Child: Destination – Response
10

Example Graphical Models
• Parents of a node i are denoted πi
• Factorization of the joint in a graphical model:
11
xx yy xx yy

Basic Graphical Models
• Independent Variables
• Observations
• When we observe a variable, (fix its value from data) we color the node grey.
• Observing a variable allows us to condition on it. E.g. p(x,z|y)
• Given an observation we can generate pdfs for the other variables.
12
xx yy zz
xx yy zz

Example Graphical Models
• X = cloudy?
• Y = raining?
• Z = wet ground?
• Markov Chain
13
xx yy zz

Example Graphical Models
• Markov Chain
• Are x and z conditionally independent given y?
14
xx yy zz

Example Graphical Models
• Markov Chain
15
xx yy zz
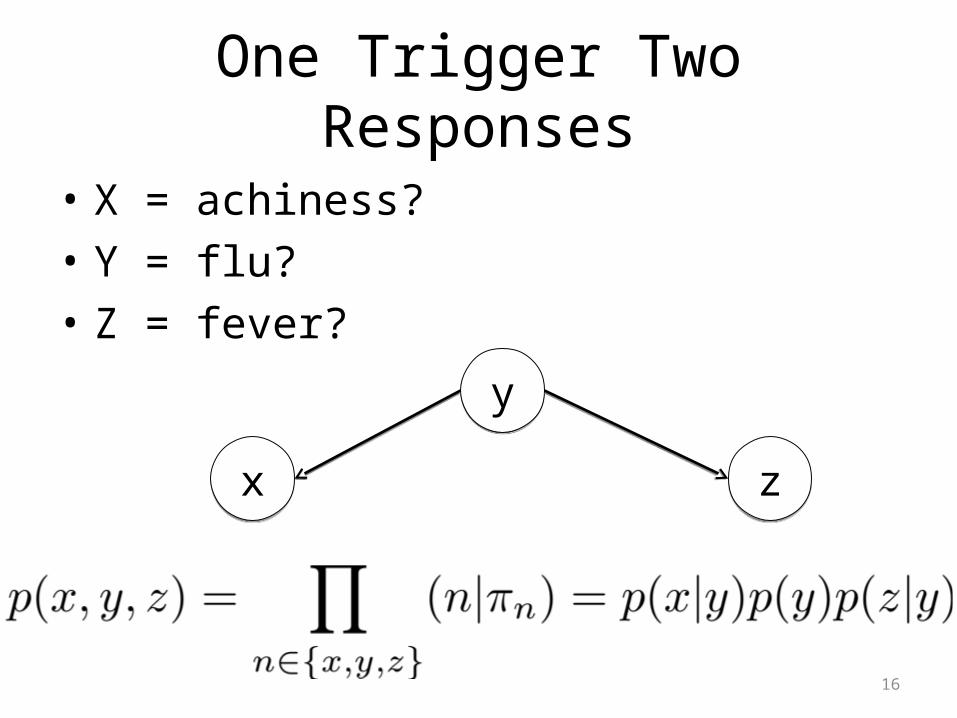
One Trigger Two Responses
• X = achiness?
• Y = flu?
• Z = fever?
16
xx
yy
zz

Example Graphical Models
• Are x and z conditionally independent given y?
17
xx
yy
zz
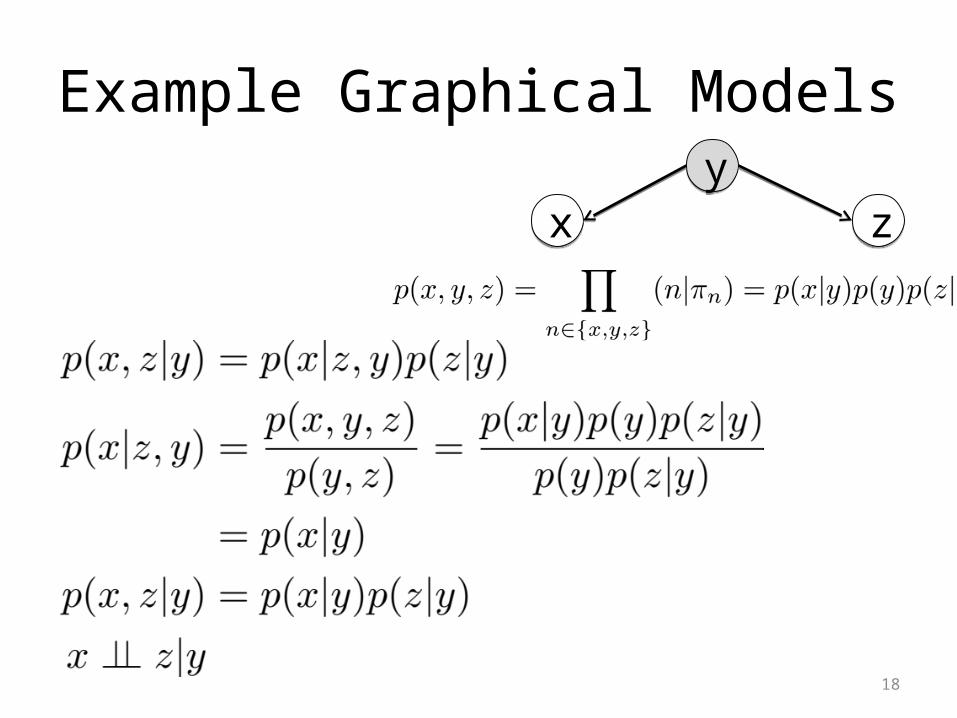
Example Graphical Models
18
xxyy
zz

Two Triggers One Response
• X = rain?
• Y = wet sidewalk?
• Z = spilled coffee?
19
xx
yy
zz

Example Graphical Models
• Are x and z conditionally independent given y?
20
xx
yy
zz

Example Graphical Models
21
xxyy
zz

Factorization
22
x0x0
x1x1
x2x2 x4x4
x3x3
x5x5

Factorization
23
x0x0
x1x1
x2x2 x4x4
x3x3
x5x5

How Large are the probability tables?
24

Model Parameters as Nodes
• Treating model parameters as a random variable, we can include these in a graphical model
• Multivariate Bernouli
25
µ0µ0
x0x0
µ1µ1
x1x1
µ2µ2
x2x2
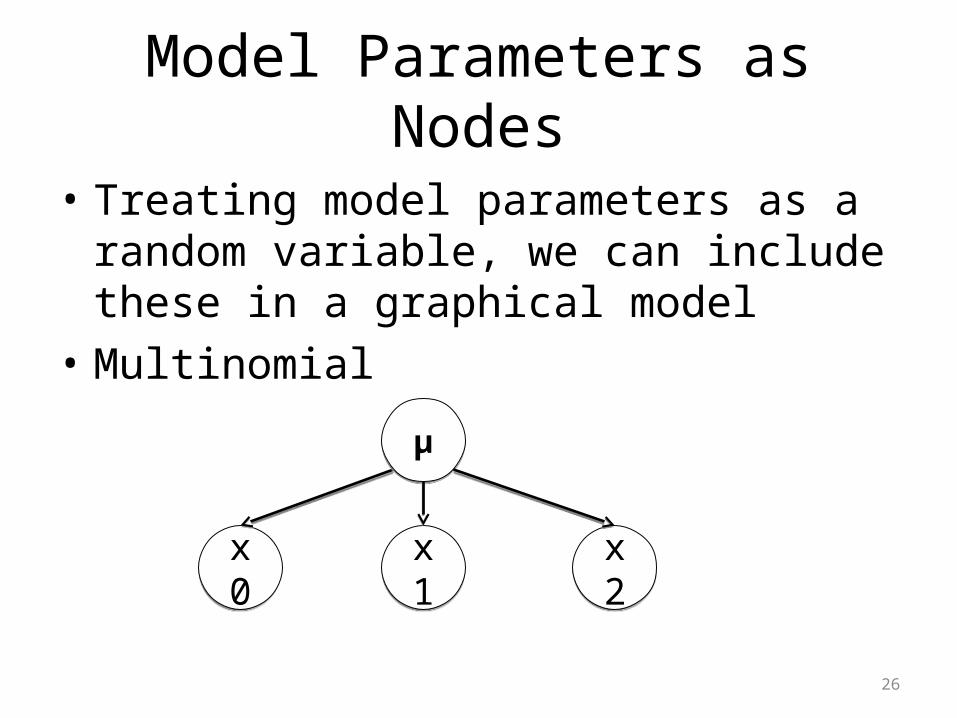
Model Parameters as Nodes
• Treating model parameters as a random variable, we can include these in a graphical model
• Multinomial
26
x0x0
µµ
x1x1 x2x2

Naïve Bayes Classification
• Observed variables xi are independent given the class variable y
• The distribution can be optimized using maximum likelihood on each variable separately.
• Can easily combine various types of distributions
27
x0x0
yy
x1x1 x2x2

Graphical Models
• Graphical representation of dependency relationships
• Directed Acyclic Graphs• Nodes as random variables• Edges define dependency relations• What can we do with Graphical Models
– Learn parameters – to fit data– Understand independence relationships between
variables– Perform inference (marginals and conditionals)– Compute likelihoods for classification.
28

Plate Notation
• To indicate a repeated variable, draw a plate around it.
29
x0x0
yy
x1x1 xnxn…
yy
xixi
n

Completely observed Graphical Model
• Observations for every node
• Simplest (least general) graph, assume each independent
30
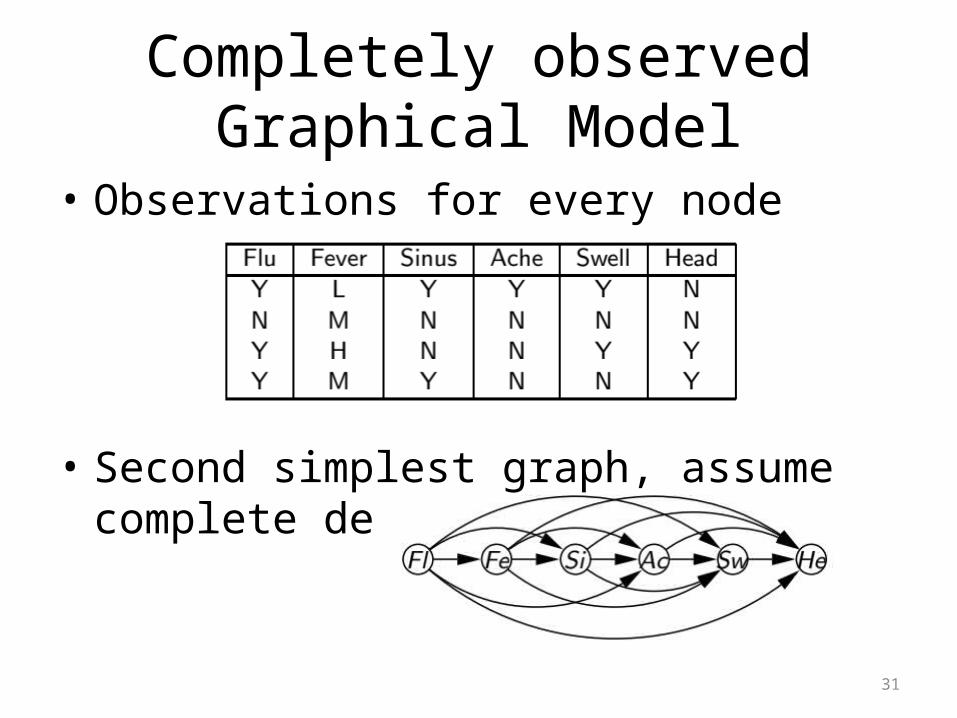
Completely observed Graphical Model
• Observations for every node
• Second simplest graph, assume complete dependence
31

Maximum Likelihood
• Each node has a conditional probability table, θ
• Given the tables, we can construct the pdf.
• Use Maximum Likelihood to find the best settings of θ
32

Maximum likelihood
33

Count functions
• Count the number of times something appears in the data
34

Maximum Likelihood
• Define a function:
• Constraint:
35

Maximum Likelihood
• Use Lagrange Multipliers
36

Maximum A Posteriori Training
• Bayesians would never do that, the thetas need a prior.
37
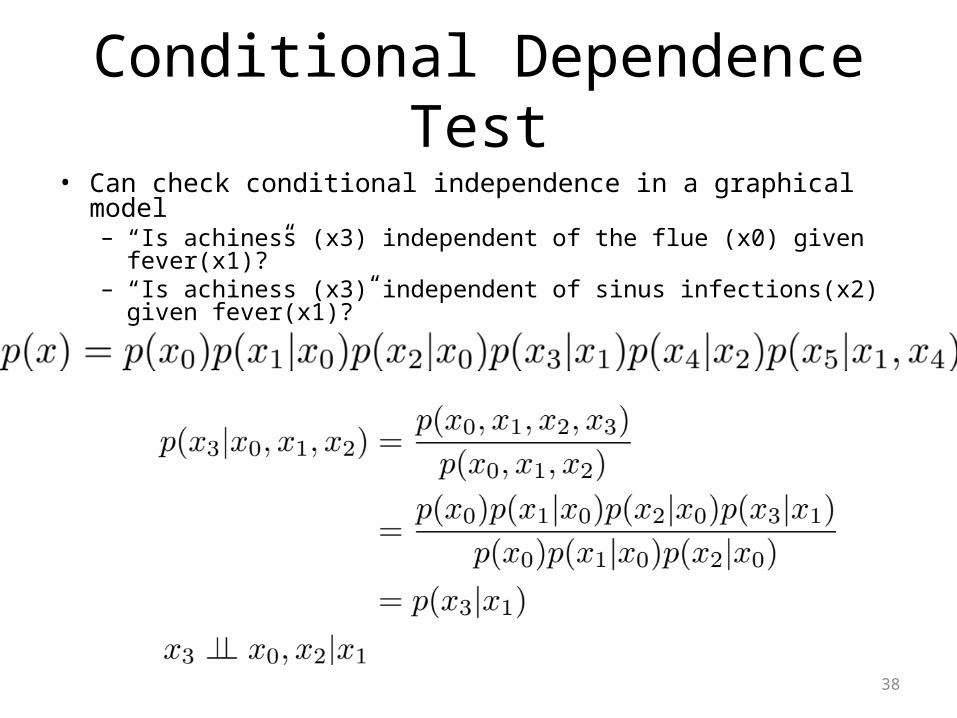
Conditional Dependence Test• Can check conditional independence in a graphical model
– “Is achiness (x3) independent of the flue (x0) given fever(x1)?”– “Is achiness (x3) independent of sinus infections(x2) given
fever(x1)?”
38
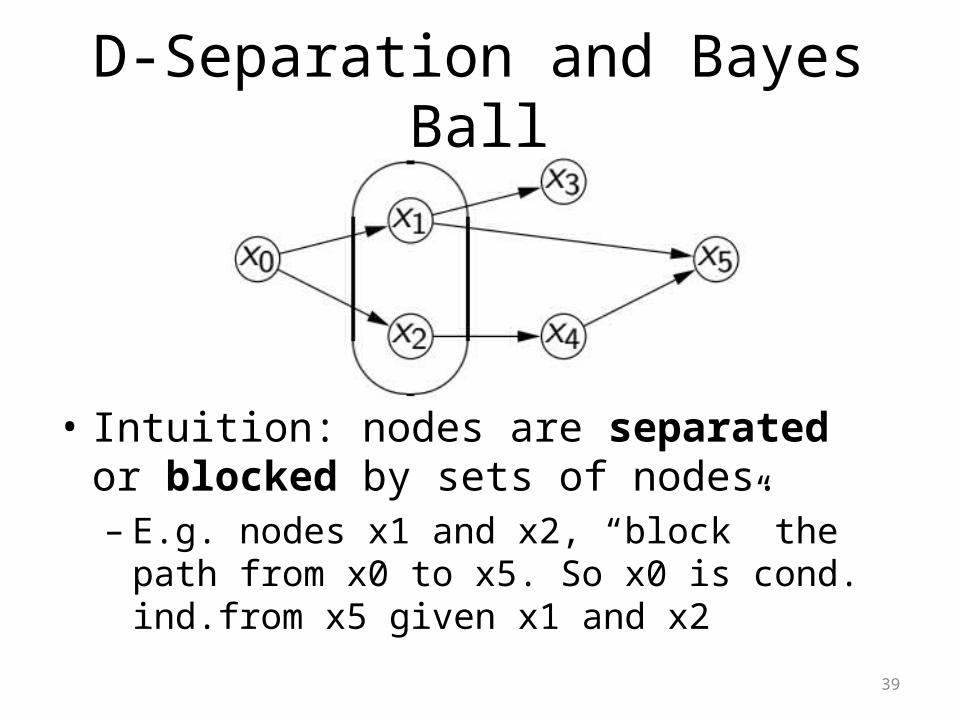
D-Separation and Bayes Ball
• Intuition: nodes are separated or blocked by sets of nodes.– E.g. nodes x1 and x2, “block” the path from x0
to x5. So x0 is cond. ind.from x5 given x1 and x2
39

Bayes Ball Algorithm
• Shade nodes xc
• Place a “ball” at each node in xa
• Bounce balls around the graph according to rules
• If no balls reach xb, then cond. ind.
40

Ten rules of Bayes Ball Theorem
41

Bayes Ball Example
42

Bayes Ball Example
43

Undirected Graphs
• What if we allow undirected graphs?• What do they correspond to?• Not Cause/Effect, or Trigger/Response,
but general dependence• Example: Image pixels, each pixel is a
bernouli– P(x11,…, x1M,…, xM1,…, xMM)– Bright pixels have bright neighbors
• No parents, just probabilities.• Grid models are called Markov
Random Fields
44

Undirected Graphs
• Undirected separability is easy.• To check conditional independence of A and
B given C, check the Graph reachability of A and B without going through nodes in C
45
DD
BB
CC
AA
Next Time
• Inference in Graphical Models– Belief Propagation– Junction Tree Algorithm
46