Embed Size (px)
Citation preview

M&aavaltabte under INAM sPes3eRTS DATA USER TYPE-1 PROGRESS REPORT FORin the interest of early and wide dis- JULY/AUGUST 1973semination of Earth Resources SurveyProgram information and without liaoilityfor any use made thereof."
Project Title/Objective: Relevance of ERTS to the State of Ohio
Proposal Number: MMC No. 87I r4O
Contract Number: NAS5-21782 e
BCL Subcontract Number: 72-17/G-1793 Z mo
Principal Investigator: Dr. David C. Sweet
I. DATA COLLECTIONP400ODo
ERTS-1 data received from NASA during this reporting period are a u
summarized in Table 1. In addition to the imagery described in the Table, = *
computer compatible tape data have also been received for most of these 0o5 4 OU
same scenes. Figure 1 illustrates the present status of usable repetitive
ERTS imagery of the various portions of Ohio. Some of the multispectral IC o $
color composites that have been requested for most of the useable ERTS scenes0 O
of Ohio have also been received. 0 -
U) 0 0No aircraft underflights of the Ohio ERTS study sites were flown =W Z
during this reporting period but a field radiometric and photographic ground NAF4 W-4:
truth survey of the Zeleski State Forest study site was conducted during 0
the ERTS-1 overpass of Ohio on July 30, 1973. V %ro a*
Orig~in photography may bM urchad fr-li0 Data Center a II. DATA ANALYSIS s
1I1 and Dakota Avenue
The major task performed during this reporting period focused on the
preparation of a paper titled "Application of Remote Sensing to Resource
Management at the State Level" which will be presented at the symposium on
management and utilization of remote sensing data at Sioux Falls, South Dakota
during October 29-November 2, 1973. A copy of this preprint has been attached
as an appendix to this report. This paper summarizes and pictorially displays
the usefulness of orbital survey data to contemporary resource management
problems faced by various departments and agencies of the State government
in Ohio.
https://ntrs.nasa.gov/search.jsp?R=19730022562 2018-06-05T10:27:33+00:00Z

2
TABLE 1. COVERAGE AND QUALITY OF ERTS-1 DATA OVER
OHIO RECEIVED DURING THIS REPORTING PERIOD
Date Time Quality Comments
TRACE 1
6/5/73 15361 NE Ohio and Western Lake Erie Good
6/5/73 15363 Eastern Ohio and Western Pa. Fair
6/5/73 15370 SE Ohio and West Virginia Fair
6/5/73 15372 SE Ohio, West Virginia & Ky. Fair
6/23/73 15360 NE Ohio and Western Lake Erie Fair
6/23/73 15365 SE Ohio and West Virginia Fair
7/29/73 15353 NE Ohio and Western Lake Erie Poor
7/29/73 15355 Eastern Ohio and Western Pa. Very Poor
7/29/73 15362 SE Ohio and West Virginia Very Poor
7/29/73 15364 SE Ohio, West Virginia & Ky. Poor
TRACE 2
5/1/73 15424 NE Ohio, Lake Erie and Canada Very Poor
5/1/73 15430 Eastern Ohio Very Poor5/1/73 15433 SE Ohio and Kentucky Very Poor
6/24/73 15414 NE Ohio, Lake Erie, and Canada Poor
6/24/73 15420 Columbus and Eastern Ohio Fair
6/24/73 15423 SE Ohio Good
6/24/73 15425 SE Ohio and Kentucky Fair
7/30/73 15411 NE Ohio, Lake Erie and Canada Poor
7/30/73 15414 Columbus and Eastern Ohio Fair7/30/73 15420 SE Ohio Good
7/30/73 15423 SE Ohio and Kentucky Fair
TRACE 3
5/20/73 15475 NW Ohio, Lake Erie and Michigan Fair
6/7/73 15474 NW Ohio and Lake Erie Excellent
6/7/73 15480 Columbus and Western Ohio Good
6/7/73 15483 SW Ohio, Indiana and Kentucky Good
6/25/73 15472 NW Ohio and Lake Erie Excellent
6/25/73 15475 Columbus and Western Ohio Excellent
6/25/73 15481 SW Ohio, Indiana and Kentucky Excellent

3
Table 1 Continued
TRACE 4
6/8/73 15532 NW Ohio, Michigan and Indiana Excellent6/8/73 15534 Western Ohio and Eastern Indiana Very Good6/8/73 15541 SW Ohio, Indiana and Kentucky Good
7/14/73 15525 NW Ohio, Michigan and Indiana Fair7/14/73 15532 Western Ohio and Eastern Indiana Fair
* Quality relates to general cloud cover condition over area covered
by satellite photography.

4
Trace 5 Trace 4 Trace 3 Trace 2 Trace 1
,,a 1/13/73
8/25/ 2 5/21/73 1/31/73 8/2 1/721/16/ '3 6/8/73 0 2/18/73 <'" 10/14/72
7/14/73 3/27/73 3/08/7LK 1/12/73
S l,, 1015/72
_4/138G 7 3. - - 2/17/73N 20 3 ARE6/5/73
5/26 /18/...... 176/23/73a a
ft ...... POT / wto21. 10/15/728
1w 2/18/731/3 COLMBAN/73 2
HADI 1(/14172
6MRO8/73 1/310/ 73/7/1/73
pr bL1A UNION 6/24/73 : / 5 7
t 6/5/73
6//3073
F7/0/7 1
Ph. 1. Status of Usable Re 4etitive ERTS Imaery for Ohio
AWa
tva2/14/7
5/-876/1/7
3/876/477/07
Fi.1 ttso sbeRpttv RSIaeyfrOi
5
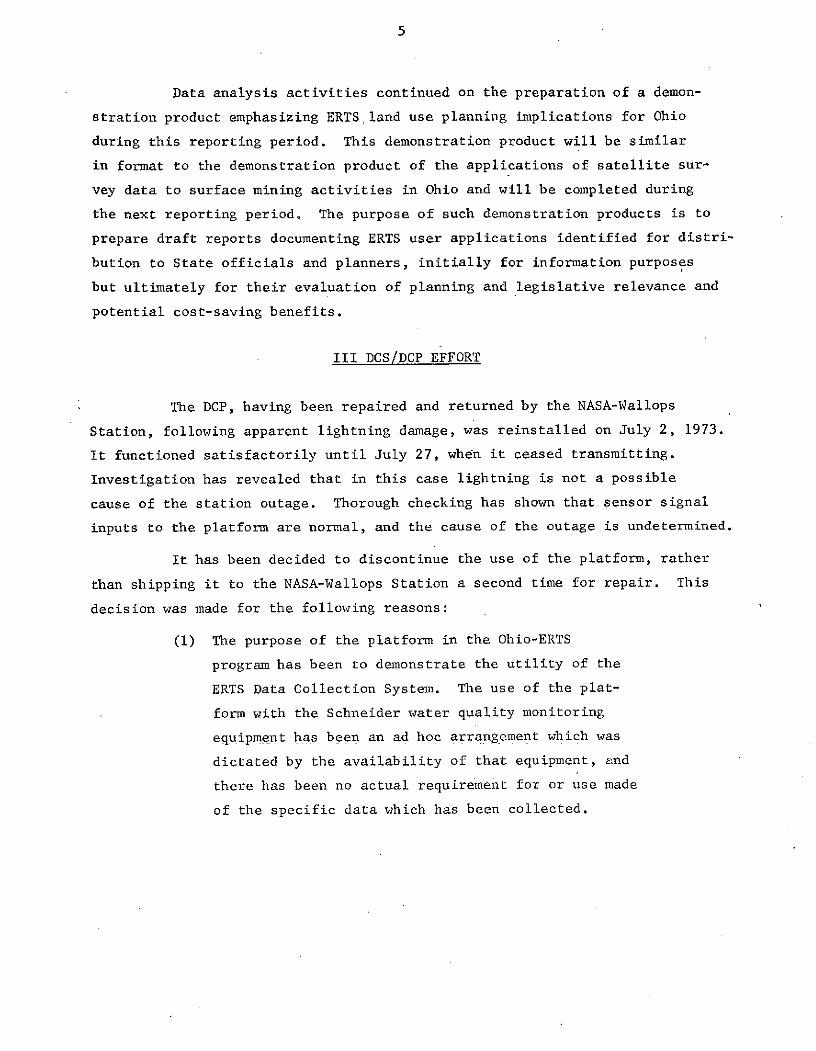
Data analysis activities continued on the preparation of a demon-
stration product emphasizing ERTS.land use planning implications for Ohio
during this reporting period. This demonstration product will be similar
in format to the demonstration product of the applications of satellite sur-
vey data to surface mining activities in Ohio and will be completed during
the next reporting period. The purpose of such demonstration products is to
prepare draft reports documenting ERTS user applications identified for distri-
bution to State officials and planners, initially for information purposes
but ultimately for their evaluation of planning and legislative relevance and
potential cost-saving benefits.
III DCS/DCP EFFORT
The DCP, having been repaired and returned by the NASA-Wallops
Station, following apparent lightning damage, was reinstalled on July 2, 1973.
It functioned satisfactorily until July 27, when it ceased transmitting.
Investigation has revealed that in this case lightning is not a possible
cause of the station outage. Thorough checking has shown that sensor signal
inputs to the platform are normal, and the cause of the outage is undetermined.
It has been decided to discontinue the use of the platform, rather
than shipping it to the NASA-Wallops Station a second time for repair. This
decision was made for the following reasons:
(1) The purpose of the platform in the Ohio-ERTS
program has been to demonstrate the utility of the
ERTS Data Collection System. The use of the plat-
form with the Schneider water quality monitoring
equipment has been an ad hoc arrangement which was
dictated by the availability of that equipment, and
there has been no actual requirement for or use made
of the specific data which has been collected.
6
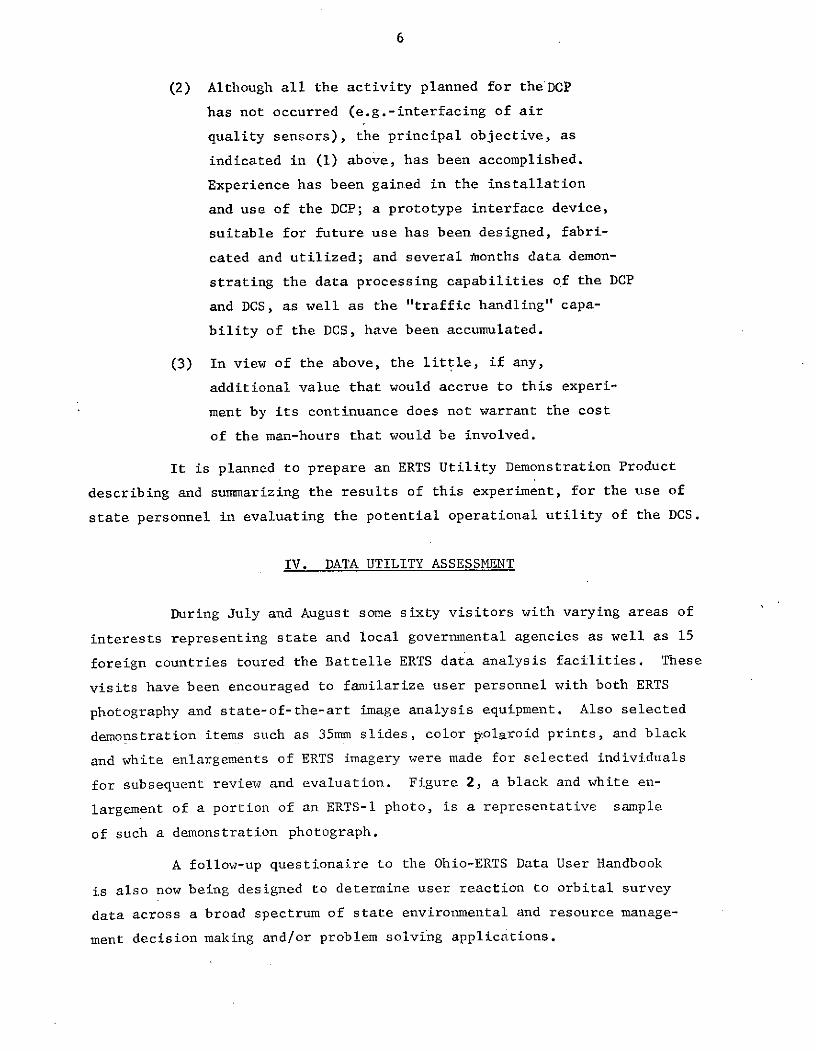
(2) Although all the activity planned for the'DCP
has not occurred (e.g.-interfacing of air
quality sensors), the principal objective, as
indicated in (1) above, has been accomplished.
Experience has been gained in the installation
and use of the DCP; a prototype interface device,
suitable for future use has been designed, fabri-
cated and utilized; and several months data demon-
strating the data processing capabilities of the DCP
and DCS, as well as the "traffic handling" capa-
bility of the DCS, have been accumulated.
(3) In view of the above, the little, if any,
additional value that would accrue to this experi-
ment by its continuance does not warrant the cost
of the man-hours that would be involved.
It is planned to prepare an ERTS Utility Demonstration Product
describing and summarizing the results of this experiment, for the use of
state personnel in evaluating the potential operational utility of the DCS.
IV. DATA UTILITY ASSESSMENT
During July and August some sixty visitors with varying areas of
interests representing state and local governmental agencies as well as 15
foreign countries toured the Battelle ERTS data analysis facilities. These
visits have been encouraged to familarize user personnel with both ERTS
photography and state-of-the-art image analysis equipment. Also selected
demonstration items such as 35mm slides, color p:olaroid prints, and black
and white enlargements of ERTS imagery were made for selected individuals
for subsequent review and evaluation. Figure 2, a black and white en-
largement of a portion of an ERTS-1 photo, is a representative sample
of such a demonstration photograph.
A follow-up questionaire to the Ohio-ERTS Data User Handbook
is also now being designed to determine user reaction to orbital survey
data across a broad spectrum of state environmental and resource manage-
ment decision making and/or problem solving applications.

Figure 2. Typical Ohio-ERTS Demonstration Photo
Showing an enlarged portion of an ERTS-1MSS Band 5 (6,000-7,000 2) photo of 21
August 72 Washington County, Ohio and
surrounding areas.
A

8
V. SIGNIFICANT RESULTS
A significant result during this report period was the fabrication
of an image transfer and comparison device. During any analysis task a major
concern is the abiliLy to extract qualitative and quantative information from
ERTS imagery with a given time frame. Another major concern, however, is
the ability to transfer the enlarged, enhanced, filtered, overlayed, color
encoded, etc., imagery or portion thereof to a map, overlay, report,
viewgraph, etc.
To avoid problems and high costs encountered in manual drafting
methods, Battelle staff members have fabricated an inexpensive, yet effective,
technique for transferring ERTS analysis displays from the Spatial Data
32-Color Viewer to maps and/or aircraft imagery (see Figure 3). In brief,
the image transfer-comparison device consists of a 2-way mirror which
functions similar to a zoom transfer scope. However, the device permits
multiuser viewing and real-time photographic recording (35-mm and Polaroid)
of enhanced ERTS imagery superimposed over maps and aircraft photography.
Thirty-five mm, 70 mm, and 4" x 5" photographs are taken of 80
percent of the TV screen of the Spatial Data Density Slicing Viewer. The
resulting black and white and color imagery is then used in transparent
overlays, viewgraphs, 35-mm and 70-mm transparencies, and paper prints for
reports and publications. Annotations can be added on the TV screen or
on the finished product.
VI. MISCELLANEOUS
The Ohio ERTS program was featured in a full page article of the
August 20, 1973 edition of the Cleveland Plain Dealer. Also an exhibit
shown in Figure 4 describing the Ohio-ERTS imagery was prepared and displayed
at the Ohio State Fair (August 23 - September 3, 1973) by the Ohio Department
of Transportation.

set Im SLqtI t I II
FIGURE 3. ERTS IMAGE TRANSFER AND COMPARISON DEVICE
FIGURE 4. OHIO-ERTS PROGRAM DISPLAY AT THE OHIO STATE FAIR

10
State and Battelle personnel have participated with NASA Lewis offi-
cials in formulating a presentation of the Ohio-ERTS program for later pre-
sentation to the Governor. 35-mm slides of Ohio orbital survey data, data
acquisition and analysis equipment, and orbital survey demonstration products
were given to NASA Lewis officials for their presentation.
The State of Ohio currently has requested several 40" x 40" color
composites of Ohio so that a mosaic of the entire state can be composed for
planning purposes.
During this reporting period, Battelle staff members have also
assisted members of the Ohio Biological Survey in their Scioto River Valley
land use study. Work also continued on a joint Ohio State University, Ohio
Environmental Protection Agency and Battelle Lake Erie study proposal to be
presented to the Federal Environmental Protection Agency.

APPENDIK

APPLICATIONS OF REMOTE SENSING TORESOURCE MANAGEMENT AT THE STATE LEVEL
by
D. C. Sweet ( 1 ) , C. J. Meier(2)
T. L. Wells( 2), G. B. Garrett(3 ), L. Herd(4)State Government of Ohio
and
G. E. Wukelic, J. G. Stephan, and H. E. SmailBattelle Columbus Laboratories
ABSTRACT
Techniques utilized and progress made toward applyingorbital survey data (ERTS/Skylab) to (1) planning and enforcingrecently passed strip-mine legislation in Ohio; (2) preparinginputs useful for multiagency and multilevel (state, regional,local) land-use decision making; and (3) real-time problem-solving activities throughout various Ohio governmentalagencies in general are summarized. State-level applicationcandidates found inappropriate based on analysis of availableimagery scales and suggestions for other uses of remotely-sensed data from higher resolution spacecraft or low-altitudeaircraft are noted. And finally, general conclusions regard-ing current user views as to the opportunities and limitationsof operationally using remotely-sensed data at the state levelare provided.
INTRODUCTION
The purpose of NASA's ERTS and Skylab/EREP programs is to assess remote
sensing from a satellite as a technique for inventorying, monitoring, and
eventually managing the earth's resources. The tremendous success of these programs
(1) Department of Economic and Community Development(2) Department of Natural Resources(3) Ohio Environmental Protection Agency(4) Department of Transportation
Preprint for Symposium on Management and Utilization of RemoteSensing Data, American Society of Photogrammetry, Sioux Falls,South Dakota, October 29-November 2, 1973.

2
to date in generating unique data on natural and cultural resources the world over
is well known. However, how much and how soon the public benefits from this space
capability depends upon how effectively this new data resource can be absorbed
into the mainstream of all government, public, and private planning and decision
making functions bearing on the utilization and management of earth resources.
The purpose of this presentation is to summarize progress and limitations
encountered in using satellite data for resource management in a state such as Ohio
having highly diversified industry, agriculture, and geography as well as limited
remote sensing experience and capabilities.
Ohio, with NASA funding assistance, is making a comprehensive, multidis-
ciplined assessment of the state-level utility of ERTS and Skylab data. Major par-
ticipating organizations are:
* Department of Economic and Community Development (DECD, Lead Agency)
* Department of Natural Resources (DNR)
* Ohio Environmental Protection Agency (OEPA)
* Department of Transportation (DOT)
* Public Works
* Battelle Columbus Laboratories (BCL)
Figure 1 shows a portion of the Remote Sensing Applications Laboratory
at Battelle which is used in concert with state researchers and planners for the
routine analysis of incoming ERTS and Skylab/EREP data. Major equipment in this
facility as well as that located at state agencies used in the collection and
analysis of remotely-sensed data are listed in Table I.
APPLICATION ANALYSES
The usefulness of orbital data, principally ERTS MSS images, in Ohio
has been limited thus far to experimental demonstrations of application possibili-
ties. Major satellite data application areas under examination in Ohio are listed
in Table II. The table notes the importance of the state need, as well as the potential
state operational usefulness. The applications range in scope from a single

TABLE I. DATA ACQUISITION AND DATA ANALYSIS EQUIPMENTCURRENTLY BEING USED ON THE OHIO-ORBITALSURVEY PROGRAMS
BATTELLE
32-Color Spatial Qualitative & quantitative eval-Viewer Data uation of ERTS imagery by con-
Systems, Inc. verting densities to desiredcolor
Multispectral Spectral Overlay of up to 4 ERTS images toViewer Model 20 Data Corp. produce color composites and to
enhanc6 specific image features
Multiple Inter- Richards Corp. Viewing, comparison, magnificationpretation Module and mensuration of ERTS and air-
(MIM) craft imagery
Spectral Radiometer ISCO Collecting ground-truth radio-& Recorder metric "spectral signatures"
70-mm Multispectral Hasselblad 4-camera array used for acquiringCameras aerial multispectral data
K-17 & K-24 Aerial Fairchild Acquire aerial underflight dataCameras
DNR
K-17 Aerial Camera Cessna Acquire aerial underflight data
OEPA
Ohio National Guard -- Available upon request to monitorHelicopter areas of environmental concern
Grant request submitted --for purchase & oper-ation of -remo-te-sensing aircraft
DOT
Nistri-Analytical Nistri-Bendix Mapping & plotting from ERTS &Stereoplotter aircraft photography
K&E Grid Digitizer K&E Mapping & plotting from ERTS oraircraft photography
Twin-Engine Plane Beechcraft Acquiring aerial photography
6" Zeiss RMK-A Zeiss Acquiring aerial photography
4
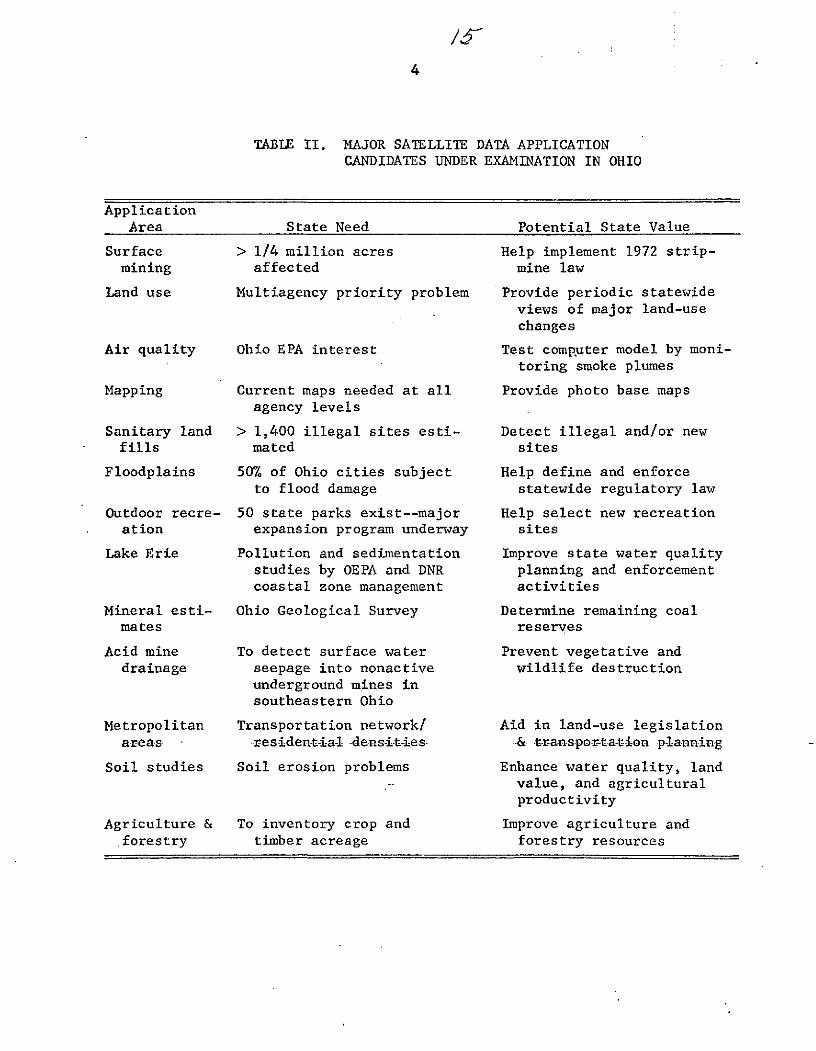
TABLE II. MAJOR SATELLITE DATA APPLICATIONCANDIDATES UNDER EXAMINATION IN OHIO
ApplicationArea State Need Potential State Value
Surface > 1/4 million acres Help implement 1972 strip-mining affected mine law
Land use Multiagency priority problem Provide periodic statewide
views of major land-use
changes
Air quality Ohio EPA interest Test computer model by moni-toring smoke plumes
Mapping Current maps needed at all Provide photo base maps
agency levels
Sanitary land > 1,400 illegal sites esti- Detect illegal and/or newfills mated sites
Floodplains 50% of Ohio cities subject Help define and enforce
to flood damage statewide regulatory law
Outdoor recre- 50 state parks exist--major Help select new recreationation expansion program underway sites
Lake Erie Pollution and sedimentation Improve state water qualitystudies by OEPA and DNR planning and enforcementcoastal zone management activities
Mineral esti- Ohio Geological Survey Determine remaining coalmates reserves
Acid mine To detect surface water Prevent vegetative anddrainage seepage into nonactive wildlife destruction
underground mines insoutheastern Ohio
Metropolitan Transportation network/ Aid in land-use legislationareas r res-i-dent-ia-l dens-it-ies- -&- t-ransportation p-lanning
Soil studies Soil erosion problems Enhance water quality, landvalue, and agriculturalproductivity
Agriculture & To inventory crop and Improve agriculture andforestry timber acreage forestry resources

5
Fig. 1. View of data analysis equipment used by Battelle andState of Ohio personnel to analyze satellite earthresources data on Ohio.
department's interest in soil erosion in a highly localized area to multidepart-
mental interests in statewide land-use trends. In this presentation, the analytical
efforts employed and results obtained in evaluating the usefulness of satellite
data to Ohio surface mining and land-use interests will be described in detail.
Status of studies of other application candidates and the results of several real-
time, problem-solving exercises will be only briefly noted.
Surface Mining
State Need
Surface mining in Ohio is a major industry requiring more and more state
attention. Foremost among current state efforts relate to legislative improvements
in surface-mining controls. For example, in April, 1972, Ohio enacted a more
rigid strip-mine law containing provisions for:

/76
* Determining and holding reclamation bonds
* Establishing and enforcing reclamation requirements
* Monitoring the status of the strip-mining activity andassessing environmental degradation.
To effectively enforce this law the state must have the
capability and resources to:
* Inventory past strip-mine activity, both reclaimed andunreclaimed
* Inventory current strip-mine activity
* Determine condition of unreclaimed land and type of reclama-tion practice required to restore it
* Verify data and reclamation plans contained in strip-mining permit applications.
Thus, the emergence of ERTS was quite timely if data could be used to
inventory, monitor, and assess stripping and reclamation activities.
Application Results
Utilizing the equipment at the Battelle Remote Sensing Applications
Laboratory we have looked at ERTS MSS imagery, aircraft photos, and on-site radio-
metric (spectral) signatures of the same strip-mined areas. Conclusions thus far
are that ERTS MSS imagery can indeed be utilized to inventory (within the inherent
accuracy limitations of scale) the extent of strip mining in Ohio. Assessment of
the condition of the stripped terrain is problematical but can be done
effectively. Mon-i-toring the actual activity of strip mining can be done
provided a sufficient time has elapsed, and appropriate imagery (cloud cover per-
mitting) is obtained. Obviously aircraft aerial photos can provide greater pre-
cision of measurement and interpretation, but at a far greater cost in both
collection and analyzation of the information.
Figure 2 shows a typical ERTS-1 scene of southeastern Ohio (Band 5) with
strip-mined areas clearly discernible even at the 1:1,000,000 scale. Figure 3
compares enlargements of this strip-mine area for Bands 5 (visible) and 7 (near
infrared) showing the capacity of Band 7 to detect standing bodies of water.

7
,4081-380i W081 -001 080-30w 0808-00I
4
SI
I- IP ." ;7
NS4
N
9
3
a KIT
0r
N a ti~?~;=l'~ -- .
a
92
I1,4082-00 I.481 -381 I4681 -801 N08 30 - 09-1 1 5021RUG72 C N39-25/W880-86 N N39-23'W88O8-53 MSS 5 D SUN EL53 RZ138 191-8"03-N-I-N-n ?L jc ,,- c - 8
. .. . -- I II IW
Fig. 2. Typical ERTS-1 (Band 5) scene of southeastern Ohio showing how pronounced
strip-mining areas appear.
r 1,( t 1!2 or w ,
v 1W
2R';
-AA
' p~ CEiINM~~m
NtF
3 49 _W;?~~tj -
sr=';t~xa' K,~uY3f r
eJI ~jr~iAlWA.F I ii ~~~",A)
~k~r r- s ~ (W
ki 7~~C,"
'Oki ~ i~
.r.~g r I4
35 ibit4-,v Llw
I W82 0 08 31 W8 - 0 N08-01 C21A 72 N3-2/WM 00 N9-2/W00-3 MS 5 D UN LS3A210 91-403N--N--?L02-1561- 0
Fi. . ypca ETS1 Bad ) cee f ouhestrnOho hoin hw rooucestipmiin aea aper

/98
9 ~1 ~-I~ 14" k I; -tU:r 1~ i- ,.j~ J:
r N P"" ::~i~l *~( ~jICI. ~f ~
,1.'g ":(1
~* ' 1: I, - ;14i-,~~" ;L;. ' rli c .~ZTi~-: :~ ?: ~ I_:i. R;----~
t ,,'i bd-p~:' .;~i i-i .::r-
r Ir : t,
'; .... i, c~ ., i.~J~~ : t;
., x :1 . ,,;rl. =~.lz~5~S~i: ~~B~n~
~i~t~q r_: ~d~z.
? r ~;~"C""; ~ a~5~
~F~ ~-1 41 I~r fsr i, a :-rZ .; "'i". :~ '5 -ir r
*Z 1 ~~~3t~; li
1 ;-?h~: .I-i ,-$:- -!~~1$1
;~i ;_ t I!i rs 'C !:*~u I,
:i"i ;" s~ ;: -a
.-,- ~,C1 " : '
.- x--t
; rr"$ii!~~ i -r I;s
i, II~L Xr" ~" "-
ic" ~:: *- .I d:
Fig. 3. Comparison of strip-mine areas as seen on ERTS-1 Band 5(left) and Band 7.

9
By comparing aerial underflight panchromatic photography of strip-mining
areas at a scale of 1:24,000 with ERTS imagery blown up to the same scale it was
found that the examination of ERTS Bands 5 and 7 in some instances yields more in-
formation than the comparative aircraft photography. This was the case for at
least two features: water and residual vegetation in the strip-mine area. The
image density slicing viewer can discern 25-30 density differences in a single
strip-mine area which may eventually be relatable to spoil bank materials, high
walls, and other features appearing in a typical Ohio strip mine (see Figures 4a-c).
Since a strip-mine area is obvious by the removal of the so-called
overburden or original vegetation, the restoration of such an area can be monitored
by the increased recovering of such base areas. Older strip-mine areas under
reclamation are best discerned on ERTS Band 7. They distinguish themselves by a
less dense vegetation cover than the surrounding areas covered by original vegeta-
tion and by a large number of small ponds and lakes. Strip-mine areas 30 years old
and older have been observed. Analyses of areas under reclamation are made by
comparing the area under reclamation with newly strip-mined land (0 percent
reclamation) and original vegetation (100 percent). Degrees of reclamation are
then made as 0-25 percent, 25-50 percent, 50-75 percent, and 75-100 percent.
Using the built-in electronic planimeter capability of the Spatial Data
Image Density Slicing Viewer, and standard planimetric techniques, an effort was
undertaken to demonstrate that (1) the unreclaimed strip-mine areas could be en-
hanced to the exclusion of any other terrain 'feature using ERTS imagery, and
(2) that an accurate area calculation was possible in a relatively short period of
time. A test survey of areas strip mined and areas reclaimed was made of Harrison
County in eastern Ohio using Band 5 of an ERTS-1 image. The resulting area cal-
culation achieved in this survey corresponds quite favorably to Department of
Natural Resources data as shown in Table III. Total time to complete this one
county survey using ERTS-1 imagery was less than a day.
We are currently looking at the feasibility of extending the demonstrated
capability of ERTS to detect and inventory strip mining to other surface-mining
operations in Ohio. Figure 5 shows how surface radiometric signatures of typical
gravel pits, limestone quarries, and strip mines in Ohio differ from one another.
Hopefully, these differences are adequate to permit differentiation of surface-
mining type on satellite imagery.

10
w-U
Fig. 4a. 1:24,000 USGS topographicmap sheet (reduced by 1/2
original format) showing "typical active Ohio strip-mine area.
Fig. 4b. 1:24,000 aircraft photo ofthe same strip-mine area.Photos such as these wereused to demonstrate thatERTS imagery has sufficientimage quality and areafidelity to perform strip-mine inventories (photo byNASA Lewis Research Center).
Fig. 4c. Electronically magnified andenhanced ERTS-1 MSS Band 5image of the same area. Notesimilarity to aircraft photoabove.

TABLE III
COMPARISON OF STRIP-MINE AREA ESTIMATES
FOR HARRISON COUNTY, OHIO
Total Land Area -- 258,000 Acres
ODNR ERTS-1
% of strip-mined 19.01 18.4
land
Area affected 49,064 acres 47,472 acres
% of unreclaimed 6.8 6.2
strip-mined land
Area unreclaimed 17,603 acres 15,996 acres
SLimestone
Strj, Mine
5 J . .5 .6 .7 . 8 9 1.0 . 1 13 1.4 1.51.55Wavelength, Microns
Fig. 5. Comparison of relative reflectance curves of limestone quarry,gravel pit, and strip mine operations in Ohio. These data indicatedefinite differences in the reflectance characteristics of thevisible portion of the electromagnetic spectrum. Such data arenecessary for distinguishing types of surface-mine operations inOhio using ERTS data.

12
Land Use
State Need
Ohio, like every other state, faces increasing multiagency requirements
for the preparation of a relatively inexpensive and periodic revision of a statewide
inventory of the land and natural resources for general planning, land-use decision
making, and legislative purposes.
Ohio has previously constructed a map at the scale of 1:250,000 for the
entire state at a cost of somewhat over $250,000. ERTS photography provides an
opportunity to update statewide land-use mapping at a significantly lesser cost
and would represent an improvement in terms of the completion time. ERTS photog-
raphy required to map the entire state has become available in less than a year.
In the 1960 land-use study, aerial photography over a period from 1958 to 1964 was
generalized. Of course, aerial photography for the entire state could have been
flown during a shorter time span but this would have been much more costly than
making maximum use of available photography.
This is not to say that there aren't some critical trade-offs involved.
For example, the 1960 study was done at a scale of 1:24,000 and then combined and
generalized to arrive at the 1:250,000 and 1:500,000 maps. Thus, detailed land-
use work sheets were available as back-ups and for use by planners requiring de-
tailed information. Using the ERTS photography this won't be possible except for
cases wherein detailed land-use maps were made for selected areas of the state.
Also, the possibility exists that future operational survey satellites may have
the capability to obtain higher resolution photography for selected "high interest"
development areas on a less frequent basis, e.g., once or twice a year coincident
with low cloud cover conditions.
Application Results
A preliminary evaluation indicates that available orbital survey data are
adequate for mapping State of Ohio land uses at least for scales of 1:250,000 and
1:500,000. These mapping scales will be useful to the state in overall long-range,

13
land-use planning and in meeting the requirements of the pending National Land-
Use Policy Act. These preliminary utility assessments already completed confirm
that such mapping projects are feasible and have established the techniques re-
quired to prepare the land-use products.
Since it was not the intent of the program to develop a classification
scheme, a prominent scheme developed and used by the U. S. Geological Survey was
adopted. An outline of this classification scheme is shown in Table IV, and the
level to which each major classification has been evaluated thus far for Ohio-ERTS
land-use interests is shown on the right side of the table. The feasibility of
updating Ohio's 1967 land-use map is demonstrated in the series of enlarged and
color enhanced ERTS-1 and Skylab/EREP photographs of the Columbus and Cleveland,
Ohio, metropolitan areas shown in Figures 6-11.
Other Activities
In addition to the above major application evaluation activities, several
real-time, problem-solving experiences in which ERTS data utility was examined can
be cited:
(1) The capability of ERTS to detect areas mined many years ago hasbeen used by the Ohio Geological Survey to determine how muchof certain coal seams remain to be mined. In this study, ratherthan a time-consuming search of old permit records, ERTS photog-raphy was used to determine if certain suspected areas had beenstrip mined many years ago.
(2) Ohio EPA researchers are seriously interested in using satellitephotography for Lake Erie water quality management practices.Figures 12 and 13 show the ability of ERTS to provide an over-view of Lake Erie pollution and sedimentation plumes heretoforeunavailable. From a preliminary analysis of repetitive scenes,OEPA personnel are optimistic that ERTS data may significantlyimprove understanding of the dynamic characteristics of Lake Erieand make more accurate modeling possible. In addition to a betterdefinition of nearshore and offshore developments, OEPA personnelare interested in evaluating such specific correlations as:littoral drift/lake dispersions, algae masses, temperature phe-nomena, water level (for coastal zone management, also an interestof the Department of Natural Resources), and wave refraction.

14
TABLE IV. USGS LAND-USE CLASSIFICATION SYSTEM FORUSE WITH REMOTE SENSOR DATA*
ERTS, AnalysisStatus
(Includes Levels 1 & 2)Level I Level II01. Urban and Built-up Land
01. Residential TBD**02. Commercial and Services TBD03. Industrial TBD04. Extractive Yes05. Transportation, Communica- Yes
tions, and Utilities06. Institutional TBD07. Strip and Clustered Yes
Settlement08. Mixed Yes09. Open and Other Yes
02. Agricultural Land01. Cropland and Pasture Yes'02. Orchards, Groves, Bush TBD
Fruits, Vineyards, andHorticultural Areas
03. Feeding Operations TBD04. Other TBD
03. Rangeland01. Grass N/A***02. Savannas (Palmetto Prairies) N/A03. Chaparral N/A04. Desert Shrub N/A
04. Forest Land01. Deciduous TBD02. Evergreen (Coniferous and TBD
Other)03. Mixed Yes
05. Water01. Streams and Waterways Yes02. Lakes Yes03. Reservoirs Yes04. Bays and Estuaries Yes
06. Nonforested Wetland 05. Other (Ice and Snow) Yes
01. Vegetated Yes02. Bare Yes
07. Barren Land01. Salt Flats N/A02. Beaches TBD03. Sand Other Than Beaches TBD04. Bare Exposed Rock TBD
08. Tundra 05. Other TBD
09. Permanent Snow and 01. Tundra N/A
Icefields01. Permanent Snow and Icefields N/A
* "A Land-Use Classification System for Use With Remote Sensor Data",J. R. Anderson, E. E. Hardy, & J. T. Roach, Geological Survey Circular,671, Washington, D. C., 1972.
** TD = To be determined by future analysis.***N/A = Classification not applicable to Ohio.

15
1N-1
Fig. 6. Magnified and color enhanced portion of an ERTS-1
MSS Band 5 photograph of 15 October 72 showing
recently urbanized areas superimposed on aFranklin County, Ohio, highway map (scale,1 inch = 2 miles).

16
Fig. 7. Magnified and color enhanced Lportion of an ERTS-1 MSS Band 5 _. -
photograph of 15 October 72 k'superimposed on a 1:48,000 air-craft index photo sheet of17 April 72. This picture high-lights the recently urbanized -
-
areas of northeastern Columbus,Ohio.
Fig. 8. Magnified and color enhancedportion of an ERTS-1 MSS Band 5photograph of 15 October 72superimposed on a 1964 1:24,000USGS topographic map sheet ofnortheastern Columbus, Ohio.As in Fig. 7 recently urbanizedareas of northeastern Columbus,Ohio, are highlighted.
* (
I "c4Jr

17
Fig. 9a. Total urbanized areas of the 14,Cleveland, Ohio, area areaccentuated in this magnifiedand color enhanced portion of "a Skylab 190A photo taken12 June 73.
A
Fig. 9b. The same color enhanced por- - '
tion of the Skylab image4 --superimposed upon a CuyahogaCounty highway map (scale,1 inch = 2 miles).
Az ' E4': 7
4Mb ~ g tI - i~-t
Fig,~~~~~~~ ~~~~ -b h aeclrehne o-i -i:i~i;
-

18
-4-
4
'to.,
Area I Area 2
Fig. 10. Enlargements of Skylab 190Aimagery of Cleveland, Ohio(12 June 73), illustrating theSextent that urbanized featuresare discernible. Note, forexample, bridges, airports,and transportation networks aswell as the median strip visi-
J ble between the lanes of 1-271.
Area 3

,I"4
/,./ I ' 9
, Henhohet
L AKE \ -- i.r . .", , :i. -n, 'i:m,~ . :M
OX
642~ Mi;~_ Gi
1751IIj J.:
. . 4 9 ,,\ I ;' .. .: ' ,! '~~M o'y feld , ." .
- " "* ' _ A R.. . Hea"ht' j Fau d r, "., . -.-.
-4 " " "
"1 LE NDI 4 e"
".- i i. .t. ; " ,.. I '
-"=-- .:~: .j--'
I:' II
-- ,..r" .q."!....n'
** ~ ~ ~ ~ ~ ~ r IN;-e ,: .~t I
ARE-A- IAR~II~ _
0A 7~l 4 ~eeb 1 ~\ a~
- .. I ,oc-o°-o '., .>oPO0rYmo tZ .jt,.
oNoIrl5 , _._.I_ 4-. ...,
i- N Hd1: s Ul!.k A -5v hI1
* K sc , , , oLF . M ,.A s --
Nd! i i -; ,io.,1.'i°, ch .~
7 D~o!
6 2E D I N A C O U N T Y S U MO NMI T-
-7s
ig. 11. Crpd map o areas shw i i 10.
ro i Tinbug
Roya 4 i
42 i::swi 1, 176i ::Br 94 00
Fig. 11. Corrsponding mapof areas shon in Fig. 10

20
Ile,,
iit
Fig. 12. ERTS-I photo taken 27 March 73 showing sedimentation patternsin western Lake Erie (Band 5, 6,000-7,000 A). Note that theSandusky Bay land areas appear partially inundated (see Fig. 13for comparison).
r7
tN.
Fig. 13. ERTS-1 photo taken 14 April 73 showing sedimentation patternsin western Lake Erie. Also note that water in Sandusky Bayarea has receded (see Fig. 12 for comparison).

21
Realizing that these areas cannot be treated in great depth under
the present ERTS program, the Ohio EPA is working jointly withThe Ohio State University and Battelle's Columbus Laboratoriesto design a program for Federal EPA support for greater data
collection and satellite imagery analysis of Lake Erie.
(3) OEPA personnel have made a preliminary assessment of the ability ofERTS imagery to provide an inventory of sanitary land fills (many
illegal) throughout the state. The resolution of current ERTS
imagery was found inadequate for this application.
(4) Since major smoke plumes are discernible in ERTS imagery, the Ohio
EPA plans to use ERTS data on the location, movement, and confluence
of smoke plumes to test computer air motion models being developedfor use in statewide air pollution control practices.
(5) Enlargements of ERTS data have been made available to the Ohio
Biological Survey to support their concentrated study of the SciotoRiver basin.
(6) Department of Natural Resources has also begun studies on theseepage of surface water into old underground mines in southeastern
Ohio and the resulting acid mine water pollution. ERTS imagery has
been used to detect possible wet areas in which surface water is
prominent by vegetative patterns and vegetation differences whichmay be due to adverse affects of such pollution.
(7) Department of Natural Resources used ERTS imagery in their study of
soil erosion problems in Meigs County, Ohio.
(8) Department of Natural Resources is interested in determining to
what extent ERTS data could be used to detect new developments en-croaching upon the floodplain and from this the extent to whichthe repetitive nature of orbital survey data could be used to
monitor the floodplains. Results will be important to the ability
to enforce statewide floodplain regulations under legislativeconsideration in Ohio.
(9) The Department of Transportation is looking at satellite data fromboth transportation planning and support to other agencies from the
viewpoint of base maps. The Department has prepared photo mosaicsof the entire state at a scale of 1:250,000 for general planning
purposes. They hope to eventually use such up-to-date ERTS basemaps for general land and soil studies, land development plans,tax information, geological/construction implications, noting theavailability of existing surveys, and as an aid to determine up-dating requirements for USGS topographic map series.
(10) The Ohio State University is cooperating with state governmentagencies and BCL in pursuing the educational implications of remotesensing applications. Specialized workshops, interdepartmentalseminars, and courses in remote sensing have been organized inwhich satellite/aircraft data on Ohio have or are being analyzed.

22
SUMMARY
Although progress to date has been significant and swift, the appli-
cation of remotely-sensed data and particularly satellite data has only just begun
in Ohio state government. The development and operational employment of specific
techniques and applications for state government is very difficult, time consuming,
and most important, quite expensive. Ohio for one simply cannot afford to develop
this technology on its own.
These meetings are a great help in exchanging ideas, techniques, and
findings. The major problem is user acceptance! Another problem is insertion into
the main stream of decision-making activity. State government is doing its job,
perhaps not as effectively as we would like, but it is doing the job. Thus, the
general philosophy among many state officials is "Why should we bother with this
stuff?", or "Can you show how it will help me do my job?", and these are indeed
valid questions to which we must effectively respond. The days of ill-defined
practices and equipment developed at great expense are giving way to austere but
effective management and utilization of data. Collection technology is far ahead
of utilization (data reduction) technology as is evidenced by the vast amount of
imagery that has never been utilized even superficially.
Accordingly, we must try to arrange for increased budgeting at all levelsof government to accelerate the application and utilization of existing and anti-
cipated remote-sensing data. To create a large; state-user demand for remote-
sensing products and services requires that application efforts in the near future
be as simple and as specific as possible.