Embed Size (px)
Citation preview
Chapter 5The Lure of Statistics:
Data Mining Using Familiar Tools
2
Why a Manager (or you) Needs to Know Some Basics about Statistics
• To know how to properly present
information
• To know how to draw conclusions about
populations based on sample information
• To know how to improve processes
• To know how to obtain reliable forecasts

3
Statistics vs Data Mining
• For statisticians, data mining has a negative connotation – one of searching for data to support preconceived ideas
• Statistics don’t lie but liars use statistics!
• Statistics developed as a discipline to help scientists make sense of observations and experiments, hence the scientific method
• Problem has often been too little data for statisticians
• DM is faced with too much data
• Many of the techniques & algorithms used are shared by both statisticians and data miners

4
Some Definitions
• Population (universe) is the collection of
things under consideration
• Sample is a portion of the population
selected for analysis
• Statistic is a summary measure computed
to describe a characteristic of the sample
5
Some Definitions*
• Mean (average) is the sum of the values divided by the
number of values
• Median is the midpoint of the values (50% above; 50%
below) after they have been ordered from the smallest to
the largest, or the largest to the smallest
• Mode is the value among all the values observed that
appears most frequently
• Range is the difference between the smallest and
largest observation in the sample
* laymen’s
6
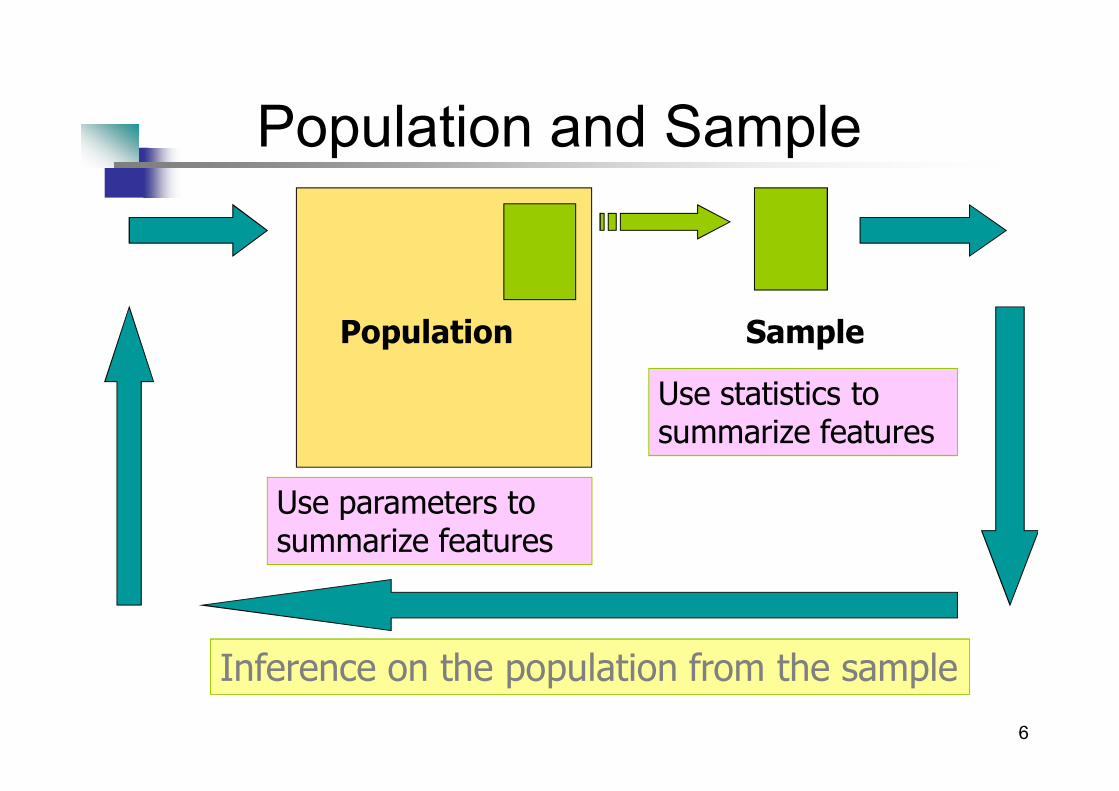
Population and Sample
Population Sample
Use parameters to summarize features
Use statistics to summarize features
Inference on the population from the sample
7
Occam’s Razor – “Kiss”
• William of Occam, Franciscan monk, 1280-1349 – prior to modern statistics, the Renaissance and the printing press.
• Influential philosopher, theologian, professor with a very simple idea:
– Latin: Entia non sunt multiplicanda sine necessitate
– English: The simpler explanation is the preferable one or “Keep it simple, stupid!”
8
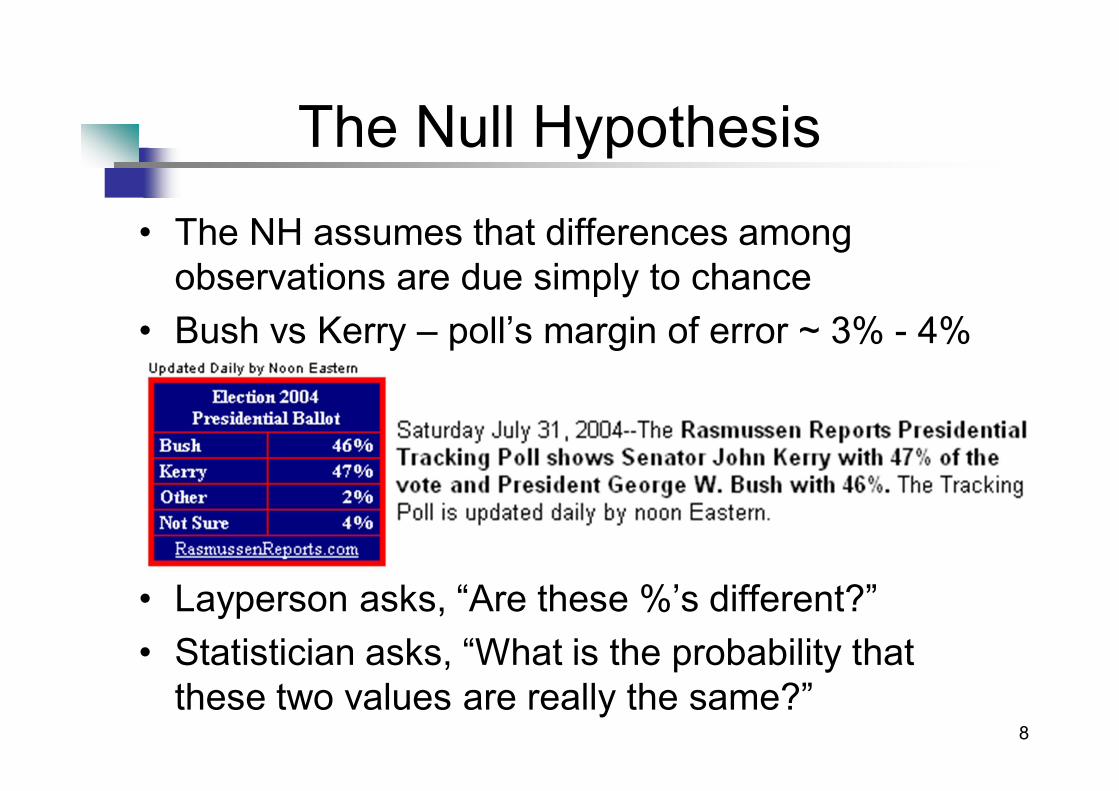
The Null Hypothesis
• The NH assumes that differences among observations are due simply to chance
• Bush vs Kerry – poll’s margin of error ~ 3% - 4%
• Layperson asks, “Are these %’s different?”
• Statistician asks, “What is the probability that these two values are really the same?”
9
Skepticism
• Is good for both statisticians and DMiners
• Goal for both is to demonstrate results that work, hence discounting the null hypothesis
• The less reliance on chance, the better
10
P-Values and Q-Values
• The null hypothesis can be quantified
• The p-value is the probability that the null hypothesis is true
• When the null hypothesis is true, nothing is really happening; differences are due to chance
• Confidence, the reverse of a p-value, is called the q-value. p-value = 5% then the q-value (confidence) is 95%.
• Example: Bush/Kerry…p-value 60% or 5%
11
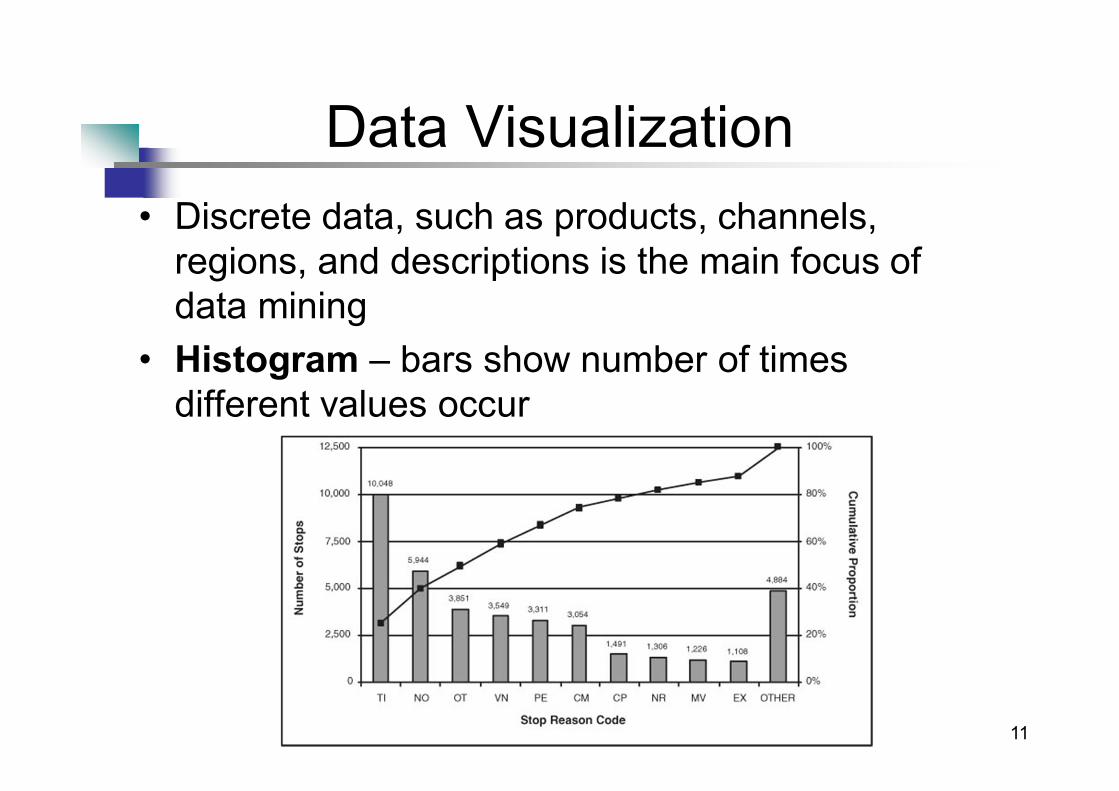
Data Visualization
• Discrete data, such as products, channels, regions, and descriptions is the main focus of data mining
• Histogram – bars show number of times different values occur
12
Data Visualization
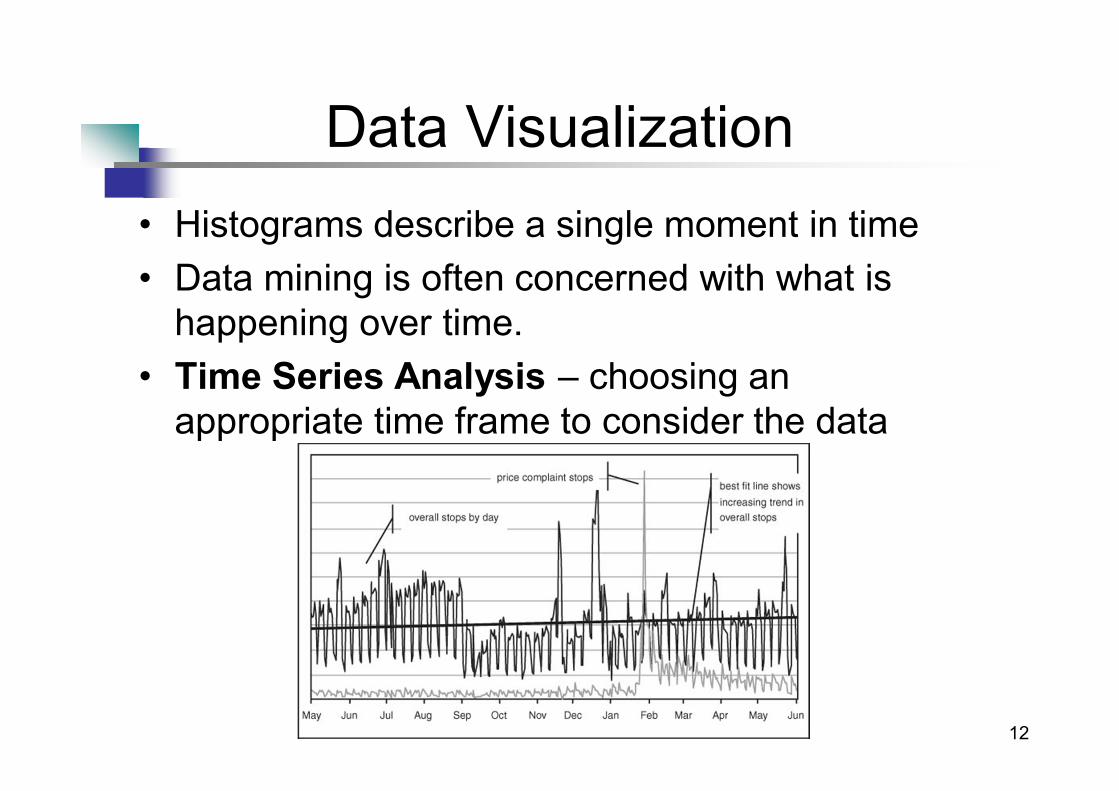
• Histograms describe a single moment in time
• Data mining is often concerned with what is happening over time.
• Time Series Analysis – choosing an appropriate time frame to consider the data

13
Standardized Values
• Time Series charts are useful, but have limitations also; cannot tell whether the changes over time are expected or unexpected
• We could look at a segment of the data, say a day at a time asking: “Is it possible that the differences seen on each day are strictly due to chance?”(null hypothesis)
• Answer:calculate thep-value for a day
14
Variance and Standard Deviation
• Variance is a measure of the dispersion of a sample (or how closely the observations cluster around the mean [average])
• Standard Deviation, the square root of the variance, is the measure of variation in the observed values (or variation in the clustering around the mean)

15
Example: Sample Scores/Grades
• 84
• 65
• 74
• 72
• 85
• 65
• 96
• 30
1. Sort the data from highest to lowest and assign grades
2. Find the Mean, Median, Mode, and Standard Deviation
3. Create a histogram for the grades
• 78
• 72
• 85
• 64
• 65
• 96
• 15
• 72
• 73
• 85
.
16
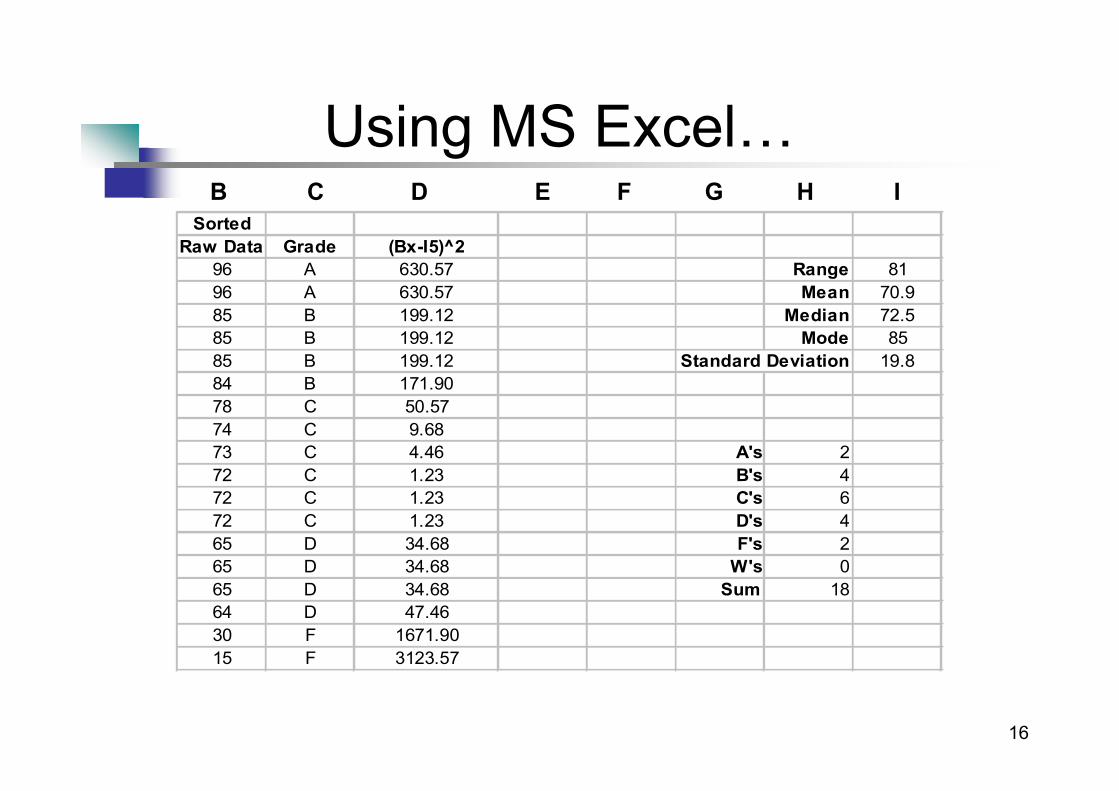
Using MS Excel…
Sorted
Raw Data Grade (Bx-I5)^2
96 A 630.57 Range 81
96 A 630.57 Mean 70.9
85 B 199.12 Median 72.5
85 B 199.12 Mode 85
85 B 199.12 Standard Deviation 19.8
84 B 171.90
78 C 50.57
74 C 9.68
73 C 4.46 A's 2
72 C 1.23 B's 4
72 C 1.23 C's 6
72 C 1.23 D's 4
65 D 34.68 F's 2
65 D 34.68 W's 0
65 D 34.68 Sum 18
64 D 47.46
30 F 1671.90
15 F 3123.57
B C D E F G H I
17
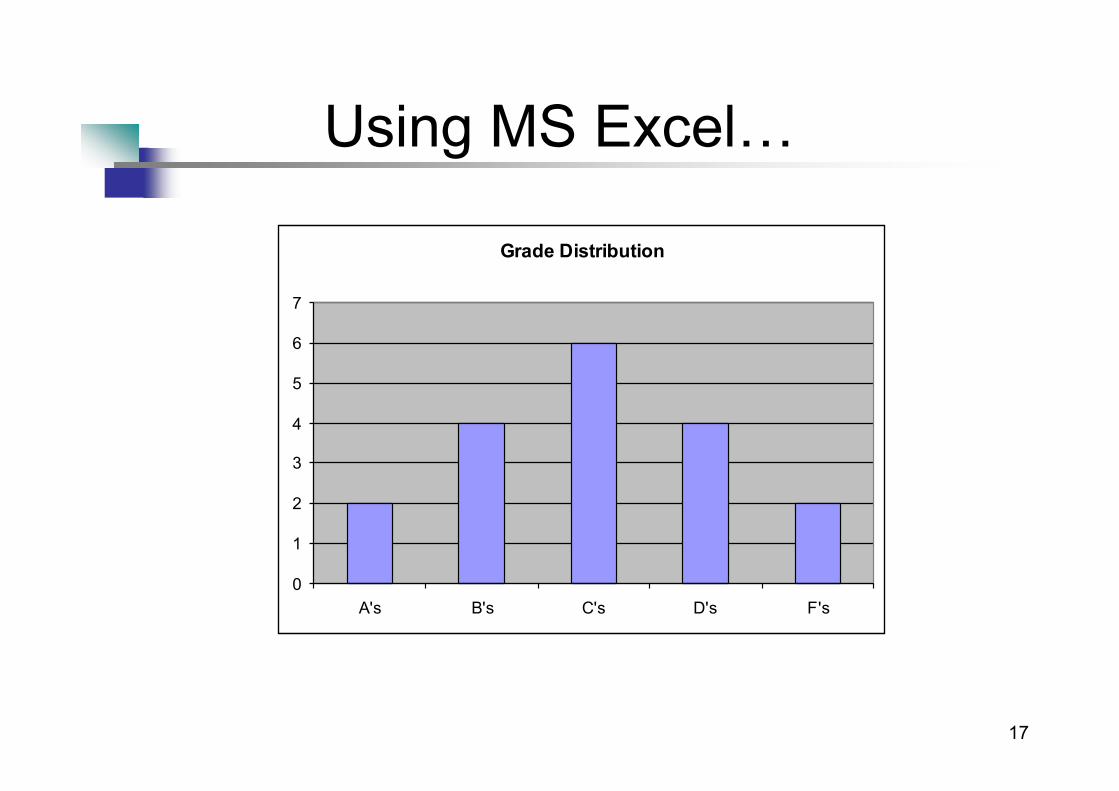
Using MS Excel…
Grade Distribution
0
1
2
3
4
5
6
7
A's B's C's D's F's
18
Central Limit Theorem
• As more and more samples are taken from a population, the distribution of the averages of the samples follows the normal distribution. The average of the samples comes arbitrarily close to the average of the entire population.
• Normal distribution is described by the mean (average count) and the standard deviation (clustering around the mean)
19
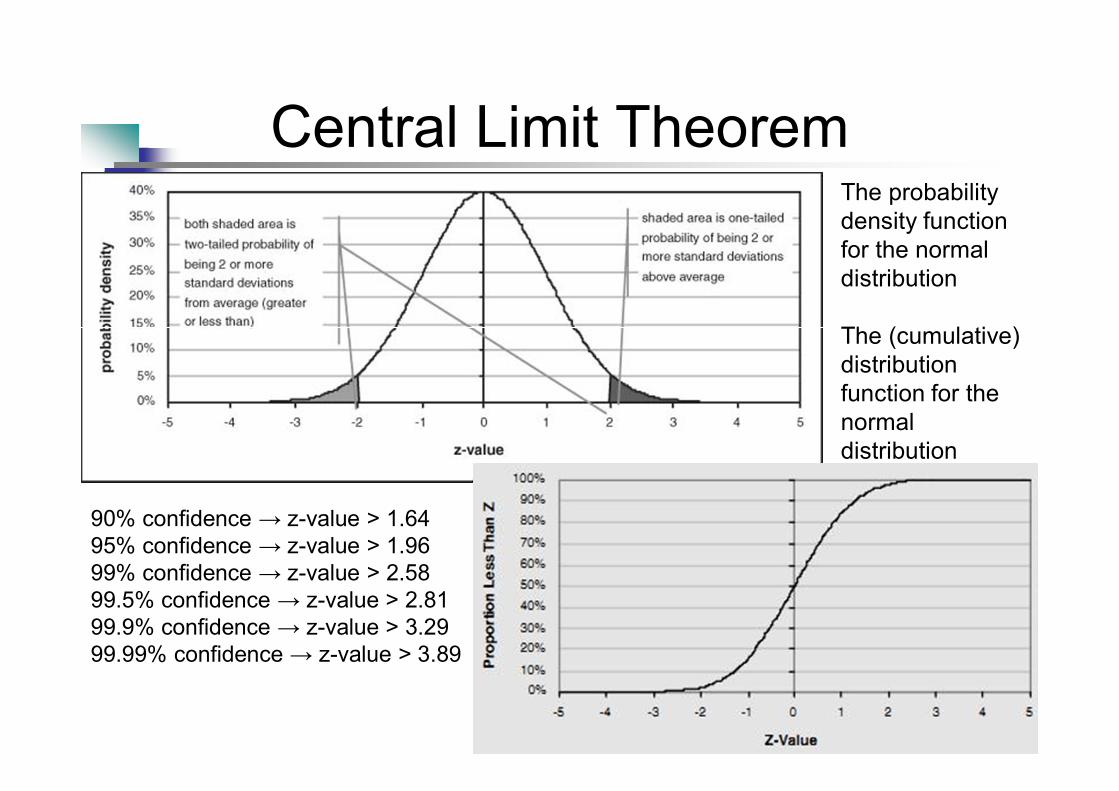
Central Limit TheoremThe probability density function for the normal distribution
The (cumulative) distribution function for the normal distribution
90% confidence → z-value > 1.64 95% confidence → z-value > 1.96 99% confidence → z-value > 2.58 99.5% confidence → z-value > 2.81 99.9% confidence → z-value > 3.29 99.99% confidence → z-value > 3.89
20
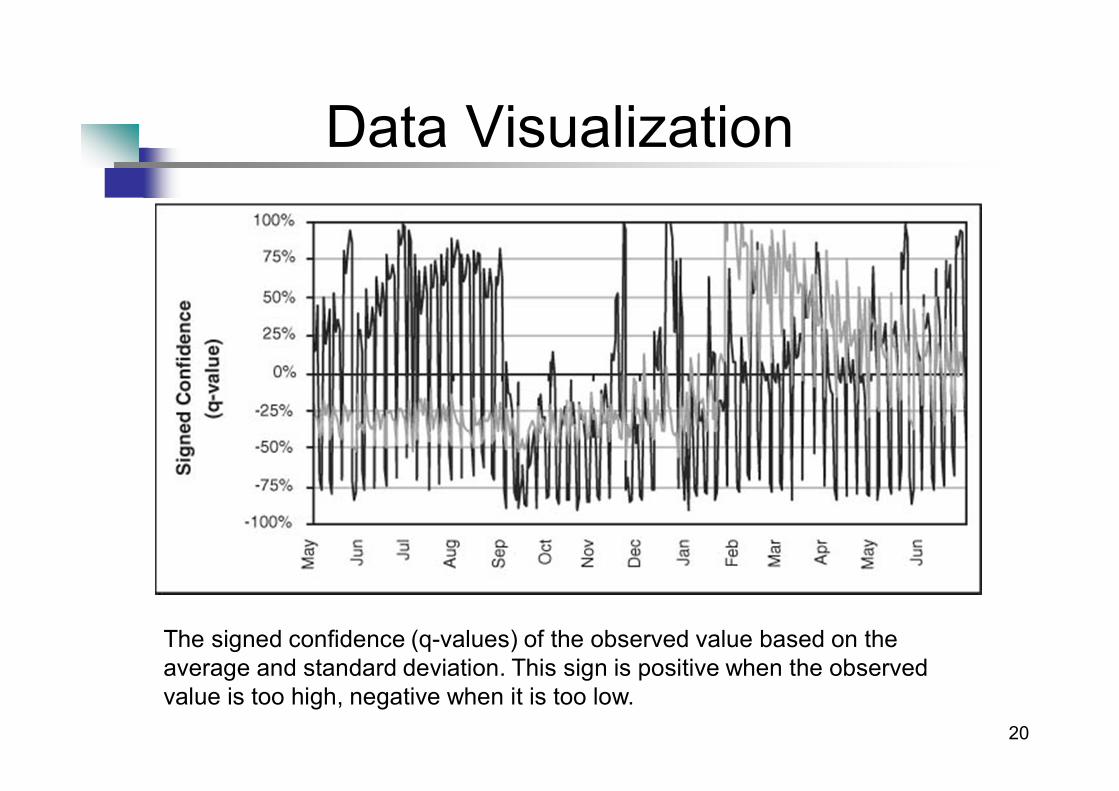
Data Visualization
The signed confidence (q-values) of the observed value based on the average and standard deviation. This sign is positive when the observed value is too high, negative when it is too low.
21
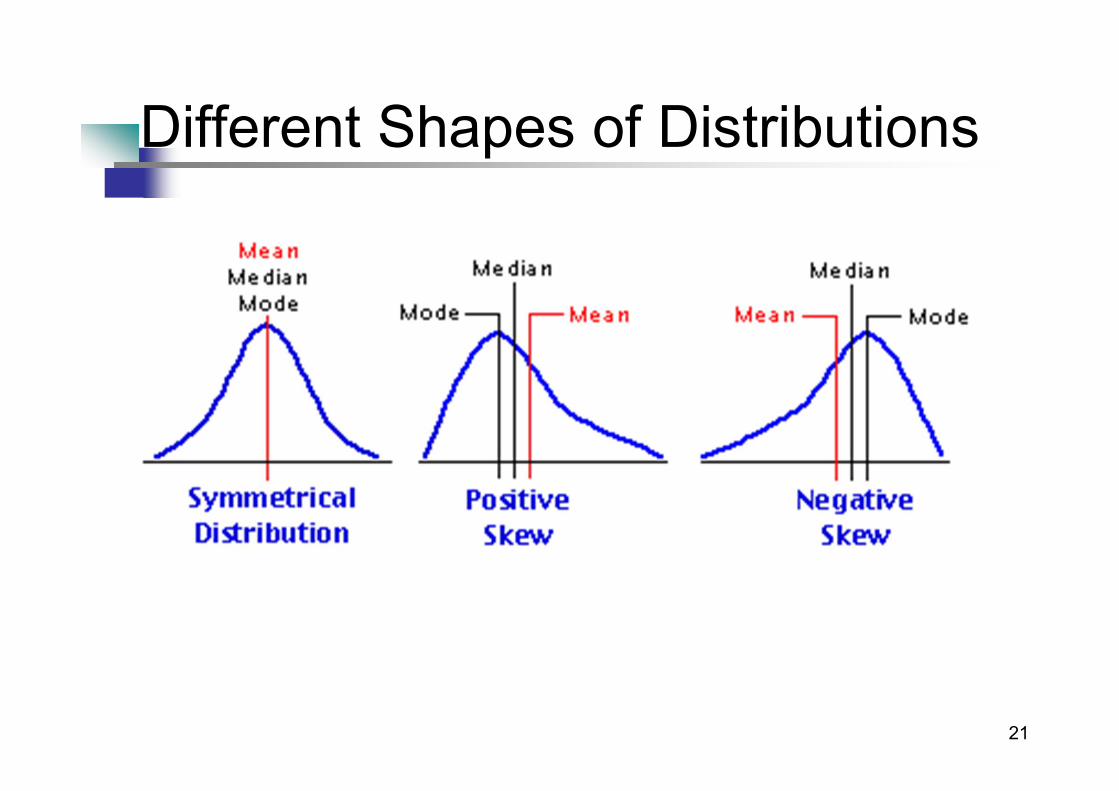
Different Shapes of Distributions
22
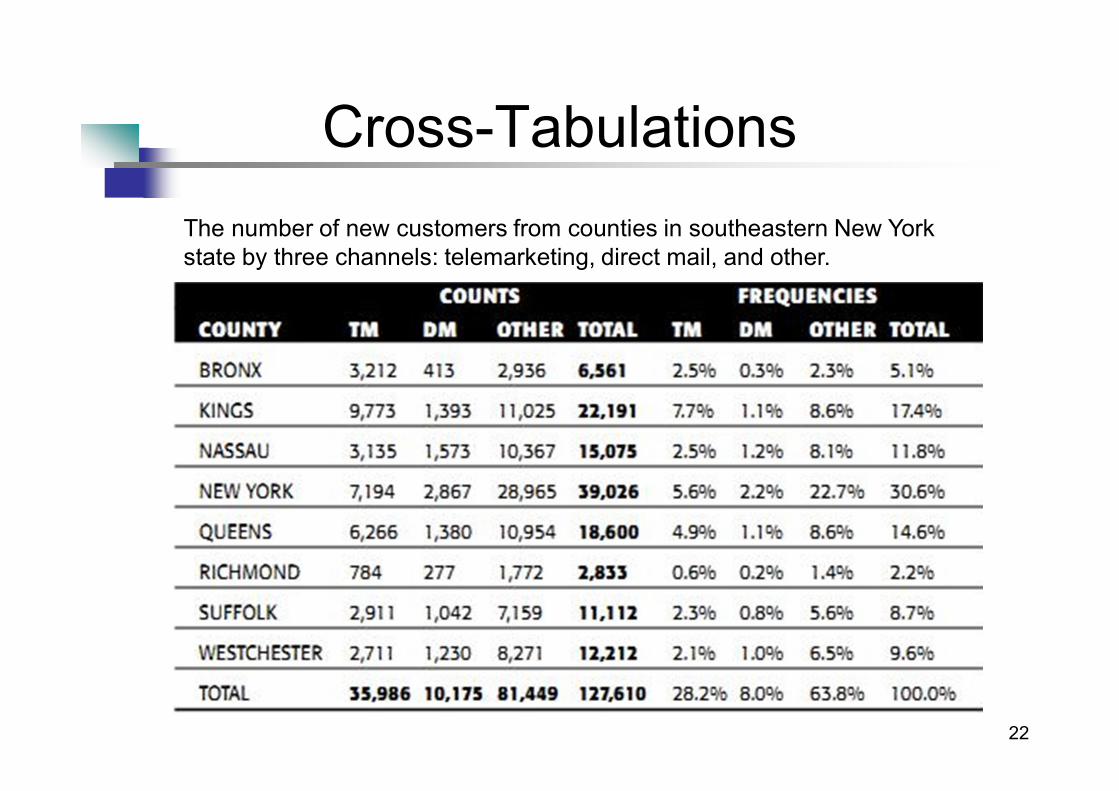
Cross-Tabulations
The number of new customers from counties in southeastern New York state by three channels: telemarketing, direct mail, and other.
23
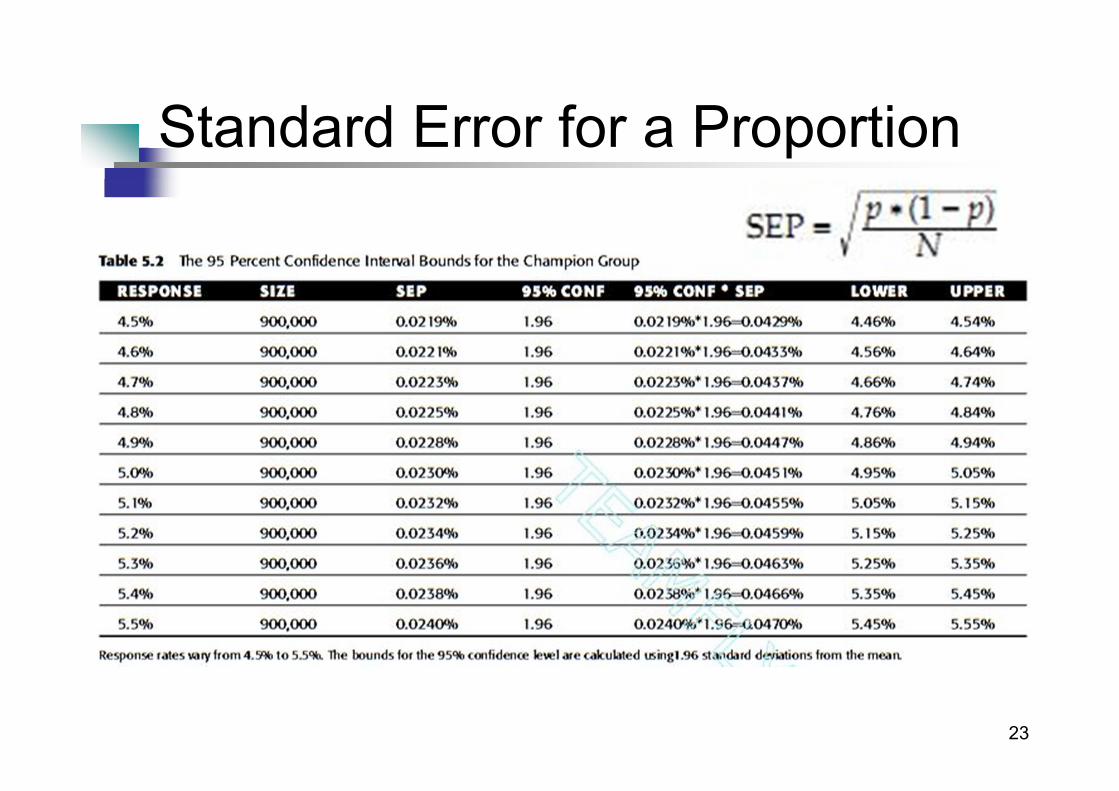
Standard Error for a Proportion

24
Standard Error for a Difference Between Two Proportions
25
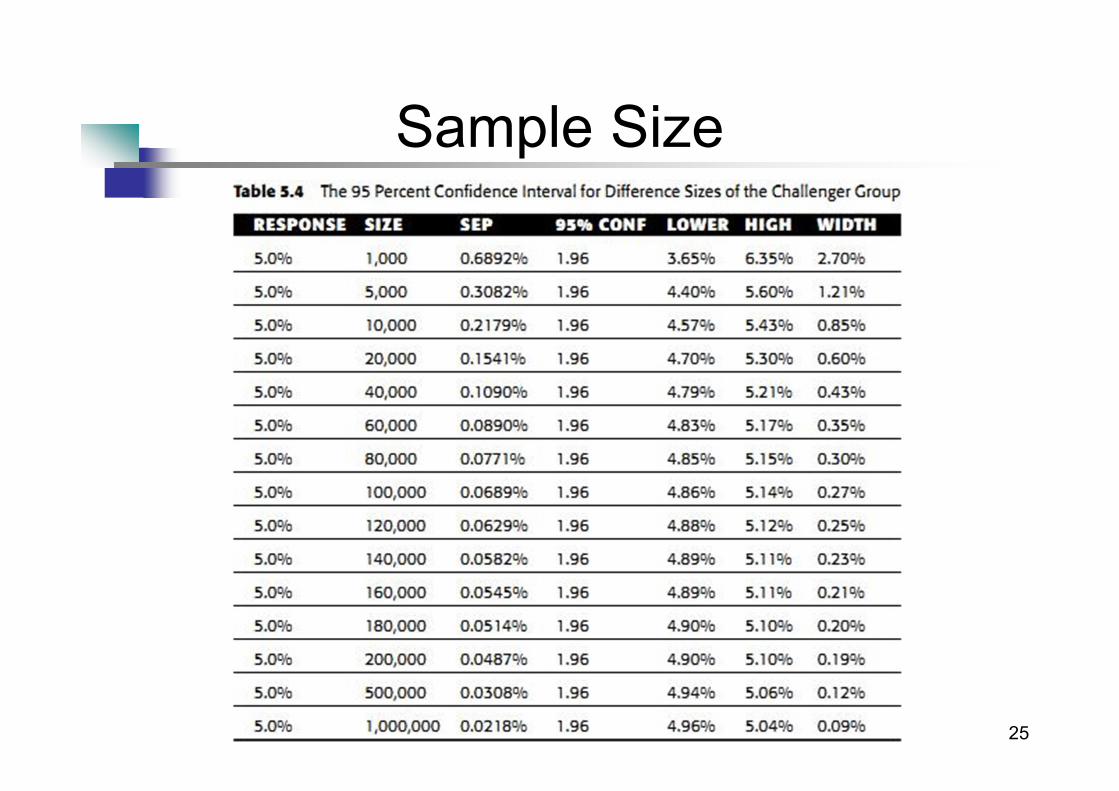
Sample Size
26
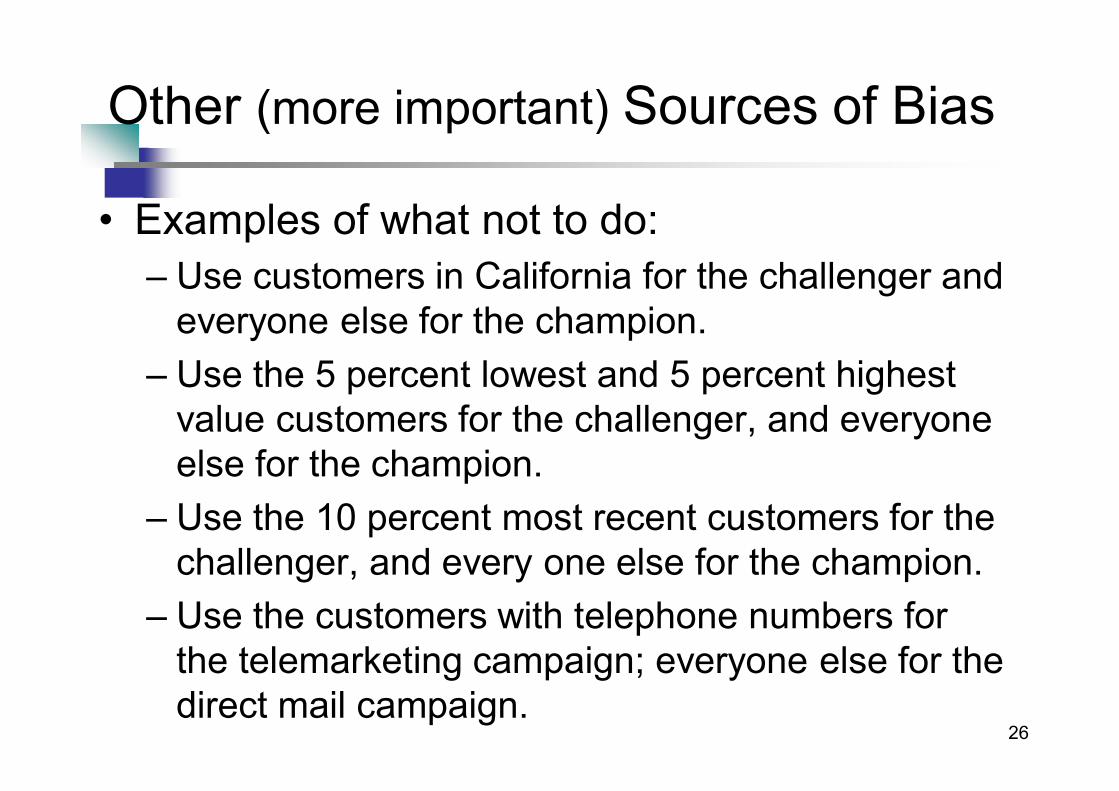
Other (more important) Sources of Bias
• Examples of what not to do:
– Use customers in California for the challenger and everyone else for the champion.
– Use the 5 percent lowest and 5 percent highest value customers for the challenger, and everyone else for the champion.
– Use the 10 percent most recent customers for the challenger, and every one else for the champion.
– Use the customers with telephone numbers for the telemarketing campaign; everyone else for the direct mail campaign.
27
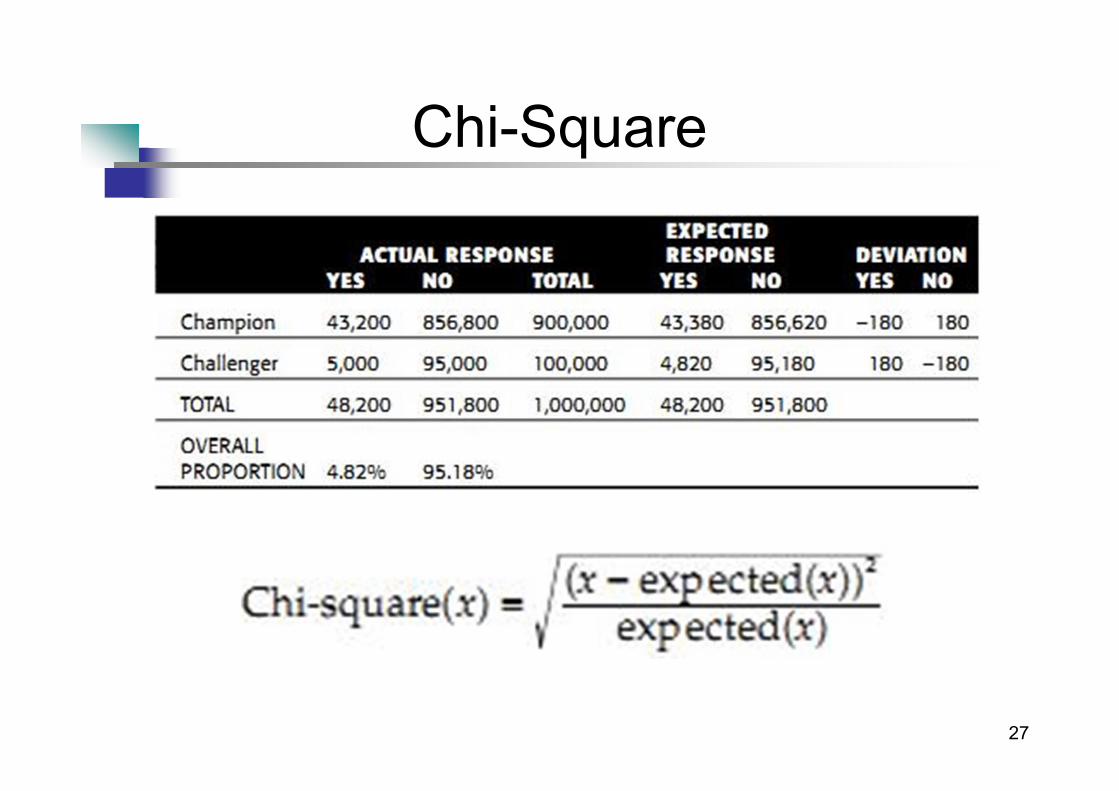
Chi-Square
28
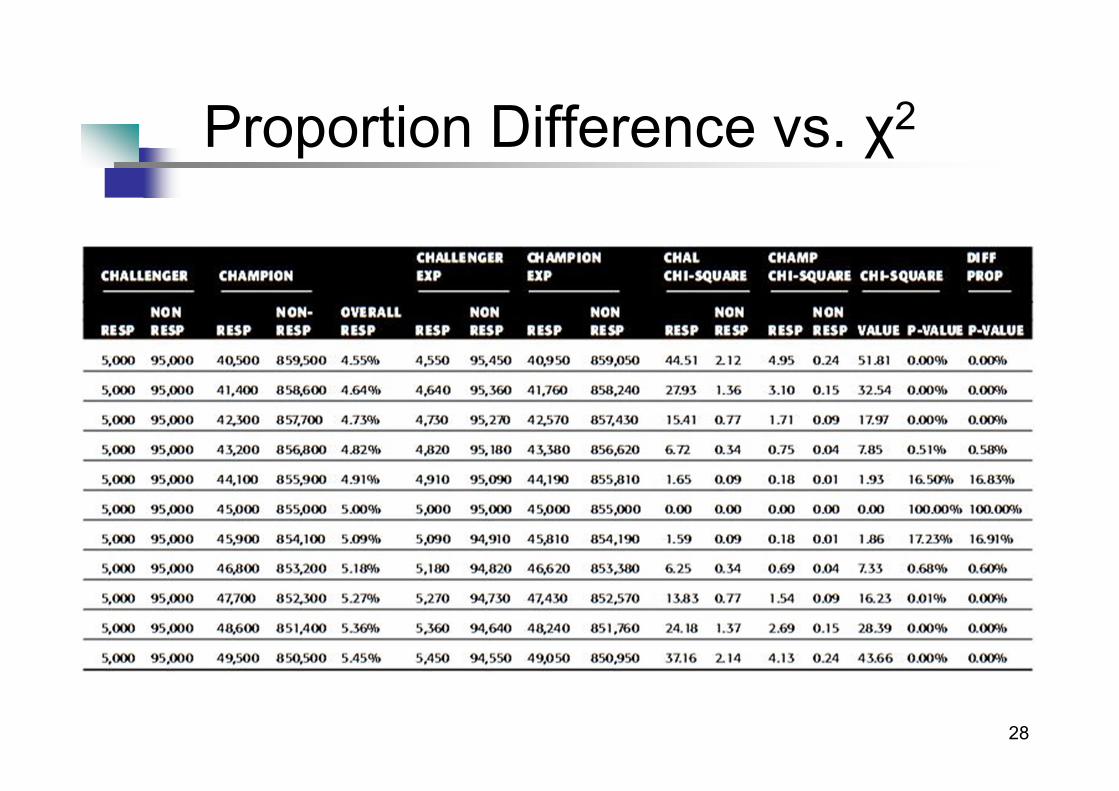
Proportion Difference vs. χ2
29
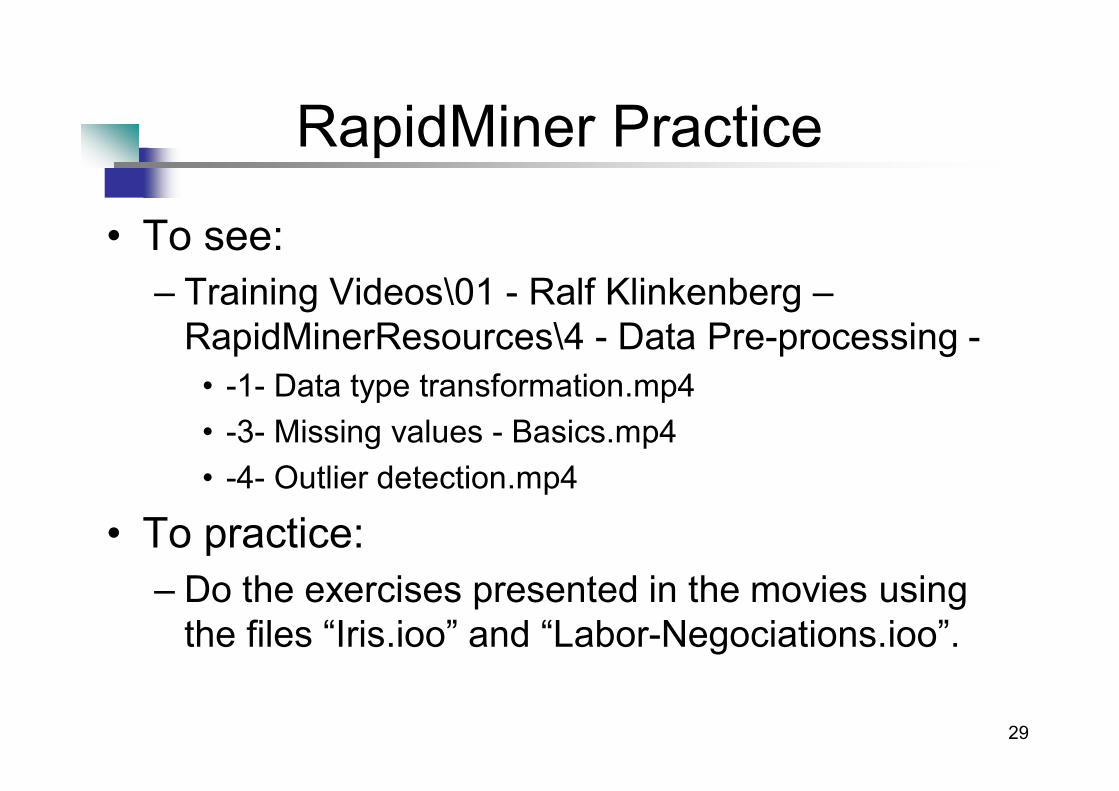
RapidMiner Practice
• To see:
– Training Videos\01 - Ralf Klinkenberg –RapidMinerResources\4 - Data Pre-processing -
• -1- Data type transformation.mp4
• -3- Missing values - Basics.mp4
• -4- Outlier detection.mp4
• To practice:
– Do the exercises presented in the movies using the files “Iris.ioo” and “Labor-Negociations.ioo”.
30
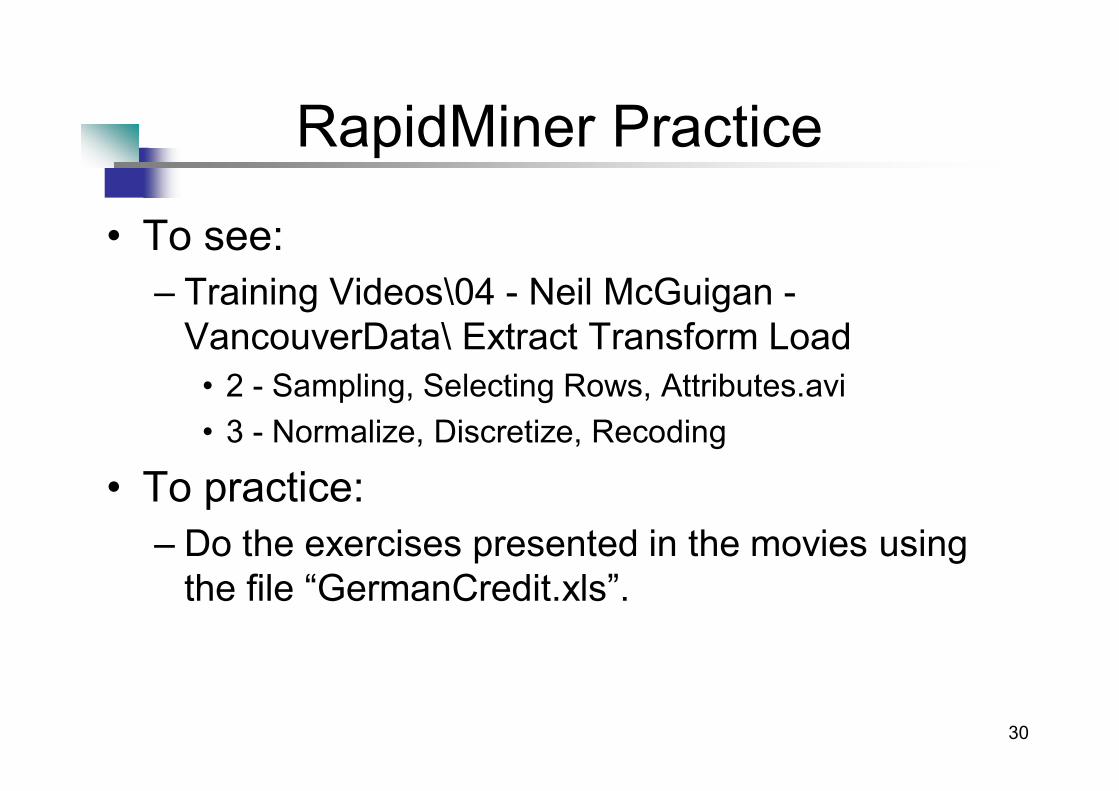
RapidMiner Practice
• To see:
– Training Videos\04 - Neil McGuigan -VancouverData\ Extract Transform Load
• 2 - Sampling, Selecting Rows, Attributes.avi
• 3 - Normalize, Discretize, Recoding
• To practice:
– Do the exercises presented in the movies using the file “GermanCredit.xls”.