Embed Size (px)
Citation preview

1
MA (ECONOMICS)
FINAL SEMESTER
SUBJECT CODE: ECO501
DEVELOPMENT ECONOMICS

2
BOARD OF STUDIES
1. Prof. S.K Nayak
Head
Dept. of Economics, RGU
Chairman (Ex-officio)
2.
Prof. A. Mitra
Dept. of Economics, RGU
Member
3.
Prof. (Ms.) V. Upadhyay
Dept. of Economics, RGU
Member
4.
Prof. N.C Roy
Dept. of Economics, RGU
Member
5.
Prof. M P Bezbaruah
Dept. of Economics,
Guwahati University, Guwahati
Member
6.
Dr. Raju Mondal
Dept. of Economics,
Assam University, Silchar, Assam
Member
7.
Dr. LijumNochi
Dept. of Economics, RGU
Member Secretary
Authors: -
Prof. N.C. Roy, Dept. of Economics, RGU (Unit: I)
Dr. Lijum Nochi, Dept. of Economics, RGU (Unit: IV)
Dr. P. B. Baruah, Dept. of Economics, RGU (Unit: I, II, VII & VIII)
Dr. Maila Lama, Dept. of Economics, RGU (Unit: V, VI, IX & X)

3
SYLLABI-BOOK MAPPING TABLE
PAPER NO: MAECO501
DEVELOPMENT ECONOMICS
SYLLABI Mapping
in Book
Unit – I :CONCEPT OF ECONOMIC DEVELOPMENT
Economic Growth and Economic Development - Economic Development -
Measurement of economic development problems - Obstacles to Economic
Development – Technology - Kuzets’ characteristics of Modern Economic Grash.
Unit – II : THEORIES OF UNDERDEVELOPMENT
Dualism and Backward Bending Supply Curve - Vicious Circle of Poverty -
Nelson’s Low Level Equilibrium Trap - Critical Minimum Effort - Paul Baran’s
Theory of Underdevelopment - Myrdal's Theory of Cumulative Causation.
UNIT- III : CLASSICAL, SCHUMPETERIAN AND MARXIAN
THEORIES OF GROWTH
Adam Smith’s theory of Growth - Multhus Theory of Growth - Ricardo’s Theory
of Growth - Schumpeter’s Theory of Growth - Marxian theory of Reproduction.
UNIT-IV : NEO-CLASSICAL AND CAMBRIDGE MODELS OF
ECONOMIC GROWTH
Harrods Model of Growth – Domars Mode of Growth - Solow Growth Model
- Cambridge Model of growth (Joan Robinson)
UNIT – V : TECHNICAL CHANGE
Hicksian and Harrodian Versions of Neutral Technical Progress - Labour and
capital Augmenting Technical progress (Harrod and Solow versions) -
Disembodied and embodied Technical Progress - Overview of Endogenous
growth theory - Growth under vintage capital model.
UNIT-VI : APPROACHES TO ECONOMIC DEVELOPMENT
Traditional approaches to Development - Rodan’s Theory of big push - Nurkse's

4
Model of Balanced Growth - Unbalanced Growth –Hirschman’s Strategy - Ranis
–Fei Model.
UNIT –VII : HUMAN CAPITAL AND SOCIAL CAPITAL
Human Capital - Process of Human Capital Formation - Human Capital and
Unemployment - Role of Market in an Economy - Role of Government in
Developing Economies - Role of Community in Economic Development.
UNIT– VIII : ALLOCATION OF RESOURCES AND ECONOMIC
DEVELOPMENT
Need for Investment Criteria in Developing Countries - Rate of Turnover
Criterion - Social Marginal Productivity Criterion - Marginal Per Capita Re-
investment Criterion - Time Series Criterion - Little- Mirrlees Cost Benefit
analysis of Projects
UNIT – IX : DEVELOPMENT PLANNING
Economic Planning - Input-output Analysis - Sectoral Projection in Planning:
Plan models in India - The Fifth Plan Model - Plan in a Market Oriented
Economy.
UNIT X : TRADE AND POLITICAL ECONOMY OF DEVELOPMENT
Import substitution and export led growth - Krueger’s Model of Rent seeking
society - Institution and Development: Contribution of Stephen Knock and Philip
Keefer - Foreign Direct Investment, Institutional Investment Development.
5
CONTENTS
UNIT-I: CONCEPT OF ECONOMIC DEVELOPMENT
1.0 Objectives
1.1 Economic Growth and Economic Development
1.2 Economic Development
1.3 Measurement of economic development problems
1.4 Obstacles to Economic Development
1.5 Technology
1.6 Kuzets’ characteristics of Modern Economic Grash
1.7 Questions
1.8 Key Word
1.9 Suggested Reading
UNIT-II: THEORIES OF UNDERDEVELOPMENT
2.0 Introduction
2.1 Objective
2.2 Dualism and Backward Bending Supply Curve
2.2.1 Characteristics of Dualistic Society
2.2.2 Concept of Backward Bending Supply Curve
2.2.3 Policy Implication of Social Dualism
2.2.4 Criticism of Boeke’s Theory of Social Dualism
2.3 Vicious Circle of Poverty
2.3.1 Causes of Vicious Circle
2.3.2 Solution for Vicious Circle of Poverty
2.4 Nelson’s Low Level Equilibrium Trap
2.5 Critical Minimum Effort
2.6 Paul Baran’s Theory of Underdevelopment
2.7 Myrdal's Theory of Cumulative Causation
2.8 Key Words
2.9 Short Questions
2.10 Long Questions
2.11 Suggested Readings
UNIT-III: CLASSICAL, SCHUMPETERIAN AND MARXIAN THEORIES OF
GROWTH
3.0 Introduction
3.1 Objectives
3.2 Adam Smith’s theory of Growth
3.3 Multhus Theory of Growth
3.4 Ricardo’s Theory of Growth
3.5 Schumpeter’s Theory of Growth
3.6 Marxian theory of Reproduction
3.7 Key Words
3.8 Sample Short Question
3.9 Sample Long Questions
3.10 Suggested Readings
UNIT-IV: NEO-CLASSICAL AND CAMBRIDGE MODELS OF
ECONOMICGROWTH

6
4.0 Introduction
4.1 Objectives
4.2 Harrods Model of Growth
4.2.1 Introduction to Labour Market
4.3 Domars Mode of Growth
4.4 Solow Growth Model
4.5 Cambridge Model of growth (Joan Robinson)
4.6. Questions
4.7 Key Words
4.8 Suggested Readings
UNIT – V: TECHNICAL CHANGE
5.1 Introduction
5.2 Objective
5.3 Hicksian and Harrodian Versions of Neutral Technical Progress
5.3.1 Hicks-neutral technical changes
5.3.2 Harrod Neutral Technical Progress
5.4 Labour and capital Augmenting Technical progress (Harrod and Solow
versions)
5.4.1 Harrod Version
5.4.2 Solow Version
5.5 Disembodied and embodied Technical Progress
5.5.1 Disembodied Technical Progress
5.5.2 Embodied Technical Progress
5.6 Overview of Endogenous growth theory
5.6.1 Arrow’s learning by doing model
5.6.2 The Romer’s Model
5.6.3 The Lucas Model
5.7 Growth under vintage capital model
5.7.1 Limitations
5.8 Let Us Sum UP
5.9 Key terms
5.10 Questions
5.11 Further/Suggested Readings
UNIT-VI: APPROACHES TO ECONOMIC DEVELOPMENT
6.1 Introduction
6.2 Objectives
6.3 Traditional approaches to Development
6.4 Rodan’s Theory of big push
6.5 Nurkse's Model of Balanced Growth
6.5.1 Size of market and incentive to invest
6.5.2 Determinants of the size of market
6.5.3 Productivity and economic development
6.6 Unbalanced Growth –Hirschman’s Strategy
6.6.1 Criticism of unbalanced growth theory
6.7 Ranis –Fei Model
6.8 Let us sum up
6.9 Key Terms
6.10 Long Questions
6.11 Further/Suggested Readings.
7
UNIT –VII: HUMAN CAPITAL AND SOCIAL CAPITAL
7.0 Objectives
7.1 Human Capital
7.2 Process of Human Capital Formation
7.3 Human Capital and Unemployment
7.4 Role of Market in an Economy
7.4.1 Market Efficiency
7.4.2 Sources of Market Failure
7.5 Role of Government in Developing Economies
7.5.1 Government Failure and Washington Consensus
7.6 Role of Community in Economic Development
7.6.1 Trust as an Economic Variable and Prisoner’s Dilemma
7.6.2 Role of Community in Providing Local Public Goods
7.6.3 Community in the Management of Forest Resources
7.6.4 Economics Social Norms
7.6.5 Critical Evaluation of Social Capital Approach in Economic
Development
7.6 Key Words
7.7 Short Questions
7.8 Long Questions
7.9 Suggested Readings
UNIT – VIII: ALLOCATION OF RESOURCES AND ECONOMIC DEVELOPMENT
` 8.0 Objectives
8.1 Need for Investment Criteria in Developing Countries
8.2 Rate of Turnover Criterion
8.3 Social Marginal Productivity Criterion
8.4 Marginal Per Capita Re-investment Criterion
8.5 Time Series Criterion
8.6 Little- Mirrlees Cost Benefit analysis of Projects
8.7 Key words
8.8 Short Questions
8.9 Long Questions
8.10 Suggested Readings
UNIT – IX: DEVELOPMENT PLANNING
9.1 Introduction
9.2 Objectives
9.3 Economic Planning
9.3.1 Rationale for planning in developing economies
9.4 Input-output Analysis
9.4.1 Input-output Analysis (closed model)
9.4.2 Input-output Table (open model)
9.4.3 Hawkins–Simon Condition
9.4.4 Samuelson Substitution Theorem
9.5 Sectoral Projection in Planning: Plan models in India
9.5.1 Mahalanobis Model of Planning
9.5.2 Mahalanobis Four-Sector Model
9.6 The Fifth Plan Model
9.7 Plan in a Market Oriented Economy

8
9.8 Let us sum up
9.9 Key terms
9.10 Long Questions
9.11 Further/Suggested Readings
UNIT X: TRADE AND POLITICAL ECONOMY OF DEVELOPMENT
10.1 Introduction
10.2 Objective
10.3 Import substitution and export led growth
10.3.1 Import substitution strategy
10.3.2 Export–led Growth Strategy
10.4 Krueger’s Model of Rent seeking society
10.5 Institution and Development: Contribution of Stephen Knock and Philip
Keefer
10.6 Foreign Direct Investment, Institutional Investment Development
10.6.1 Foreign Direct Investment and Economic Development
10.6.2 Foreign aid and Economic Development
10.7 Let Us Sum Up
10.8 Key Terms:
10.9 Questions
10.10 Further/Suggested Reading

9
INTRODUCTION OF THE BOOK
The economic development refers to the problems and challenges faced by the
economics at the labour strata of development hierarchy. Right from Adam Smith to Karl
Mark and Keynes the study of economic development has engrossed the attention of
economists. Although before the 20th century the economists were mainly interested to
understand the problems of Western European nations.It was only after the Second World
War, the economists were shown their concern for the less developed countries and thereby
formulate the theories and models of economic development and growth.
This book would examine the problems of economic development of underdeveloped
countries. To understand the problems of economic development of LDCs countries the book
is divided into ten units-
In the very first unit, the book has elaborately discussed the concept of economic
development, problems and measures, obstacles and a model. In the second unit, we have
discussed the factors responsible for the economic underdevelopment of underdeveloped
countries and also suggested the policies to stimulate the pace of development.
In the third unit, the readers are expected to learn some theories put forward by the
Classical Economists. In this chapter, we have discussed about growth theories of three
famous classical economists i.e., Adam Smith, David Ricardo and Malthus. In this unit, we
have also discussed Schumpeter’s theory of innovation andthe Marxian theory of
development.
In the forth unit the learners may acquaint themselves about Neo-Classical and
Cambridge Models of Economic Growth. The Harrods Model of Growth, Domars Mode of
Growth, Solow Growth Model and Cambridge Model of growth has elaborately conversed in
the unit.
Indeed the technical progress is important for economic growth. In the fifth unit, we
have discussed the importance of technical changes inthe economic development of
underdeveloped countries.
The important theories and approached for the economic development of
underdeveloped countries have been discussed in the sixth unit. We have broadly discussed
Rodan’s Theory of big push, Nurkse's Model of Balanced Growth, Unbalanced Growth,
Hirschman’s Strategy and Ranis –Fei Model.
In unit seventh, we have discussed the importance of human capital formation, the
role of the market, the role of government and community in economic development.

10
The vicious circle of economic underdevelopment requires that scarce resources are
allocated properly and efficiently. Pertinent to the vicious circle of economic
underdevelopment in underdeveloped countries, unit eight discusses the need for Investment
Criteria in Developing Countries, Rate of Turnover Criterion, Social Marginal Productivity
Criterion, Marginal Per Capita Re-investment Criterion, Time Series Criterion and Little-
Mirrlees Cost-Benefit analysis of Projects.
Proper planning is utmost necessary in underdeveloped countries to take the path of
economic development. As such, the unit ninth minutely discussed the importance of proper
planning in LDCs countries.
The last unit deals with the trade strategies of development. It also discusses the
model of rent-seeking society and the impact of the institution on economic development. In
the last few decades, there were rapid growths of foreign investment in various countries. So,
the role of foreign investment and foreign aid in economic development is also discussed in
this unit.
It is hoped that the students will find the book useful for learning.

11
UNIT-I
CONCEPT OF ECONOMIC DEVELOPMENT
Structure
1.0 Objectives
1.1 Economic Growth and Economic Development
1.2 Economic Development
1.3 Measurement of economic development problems
1.4 Obstacles to Economic Development
1.5 Technology
1.6 Kuznet’s characteristics of Modern Economic Growth
1.7 Questions
1.8 Key Word
1.9 Suggested Reading
1.0 Objectives
In this unit students are expected to know and learn about the concepts relating to
various dimensions of economic growth and development.
Economic growth and economic development
Measurement of economic development:
Problems in measures of development,
human development index
Obstacles to economic development: weak Property rights,
low ability to create and adopt new technology,
low levels of human and physical capital
Kuznets' characteristics of modem economic growth.

12
1.1 Economic Growth and Economic Development
Economic growth is the sustained growth of per capita real income over a long period
of time. Unlike macro-economic which deal with the short-cum behavior of the economy, the
focus of Development Economics is the long run. Trade cycles are a common phenomenon in
any growing economy. Income may increase over a number of years and then it may even fall
for a few years. The figures a, b and c show the behavior of income per head (yp) over the
different phases of the trade cycle.
All the three figures shows the fluctuate nature of income. In figure (a) yp fluctuates
about a flat trend line. This means the economy is not growing over the years. If our focus is
only the short-cum, then we would find the economy either expanding or contracting. But a
trend line only gives the picture relevant to the study of economic growth.
Figure (b) shows an economy whose per capita income fluctuates about a line which
is downward sloping. This line represents the economic growth that is negative. The long run
per capita income displayed in figure c is increasing. In the short run there are fluctuations,
income rises in the upward place of the trade cycle and then it falls in the downward phase.
However, the fluctuation of income per head occurs around a trend line which is upward-
rising. This upward-rising trend line covering phases of trade cycle is indicative of economic
growth.
The growth of per capita income is sustained in the long-run by the interplay of a
number of factors of which the most crucial one is technological progress. The line of
time (t) O t O t O
Figure 1(a) Figure 1(b) Figure 1 (c)
yp yp yp

13
technological progress has especially been in the initial stage of development, the industrial
sector. The growing industries absorb more and more workers from the low productive
traditional sectors. So the concomitants development of industrialization is urbanization and
the expansion of various term-serving activities. Another characteristic of economic growth is
sustained growth in population. It is the growing population that meets the growing demand
for man power.
The relationship between the growth of income per head and growth of population
(gp) is:
gyp = gy –gp, where gyp is the rate of growth of income per head and gy is the
growth of income. One basic characteristic of economic growth is that in a growing economy
population growth is usually positive and gy>gp, the relation paving the way for the growth
of income per head.
1.2 Economic Development
When economic growth continues long and brings about deeper changes not only in
the economy but also in the society. There is economic development. The changes occur in
the social realm slowly. Mere economic growth cannot bring much social changes. It is the
spread of education, urbanization and industrialization that tends to reduce the relative
importance of ascribed status and enhance that of the achieved status of an individual in the
social hierarchy. In the pre industrial society a person inherits the social status of her parents.
There is what is called social reproduction. This is shown below:
Period I Period II
Social category Social category
I I
II II
III III
In the traditional society the children of the people belonging to the first category
occupy the first category by virtue of their birth. The status is a birth right. This situation is
social reproduction, common in pre-industrial or rural society. With the industrialization,
urbanization, and spread of modern education especially scientific and technical education

14
there is what is called social transformation or development. This occurs through the decay of
ascribed status in society and rising importance of ‘achieved’ status. People belonging to the
lowest category can through merit rise to the highest category. In such a situation status
depends on the individual’s own capability, not the status of his caste, class or any other
ascribed status attribute. In short sustained economic growth occupied with social change or
transformation is what is called economic development, a long term process experiences, to
date, only by a very few centuries of Asia such as Japan, Singapore, etc.
1.3 Measurement of economic development problems
Economic development is a complex process involving the changes in a large number
of variables, a few of which are quantitative and most of them are qualitative. In general,
qualitative variables have different dimension and so they cannot be added together. A part
from this, the qualitative variables cannot be added to the quantitative variables. These
problems stand in the way of finding a singular measure of economic development.
Because of its encompassing other quantitative and qualitative variables, to date it has
not been possible to find out a singular measure of economic development. Some economists,
belonging mainly to neoclassical school tend to accept the centrality of income as the
measure. Centrality does not mean singularity; the role of non-income factors cannot be
neglected. Moreover, income is not an object which is intrinsically valuable. It carries largely
instrumental value it is the means by which the intrinsically valuable objects can be made
available.
The absence of a proper measure of economic development led to the search for a
measure with more acceptability that the hitherto formulated ones. This led to the formulation
of the paradigm of human development and its quantitative measure called Human
Development Index (HDI). The focus is on the determination of ultimate goals of
development an identification of the instruments and made of their operation to achieve the
specific targets. The relation between goals and the instruments to achieve then is illustrated
in Note.
The ultimate goal of all human endeavors is the enhancement of their welfare. The
challenge is to identify ways and means to achieve maximum possible human welfare.

15
Human Development Paradigm was formulated to determine the basic goals of development
and the means of their achievement. There is no absolute measure of human development,
there is only relative measure. This measure called Human Development Index (HDI).
Human Development has three components: health, education and income, all of them
carrying the same relative weight; namely 1
3. Health is measured by life expectancy at birth.
The maximum and minimum values of life expectancy at birth are taken into consideration in
order to find out the dimension index of health. This is done by the formula;
Dimension index of health = 𝐿0𝑜(𝑎)−𝐿0𝑜(𝑚𝑒)
𝐿0𝑜(𝑚𝑎)−𝐿0𝑜(𝑚𝑒)
Where L0o(a) is the actual life expectancy at birth of the country being studied
L0o(me) is the minimum life expectancy at birth observed in the world.
L0o(ma) is the maximum life expectancy at birth observed in any country of the world.
Dimension index of health varies from 0 to 1. In calculating education index mean years of
schooling and expected years of schooling are taken into consideration. In income index
calculation per capital income in purchasing power parity in dollar (PPP$) is taken. Lastly
HDI is the geometric mean of health, education and income indices.
Human Development Paradigm is also concerned with the different types of
inequality and poverty. In order to estimate the magnitude of inequality in different
indicators, an inequality adjusted Human Development Index is constructed. It is based on
inequality-adjusted life expectancy index, inequality adjusted education index and inequality
adjusted income index.
Gender inequality is a problem found not only in poor countries but also in an
attenuated form, in developed countries. However, the inequality is an acute problem in many
developing counties including India. The components of Gender Inequality Index show the
magnitude of inequality in Health, empowerment and labor market. Lastly, Multidimensional
Poverty Index is constructed by incorporating status of nutrition, child mortality, schooling
and the standard of living.

16
Position of India in Human Development Index in 2011 among 187 countries is 134.
India belongs to the group of countries having a medium range of human development.
India’s position in 2006 was 135. So even a period of five years India’s position among all
the countries of the world improved by one rank. India’s condition in human development
still remains far from satisfactory.
1.4 Obstacles to Economic Development
A poor country faces a number of obstacles to its path of economic development. All
the poor countries do not encounter the same problems. However, there are some obstacles
common to all the developing countries. These are :
1. Low rate of savings: In general poor countries have a low level of income. So the
ability of these countries to save a significant part of their income for accumulation of
capital is low. Ragnar Nurkse (1953) used the low rate of savings to develop his
theory of vicious circle of poverty. This circle is vicious because it behaves like a trap
from which a poor country finds it very difficult to come out. The argument is very
simple. A low level of income leads to a low ability to save. A low level of saving
means a low level of investment. When the level of income is very low, a poor
country can at least save. The amount which is only enough to make the investment to
compensate the depreciation of existing capital stock. Inability to make any new net
investment leads to the stagnation of income. This completes the vicious circle.
It is necessary to make an appraisal of the vicious circle of poverty. In the first
place if low income is responsible for continuation of low income through vicious
circle of low saving and investment then a good number of countries which are once
poor could not now become rich. Secondly the hypothesis of vicious circle is based on
the restrictive assumption of market imperfections especially the capital market. A
poor country has, by definition, a low income and investible surplus. Moreover, the
capital endowment of a poor country is low. A low level of capital means its high
marginal productivity. On the other hand many developing countries including India
have abundant labour. So it means a poor country has a low marginal productivity of
labour and hence a low wage rate and a high marginal productivity of capital. So, in
general capital would have a tendency to flow towards the poor areas from the rich
areas. The opposite would happen in case of labour.

17
This point can be further illustrated by the internal flow of capital in India. It is
a vast country with some of its areas having a strong industrial and modern service
that is IT sector. One can mention rational capital region, Mumbai-Pun belt,
Bangalure, Hyderabad, Chennai and Ahmedabad, Vadodara region. If these areas are
compared with Northern and East India, largely Bihar, West Bengal and North India,
one can see contrast. Wage rate in these poor areas is low. The rate of industrialization
is also low. Capital is not flowing to their capital-scarce area from the capital-rich
parts of the country. Rather the circulating capital has a tendency to move towards the
capital-rich areas from the poorer parts of the country.
This compels us to look into the more basic issues of under development the
true obstacles to economic development. These obstacles are called institutional
factors which are inseparably related to the cultural mores and ethos of the people and
therefore these obstacles cannot be removed by external factors. An only internal need
of the society, more properly the operational necessity, tends to change the factors,
called the institutions conditioning the economic behavior.
A very important institutional obstacle comes from weak property rights. In all
developed countries the property rights are strong and in many poor countries the
property rights are weak. Even in the same country the strength of property rights may
vary from region to region. Invariably the urban property rights in a poor country are
stronger than the rural property rights.
An inseparable part, more appropriately, the vital part of property rights is rule
of law and effective contract-enforcement mechanism. In the developed countries the
contract enforcement mechanism is very strong. It, of course depends on the strength
of the legal personality of the people. A formal promise made by a legal person must
be observed by him/her. If the promise is not kept by him/her, he/she is liable to
punishment.
A fundamental problem in the developing countries is the weakness in the
administration of justice and ultimately it is this weakness that stands in the way of
investible resources flowing to the poor areas. The problem of low investment cannot
be removed without strengthening the property rights regime of the poor countries.

18
1.5 Technology
Economic development is a creative process. The creative element is not revealed in
what Schumpeter called invention-innovation and diffusion of new technology. UK was the
threaten of first industrial revolution. This small county composed of Islands was empowered
by the new technology so much that it established the empire covering parts of all continents
except one, Australia, which was entirely under British control. The new technology gives
new energy and power that propels a country to a higher level of development. So the force
of development flows from the creative energy of the people who tend to improve the
technique of their production.
Many developing societies can create neither new technology nor adopt new
technology. They are so much engrossed in their own old technology that they find it very
difficult to adopt new technology. Two factors are responsible for this. One is low level of
human capital and the other is deficiency of physical capital of these two, human capital is
more important than physical capital.
In the whole spectrum of development, the human capital plays the more crucial role.
But human capital alone is not enough. For its better performance it requires the physical
capital. In fact the productivity of human capital depends on the level of physical capital.
When the amount of physical capital is high, the productivity of human capital is also high.
So this complementary relationship demands emphasis on investment in both physical and
human capital.
1.6 Kuznets’ characteristics of Modern Economic Growth
Modern economic growth has some fundamental characteristics. Professor Kuznets
has isolated six of these characteristics. These six characteristics are common to all the
developed countries:
1. Growth of per capita output and population: Modern economic growth has been
accompanied the growth of population. Before industrial revolution in UK, the
population growth was not high in that country. In India the year 1921 is called the
demographic great divide. Before 1921 the population of India was growing with
fluctuation. For example, the decade 1911-1921 witnessed the decrease of Indian

19
population. Only after 1921 the population of India has been increasing without any
fall. Like the growth of population, modern economic growth is characterized by the
positive growth of per capita income.
2. Growth of total factor productivity: Economic growth is not limited to the growth
of only labour productivity. It is also associated with the growth of total factor
productivity which means the rise in overall efficiency in production.
3. Structural transformation: The journey of modern economic growth began in steam
powered ship – it was the steam engine which caused the first industrial revolution.
This revolution made UK the ‘workshop’ of the world. Industrial sector became the
most important sector of the economy, employing a significant segment of the labour
force. In course of time industrial sector gave way to the tertiary sector shaped by
inventive activities and different kinds of service activities.
4. Social and ideological transformation: Industrialization paved the way for
urbanization. Urban society became radically different from the rural society which
kept align at least some vestiges of traditional cultural practices. Urban society traced
a new path unseen and unknown before. Urban society is considered western
compared with the rural society. Ideological landscape of the urban industrial society
is also different from that of the rural society.
5. International economic outreach Industrialization is accompanied with expanded
relationship. This relationship is shaped by the need of industrial inputs and the sale
of finished products. The large-scale industrial production facilities ensure a low cost
of production; it demands expanded relationship in the international domain.
6. Limited spread of economic growth: Modern economic growth did not spread
widely. Initially it was confined to Western Europe, North America, Japan, Australia
and New Zealand. The vast areas of the world remained outside the net of modern
economic growth and development. In recent years economic growth has been high in
China, South Korea, Singapore, Eastern Europe and in oil rich West Asian countries.
In spite of the recent spread, modern economic growth has not equally benefitted all
countries.

20
APPENDIX
Note
1. The simplest way to illustrate the instruments-targets relation, we can consider the
simple simultaneous equation. We started with one variable and one equation:
2x – 10 = 0
Here x = 5
If we are to determine the values of 2 Unknowns, we need 2 equations which must be
(i) independent and (ii) consistent. To illustrate this we take examples. If we are given
2x-y = 4 --- (1)
x+2y = 6 --- (e)
We see that these two equations are independent and also consistent. Their solution :
x= 14/5, y=8/5.
If we are given
3x-y =4 --- (3)
6x-2y = 8 – (4)
We see that equations (3) and (4) are not independent.
By multiplying equation (3) by 2 we get equation (4).
The next case shows the inconsistency between the given equation:
2x+y = 4 --- (5)
2x-y = 4 --- (6)
Equation (6) is inconsistent with equation (5).
1.7 Questions
1. Distinguish between economic growth and economic development.
2. Discuss the various measures of human development and the problems
relating to its measures.
3. Illustrate and explain Kuznet’s characterization of economic development.

21
1.8 Key Word
Human Development Index : a measure to index human development
Property Right’s : right over private property on the basis of
excludability and contract enforcement
Measure : to quantify or rank according to a predefined
scale
1.9 Suggested Reading
Thirwal, A.P., Growth and Development, Macmillan, London, 1999.
Meier, G, Leading Issues in Economic Development, Oxford University Press, New
Delhi, 1990.
Higgins, B., Economic Development, W.W. Norton, New York, 1959.
Todaro, M.P., Economic Development, Longman, London, 1996.

22
UNIT-II
THEORIES OF UNDERDEVELOPMENT
Structure
2.0 Introduction
2.1 Objective
2.2 Dualism and Backward Bending Supply Curve
2.2.1 Characteristics of Dualistic Society
2.2.2 Concept of Backward Bending Supply Curve
2.2.3 Policy Implication of Social Dualism
2.2.4 Criticism of Boeke’s Theory of Social Dualism
2.3 Vicious Circle of Poverty
2.3.1 Causes of Vicious Circle
2.3.2 Solution for Vicious Circle of Poverty
2.4 Nelson’s Low Level Equilibrium Trap
2.5 Critical Minimum Effort
2.6 Paul Baran’s Theory of Underdevelopment
2.7 Myrdal's Theory of Cumulative Causation
2.8 Key Words
2.9 Short Questions
2.10 Long Questions
2.11 Suggested Readings
2.0 Introduction
More than 150 member countries of United Nations constitute the developing and
underdeveloped nations. However, there are diversities among those countries regarding the
level of development. The nature and structure of their economies are also not homogeneous.
The common characteristic of those countries is that their per capita income is low and they
are unable to generate adequate economic surplus to sustain the development process.
Economists and policy makers have been trying to analyse the factors responsible for their
underdevelopment. They also try to give policies for development of such countries. This
chapter discusses some of those theories.

23
2.1 Objective
In this unit the learners is expected to know and understand the various theories of
underdevelopment. The unit deals ;
Dualism and backward bending supply curve
Vicious circle of poverty
Nelson's low level equilibrium trap
Leibenstein's critical minimum effort
Paul Baran's theory of underdevelopment
Myrdal's theory of cumulative causation.
2.2 Dualism and Backward Bending Supply Curve
J.K. Boeke was one of the pioneers of the distinctive theories that were applicable
only to the underdeveloped countries. According to Boeke’s theory of social dualism, in the
developing countries two socio-economic systems exist. And these two systems could be
easily distinguished from each other. In a dual society, one of the two social systems is more
advanced imported, and has gained existence in the new environment. But the imported and
advanced social system could not drive out the indigenous (that prevailed in the society
before importing the advanced system) social system entirely. This results that neither of the
two systems becomes general for the society as a whole. Thus, both the systems co-exists and
hence termed as dual social system. Boeke termed the advanced imported social system as
“Western System” and the indigenous system as “Eastern System”. The west penetrates into
the east, but it has not been able to absorb the east culturally and socially. Both the East and
the West have their definite culture and a definite philosophy of life. Thus, Boeke defines
social dualism as “clashing of an imported social system with an indigenous social system”.
2.2.1 Characteristics of Dualistic Society
a) Overriding importance of social needs
The indigenous societies are influence more by social rather than economic needs.
The eastern society gives greater importance social needs compared to western society. Due
to the comparative primitive character of eastern society, there is overriding importance

24
social needs. The more dependence of the society on social needs, lesser the societies’
economic needs. In the eastern society the value of goods depends on its prestige value not
on its value-in –use.
b) Limited needs
In the eastern society needs are limited compared to western societies. It is because
the eastern societies are contended on what they produce for themselves. Economic
motivation to produce more does not exist in eastern society or is very weak, because of the
limited needs. Thus the developing countries have a backward sloping supply curve of
labour.
c) Accent of self-sufficiency
In the developing countries, the indigenous sector does not have the motive to
produce for profit. They produce for self-consumption. However, the modern sector in those
economies produces for profit only.
d) Western theories are not applicable in eastern societies:
It is because the latter is a pre capitalist society and the former is a capitalist society.
What is beneficial for western society are not applicable in the eastern society. Boeke
therefore warns that “we shall not try to transplant the tender, delicate hothouse plants of
western theories to tropical soil, where an early death awaits them.”
e) Agriculture system
Mental changes in farmers are necessary for introduction of the western agriculture
technologies. If not, an increase in wealth will result in growth of population. If western
technology fails, the result will be huge indebtedness of the farm households.

25
2.2.2 Concept of Backward Bending Supply Curve
The eastern societies are characterized by a backward sloping supply curve. It is
because of the limited human needs in the eastern societies. The ability to satisfy their limited
wants increases as their wage increase since their demand for money is limited. It leads to a
situation where a rise in wage induces workers to work less. This result in backward bending
supply curve as shown in figure 2.1:
Figure 2.1: Backward sloping supply curve of labor
In Figure 2.1, X axis shows the hours worked and Y axis shows the wage rate. If
wage rate increase from OW1 to OW2, the workers are willing to increase working hours
from OL1 to OL2. But if the real wage further rise from OW2 to OW3, the number of hours
offered for work would fall from OL2 to OL3. The utility to be gained from one extra hours of
unpaid time is now greater than the utility to be gained from extra income that would be
earned by working extra hour.
2.2.3 Policy Implication of Social Dualism
Boeke believes that western interference can only lead to impoverishment of the
traditional eastern society rather than progress. Boeke was of the view that the best thing that
the western society can do is to leave the underdeveloped countries alone. The western
L1 L3
3 L2
W2
W3
3
WA
GE
RA
TE
OURS WORKED
Y

26
interference can worsen the underdeveloped countries in all activities viz. agriculture,
industries, international trade etc. As discussed earlier, developing eastern pre-capitalist
agriculture through western technology may prove harmful. Boeke feels that the eastern
societies are perfectly adapted to their environment. The highly capitalist forms of
organization are very different from the eastern societies. This capitalist form of organization
cannot be developed in eastern societies because the latter lacks the ‘Intermediate’ or ‘The
Middle Class’. If the eastern producers continue to imitate western methods, production cost
will increase, making the eastern societies loss towards the highly capitalized and other
western enterprises. Due to limited needs of the eastern societies, business motive of produce
does not exist.
Thus, Boeke leads to a pessimist conclusion that the intervention of developed society
has an adverse effect on the primitive society. Boeke concluded that the developed countries
should leave the underdeveloped countries alone.
2.2.4 Criticism of Boeke’s Theory of Social Dualism
However, Boeke’s theory of social dualism has certain limitations. These are:
a) Wants are not limited: Wants of the people are not limited. Wants of the villagers are
also so varied and expensive. An increase in income leads to a substantial expansion of
homemade and imported luxury and semi-luxury consumer goods.
b) Casual labor not unorganized: According to Boeke eastern casual labour are
unorganized, passive, silent and casual. It may be unorganized in traditional agriculture
sector, but in tea, coffee and rubber plantation the trade union is the strongest.
c) Labour not immobile: Labour is mobile even in the developing countries. They move
from village to village, and village to cities. Urban life offers many social and economic
opportunities and attracts villagers. This results in huge number of migration from
village to cities leading to congestion, unemployment, inadequate community facilities
in the urban life.
d) Dualism not a problem of eastern society alone: Higgins argues that dualism exists
not only in eastern societies but highly advance countries like Italy, Canada and the
USA also have the characteristic of dualistic economy.

27
2.3 Vicious Circle of Poverty
The concept of ‘Vicious Circle of Poverty’ was developed by prof. Ragnar Nurkse.
His book, “Problem of Capital Formation in underdeveloped Country”, analysis the reason
for underdevelopment of the countries. According to Nurkse, vicious circle refers to a
circular constellation of force tending to act and react one another in such a way as to keep a
poor country in a state of poverty. According to doctrine of vicious circle in under developed
countries level of income is low; which leads to low level of saving and investment. Low
level of saving and investment leads to low productivity which again results in low income.
2.3.1 Causes of Vicious Circle
Economists have given many causes for the vicious circle of poverty. According to Nurkse,
lack of capital formation is cause of vicious circle of poverty. According to Kindleberger,
vicious circle is caused by the small size of market. The causes for vicious circle has been
classified into three groups
a) Supply side of vicious circle
It shows that in underdeveloped countries productivity is so low that it is not enough
for capital formation. The supply side of vicious circle is illustrated in figure 2.2
Figure 2.2: Supply Side Vicious Circle
Low Income
Income
Low Investment
Low Saving Low Productivity

28
The figure reflects why the underdeveloped countries are poor. Here countries poverty refers
to low real income. Production is low due to low level of capital formation, and capital
formation is low due low level of savings and investment. Again the reason for the low level
of saving is the low level of income.
A man can save only when his real income exceeds consumption. In UDCs, society is
divided into two groups viz. Rich and Poor. Majority of the farmers are poor. Their income is
very low because they are engaged in subsistence farming. The productivity is low because of
unskilled labour, disguised unemployment and immobility of labour. Under this situation a
huge chunk of national product is spent on consumption purpose resulting in lack of saving,
investment and capital formation. The rich people may be in position to save but they spent
their saving on luxury products and import goods. Thus, their demand does not enlarge size
of the domestic market.
b) Demand Side of Vicious Poverty
According to Nurkse, on the demand side, the inducement of investment is low
because of the small purchasing power of the people, which is due to low productivity. The
level of productivity however, is the result of lower level of capital used in production. The
extent of capital formation is low because of lower inducement to invest. The demand side
vicious circle is illustrated in diagram 2.3
Figure 2.3: Demand Circle Vicious Poverty
Low income
Low productivity
Low demande
Low Investment

29
In demand side of vicious circle, the main reason for poverty is the low level of
demand. This consequently leads to a small market size which becomes as an obstacle in the
path of induced investment. Thus, the investors do not establish industries on large scale. The
productivity remains low and so the income.
c) Vicious Circle of Market Imperfections
The existence of market imperfection prevents optimum utilization and allocation of
resources. This leads to underdevelopment which paves to economic backwardness. Human
capital plays an important role in the development of natural resources. But in
underdeveloped countries, because of lower level of knowledge and skills the resources
remain underdeveloped and underutilized. Thus, the vicious circle of poverty is a result of
both sides i.e. supply of and demand for capital. As a result, capital formation remains low,
leading to low productivity and low income. The economy is caught in a vicious circle of
poverty which is mutually aggravating and it is very difficult to break it.
2.3.2 Solution for Vicious Circle of Poverty
I. Solution for supply side vicious circle
a) Increase in saving: Effort should be made to increase saving so as to increase
investment for productive purpose. Expenditures on social ceremonies like marriage,
funerals etc. should be curtailed to increase saving. Expenditures on luxury goods should
be limited and government interventions is necessary to encourage saving.
b) Increase in investment: Only increase in savings will not break the vicious circle of
poverty. The next is to mobilize the saving into productive channels through investment.
Thus, coordination of both short run and long run investment is necessary.
II. Solution to demand side vicious circle
To solve demand side vicious circle, Prof. Nurkse advocated the doctrine of balanced growth
i.e. investment should be done in every sphere of the economy. So, that one sector can fulfill
the demand of another sector. This will broaden the market and induce investment. But, some

30
economists like Hirschman, Singer etc. have advocated unbalance growth for breaking
demand side vicious circle.
III. Other solution to vicious circle
Backwardness of human power is the main obstacle in economic growth of
underdeveloped countries. To increase human power, emphasis on education, technical
knowledge, administrative training, health facilities etc. should be enhanced. This will
increase the efficiency of the workers. Transportation and communication facilities should
also be enhanced and developed.
2.4 Nelson’s Low Level Equilibrium Trap
Low level equilibrium trap model was given by Richard R. Nelson in year 1956, in
his article entitled “A Theory of the Low Level Equilibrium Trap”. Nelson’s theory is based
on Malthusian population theory. That is, with increase in per capita income above the
minimum subsistence level, population also tends to increase rapidly. After the population
growth rate reach an upper physical limit it starts declining with increase in per capita
income. According to Nelson the malady of underdeveloped countries can be diagnosed as a
stable equilibrium level of per capita income at or close to subsistence requirements. Both
saving and investment are low at the stable equilibrium level. If per capita income increases,
it encourages the population growth. The population growth in return pushes down the per
capita income to the minimum subsistence level. This situation is called as low level
equilibrium trap.
Nelson has pointed out four conditions that may bring about the trap
a) A high correlation between the level of per capita income and the rate of population
growth.
b) A low propensity to direct additional per capita income to saving and investment.
c) Scarcity of uncultivated durable lands.
d) Inefficient production methods.

31
Figure 2.4
In the figure 2.4, x axis represent per capita income and y axis represents rate of
growth of population and total income. The point S in the figure denotes the ‘low level
equilibrium trap’ because at this point the population growth curve denoted by PP’ and the
income growth curve denoted by YY’ intersect each other at the zero rate of growth. An
increase in per capita income say from point S to L, the rate of growth of population will be
higher than the total income growth rate. This will result in per capita moving back to initial
equilibrium point i.e. point S. This will happen at all point to the left of Point M.
It is only when the per capita income level increased by a discontinuous jump of more
than SM (see fig 2.4) then only the country can hope to get out from low level equilibrium
trap. At the right side of point M, the total income growth rate is higher than the rate of
growth of population. The possibility to escape from the low level equilibrium trap is either
by increasing the rate of growth of income or by lowering the rate of growth of population or
by both. Further, no action of government should be undertaken until a high level of per
capita income is reached.
S
K
L M N
R U
Y’
P’
P
Y
0
LEVEL OF PER CAPITA INCOME
X
Y
RA
TE O
F G
RO
WTH
OF
PO
PU
LATI
ON
A
ND
TO
TA
L IN
CO
ME
32
Factors that avoid Trap
1. Socio-economic environment should be favorable in a country.
2. Entrepreneurships must be given greater emphasis. Incentives must be given to
produce more and also to limit the size of the family.
3. Equal distribution of income and measures must be adopted to enable
accumulation of wealth by investors.
4. Income and capital should be increased through funds from abroad.
5. There must be government investment programme.
6. Better and improved production techniques must be adopted for efficient
utilization of existing resources.
Criticism of Nelson’s low level Equilibrium Trap
Nelson’s theory is criticized especially on two grounds:
Firstly, the functional relation between level of per capita income, growth rate of
population, and rate of growth in total income is not always rigid. The main cause of
population growth in underdeveloped countries in recent years have been the reduction in
death rate due to better public health care facilities and control of epidemics and endemics,
and not to the prior rise of per capita income.
Secondly, the time element in Nelson’s theory brings some complications. According
to Myint, Nelson’s theory illustrates a set of timeless functional relationship rather than time
series of growth in income and population. The theory has failed to indicate the length of
period for which a country must sustain high per cent growth rate before it can be sure of
breaking the population barrier
2.5 Critical Minimum Effort
The theory of critical minimum effort was propounded by Harvey Leibenstein. This
theory has been formulated in the wake of vicious circle of poverty that keeps
underdeveloped countries around a low per capita income equilibrium state. To break this
vicious circle “critical minimum effort” is need in order to raise the per capita income level

33
so that a sustained development could be maintained. According to Leibenstein, in order to
transform the economy from the state of backwardness to a more developed state, it is
necessity but not always sufficient condition that economy needs a stimulus to growth which
much be greater than a certain critical minimum size.
The basis of critical growth minimum effort is the relationship between three factors
namely, population growth, investment and per capita income. Leibenstein referred
population as income depressing factor. Whereas regarded investment as an income
generating factor or stimulant. The main rationale of Leibenstein’s theory is that the
economic growth in underdeveloped and overpopulated countries is not possible unless a
certain minimum level of investment is injected into the system. Critical minimum effort is
the minimum level of investment that can pulls the economy out of vicious poverty.
Leibenstein’s theory can be explained with the help of Figure 2.5:
Figure 2.5: Leibenstein’s Critical Minimum Effort
In figure 2.5, X axis represent per capita income and induced income growth. Y axis
indicates per capita income and induced income decline. The 450 line shows increase and
decrease in induced income. X’X’ curve shows stimulant and Z’Z’ represent shocks or
depressing factors. At point E, X’X’ curve and Z’Z’ curve intersect each other. This indicates
that there is equality between growth rate of population and income growth. Thus, the income
is caught in vicious circle of poverty. If the income level is raised from ‘Oe’ to ‘Om’, the
b
PE
R C
AP
ITA
IN
CO
ME
A
ND
IND
UC
ED
IN
CO
ME
D
EC
LIN
ES
X’
Z’
Z’
E d
c
k
a g
f
45°
m
X’
e
O PER CAPITA INCOME AND INDUCED INCOME GROWTH

34
increased income is neutralized by the rising population. This brings the income level back to
point ‘E’ again (subsistence level).
Rise in the level of national income where stimulants are stronger than the shocks is
the solution of the problem. Then, the growth of income in the underdeveloped countries
becomes self-sustaining. If the per capita income rises beyond point ‘Ok’ then the economy
can break out from the vicious circle of poverty. The growth in income becomes self-
sustaining. It is therefore necessary that the underdeveloped countries undertake a level of
investment that pushes up per capita income above ‘Ok’. The possibility of growth in the
economy is when the income generating factors turn out to be more powerful than the income
depressing force. A small additional investment may produce a small income but thus will
again bring back to initial equilibrium level. An initial substantially large volume of
investment is necessary to create condition that outweighs the growth of population.
According to Leibenstein, it is necessary to make a critical minimum effort in a single stroke.
Determinants of the need for a ‘Minimum Effort’
Leibenstein has given four factors that determine the need for a minimum effort:
1. Internal economies: It is important to undertake investment above a minimum size
because of indivisibilities in factors of production.
2. External economies: According to Leibenstein, interdependence of industries mainly
causes external economies. Industries depend on each other. So, if one industry has to
exist, the another industry has to exist. If there were no indivisibilities, with any level of
investment balanced growth could be achieved.
3. To overcome income depressing factors, investment above certain minimum size is
necessary.
4. The cultural and institutional attitudes that exist in the in the backward countries are the
attitudes that inhibit growth. It is necessary to have an outlook in which success is seen
by market performance which is determined by rational rather than traditional or
conventional consideration. Thus, to break away from the traditional and conventional
attitudes and inculcate new attitudes, a large minimum effort should be undertaken.

35
2.6 Paul Baran’s Theory of Underdevelopment
Paul Baran pioneered the theory of underdevelopment in his work “The Political
Economy of Growth” in year 1973. Baran in his theory explains the problem of
backwardness. He argues that underdevelopment of the backward countries is a result of the
fact that the richer nation exercise dominance and imperialist assertion over the less
developed or backward countries.
Barans views on Underdevelopment
The capitalist or the develop nation due to it’s inherit characteristic exploits the
backward nation. It is the capitalist opinion and interest to keep the third world countries as
an indispensable hinterland. The third world countries were the producers and source of raw
materials for the rich nations. And therefore the third world countries extract economic
surplus for the capitalist. According to Baran the colonizers were, “rapidly determine to
extract the largest possible gains from the host countries and to take their loot”. Being a
promoter of Marxist approach, Baran argues that the economic stand off between the rich
and the poor can be narrowed through socialist economic system. He was of the view that the
social class system of the backward countries was responsible for their dependent situation.
Thus, the backward countries were stuck between feudalism and capitalism. And the third
world countries suffered from worst aspect of both systems. Baran has given four factors that
raise the preconditions for raising capitalism in the Western Europe; viz. the raise in
agriculture output; massive displacement of farmers which created the potential for an
industrial proletariat; the extension of the division of labour which created a class of
merchants and artisans located in towns; and the accumulation of capital in the heads of the
rising class of merchants and wealthy peasants.
According to Baran there are four sectors that generate and utilize economic surplus
in the third world countries viz. the rural sector, industrial sector, service sector and the state.
Among these sectors, the rural sector contributes 50 percent of the total national product in
underdeveloped countries. Thus, rural sector was the most important sector for generating
and utilizing the economic surpluses. The economic surplus is squeezed out of laborers by
landowners, moneylenders, merchants and out of peasantry. In underdeveloped countries, this
surplus is not utilized in a productive way to expand the industrial output. The economic
36
surpluses were largely used for excess consumption by the land aristocracy; which makes
mechanizing the agriculture risky and unprofitable. Other factors like high price of machine,
high interest rates, cheap labour, and unstable agriculture price etc. obstructed the agricultural
productivity of the backward countries. Again the small land holders have no incentive to
increase productivity because of smallness of their plots. The only way out is to start an
agrarian revolution like the western Europe but the backward countries do not have the
condition for this to take place. It is because of absence of indigenous bourgeoisies and
existence of land aristocracy, who benefitted from the existing modes of exploitation.
In service sector, the economic surplus is appropriated by the merchants,
moneylenders, trading stand operators, peddlers, dealers etc. whose income represents
transfer of surplus from other class or a diversion of surplus that would otherwise be
available to other classes. Baran termed this class as “socioeconomic stratum” whose size
was very large. According to Baran there is a significant drain on capital accumulation
without any significant compensating social contribution. The surplus earned from service
sector remains within this sector and does not enter industrial production.
For industrial sector, Baran was of the view that this sector was largely self-expanding
because under capitalism industries have the capacity to create its internal market. The
economic surplus from industrial sector is very large, but much of it flows back to capitalist
country as royalty payment, repatriated profits and as disguised foreign remittances. The
portions of the economic surplus appropriated by local bourgeoisie were largely spent on
luxurious consumption, construction of rural and urban residents and servants, if not invested
abroad.
The appropriation of surplus by the state represents a transfer of surplus from other
groups as well as an addition to surplus in those cases where it is obtained by a corresponding
reduction in consumption. According to Baran, surplus by the state represents large
expenditure on “maintenance of sprawling bureaucracies and military establishments”
representing a tremendous waste.
Baran, believes that a capitalist pattern of development is completely exploitative.
Being completely socialistic in view, he considers socialistic pattern of development which is
free from exploitation.

37
2.7 Myrdal's Theory of Cumulative Causation
Prof. Gunnar Myrdal gave the theory of ‘Circular Causation’ in his article, ’Economic
Theory and underdeveloped Regions’ in year 1957. Myrdal was of the view that economic
development result in a circular causation process which again result in rapid development in
the rich or developed economy while the backward nation tends to be poor and remain
behind. According to Myrdal, the ‘Backwash Effect’ is prominent and the ‘Spread Effect’ is
dampened in underdeveloped countries. Myrdal’s theory is an explanation of the
backwardness of developing and underdeveloped nations. He argues that in the context of
development both economic and social sectors bring tendencies towards disequilibrium.
Thus, he rejects the assumption of the traditional theory viz. assumption of stable equilibrium
and the assumption that only economic factors are related to economic change. Myrdal
replaces the traditional assumption of stable equilibrium with the hypothesis of circular and
cumulative causation.
The Myrdal Thesis
Prof. Gunnar Myrdal theory of cumulative causation is a theory of economic
development that explains why inequalities exist in the national and international plane. He
tries to explain his theory with backwash effect and spread effect concepts. In the words of
Myrdal, “Backwash Effect are all relevant adverse changes … of economic expansion in
locality. I include under this label the effects viz. migration, capital movements and trade
resulting from the process of circular causation, between all the factors, ‘Non-Economic as
well as Economic’. The spread effect on the other hand refers to certain centrifugal “Spread
Effects” of expansionary momentum from the centers of economic expansion to the other
regions”. Thus, according to Myrdal regional inequalities arises due to strong backwash
effect and weak spread effect in underdeveloped countries.
1. Regional Inequalities
Myrdal’s thesis starts with the tendency towards regional inequalities in a single
country. Developing regions exerts a strong agglomerating pull, accelerating their rate of
growth which results in increasing stagnation or decline in other regions of the country.
According to Myrdal, it is capitalist class that aims at maximizing profit. It is the profit that

38
triggers development of regions where profit is high; while the other regions remain
underdeveloped. The process of development does not itself generate any equalizing forces as
a result; severe regional disparities may be planted. It is the free market forces and profit
motive in the capitalist system that leads to regional inequalities. In this regards, he observed
that if things were left to market forces unhampered by policy interferences, industrial
production, banking, commerce, insurance, shipping and almost all other economic activities
in a developed economy tends to give a bigger than average return. In addition, science, art,
literature, education, and high culture generally would cluster in certain localities and
regions, leaving the rest of the country more or less in darkness. Thus, regional inequalities
are accentuated when some localities grow at the expense of the other regions.
a) Backwash Effect of Migration, Capital Movement and Trade
The migration of people from backward regions results in regional imbalances. The
more developed region or economy will attract young people from other parts of the country
which are economically backward. This will result in making the developed region more
develop and depress the economic activities in the backward region from where people
migrate.
Capital movement as a consequence of the free market forces leads to increase in
regional imbalance. Capital is shifted from poor region to rich or developed region where
high rate of return already exists. It is because of better and higher opportunities for
investment that demand for capital in developed region is high. The scope of better
investment opportunity in the progressive region may result in capital shortage in backward
regions.
Another dis-equalising force is trade which act in favor of the developed countries
and against the underdeveloped nations. The developed regions have better competitive
advantages and market. The strong technological base and large size of the market can easily
out power the market of the backward regions. Again, not only in manufacturing and other
non-Agricultural sector, but also the agriculture sector in the underdeveloped region shows a
much lower level of productivity than the developed nations. Therefore, trade results in the
development of industries in the already developed regions, and may ruin the existing
handicrafts of backward regions.

39
b) Spread Effects
The growth of industrial regions also has some positive effects on other areas too.
When a region experience advantage regarding demand, market, technology etc. from
developed regions, these favourable or positive effects are called Spread Effects. This will
raise the backward regions near to developed. It is natural that the regions around a model
center of expansion gain from increasing outlets of agriculture products. The spread effect
tries to neutralize the backwash effects. In words of Myrdal, ‘the spread effects in
underdeveloped country are weak and they are not capable of balancing the backwash effects
and regional imbalances’. Therefore, the outmost reason for backwardness of a country is
very weak spread effect and a very strong backwash effects. Whereby, in cumulative process
poverty becomes its own cause. It is not able to equalize the backwash and spread effects. In
this regard Myrdal quotes two broad relations
a. Regional inequalities are much wider in the poorer country than in the richer country.
b. The regional inequalities are increasing in poor countries and diminishing in richer
countries.
Higher the level of economic development of a country, stronger will be its spread
effects. It is because development is always characterized by improved and better
transportation and communication, higher level of education and more dynamic communion
of ideas and values, which will strengthen the forces for the centrifugal spread of economic
expansion of development.
c) Role of State
Government intervention is very necessary for strengthening the spread effects. The
government should adopt egalitarian policies to reduce backwash effect and strengthen
spread effect in order to reduce regional inequalities and raise the tempo of continuous
economic development.

40
2. International Inequalities
Rich and advanced countries are becoming richer while underdeveloped countries are
becoming more backward. There are no equalizing forces operating to correct the inequalities
in economic development. Myrdal believes that international trade and capital movement are
the ways through which development can be achieved. International trade may have strong
backwash effects on underdeveloped countries. The developed countries have a large base of
manufacturing industries which in return have a strong spread effect. The developed
countries industrial products are exported to underdeveloped countries at a cheaper rate. This
results in underdeveloped countries producing primary products for exports. The demand for
the primary products in the world market is inelastic and the importers of the primary
products will pay cheaper rates since its demand is inelastic. Therefore, the products of the
underdeveloped countries suffer from price fluctuations. The underdeveloped countries thus,
specialized in production of primary products for exports under free trade system. Thus,
international trade with advance countries results in wrong specialization which greatly
hampers the growth of specialization in underdeveloped regions and leads to rise in
inequalities. Therefore, Myrdal was of the view that new theories of international trade to
develop and improve the economies of the underdeveloped countries as the need of the hour
and should be given emphasized.
Capital movement has failed to remove international inequalities. Advance countries
offer investors goods, profit and security. But capital will stun those underdeveloped
countries. The normal flow of capital is not from the developed to backward countries but it
tends to be in reverse direction. In the absence of exchange controls, capital will flow from
underdeveloped to those countries that are progressive, international migration between
underdeveloped and developed countries could not resolve the problem of international
inequalities.
Conclusion
Myrdal’s thesis marks a departure from other development theories. He has described
how combined national and international forces keep the underdeveloped countries in the
cumulative process and where poverty becomes its own cause. It is a fact that
underdeveloped countries have a dominant backwash effects and weak spread effects.
41
International and national forces tend to perpetuate them and thus accentuate regional and
world inequalities. The export potential of underdeveloped countries is cramped because of
free play of market process and trade
2.8 Key Words
Dualism : Existence of traditional and advance sector
Equilibrium trap : a situation where in the equilibrium is static
Vicious : deplorable
Critical Minimum : a little above the minimum
2.9 Short Questions
1) Define vicious circle of poverty?
2) What is spread effect according to Myrdal?
3) What do you understand by backward sloping supply curve of labour?
4) Define shock and stimulants?
5) Define social dualism?
2.10 Long Questions
1) Discuss Boeke’s dualistic theory of underdevelopment.
2) Discuss the causes of vicious circle of poverty in details.
3) What is Nelson’s low level equilibrium trap? Illustrate your answer.
4) What are the factors responsible for regional and international inequalities? Support
your answers with Myrdal’s theory of circular causation.
5) Discuss Baran’s view on underdevelopment.
2.11 Suggested Readings
Mishra, S.K and V.K Puri (2012). Economics of Development and Planning. Mumbai:
Himalaya Publishing House.
Thirwall, A.P, (2011) economics of development Palgrave Macmillan, ninth edition.
Barone, C.A., Marxist Thought on Imperialism: Survey And Critique, pp 86-92
42
UNIT- III
CLASSICAL, SCHUMPETERIAN AND MARXIAN THEORIES OF GROWTH
Structure
3.0 Introduction
3.1 Objectives
3.2 Adam Smith’s theory of Growth
3.3 Multhus Theory of Growth
3.4 Ricardo’s Theory of Growth
3.5 Schumpeter’s Theory of Growth
3.6 Marxian theory of Reproduction
3.7 Key Words
3.8 Sample Short Question
3.9 Sample Long Questions
3.10 Suggested Readings
3.0 Introduction
The growth theories are as old as economics itself. The great classical economists
discussed different factors those leads to the growth and development of the European
countries. The most famous early classical economist was Adam Smith. In this chapter, we
have discussed the growth theories put forwarded by three famous classical economists Adam
Smith, David Ricardo and Malthus. Schumpeter’s theory of innovation is also discussed. At
the end of this chapter, the Marxian theory of development is analysed.
3.1 Objectives
In this unit the learners are expected to know about the classical growth theories
including the Schumpeter’s analysis of growth under capitalism along with the Marxian
analysis of capitalist society.

43
3.2 Adam Smith’s theory of Growth
Adam Smith is known as father of economics. He gave his ideas about economic
development in his well-known book, “An Enquiry into the Nature and Causes of Wealth of
Nations” (1976). He advocated the policy of laissez faire, that is, non-intervention of
government in economic activities of the individuals. He laid stress on individual freedom in
conducting their economic affairs without any obstructions and restrictions by the
government. He advocated free trade among nations of the world and urged that all
restrictions on foreign trade should be removed to promote international specialization so as
to increase the incomes of the nations. The crucial aspects of Adam Smith’s development
theory are – division of labour and capital accumulation. We explain below these factors in
detail.
Division of Labour
A very important contribution made by Adam Smith to the analysis of the factors that
bring about expansion of output is the division of labour. Among the benefits of division of
labour he refers to increase in dexterity, saving in time, and invention of better machines and
appliances.
One of the most significant contributions to economics by Adam Smith was to
introduce the idea of increasing returns caused by division of labour. According to him, the
gain from division of labour was a basic feature of social economy otherwise everyone, like
Robinson Crusoe, would have to produce everything they want for themselves. Given the
crucial significance of increasing returns based on division of labour, productivity of labour
rises with the increase in the size of market. Along with division of labour it is acceleration of
investment or capital accumulation that leads to the increase in growth of output and living
standards of people. According to Adam Smith, industries generally have greater scope for
division of labour or specialization than agriculture and, therefore, in rich developed
countries industrialization had taken place to a greater extent.
Adam Smith points out that the degree of division of labour is limited by the extent
of the market. Division of labour is profitable only if there is adequate market for the goods
produced. If the extent of market is small, it will not be profitable to produce on a large scale

44
which requires introducing a higher degree of division of labour or specialization. This is
because if size of market for a good (i.e., the magnitude of demand for it) is quite small, it
will not be profitable to introduce a higher degree of division of labour along with the use of
large capital stock. In the absence of adequate demand, only a little degree of division of
labour or specialization can be used and a good deal of capital stock is likely to remain
underutilized. It is in this context that he advocated for free international trade which leads to
the increase in the extent of market for goods and makes their production on a large scale
profitable and induces the capitalist class to accumulate more capital.
Accumulation of Capital
As a means of economic development, Adam Smith gave an important place to saving
and accumulation of capital. The greatest obstacle to economic development is the deficiency
of capital. In this respect, they are caught up in a vicious circle of poverty. Productivity of
people is low because the capital stock is small; capital stock is small because savings of the
people are small and savings are low because incomes of the people are small due to their
low productivity. The way out of the vicious circle, according to Smith, is if capitalist class
that saves most of their profits and invest in capital accumulation for accelerating economic
growth. In fact, Adam Smith assumed that capitalist class save a very large proportion of
their profits.
Besides, capital accumulation, according to Smith, facilitates a greater degree of
division of labour which causes productivity of labour to rise. Without capital accumulation
the extent of division of labour cannot be increased much. Increase in capital formation leads
to the production of different types of specialized equipment which are operated by different
classes of workers who are skilled and specialized in various tasks. Thus, capital
accumulation along with division of labour leads to the increase in industrial output and
employment.
The Process of Development
Adam Smith points out that the development process once started gathers momentum
and becomes cumulative, that is, it feeds upon itself. This happens in the following ways.
First, increase in saving causes more accumulation of capital which in turn facilitates a great

45
degree of division of labour. The division of labour raises labour productivity, which
ultimately leads to increase in income. Second, the higher incomes due to the capital
accumulation and a higher degree of division of labour lead to the increase in the size of
market or demand for goods. This expansion in demand for goods causes increase in national
output and income which brings about more saving and further investment and capital
accumulation. In this way spiral of economic growth rises higher and higher. Third, the
increase in size of market and availability of capital induces improvement in technology.
This cumulative process of development provides a cheerful note for the developing
countries. That is, if they start the development process in right earnest they can be sure of
further and rapid economic development and can catch up with the presently advanced
developed countries. According to him, the natural course of development is first agriculture,
then industry and finally commerce. Agriculture creates a surplus and increases the
purchasing power of the people which generates demand for industrial products. It also
supplies raw materials for industries. Agricultural growth thus provides a base for industrial
development.
3.3 Multhus Theory of Growth
Robert Malthus propounded his famous “Theory of Population”. It is well to
remember that Malthus had also some important things to say about economic development.
The problem of development, according to Malthus, lies in explaining why the actual gross
national product differs from the potential gross national product. He thus points out the way
in which the potentialities of economic development in a country should be realised. This can
be done by larger production and fairer distribution.
Malthus contends that the process of economic development is not automatic. Rather
conscious, deliberate efforts are needed to bring it about. For instance, Malthus explains that
mere increase in population cannot by itself lead to economic development unless there is
increase in effective demand; which is the anticipation of the Keynesian doctrine. He rejected
Say’s Law which says “supply creates its own demand”.
Malthus’s important contribution is in showing that savings in the sense of not
consuming is a mere negative act and instead of creating more demand it will lead to a
decline in effective demand. Only savings which are furnished by increased gains and are

46
invested create an effective demand. Malthus brings out an important fact that in advanced
economy consumption, saving and investment all should expand simultaneously.
Malthus attaches great importance to the accumulation of capital for economic
development. He regards capital as indispensable to development. Besides, Malthus
underlined the importance of foreign trade for speeding up economic development. Foreign
trade provides incentives for investing, since it leads to the extension of the market for the
goods produced and for greater division of labour resulting in increased output.
There is another important fact brought out by Malthusian analysis of economic
growth, namely, the structured change that takes place in the process of economic
development i.e., a decline in the relative importance of agriculture as the economy moves
forward. The economic development in developing countries is regarded as synonymous with
the development of industries. Naturally, agriculture is eclipsed by the speedier development
of industries.
Of far greater importance than what has been pointed out above, is the anticipation by
Malthus of the theory of ‘dualism’ as applied to underdeveloped economies. He envisaged
the economy as consisting of the two major sectors, viz., the agricultural sector and the
industrial sector. His analysis of the interrelation between these two sectors is quite
interesting and enlightening. He brings out an important truth that when one of these sectors
lags behind, it retards the development of the other sector. The development of the industrial
sector of underdeveloped countries is limited by the poverty of the agricultural sector. This is
due to the fact that the lack of purchasing power of the rural masses reduces effective demand
in the economy and retards its growth.
Assessment of Malthus’s Contributions:
There is no doubt that Malthus made a valuable contribution to the theory of
economic development. His emphasising the importance of effective demand and its relation
to saving and investment are indeed noteworthy for their modern touch. A great deal of what
he wrote on the subject is applicable to an underdeveloped economy.

47
It has been pointed out by the critics of Malthus’s theory of economic development;
he concentrates on explaining the factors which hinder growth rather than the factors that
promote economic progress. However, some elements of his theory make positive
contribution to the growth process. For example, he considers production and distribution as
the two grand elements of economic growth. The distribution of production is as important as
production itself or sustained economic development. He also gives importance to capital
accumulation in bringing about economic development.
At the same time, he emphasises that the capital accumulation will choke off if it is
not possible for the additional goods to find consumers. That is, he points to the significance
of effective demand for sustained accumulation of capital. Increase in effective demand,
according to him, is as important as increase in production. He thinks that excessive
parsimony will reduce aggregate demand leading to widespread depression and
unemployment. He recommends a more egalitarian system of distribution in order to increase
effective demand. He also recognizes the importance of non-economic factors in economic
development.
Though Malthus is more well-known for his theory of population than his
contribution to growth economics. According to his population theory, population increases
so rapidly as to outstrip the food supply due to the operation of law of diminishing returns
which has largely been falsified owing to the rapid increase in agricultural productivity.
However, it is very helpful in probing the problem facing the labour-surplus developing
countries of today. Thus, Malthus’s contribution to economic growth contains several
elements that are relevant to the developing economies.
Limitations of Malthus Theory of Development
(a) Capital accumulation leads inherently to secular stagnation is not correct. In
reality, capital accumulation does not lead to a reduction in demand for consumer
goods and fall in profits. Along with capital accumulation, there is an increase in
wages, profits and aggregate national income and so does the demand for
consumer goods.

48
(b) Malthus believed that it is the only landlords who save. But this is an absurd
because the main source of savings in the present day society is the income
earners and not profit earners.
(c) Malthus argues that the process of capital accumulation leads inherently to
secular stagnation and this wrong notion that arises from the interpretation of
Say’s law. For Malthus, there is possibility of permanence under consumption of
all commodities. But the fact is that the under consumption is not permanent
phenomenon. Therefore, secular stagnation is not inherent process of capital
accumulation.
(e) He suggests that the unproductive consumer tries to overcome under consumption
and increase effective demand. This remedy tantamount to giving doles to
workers and deliberately supporting idle persons. Such a measure slows down the
rate of capital accumulation.
3.4 Ricardo’s Theory of Growth
Ricardo was the first economist who presented the classical thought in a consistent
body of economic analysis. His ideas were embodied in his book, The Principles of Political
Economy and Taxation (1817). Although Ricardo is well known for his theory of rent; there
are also ideas in his writings which throw light on economic development.
Diminishing Returns to Labour and Economic Growth
According to Ricardo, economic growth depends on capital accumulation. And capital
accumulation depends on reinvestment of profits. Profits earned by the capitalists depend on
the growth of agricultural output, especially food. Ricardo emphasized on diminishing returns
to land, which occur as more doses of labour are used in agriculture.
It is diminishing returns in agriculture that causes food prices to rise and result in rise
of wages of workers. It leads to decline in profit and investment, and the economy reaches a
stationary state. According to Ricardo, there are three agents of production that participate in
the process of growth of output. The capitalist hires labour and land and plays a key role in
the process of economic development. Ricardo uses the term capitalist in the sense the
modern economists use the term entrepreneur. In the Ricardian model capitalist undertakes

49
production, pays rent to the landlords and wages to the workers employed, and the residual is
his profits. Ricardo stated that wages were determined at the minimum subsistence level of
the workers. If wages rise above the subsistence level, population increases and brings them
to the level of subsistence. Similarly, wages cannot go below subsistence level; as it is the
minimum wage to maintain the lives of the labour.
Let us now explain Ricardian model of growth in detail. Ricardo makes two-sector
analysis of the economy. He draws distinction between the agricultural sector and the
industrial sector. He assumes that agriculture is subject to law of diminishing returns while
industry is subject to constant returns. Further, Ricardo regarded real wages to be fixed.
When labour is employed in land, they produce more than its subsistence. The difference
between the output and subsistence wage is the surplus. This surplus output is shared between
the land lord in the form of rent and the entrepreneurs in the form of profit.
Let us first consider the agricultural sector. As more and more doses of labour and
capital are employed, due to diminishing returns to agriculture, marginal product of labour
and capital would diminish. The capitalist employer will employ labour to the extent where
marginal product of labour is equal to wage. The intra-marginal doses of labour employed
would produce surplus over the expenses incurred on them. This surplus production is the
source of capital, which will be reinvested in future for further production. The greater the
volume of saving out of the surplus, the faster will be the rate of capital accumulation and
more rapid the growth of output and employment. Graphically, the growth of agricultural
output and employment of labour in Ricardian model is depicted in Fig. 3.1.

50
Figure 3.1
In Figure 3.1 output of labour is depicted on the Y-axis and the amount of labour
employment on the X-axis. AP and MP are average product and the marginal product curves
which will remain fixed as land is assumed to be fixed. If OP is the expenses on a dose of a
labour and capital, then OL labour would be employed. It can be seen from the Fig. that the
employment of OL labour produces the total output equal to OQHL. The total expenses of
production incurred on capital and labour are equal to OPEL. Thus, it is clear that labour
produces surplus over costs of cultivation incurred on labour and capital. The surplus is equal
to PQHE. This surplus represents the rent which will be obtained by the landlords, the owners
of the land. OW represents the minimum level of subsistence wage which is paid to the
workers, and OWTL is the share of labour in the agricultural output. The remaining
agricultural output WTEP is the profits made by the capitalist farmers.
According to Ricardo, profits earned by the capitalist farmers will be saved and
reinvested. It leads to increase in both output and employment. Since the supply of land is
fixed, marginal and average product curves of labour will remain unchanged. Due to
diminishing returns, with the increase in more and more of employment of labour, its
marginal product of labour will go on falling till it becomes equal to minimum subsistence
level of wages OW. As a result, profits will disappear and rent of landlords will increase.
O
E
E
MP
L
M
Y
Y O
UTP
UT
(CO
RN
)
W
SUBSISTENCE Wage
WAGE
N

51
Total agricultural output OSNM will be distributed between wages and rent, and profits will
be fallen to zero. Ricardo thought that the landlords who receive rent do not save anything.
Growth of the Industrial Sector
It should be noted that the food-grain surpluses generated in agriculture are essential
to employ labour in the industrial sector. In the industrial sector the stock of fixed capital
plays an important role in the growth of output and employment, while in agriculture the
amount of land plays such role. In the agricultural sector, land as a whole is fixed and
diminishing returns occur when more doses of labour is used. Increase in the stock of fixed
capital in the industrial sector is possible since it is made by man. But workers engaged in
building up of capital stock must be paid in real terms. As the stock of capital increases in the
industrial sector marginal productivity curve of labour in the industry sector will shift
upward. It implies that more labour will be employed at the minimum subsistence level of
wages through capital accumulation.
In the short run real wages may rise above the minimum subsistence level, but this
will lead to the increase in population and labour force. As long as food-grains are available
at the same price, the minimum subsistence level of wage in terms of money will remain
constant. As a result, supply of labour will be perfectly elastic at the minimum subsistence
level of wage. However, if the prices of food-grains rise due to the operation of diminishing
returns in agriculture, the wages in the industrial sector will rise. But, the wage rate in terms
of corn or wage goods will remain the same and the labour supply will be perfectly elastic at
this rate due to the growth in population and labour force.
However, availability of wage-goods surpluses is a constraint on the growth of
industrial sector. If sufficient food surpluses are not forthcoming and demand for them
increases as a result of the growth in labour employment in the industrial sector, the prices of
food-grains will rise. The increased prices of food-grains will raise the subsistence wage rate
in terms of money which will reduce the surplus of the capitalists. Since Ricardo and others
assumed that agriculture was subject to diminishing returns, the prices of food-grains will rise
as cultivation on land is increased.

52
Therefore, as a result of the rise in the prices of the food-grains and thereby the rise of
the wages of labourers will reduce the profits made by the capitalists in the industrial sector.
The rate of profit earned on the capital will go on declining till it becomes zero. When the
rate of profit becomes zero, further capital accumulation in the industrial sector will cease
and in this way a stationary state will be reached. Before the stationary state is reached, the
level of output and employment of labour force during any given period in the industrial
sector will depend on the stock of fixed capital on the one hand and the wage goods supply
forthcoming from the agricultural sector on the other.
From the above, it is thus clear that in Ricardo’s model the growth of output and
employment depends on capital accumulation on the one hand, and the available supplies of
food-grains or wage goods on the other which are constrained by the operation of diminishing
returns in agriculture.
Critical Evaluation of Ricardo’s Model:
We have seen above that Ricardo, emphasised on the wage goods as determinants of
growth of output and employment in an economy. In the growth of output and employment,
they ignored the role of aggregate effective demand.
However, in the context of developing countries, his emphasis on wage goods as
determinant of income and employment is quite right. In developing countries like India, the
cause of mass unemployment and disguised unemployment is to be found in the lack of fixed
capital and other cooperating factors and the supplies of the wage goods on the other and not
in the lack of aggregate demand. Therefore, a solution to the unemployment problem in
labour-surplus developing countries lies in the accumulation of fixed capital as well as the
expansion of wage goods supply in the economy. Keynesian remedy of curing unemployment
through the increase in aggregate demand by expansionary fiscal policy financed by creating
new money will not solve the problem of unemployment and disguised unemployment in
developing countries.
However, it may be pointed out that the contention of Ricardo that agriculture is
subject to the law of diminishing returns that will ultimately raise the prices of food-grains
and reduce the profits in the industrial sector which will ultimately result in the occurrence of

53
the stationary state, is too pessimistic and unwarranted. Thus, Ricardo underestimated the
role of technological progress in raising production which can suspend the operation of the
law of diminishing returns. The increase in agricultural productivity due to technological
progress can prevent the rise in prices of food-grains and therefore the reaching of the
stationary state.
Ricardo’s theory of development believes that all increase in the stock of fixed capital
leads to an increase labour employment. It ignored the labour-displacing effect of capital
equipment in which improved technology is embodied. Actually, much of technological
progress made in advanced developed countries has been of labor-saving nature; which
ultimately displace labour.
Ricardo was also not right in ignoring the effective demand in determining growth of
income and employment. Ricardo thought that development process would not be constrained
by lack of effective demand as he believed in Say’s Law that supply creates its own demand.
His predictions regarding the advent of stationary state have not turned out to be true, nor are
about the changes in relative shares of the various agents of production borne out by history.
The two fundamental principles in his model of economic development, viz., the principles of
population and the law of diminishing returns, are only partially correct. All the same, it has
to be admitted that he made a significant contribution to the theory of economic growth.
3.5 Schumpeter’s Theory of Growth
Schumpeter’s theory of development is also known as the innovation theory of
development. This theory assigns paramount role to the entrepreneur and innovations in the
process of economic development. According to Schumpeter, the process of production is
marked by a combination of material and immaterial productive forces. The material
productive forces arise from the traditional factors of production, viz., land and labour, etc.,
while the immaterial set of productive forces are conditioned by the ‘technical facts’ and
‘facts of social organization’. The Schumpeterian production function can be written as –
Q = ƒ [k, r, I, u, ν)
Where, Q stands for the output, k for capital, r for natural resources, and l for the
employed labour force. The symbol u represents the society’s fund of technical knowledge

54
and ν represents the facts of social organization, i.e., the socio-cultural environment of the
economy.
The above function shows that the rate of growth of the output depends upon the rate
of growth of productive factors, the rate of growth of technology and the rate of growth of
investment friendly socio-cultural environment. Schumpeter held that the alterations in the
supply of productive factors can only bring about gradual, continuous and slow evolution of
the economic system. On the other hand, the impact of technological and social change calls
for spontaneous, discontinuous change in the channels of output flow.
Schumpeter regarded land to be constant. The growth component will, therefore,
include only the effects of changes in population and of increase in the producer goods. But
Schumpeter further maintains that there does not exist any a priori relationship between the
changes in population and the changes in the flow of goods and services. In other words,
Schumpeter considers the population growth to be exogenously determined. The increase in
producer goods results from a positive rate of net savings. The major part of savings and
accumulations are attributed by Schumpeter to profits. According to him, the profits can arise
if innovations are introduced. Hence ultimately it is the change in the technical knowledge
(i.e., variable u) which is responsible for any change in the stock of producer goods, i.e., the
rate of capital accumulation directly depends on the rate of technical change. In other words,
according to Schumpeter, the growth of output is geared by the rate of innovations.
No doubt, Schumpeter holds that the trend of economic growth shall be fixed by the
exogenous variable of population growth, yet according to him, the process of economic
development is synonymous with discontinuous technical change, i.e., innovations. The agent
which brings about innovations is called by Schumpeter as entrepreneur. Thus, entrepreneur
becomes the pivot of Schumpeter’s model.
According to Schumpeter, the entrepreneurs play a key role in economic
development. The credit for innovations and the outburst of economic activity goes entirely
to the entrepreneur. According to him innovation may be of five types:
(i) Introduction of a new good,
(ii) Introduction of a new method of production,

55
(iii) The opening of a new market,
(iv) The discovery of a new source of supply of raw materials or semi-manufactured
goods, and
(v) Introduction of a new organisation in an industry.
In a world characterised by a high degree of risk and uncertainty, only a few people
have the exceptional ability and daring will be able to undertake innovations and launch
enterprises and exploit opportunities for profit. But these entrepreneurs are not only lured by
profit but are also motivated with a desire to found a dynasty in the business world or a desire
for conquests in the competitive world or have the joy of creating. Thus, in the
Schumpeterian analysis, the role of the entrepreneur is a determining factor of the rate of
economic growth. In his absence the growth rate is bound to be slow.
The supply of entrepreneurs depends not only on the rate of profits (which is obvious)
but also on the favourable social climate. They will appear and continue only in a society
which honours them, where prestige is attached to them and the social rewards or recognition
they are able to earn. Any tendency to squeeze profits, increase taxes, intensify welfare
programmes, strengthening of the trade union movement or measures of redistribution of
income will deteriorate the climate for investment and so for economic development.
Schumpeter’s starting point in the “circular flow” is a stationary equilibrium in which there is
no investment, population growth is at a standstill position and there is full employment. But
there are numerous opportunities in business which the entrepreneurs are quick to exploit and
innovations are undertaken. As the economy is in equilibrium, saving is equal to investment.
So, when the innovators make investment, he does it bank loan. The banks provide loans to
the innovators through credit creation. Thus, according to Schumpeter credit creating plays an
important role in economic development.
The success of the original innovators attracts many others who follow them.
Economic activity becomes more and more brisk and the boom gathers momentum with the
result that prices and money incomes rise. There is then the secondary economic wave
‘imitative investment’ superimposed upon the earlier one, i.e., ‘innovational investment’.
But soon follows the process of creative destruction. The boom gives way to slump or
recession. Completion of innovations brings in a large supply of goods which cannot be
marketed at profitable price. There are forced bankruptcies since the banks call back loans.

56
The repayment of bank loans accentuates deflationary forces. Business risks scare away the
prospective entrepreneurs. In this unfavourable climate, the innovational activity comes to a
halt. After this painful process of adjustment in which weak enterprises are liquidated, the
businessmen find conditions again ripe for a further spurt of entrepreneurial activity. The
economic activity is resumed at a higher equilibrium. This is how the circle of development
process is completed. There is a new wave of innovations and the development cycle repeats
itself.
Critical Evaluation of Schumpeter’s Theory
Schumpeter has been a great ‘theorist’ whose writings contain brilliant thoughts and a
deep insight into the working of an economy. However, his analysis of the entrepreneurial
innovations is not applicable to modern conditions in which the act of invention and
innovation is carried on not by individual entrepreneurs but by large corporations as a routine
affair. It is not possible to identify entrepreneurs who introduced many actual innovations.
Critics point out that what Schumpeter gives is the theory of business cycles and not an
analysis of economic development. Even Schumpeter’s analysis of business cycles can be
accepted only with some modifications to suit modern economic conditions. According to
Schumpeter, crisis in capitalism is brought about by maladjustment caused by waves of
innovations. But big businesses in modern times can absorb these waves and produce steadier
and larger expansion of the total output.
The assumption that innovations are financed by borrowing from credit creation by
the banks is also not very realistic. It is a well-known fact that most of the bank loans are
short-term loans whereas the implementation of innovations requires long-term finances.
3.6 Marxian theory of Reproduction
Karl Marx, the father of scientific socialism, is considered a great thinker of human
history. He is regarded as the father of history who prophesied the decline of capitalism and
the advent of socialism. He is also known as the great enemy of capitalism. His famous book
‘Das Kapital’ is known as the Bible of socialism (1867). He presented the process of growth
and collapse of the capitalist economy. Some of his views relating to economic growth are:
57
Historical stages of growth
Marx has analyzed the main stages which have taken place in human history.
According to him, all historical events are the result of a continuous economic struggle
between different classes in society. According to Marx, the mode of production which
determines the general characteristics of social, political, and spiritual processes of life is the
main cause of social change. As methods and techniques of production change the social
relations which follow them also change. Against this background Marx describes four
stages in history. They are: Primitive Communism, Slavery, Feudalism and Capitalism.
Primitive communism is the first stage. It was characterized by a classless society,
where all factors of production were owned by the society and people lived in groups.
Gradually a society having a few masters and many slaves remaining under the control of
masters came into existence. It is the second stage of development. With the development of
productive forces, feudalism replaced slavery. Under feudalism there were two classes
namely, feudal lords and serfs. On account of friction between these two classes’ namely
feudal lords and serfs this system comes to an end. Serfs agitate and get emancipated from
feudal lord ultimately feudalism gives way to capitalism. Under capitalism, merchants and
entrepreneurs become leaders in the economic field. Industrial revolution and other changes
which took place at the same time gave a new phase to the economic system which was
taking a definite shape at that time. In a capitalist society, the capitalist controls the means of
production and the workers depend on the capitalist for work. The main aim of the capitalist
is to maximize their profits. They pay low wages to the labour, and made them to work for a
longer hour. As exploitation increases conditions become ripe to overthrow of capitalism by
the united proletariat. Thus, increasing antagonism between capitalist and workers creates
conditions for the destruction of capitalism, and the emergence of socialism. Thus, class
conflict leads to the collapse of capitalism and the rise of socialism. The inherent
characteristics of capitalism are responsible for its own destruction. Under socialism,
economic condition of the working class is improved according to Marx. Communism
emerges as the last stage of socialism. Under communism: poverty is rooted out; class
conflict is absent; every individual contributes to national income according to his abilities
and receives according to his needs; and the state withers away. Thus, class conflict is the
reason behind the social changes. Here, lies the importance of class conflict in the Marxian
development model.

58
The theory of surplus value
The idea of surplus value has important place in Marxian theory of economic
development. Under capitalism all the means of production are owned by a small group of
people. The workers on the other hand sell their labour to the capitalist. The wage of the
labour is equal to the value of subsistence necessary to maintain their life. The price of
commodities is higher than the wages paid to the workers. The economy is capable of
producing a surplus over and above the subsistence needs of the labourers, and the capital
equipment used in production. Thus, according to Marx, the wages paid to workers are less
than the market value of the commodity. Marx has identified this difference as surplus value,
and the surplus value is appropriated by the capitalist. This surplus value according to Marx
should go to the workers who are the real creators of it.
Marx argues that the total value of output produced in a capitalist economy can be
divided in to three components:
(a) Constant capital (C): It represents the value of materials and machinery used up in
production.
(b) Variable capital (v): It represents the amount of labour used in production or the
wages paid to the workers.
(c) Surplus value (S): It represents the profit.
Thus the total value of product is equal to these three components that are C+V+S.
According to Marx, workers get only a part of the output they produced, and the rest goes to
the capitalist. Marx called it exploitation of labour.
The aim of capitalist is to increase the surplus value. The capitalist adopts three
methods to increase the surplus value; viz. increase in the working hours of the labourers,
reduce the wages below subsistence level and increased productivity of labourers through
improved technology. The consequences of such exploitation leads to increasing misery of
the workers and intensification of class struggle, increase in unemployment, fall in the rate of
profit, and finally decline in the number of capitalist and concentration of capital in the hands
of a few capitalists.
59
Class struggle
According to Karl Marx in the capitalist system, class conflict between the capitalists
and the workers is inevitable. The interests of these two classes are opposed to each other.
Though workers oppose exploitation they are disunited and hence ineffective. As supply of
labour is generally more than the demand for labour, the payment of subsistence wages is
enough to attract considerable workers needed by capitalist. The conditions of the workers
become more miserable on account of low wages. The labourers who have opportunities to
come together and exchange their ideas unite in to a force capable of opposing exploitation
by the capitalist.
Increase in the supply of capital
As already discussed above capitalists pay lower wages to the workers and takes the
surplus value. However, the wages paid to the workers is not enough to create demand for the
products produced by the capitalists. This creates a situation where the supply of capital
exceeds demand. Thus, capital formation production is no longer profitable. Demand falls as
machines displace workers and industrial reserve army (unemployment) expands. To make
matters worse, capitalist dump goods in the market and in the process small capitalist
disappear. This results in a capitalist crisis. The ultimate cause of crisis is the poverty and
limited purchasing power of the masses. The period of economic crisis is characterized by
over production, lack of demand, low prices, unemployment and low wages. However, this
does not continue forever. Recovery soon starts, the succession from recovery to boom is
followed by crisis indicates that, trade cycles are common in capitalist economies. In each
period of crisis big capitalist expropriate small capitalist. By this time the workers become
united and get ready to over throw capitalist. Ultimately the new socialist society comes into
existence.
Critical Appraisal of Marx Theory
The Marxian theory of economic development can be examined from two angles.
Marx’s prophecy that the capitalist system will collapse after reaching the advanced stage of
development and that socialism will emerge in its place only afterwards has been proved false
by history.

60
Marx has pointed out that the technological progress is helpful to capitalist and increases the
misery of workers. But this has not happened in the capitalist countries. On the contrary,
workers have been receiving high wages and other facilities in these countries. The
introduction of social security measures in the capitalist societies has promoted the welfare of
workers. According to Marx, the development of capitalism will bring the capitalist and
workers in the opposite camps. However, such a thing is now a matter of the past.
Many capitalist societies have taken many steps to achieve the objective of full
employment; therefore, the industrial reserve army (unemployment) is not increasing.
Marx argument that as capitalism progresses wealth, economic power gets
concentrated in fewer and fewer hands is also not a sound argument. Because, capitalist have
to work with the rules and regulations framed by the governments of these countries.
The doctrine of surplus value is regarded as the weakest point in his theory of
economic growth. Critics argue that all factors of production are needed to produce a
commodity and workers alone cannot claim the entire volume of the commodity.
Marxian theory of economic growth is applicable indirectly to developing countries.
All though Marx did not think of the problem of the developing countries, yet some of the
variables of his analysis do exist in such countries.
3.7 Key Words
Increasing return : when the output is more than proportionate to increase
in inputs
Decreasing return : when the output is less than proportionate to increase
in inputs
Innovation : to bring out a new product or to improve the existing
product or the method of production which is more
efficient than earlier
Class struggle : the constant struggle between two classes of people
owing to differences in interest

61
3.8 Sample Short Question
1. What is surplus value?
2. What is innovation?
3. What are the different types of innovation?
4. What is meant by positive and preventive check of population growth?
5. What is division of labour?
6. What is class struggle?
3.9 Sample Long Questions
1. Critically discuss Malthusian theory of development.
2. Explain, the Ricardian theory of growth. What are the drawbacks of this theory?
3. Prepare a note on Adam Smith’s view on economic growth.
4. Explain, according to Marx how capitalism leads to the emergence of socialism.
5. Explain, Adam Smith’s view on division of labour.
3.10 Suggested Readings
1. Thirlwall, A. P. (2011): Economics of Development, Ninth Edition, Palgrave
Macmillan.
2. Todaro, M. P. & S. C. Smith (2003): Economic Development, Pearson Education.

62
UNIT-IV
NEO-CLASSICAL AND CAMBRIDGE MODELS OF ECONOMICGROWTH
Structure
4.0 Introduction
4.1 Objectives
4.2 Harrods Model of Growth
4.2.1 Introduction to Labour Market
4.3 Domars Mode of Growth
4.4 Solow Growth Model
4.5 Cambridge Model of growth (Joan Robinson)
4.6. Questions
4.7 Key Words
4.8 Suggested Readings
4.0 Introduction
In this unit the learners may acquaint themselves with various models of growth
accounting. The models particularly are off shoot of the Kenysian framework in the long run.
4.1. Objectives
Following are the learning objectives of the unit;
Harrod model
Damar model
Neo-classical model of Solow
Cambridge model (Joan Robinson only).
4.2 Harrods Model of Growth
Harrods model of growth arises out of the requirements of ensuring long run full
employment equilibrium. In fact, the model extends the short run Keynesian problem of
under-employment equilibrium to attain full employment in the long run. Under the
Keynesian model the deficiencies of effective demand renders excess capacity in the system.
In other words, if the short run problem of under-employment equilibrium is corrected

63
through investment in the short run, it creates further excess capacity in the system. Creation
of such excess capacity gives rise to long run problem of ensuring a certain rate of growth of
capital through continuous investment.
Based on the three basic postulates, Harrod process two theorem which governs his
model of growth. First, is the Savings to Harrod communities income or the national output is
one important determinant of savings. Second, the rate at which national output increases is
another factor that determines the demand for savings. Finally, as in the long run every values
tends towards equality, so does the demand and supply.
Based upon the three postulates, the first theorem states that;
There exists a rate of growth of national output or income, called as warranted rate of
growth; gw, such that if this warranted rate of growth holds in a given period,
producers will repeat the same rate of growth of output (National income) in the
subsequent period if it is physically feasible.
The second theorem states that if in any period if the rate of growth actually realized
is different from warranted rate of growth, the difference or divergence between it
will compound cumulatively. In other words, if the actual rate of growth (ga), is
higher (or lower) than the warranted rate of growth (gw), then in the subsequent
period, the actual rate of growth will be even more higher (or lower) and this will go
on forever.
The razor edge equilibrium comes from the second theorem. It states that the actual
rate of growth must be equal to the warranted rate of growth, unless so, the breach of this
knife edge equilibrium may lead to even more divergence between both actual and warranted
rate of growth.
The model considers two factors of production L & K, which is used in or fixed
proportion implying L Shaped production function. Further, no outcome of the competitive
economy, constant return to scale applies to it. There is no technical progression taking place
for the time horizon set for the analysis. Finally, the population or the labour force grows at a
constant rate (n).

64
The saving function is given as
𝑆𝑡 = 𝑠𝑌𝑡−1
Where S is savings in aggregate, which is function of the proportion of national income. It is
determined by the marginal propensity to save (s) times the national output produced in the
previous year for the time period (t)
Also, the investment in any time period (t) is a constant proportion (v) of the difference
between the income in time period (t) as well as (t-1). Hence,
𝐼𝑡 = 𝑣(𝑌𝑡 − 𝑌𝑡−1)
Now, the equilibrium holds when I= S, as Y= C + I from demand side and Y=C + S from
supply side. At equilibrium both demand and supply must be equal
∴ 𝐶 + 𝐼 = 𝑌 = 𝐶 + 𝑆
or C + I = C + S
I = S
But this condition of equilibrium is a flow concept as both investment and savings are
flow items in accounting the national output. The flow condition although necessary is not a
sufficient condition, unless backed up by or stock condition. The stock condition requires that
the initial capital stock must be optimum capital stock.
Hence,
𝐾𝑜 = 𝐾𝑜∗
i.e. Actual initial capital is optimum capital stock. As such, the flow condition will imply that
desired investment in any time period is realized through saving in that time period
i.e. It = St.
From our definition of savings and investments we can substitute
V (Yt – Yt-1) = 𝓈Yt-1
∴ 𝑌𝑡 − 𝑌𝑡−1
𝑌𝑡−1=
𝓈
𝑣
Now the LHS of the above equation namely ∴ 𝑌𝑡−𝑌𝑡−1
𝑌𝑡−1 is but the growth rate of income in time
period (t). The equation implies that the income must grow at the constant rate of 𝓈/v (RHS

65
of the equation) in order to attain equilibrium in the commodity market. The𝓈/v is called the
warranted rate of growth i.e. gw = 𝓈/v. Thus, warranted rate of growth is the ratio of savings
ratio as well as the capital output ration (v).
Now, the first theorem above stated that if growth of income (national output) grows
at the rate of warranted rate of growth, then this rate of growth, then this rate of growth will
be maintained for all the subsequent time period to come.
i.e. if 𝑌𝑡−𝑌𝑡−1
𝑌𝑡−1=
𝓈
𝑉= 𝑔𝑤,
then 𝑌𝑡+1−𝑌𝑡
𝑌𝑡=
𝓈
𝑉= 𝑔𝑤2 𝑎𝑛𝑑 𝑠𝑜 𝑜𝑛 ,
Therefore, gw1 = gw2 = gw3 = …. = gwt
The account theorem states that if actual growth rate does not correspond to the warranted
rate of growth, i.e. if ga ≠ gw
Then 𝑔𝑎 <>𝑔𝑤
ga =𝑌𝑡−𝑌𝑡−1
𝑌𝑡−1 𝑎𝑛𝑑 𝑔𝑤 =
𝓈
𝑉
Hence, 𝑔𝑎 <>𝑔𝑤 inverse
𝑌𝑡 − 𝑌𝑡−1
𝑌𝑡−1,<
>𝓈
𝑉
Or that, V (Yt – Yt-1)><& Yt-1
Or 𝐼𝑡<>𝓈𝑡
Now if It>St, there is excess capacity that has been created and to maintain that excess
capacity it requires the continuous flow of investments. As such, more and more of excess
capacity is created in the system.
However, if It<St then there is excess of savings over investment implying
underutilization of the capacity, leading to deficiency of investment demand. Hence, the
underutilization of capacity will further deteriorate the demand and this will go on for all the
subsequent period.
66
4.2.1 Introduction to Labour Market
As stated earlier, there are two factors of production capital and labour ad that labour enters
in the system in the long run. In short run labour is assumed to be unlimited in supply, it is
not a scarce factor, but in long run growth of labour force depends upon the rate of growth of
population. To this long run rate of growth of population Harrod called the natural rate of
growth which is constant and is designated as (n).
Since the labour supply grows at a constant rate (n) the labour supply function is given as
𝐿𝑡𝑠 = 𝐿𝑜
𝑠 (𝐼𝑡𝑛)𝑡
Where 𝐿𝑡𝑠 is the labour supply in period (t) and 𝐿𝑜
𝑠 is the initial or base period’s supply of
labour.
Also the labour demand is some fraction of the previous years income and is given as
𝐿𝑡𝑑 =∝ 𝑌𝑡−1 Also 𝐿𝑡+1
𝑑 =∝ 𝑌𝑡
Where 𝐿𝑡𝑑 is the labour demand in time (t), ∝ is the labour –output ratio and is constant and
the 𝑌𝑡−1 is the income in the preceding period of (t).
Now, in the long run when the initial demand for labour is 𝐿𝑡−1𝑑 . If the output 𝑌𝑡−1 has to be
realized at the end of the period (t-1) the demand for labour must be increased from 𝐿𝑡+1𝑑 to Lt
and so forth
∴ 𝐿𝑡+1𝑑 − 𝐿𝑡
𝑑 = ∝ (𝑌𝑡 − 𝑌𝑡−1)
Similar to the earlier stock and flow conditions, the labour market also requires the following
conditions:
Stock condition where 𝐿𝑜𝑑 = 𝐿𝑜
𝑠 implying the initial labour supply and demand are equal and
optimum. Also, the flow conditions is given as
𝐿𝑡+1𝑑 − 𝐿𝑡
𝑑 = 𝐿𝑡+1𝑠 = 𝐿𝑡
𝑠
Thus, both stock and flow condition imply that if the initial stock of labour demand and
supply are at optimum, then the change in the demand for labour is equal to change in the
supply of labour.
Now the equilibrium in the labour market is given as above equation as
𝐿𝑡+1𝑑 − 𝐿𝑡
𝑑 = 𝐿𝑡+1𝑠 = 𝐿𝑡
𝑠
But from our earlier definition we know that
𝐿𝑡+1𝑑 − 𝐿𝑡
𝑑 = ∝ (𝑌𝑡 − 𝑌𝑡−1)
67
And from the nature of labour supply function we also know that
𝐿𝑡𝑠 − 𝐿𝑜
𝑠 (1 + 𝑛)𝑡
𝐻𝑒𝑛𝑐𝑒, 𝐿𝑡+1𝑠 = 𝐿𝑜
𝑠 (1 + 𝑛)𝑡+1
Therefore, 𝐿𝑡+1𝑠 − 𝐿𝑡
𝑠, the right hand side of the equation representing the equilibrium in
labour market becomes
𝐿𝑡+1𝑠 − 𝐿𝑡
𝑠 = 𝐿𝑜𝑠 (1 + 𝑛)𝑡+1 − 𝐿𝑜
𝑠 (1 + 𝑛)𝑡
= 𝐿𝑜𝑠 (1 + 𝑛)𝑡(1 + 𝑛) − 𝐿𝑜
𝑠 (1 + 𝑛)𝑡
Factoring out, we get
𝐿𝑡+1𝑠 − 𝐿𝑡
𝑠 = 𝐿𝑜𝑠 (1 + 𝑛)𝑡[1 + 𝑛 − 1]
Cancelling 1 and (-1), we get
𝐿𝑡+1𝑠 − 𝐿𝑡
𝑠 = 𝐿𝑜𝑠 (1 + 𝑛)𝑡 , 𝑛
𝑂𝑟 𝐿𝑡+1𝑠 − 𝐿𝑡
𝑠 = 𝑛𝐿𝑜𝑠 (1 + 𝑛)𝑡
𝑆𝑖𝑛𝑐𝑒 𝐿𝑜𝑠 (1 + 𝑛)𝑡 − 𝐿𝑡
𝑠
by substitution we get
𝐿𝑡+1𝑠 − 𝐿𝑡
𝑠 = 𝑛𝐿𝑡𝑠
Now, from the flow condition 𝐿𝑡𝑑 = 𝐿𝑡
𝑠we know that
𝐿𝑡𝑑 = 𝐿𝑡
𝑠
But we also know that 𝐿𝑡𝑑 = ∝ 𝑌𝑡−1
Hence, we can say that 𝐿𝑡𝑠 = ∝ 𝑌𝑡−1 for the above equation.
We know that
𝐿𝑡+1𝑠 − 𝐿𝑡
𝑠 = 𝑛𝐿𝑡𝑠
and 𝐿𝑡𝑠 = ∝ 𝑌𝑡−1, therefore, by substitution of 𝐿𝑡
𝑠 = ∝ 𝑌𝑡−1 we get, 𝐿𝑡+1𝑠 − 𝐿𝑡
𝑠 = 𝑛 ∝ 𝑌𝑡−1
Also we know from our previous analysis that
𝐿𝑡+1𝑑 − 𝐿𝑡
𝑑 = ∝ 𝑌𝑡 − 𝑌𝑡−1
Now substituting the values of 𝐿𝑡+1𝑠 − 𝐿𝑡
𝑠 𝑎𝑛𝑑 𝐿𝑡+1𝑑 − 𝐿𝑡
𝑑 in our equilibrium flow equation
𝐿𝑡+1𝑑 − 𝐿𝑡
𝑑 = 𝐿𝑡+1𝑠 − 𝐿𝑡
𝑠 we get
∝ (𝑌𝑡 − 𝑌𝑡−1)𝑡+1𝑠 = 𝑛 ∝ 𝑌𝑡−1
Or ∝(𝑌𝑡−𝑌𝑡−1)
𝑌𝑡−1= 𝑛 ∝
𝐶𝑎𝑛𝑐𝑒𝑙𝑙𝑛𝑔 ∝ 𝑡ℎ𝑟𝑜𝑢𝑔ℎ𝑡𝑙𝑦, 𝑤𝑒 𝑔𝑒𝑡 (𝑌𝑡 − 𝑌𝑡−1)
𝑌𝑡−1= 𝑛
Now 𝑌𝑡−𝑌𝑡−1
𝑌𝑡−1= 𝑔𝑎
∴ 𝑔𝑎 = 𝑛

68
Thus, the above result shows no that, in order to attain the equilibrium in labour market,
derived act of both the stock and flow conditions, it requires that the natural rate of
population growth must be equal to the actual growth rate.
Now for the simultaneous equilibrium in both capital and the labour market requires that the
actual rate of growth be in equation to warranted rate of growth, and that actual rate of
growth must be equal to the natural rate of growth of population. In other words
𝑔𝑎 = 𝓈
𝑉
or ga = gw
and that ga = n
Hence ga = gw = n
𝑜𝑟 𝑔𝑎 = 𝓈
𝑉= 𝑛
This condition is called the steady growth.
4.3 Domars Model of Growth
Although Domar bring about the same conclusion, he analysed his growth model
from the point of view of productive capacity of the economy. As such, the economy is said
to be in equilibrium state when the productive capacity equals the national income i.e. Pt=Yt,
in time period (t). The productive capacity is defined as
Pt = βKt
Where Pt is the productive capacity, β is the constant output capital ratio and Kt is the
capital stock in the time period (t). The productive capacity is, therefore, simply the
maximum output obtainable when the labour force is fully employed.
Any change in the productive capacity can be obtained only by equivalent change in
the capital stock. More specifically, the Supply of output is given as:
∆𝑃𝑡 = 𝛽∆𝐾𝑡
The saving function is given as St = 𝓈Yt
Where St is the saving in time period (t) which is some proportion of the income (Yt)
as determined by the savings ratio.

69
The required condition for equilibrium as in Harrod’s model as
It = St
But as St = 𝓈Yt, therefore
It =𝓈Yt
Or Yt = 1
𝓈 × 𝐼𝑡
In other words income (Yt) in time (t) is a function of the inverse of savings ratio times the
investment in the time period (t). Hence, any change in income (Yt) can be brought about
only by change in the investment (It) given the constancy of the saving ratio (𝓈).
i.e.∆𝑌𝑡 = 1
𝓈∆𝐼𝑡
This is but the Keynesian multiplier.
Now, an economy will be in equilibrium over a period of time, if the following two
conditions are fulfilled.
The flow condition i.e. ∆𝑃𝑡 = ∆𝑌𝑡 for any time period
t = 1, 2, 3, …….
Also the required stock condition is given as
Po = Yo
The conditions imply that change in the productive capacity or the supply is in equation with
changed demand because the initial stock condition is fulfilled; implying initial productive
capacity (supply) equals initial national output (demand).
Now from the flow condition ∆𝑃𝑡 = ∆𝑌𝑡
Since ∆𝑃𝑡 = 𝛽∆𝐾𝑡 from our earlier definition, and since ∆𝑌𝑡 =1
𝓈∆𝐼𝑡
Hence, ∆𝑃𝑡 = ∆𝑌𝑡 => 𝛽∆𝐾𝑡 =1
𝓈∆𝐼𝑡
Now since change in the capital stock (∆𝐾𝑡) in any time (t) is investment in that time period,
as there is no leakages in saving and investment by virtue of It = St. Hence,
∆𝐾𝑡 = 𝐼𝑡
Hence by substituting It for ∆Kt in the previous equation [𝛽∆𝐾𝑡 =1
𝓈× 𝐼𝑡]
We get
𝛽𝐼𝑡 =1
𝓈× ∆𝐼𝑡
Hence, 𝓈𝛽 =∆𝐼𝑡
𝐼𝑡

70
Now, 𝓈 is the savings ratio, 𝛽 is the output-capital ratio and both 𝓈 𝑎𝑛𝑑 𝛽 are constant.
Further ∆𝐼𝑡
𝐼𝑡 is nothing but the rate of growth of investment.
Thus, ∆𝐼𝑡
𝐼𝑡= 𝓈𝛽 implies that if the productive capacity of the economy is to be fully utilized
(full employment) the investment must grow at the rate of (𝓈𝛽). Only when the investment
increases at the rate of [(𝓈𝛽) = ∆𝐼𝑡
𝐼𝑡], the national output or income grows at the same rate. In
other words,
Since, 𝐼𝑡 = 𝑆𝑡 𝑎𝑛𝑑 𝑎𝑠 𝑆𝑡 = 𝓈𝑌𝑡
Or 𝐼𝑡 = 𝓈𝑌𝑡
Therefore any change in investment and given the constant savings ratio, the equation will be
maintained only when there is some change in National output Yt. Hence,
∆𝐼𝑡=𝓈∆𝑌𝑡
Dividing thoroughly the above equation by It we get
∆𝐼𝑡
𝐼𝑡=
𝓈∆𝑌𝑡
𝐼𝑡
But It = St, hence by substitution in the RHS denominator we get
∆𝐼𝑡
𝐼𝑡=
𝓈∆𝑌𝑡
𝑆𝑡
Again St – 𝓈Yt. Hence by substitution
∆𝐼𝑡
𝐼𝑡=
𝓈∆𝑌𝑡
𝓈𝑌𝑡
Cancelling the constant saving ratio in the RHS of the above equation
∆𝐼𝑡
𝐼𝑡=
∆𝑌𝑡
𝑌𝑡
Now, we know that ∆𝐼𝑡
𝐼𝑡 is the rate of growth of investment. Also
∆𝑌𝑡
𝑌𝑡 is the rate of growth of
income. In the other words, the rate of growth of income is exactly equal to the rate of growth
of investment. It is only when ∆𝐼𝑡
𝐼𝑡= 𝓈𝛽 that the
∆𝐼𝑡
𝐼𝑡=
∆𝑌𝑡
𝑌𝑡
Note that Harrods warranted rate of growth gw = 𝑌𝑡−𝑌𝑡−1
𝑌𝑡−1=
𝓈
𝑉
Whereas, in case of Domar 𝓈𝛽 =∆𝐼𝑡
𝐼𝑡=
∆𝑌𝑡
𝑌𝑡 where 𝓈𝛽 is but the required rate of growth.
Now in Harrods model (v) is the capital-output ratio whereas in case of Domar model (𝛽) is
output capital ratio or the inverse of Harrods (V), or

71
𝛽 =1
𝑉
Multiplying thoroughly by (𝓈) to the above equation we get
𝓈𝛽 = 𝓈.1
𝑉 𝑜𝑟 𝓈𝛽 =
𝓈
𝑉
In other words, Domars required rate of growth is exactly the same as the warranted rate of
growth of Harrod. The Crux of the model; both Harrod and Domar is that once the warranted
or required rate of growth is achieved it will perpetuate for times to come. Any breach of this
razor change equilibrium would rather compound the deviation and divergence from the
initial equilibrium further and further away.
4.4 Solow Growth Model
The conclusion drawn by both Harrod and Domar was refuted by Solow through his
growth model. Solow was of the view that both Harrod and Domar, inspite of their effort to
analyse the long run equilibrium rather rested their conclusion upon short turn knife edge
equilibrium growth. As such, whatever be the magnitude of slip by any of the parameters
(saving ratio, capital-output ratio, and rate of growth of labour force) from the dead centre of
the edge, the obvious consequence would be either growing unemployment or prolonged
inflation. Hence, Solow gave an alternative treatment.
There is only one commodity, whose rate of production is designated as Yt. Part of
this output is consumed and rest is saved and invested. The fraction of output saved is a
constant fraction (𝓈), so that the rate of savings is S= 𝓈Y(t)
The community’s stock of capital is K(t)
The net investment is then the rate of increase in capital stock overtime i.e. 𝑑𝑘
𝑑𝑡 𝑜𝑟 �̇�.
Hence, the basic identity is given as �̇� = 𝓈𝑌
The output is produced with the help of two factors of production, labour (L) and Capital (K).
The rate of growth of population or labour force is given as L(t) = 𝐿𝑜𝑒𝑛𝑡 implying an
exponential growth at rate (n). Unlike Harrod and Domar the technological possibilities are
given by the production function
Y = F (K, L)

72
The output(Y) is to be understood as net output after eliminating the depreciation. The
production function above is for the time being subject to constant Returns to scale, which
automatically assures that it is homogenous of first degree.
Now since �̇� = 𝓈𝑌 𝑏𝑢𝑡 𝑌 = 𝐹 (𝐾, 𝐿). Hence by substitution
�̇� = 𝓈𝐹(𝐾, 𝐿)
The above equation is a single/one equation with two unknowns. Nonetheless, we proceed in
the spirit of Harrods Model and assume that the population growth is exogenous and so
labour force grows at or constant relative rate of (n). Thus,
L(t) = Loent
In the equation �̇� = 𝓈𝐹(𝐾, 𝐿), 𝐿 stands for available total employment, whereas, in L(t) =
Loent, the (L) stands for the available supply of labour. Identifying both the (L) in above two
equations, we assume that full employment is perpetually maintained. Hence, inserting Loent
in �̇� = 𝓈𝐹(𝐾, 𝐿)we get
�̇� = 𝓈𝐹(𝐾, 𝑙𝑜𝑒𝑛𝑡)
Above equation determines the time path of capital accumulation that must be followed if
available labour is to be employed. Also, L(t) = Loent, implies that the labour force which is
growing exponentially is employed completely. The equation �̇� = 𝓈𝐹(𝐾, 𝑙𝑜𝑒𝑛𝑡) is a
differential equation in single variable (K(t)) and its solution gives the only time profile of
community’s capital stock which will fully employ the available labour force. Once the time
path of capital stock and that of labour force is known, it is possible to compute the time path
of the production function corresponding the real output.
In other words, at anytime (t) the available labour supply is given by L(t) = Loent, and
the available stock of capital is a datum. Since the real return to factors will adjust to bring
about the full employment of labour and capital, the production function Y=F(K,L) can be
used to determine the current rate of output(Y). Since, propensity to save times output gives
no the total savings we can also determine how much will be saved and invested, thereof.
Thus, the net accumulation of capital during the current period and when added to already
accumulated stock of capital gives no the capital available for investment in the subsequent
period, and this process can be repeated.

73
Possible Growth Patterns
To examine whether or not there exists a capital accumulation path that is consistent with the
growth of labour force we need to check the qualitative nature of equation�̇� = 𝓈𝐹(𝐾, 𝐿𝑜𝑒𝑛𝑡).
It is but difficult to determine an exact solution without specifying the exact shape of the
production function. However, we can get broad properties of it, even graphically.
To examine the above, we introduce a new variable 𝑟 = 𝐾
𝐿 or the ratio of capital per unit of
labour. From above we get,
𝑟𝐿 = 𝐾
𝑜𝑟 𝐾 = 𝑟𝐿𝑜𝑒𝑛𝑡
𝑆𝑖𝑛𝑐𝑒, 𝐿 = 𝐿𝑜𝑒𝑛𝑡
𝑑𝑖𝑓𝑓𝑒𝑟𝑒𝑛𝑡𝑖𝑎𝑡𝑖𝑛𝑔 𝐾 = 𝑟𝐿𝑜𝑒𝑛𝑡 with respect to time we get
𝑑𝑘
𝑑𝑡= 𝐿𝑜𝑒𝑛𝑡.
𝑑𝑟
𝑑𝑡+ 𝑟.
𝑑
𝑑𝑡(𝐿𝑜𝑒𝑛𝑡)
𝑆𝑢𝑏𝑠𝑡𝑖𝑡𝑢𝑡𝑖𝑛𝑔 𝑑𝑘
𝑑𝑡= �̇�,
𝑑𝑟
𝑑𝑡= �̇�
We get
𝑑𝑘
𝑑𝑡= 𝛿𝐿𝑜𝑒𝑛𝑡 + 𝑛𝑟𝐿𝑜𝑒𝑛𝑡
𝑜𝑟 �̇� = 𝐿𝑜𝑒𝑛𝑡 (�̇� + 𝑛𝑟)
Substituting the above value in the equation �̇� = 𝓈𝐹(𝐾, 𝐿𝑜𝑒𝑛𝑡)
We get
𝐿𝑜𝑒𝑛𝑡(�̇� + 𝑛𝑟) = 𝓈𝐹(𝐾, 𝐿𝑜𝑒𝑛𝑡)
Since the production function is subject to constant Return to scale, we can divide the
variables in the function 𝐹(𝐾, 𝐿𝑜𝑒𝑛𝑡)𝑏𝑦 𝐿 = 𝐿𝑜𝑒𝑛𝑡, provided we multiply the function by the
same factor. Hence, we get
𝐿𝑜𝑒𝑛𝑡(�̇� + 𝑛𝑟) = 𝓈𝐿𝑜𝑒𝑛𝑡 𝐹 (𝐾,
𝐿𝑜𝑒𝑛𝑡 ,𝐿𝑜𝑒𝑛𝑡
𝐿𝑜𝑒𝑛𝑡)
𝑂𝑟 𝐿𝑜𝑒𝑛𝑡(�̇� + 𝑛𝑟) = 𝓈𝐿𝑜𝑒𝑛𝑡 𝐹 (𝐾,
𝐿𝑜𝑒𝑛𝑡, 1 )
�̇� + 𝑛𝑟 = 𝓈𝐿𝑜𝑒𝑛𝑡
𝐿𝑜𝑒𝑛𝑡 𝐹 (
𝐾
𝐿, 1 )
since L = 𝐿𝑜𝑒𝑛𝑡
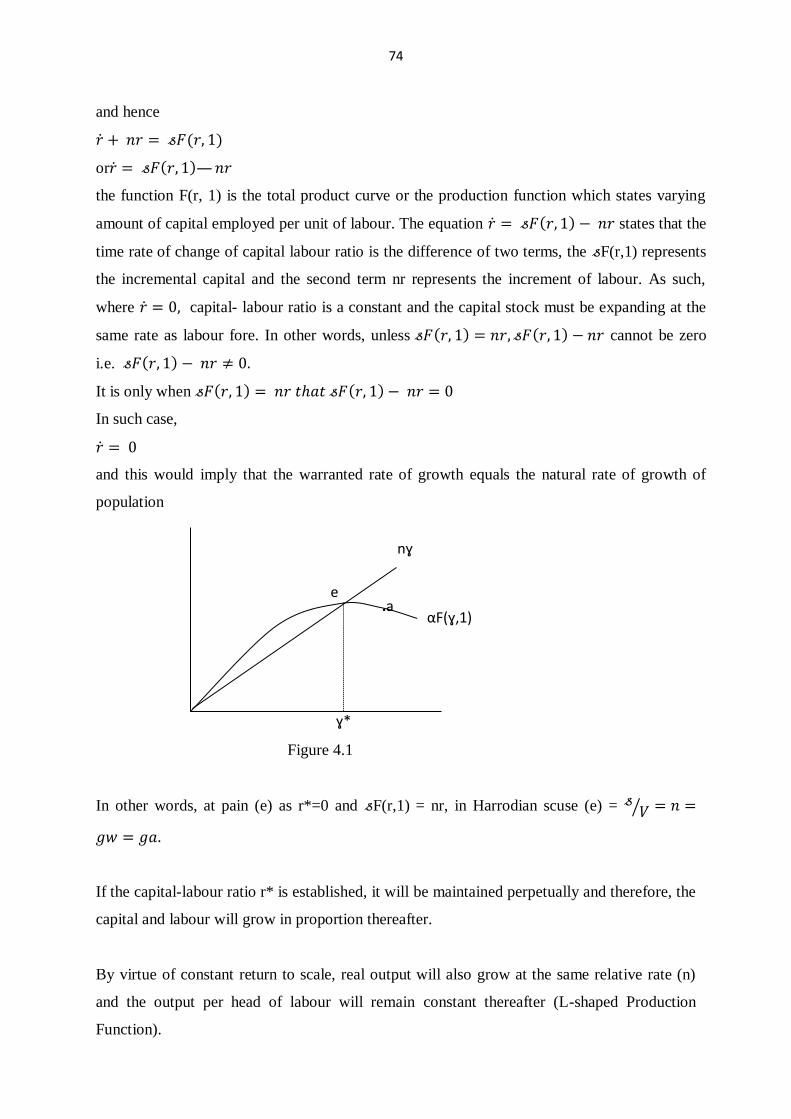
74
and hence
�̇� + 𝑛𝑟 = 𝓈𝐹(𝑟, 1)
or�̇� = 𝓈𝐹(𝑟, 1)— 𝑛𝑟
the function F(r, 1) is the total product curve or the production function which states varying
amount of capital employed per unit of labour. The equation �̇� = 𝓈𝐹(𝑟, 1) − 𝑛𝑟 states that the
time rate of change of capital labour ratio is the difference of two terms, the 𝓈F(r,1) represents
the incremental capital and the second term nr represents the increment of labour. As such,
where �̇� = 0, capital- labour ratio is a constant and the capital stock must be expanding at the
same rate as labour fore. In other words, unless 𝓈𝐹(𝑟, 1) = 𝑛𝑟, 𝓈𝐹(𝑟, 1) − 𝑛𝑟 cannot be zero
i.e. 𝓈𝐹(𝑟, 1) − 𝑛𝑟 ≠ 0.
It is only when 𝓈𝐹(𝑟, 1) = 𝑛𝑟 𝑡ℎ𝑎𝑡 𝓈𝐹(𝑟, 1) − 𝑛𝑟 = 0
In such case,
�̇� = 0
and this would imply that the warranted rate of growth equals the natural rate of growth of
population
Figure 4.1
In other words, at pain (e) as r*=0 and 𝓈F(r,1) = nr, in Harrodian scuse (e) = 𝓈𝑉⁄ = 𝑛 =
𝑔𝑤 = 𝑔𝑎.
If the capital-labour ratio r* is established, it will be maintained perpetually and therefore, the
capital and labour will grow in proportion thereafter.
By virtue of constant return to scale, real output will also grow at the same relative rate (n)
and the output per head of labour will remain constant thereafter (L-shaped Production
Function).
e .a
ɣ*
αF(ɣ,1)
nɣ

75
But in case of Harrod and Domar model, if 𝑟 ≠ 𝑟 ∗ such that 𝑟 > 𝑟 ∗, it will imply a point
right of (e). It can easily be understood that at any point right of (e), the curve (nr) >𝓈F(r,1)
i.e. nr >𝓈F(r,1)
Under the circumstance, as (n) is constant, the (r) will vary or decrease in the equation
�̇� = 𝓈𝐹(𝑟, 1) − 𝑛𝑟 thereby ultimately making back to point (e) and conforming to r*. In
other words 𝑟 = 𝐾
𝐿 and
𝑑𝑟
𝑑𝑡= �̇� =
𝑑
𝑑𝑡(𝐾
𝐿⁄ ) gives no the time rate of change in the
capital- labour ratio. Whereas in the Right Hand side of the equation we have, 𝓈𝐹(𝑟, 1) −
𝑛𝑟. Thus (r) decreases, reducing the Right Hand Side of the equation 𝓈𝐹(𝑟, 1) − 𝑛𝑟 to
recede back to point (e) ultimately realizing the �̇� at r*.
Hence, Solow model unlike Harrod and Domar model, states the knife edge equilibrium
as a myth.
Conversely, for any point left of (e) would imply that r*>r, in other words 𝓈𝐹(𝑟, 1) 𝑛𝑟.
Hence �̇� will tend to move towards (e) and ultimately realizing the value (r*). Thus, the
equilibrium value r* is a stable one.
Simply, Solow refutes the Harrod and Domars assertion of strict proportionality of 𝑟 =
𝐾
𝐿. Instead, his model states that whatever be the value of capital-labour ratio, the system
(due to flexibility of 𝑟 = 𝐾𝐿⁄ will always lend towards a state of balanced growth at the
natural rate of growth (n).
The time path of growth of capital and output is not exactly exponential but asymptotic.
There is but an exception to it. That is if K = 0, then r=0 and the system cannot get
started; without capital there is no output and hence no accumulation i.e. 𝓈𝑌 =
𝓈𝐹(𝑟, 1), 𝑠𝑖𝑛𝑐𝑒 𝑌 = 0, 𝐻𝑒𝑛𝑐𝑒 𝓈𝐹(𝑟, 1) = 0. But once there is any output; even if windfall,
it will start the system towards (r*).
If the initial capital stock is below the equilibrium ratio, capital and output will grow
faster than the growth in the labour force till it approaches the equilibrium at (e)
thereby maintaining the ratio(r*) perpetually.

76
If the initial ratio (capital stock) is above the equilibrium value, capital and output will
grow more slowly than the labour force. The growth of capital and output always lie
around some intermediate value between those of labour and capital.
The strong stability is not inevitable or stand alone configuration. There may be other
possibilities too.
Figure 4.2
In the above diagram, there are three points of intersections 𝑟1, 𝑟2, 𝑟3. amongst it
𝑟1 𝑎𝑛𝑑 𝑟3. are stable as the 𝓈𝐹(𝑟, 1) intersect the (nr) from above. In case of (𝑟2), the
𝓈𝐹(𝑟, 1) intersects (nr) from below. Hence any disturbance at (𝑟2) may either push up
or push below the system further and further away from (𝑟2). It is only in case of (𝑟1)
and (𝑟3 ) that the system necessarily rest at 𝑟1 𝑜𝑟 𝑟2. In either 𝑟1 𝑜𝑟 𝑟3 the real output
will asymptotically expand at the rate of natural growth (n).
However, at (𝑟1) there is less capital than that at (𝑟3), thereby rendering the output at
(𝑟1) as less than at (𝑟3). The relevant balanced growth equilibrium is at (𝑟1) for any
initial ratio of Capital-output (r) ranging in between ( 0 to 𝑟1). With respect to the value
of (r) any where above (𝑟2) is at (𝑟3).
r1 r2 r3
𝓈F(ɣ,1)
nɣ
ɣ

77
Even this does not exhaust the possibilities of configurations. It may so happen that
there exists no balanced growth path. Since a non-decreasing function F(r,1) can be
converted to yield constant return to scale production function by multiplying the
function by L, there can be many possibilities and configurations. The diagram below,
for instance, gives us two possibilities.
Figure 4.3
In other words, since F(K,L) is divided by (L) reducing the function into a 𝐹 (𝐾
𝐿, 1)
implying capital per unit of labour (Labour given), Ultimatgely realizing a diminishing
marginal productivity, but not interesting (nr) curve.
For the system representing 𝓈1𝐹1(𝑟, 1), it is so productive that accumulation is too high
rendering the capital-labour ratio(r) too high, realizing increasing output per head,
further leading to greater quantum of accumulation and so forth the output beyond
limits. Hence capital and income bother increase more rapidly than the supply of labour.
The second system 𝓈2𝐹2(𝑟, 1), is so unproductive that the full employment path leads to
diminishing per capita perpetually. Hence, net income can only rise because of the net
investment which is always positive and so forth will be the labour supply.
The basic conclusion of Solow’s analysis consequently yields that when production
takes place under the usual neoclassical conditions of variable proportion and constant
return to scale, no strict equality between natural and warranted growth rate is a
necessary outcome. The system can adjust to any given rate of growth of labour force
and eventually realize steady state of proportional expansion or growth. At most, there
𝓈1F1(r,1) nr
𝓈1F1(r,1)
r
ṙ
78
can be a case of Cobb-Donglas production function but can never be any razor or knife
edge.
4.5 Cambridge Model of growth (Joan Robinson)
The essence of Robinson’s growth theorization can be summarized in her
propostion: “If they have no profit, the entrepreneurs cannot accumulate, and if they do
not accumulate they have no profit.” Infact, the model explains the fundamental nature
of economic growth in a capitalist system.
The basic equation gives the distribution of total output into two categories as
between workers and entrepreneurs. Hence,
𝜌𝛾 = 𝑤𝑁 + 𝜋𝑝𝐾
Where (Y) is total output of the economy, (N) is the quotient of labour employed,
(K) is the amount of capital, 𝜌 is the averaged price of both output and capital, (w) is the
wage rate and (𝜋) the gross profit rate.
Dividing the above equation thoroughly by 𝜌 we get,
𝜌𝑌
𝜌=
𝑤𝑁
𝜌+
𝜋𝜌𝐾
𝜌
𝑜𝑟 𝑌 = 𝑤
𝜌𝑁 + 𝜋𝐾
From the last equation 𝑌 = 𝑤
𝜌𝑁 + 𝜋𝐾 we can determine the gross profit rate as
𝑜𝑟 𝑌 = 𝑤
𝜌𝑁 + 𝜋𝐾
𝑜𝑟 𝜋 = 𝑌−
𝑤
𝜌𝑁
𝐾
Dividing both numerator and the denominator by (N), we get
𝜋 =
𝑌
𝑁−
𝑤
𝜌
𝑁
𝑁
𝐾
𝑁
𝑜𝑟 𝜋 =
𝑌
𝑁−
𝑤
𝜌
𝐾
𝑁
𝑆𝑢𝑏𝑠𝑡𝑖𝑡𝑢𝑡𝑖𝑛𝑔 𝜎 = 𝑌
𝑁 𝑎𝑛𝑑 𝜃 =
𝐾
𝑁 𝑊𝑒 𝑔𝑒𝑡
𝜋 = 𝜎 −
𝑊
𝜌
𝜃

79
The above equation shows that gross profit rate depends on three factors,
namely; average productivity of labour (𝜎 =𝑌
𝑁), the real wage rate
𝑊
𝜌 and the capital-
labour ratio 𝜃 =𝐾
𝑁. The expression 𝜎 = 𝑊
𝜌⁄ is the net output obtained from one unit of
labour minus the real wage paid to one unit of labour.
Thus, gross profit rate depends directly upon the magnitude of net return (𝜎 =
𝑊𝜌⁄ ) and inversely with the capital-labour ratio (𝜃).
The production function is given by Y= F(K, N) and is assumed to be
homogenous of degree one. Also, it is subject to constant Return to scale. In fact, the
production function is the production counterpart o the distribution equation given
above as 𝜌𝛾 = 𝑤𝑁 + 𝜋𝑝𝐾
Considering the Keynesian GNP identity Y= C+I+G; demand side and Y=C+S+G; supply
side, the equilibrium holds when demand is equal to supply. Hence,
C+I+G = Y = C=S=G
Cancelling the common terms, the equilibrium situation is best described as
I = Y = S
or simply as,
I = S
We can assume that the workers do not save in any significant proportion out of their
income, instead, consumes their entire incomes (wage). This in macro aggregate means
that the entire wage bill of the economy is consumed. As an off shoot to this assumption,
we can intuitively derive that the capitalist consumption do not constitute any
significant proportion to the total consumption of the economy, instead, they save. In
other words they save for investments.
Hence we can write the consumption of the economy as
𝐶 = 𝑤𝜌⁄ ∗ 𝑁
In other words, consumption expenditure in real terms is equal to the total wage bill of
the economy. Where, 𝑤 𝜌⁄ is the real wage and N is the amount of labour. Also, for the
total savings in the economy,
𝑆 = 𝜋K

80
Implying that total savings is equal to total profit in real terms. Where, 𝜋 is the real rate
of profit and (K) is the amount of capital employed. Also, the amount of change in the
stock (K) is but the investment. Hence, we have
I = ΔK
Hence by substituting ΔK for I and 𝜋K for S in the equilibrium equation I = S, we get
ΔK = 𝜋K
By transposing the (K) in the above equation to the left hand side of the equation we
get,
ΔK𝐾⁄ = 𝜋
But we already know the value of 𝜋 from our previous analysis 𝜋 = 𝜎−
𝑊
𝜌
𝜃
Hence,
ΔK𝐾⁄ = 𝜋
Also implies
ΔK𝐾⁄ = 𝜋 =
𝜎−𝑊
𝜌
𝜃
or ΔK𝐾⁄ =
𝜎−𝑊
𝜌
𝜃
In other words, the rate of growth of capital (given byΔK𝐾⁄ ) is given by profit rate as
determined freely in the market by the market forces in the capitalist system. The rate
of growth of capital is determined by the relative strength of the numerator and the
denominator. In other words, if the net return per unit of the labour (given as 𝜎 −𝑊
𝜌)
rises in greater proportion than the capital labour ratio (given as 𝜃), then the rate of
growth of capital increases and vice-versa. On the other hand, for a given level or
constant 𝜎 (≡𝑌
𝑁𝑖. 𝑒. 𝑜𝑢𝑡𝑝𝑢𝑡𝑙𝑎𝑏𝑜𝑢𝑟𝑟𝑎𝑡𝑖𝑜)and 𝜃 (≡
𝐾
𝑁𝑖. 𝑒. 𝑡ℎ𝑒 𝑐𝑎𝑝𝑖𝑡𝑎𝑙 𝑙𝑎𝑏𝑜𝑢𝑟 𝑟𝑎𝑡𝑖𝑜), then
the rate of growth of capital (ΔK𝐾⁄ ) increase (or decreases) as and when the real wage
rate falls (or increases). In other words, the fall in the real wage increases the rate of
growth of capital and vice-versa.
The Golden Age
The golden age is a situation where in all the capital and all the labour are fully
employed. This can be derived as below:

81
By definition, 𝜃 =𝐾
𝑁
which can be also be rewritten as
𝑁 =𝐾
𝜃
At the equilibrium as 𝜃 =𝐾
𝑁 is constant and optimal, any change in the labour force can
be brought only by change in the amount of the capital employed. Hence,
𝛥𝑁 =𝛥𝐾
𝜃
The rate of growth of labour force which can be fully be employed is then given as 𝛥𝑁
𝑁. In
other words,
as𝛥𝑁
𝑁 =
𝛥𝐾
𝜃
𝑁
But from our previous derivation we know that 𝑁 =𝐾
𝜃. Hence by substitution in the
denominator, we get;
𝛥𝑁
𝑁 =
𝛥𝐾
𝜃𝐾
𝜃
or,
𝛥𝑁
𝑁 =
𝛥𝐾
𝜃∗
𝜃
𝐾
Or,
𝛥𝑁
𝑁 =
𝛥𝐾
𝐾
Thus, fully employed labour force grows at the same rate as the fully employed growth
rate of capital. This is the golden age.
4.6. Questions
1. Discuss the Harrods model of growth.
2. Show how Harrods warranted rate of growth is equivalent to Domars
required rate of growth.
3. In the backdrop of Solows Neo-classical growth model criticize both
Harrod and Domar model.
4. Discuss critically the golden rule of accumulation.

82
4.7 Key Words
Warranted Rate of growth : Rate of growth that is required to be
maintained for a given level of saving
ratio and capital output ratio.
Optimal Stock : The optimum amount of capital that is
given at equilibrium when all the
resources are fully employed
Natural rate of growth : The long run rate of growth or the
relative rate of growth of population
4.8 Suggested Readings
Adelman, J., Theories of Economic Growth and Development, Stanford University Press, 1961.
Domar, E.D., Essays in Theory of Economic Growth, Oxford University Press, New York.
Kaldor, N., Essays on Economic Stability and Growth, Duckworth, London, 1980.
Solow, R. M., Growth Theory: An Exposition, Oxford University Press, 2000. .
Thirwal, A.P., Growth and Development, Macmillan, London, 1999.
Meier, G, Leading Issues in Economic Development, Oxford University Press, New Delhi, 1990.
Todaro, M.P., Economic Development, Longman, London, 1996.
Myrdal, G., Economic Theory and Underdeveloped Regions, Duckworth, London, 1957.
Ray, D., Development Economics, Oxford University Press.

83
UNIT - V
TECHNICAL CHANGE
Structure
5.1 Introduction
5.2 Objective
5.3 Hicksian and Harrodian Versions of Neutral Technical Progress
5.3.1 Hicks-neutral technical changes
5.3.2 Harrod Neutral Technical Progress
5.4 Labour and capital Augmenting Technical progress (Harrod and Solow versions)
5.4.1 Harrod Version
5.4.2 Solow Version
5.5 Disembodied and embodied Technical Progress
5.5.1 Disembodied Technical Progress
5.5.2 Embodied Technical Progress
5.6 Overview of Endogenous growth theory
5.6.1 Arrow’s learning by doing model
5.6.2 The Romer’s Model
5.6.3 The Lucas Model
5.7 Growth under vintage capital model
5.7.1 Limitations
5.8 Let Us Sum UP
5.9 Key terms:
5.10 Questions
5.11 Further/Suggested Readings
5.1 Introduction
Technical progress is important for economic growth. It implies an increase in total
output which is obtained without any increase in the factors of production employed. In other
words, when a higher output is achieved with the given amount of factors of production then
it is called technical progress of change. This means that the technical progress shifts the
production function upward showing higher output with the same inputs or factors. Thus,
technical progress is important and perhaps the main factor for economic growth. The

84
technical progress may take different forms. This unit covers the discussion on different types
of technical progress endogenous growth theory and vintage capital model.
5.2 Objective
The objective of this unit to discuss the importance of technical change in economic
growth and also to understand the different types of technical changes.
5.3 Hicksian and Harrodian Versions of Neutral Technical Progress
5.3.1 Hicks-neutral technical changes
The technical progress can be neutral or non-neutral. A technical progress is neutral
when the relative share of labour and capital remains constant under certain conditions. On
the other hand a technical change in non-neutral if it increases either the share of labour or
capital.
The concept of Hicks neutrality was first put forth in 1932 by John Hicks in his book
The Theory of Wages. A technical change is considered to be Hicks neutral if the change
does not affect the balance of labour and capital in the production function. More formally
given the Solow model production function.
Y = A (t) f(K,L)
Where A is technical progress parameter and is also referred to as the total factor
productivity. A technical progress is Hicks-neutral change if it raises the total factor
productivity (A).
The technical progress is said to be neutral if the ratio of the marginal productivity of
labour to the marginal productivity of capital remains unchanged when the capital labour
ratio remains unchanged. Mathematically, technical progress is Hicks neutral if the
proportionate change in relative share i.e. I=0, along the path where the capital – labour ratio
is constant. The Hicks neutral technical progress can be analysed with the help of diagram as
follows.

85
Figure 5.1
The capital-labour ratio is plotted along the horizontal axis and per capita output is measured
along the vertical axis. There are two production functions which have been drawn to show
the technical progress. The production functions before and after the technical progresses are
OF and OF1. The production function OF1 in such a way that at an unchanged capital-labour
ratio ON, the tangents to the two productions has the same intercepts OM from the horizontal
axis. At point E, MPL/MPk = OM. At point E’ also MPL/MPk = OM. Therefore, MPL/MPk is
the same at points E and E1 and capital-labour ratio remains the same. The technical progress
is therefore neutral in the Hicksian sense. In the Hicksian neutral technical progress the
marginal productivities of labour and capital change in the same proportion so that their ratio
remains the same. The increase in output is obtained by raising output per head for all values
of capital-labour ratio in a certain proportion. In the figure, EE’/EN is the proportion increase
in output with unchanged capital-labour ratio. This proportionate increase in output is called
the rate of technical progress.
5.3.2 Harrod Neutral Technical Progress
The technical progress is Harrod neutral if the rate of profit remains the same at the
unchanged capita-output ratio. In case of Hicks neutrality the two points on the two
production function have the same value of capital – labour ratio. But in the case of Harrod
neutrality the two points on the two production functions have the constant output-capital
ratio. Under the competitive the rate of profit is equal to the marginal productivity of capital.
R
E
H
W1
N O M
F
F1
E1
E
Pe
r C
apit
a O
utp
utO
Capital Labour Ratio (K/L)X
R1

86
Therefore, it can be said that in the case of Harrod neutral technical change, the marginal
productivity of capital will remain the same when the average productivity remains the same.
Thus, the technical change is Harrod neutral, if the proportionate change in relative share (I)
is zero along the path where capital-output ratio (K/Y) is constant. If capital –output remains
constant, it implies that marginal productivity of capital (MPk) is constant and the technical
progress is said to be Harrod-neutral.
If the marginal productivity of capital is not constant when the capital-output ratio is
constant, then the technical progress is non-neutral. If the change in marginal productivity of
capital is positive when capital-output remains constant, the technical progress is capital
using or labour saving. Harrod neutral technical progress can be represented with the help of
diagram as below:
Figure 5.2
In the figure the capital-labour ratio is measured along the horizontal axis and per capita
output is measured along the vertical axis. OF is the production before the technical progress
and when the technical progress takes place the function shifts to OF’. The ray through the
origin OR intersects the production functions at E and E’ respectively. The slop of OE gives
the output-capital ratio. Thus, the output-capital ratio is the same at points E and E’. The slop
of the tangents at E represents the marginal productivity of capital or the rate of profit. If the
slope of the tangents at E and E1 are the same, then the marginal productivity of capital at E
E1
E G
N O
R
F
y
Pe
r C
apit
a O
utp
ut
Capital Labour Ratio (K/L)
F1
N1
R1

87
and E1 are also the same. If that is so, then the technical progress is neutral in Harrod’s sense.
The ratio EG/EN or E1G/GN1 gives the rate of technical progress.
5.4 Labour and capital Augmenting Technical progress (Harrod and Solow
versions)
Technical progress may be neutral or non-neutral. A technical progress is considered
neutral if it raises the productivity of both labour and capital equally. On the other, hand, a
non-neutral technical is one which raises the productivity or one factor more than that of the
other factor.
5.4.1 Harrod Version
According to Harrod, a technical progress is neutral the rate of profit remains the
same at unchanged capital output ratio. In other word, a technical progress is neutral if the
marginal productivity of capital will remain the saving. But, the marginal productivity of
capital is not constant, then, the technical progress is said to be non-neutral. But is the change
in marginal productivity of capital is positive when capital-output ratio is constant, the
technical progress is capital augmenting or labour savings. On the other hand, if the rate of
profit is constant when the output-capital ratio is rising, the technical progress is said to be
labour augmenting or capital savings.
Given the production function
Y=F (K, L, t) where t represent time. It is assumed that the technical progress
increases the output with passage of time even if L and K remain the same. Technical
progress shows the increase in efficiency of at least one input which causes the total output to
increase with the same inputs. The efficiencies increase with the passage of time so that they
can be regarded as functions of time.
Let A (t) be the efficiency function associated with capital and B(t) be the efficiency
functions associated with the labour. Now, incorporating these efficiency functions in the
production function we get,
Y= F[A(t) K, B(t) L]

88
This is called factor augmenting production function. The expression A (t) K is called
capital efficiency units and the expression B(t)L is the labour efficiency units. K and L are
factors in physical units. Although factor quantities remain unchanged in physical units their
supply increases in efficiency units.
Thus, given the production function in factor augmenting form as above, it can be
stated that:
A Technical progress in is Harrod neutral or labour augmenting if B(t) > 1 and A(t) = 1.
On the other hand, the technical progress is capital augmenting, if A(t) > 1 and B(t) = 1.
5.4.2 Solow Version
Solow-neutral technical progress is just the opposite of Harrod-neutral technical
progress. According to Solow, technical progress is neutral if the marginal productivity of
labour remains at constant labour output ratio (L/Y). The technical progress is said to be
Solow neutral if the proportionate change in relative share of factors (I) is zero i.e. I = 0,
along the path where Y/L is constant. Thus, if the output-labour ratio (Y/L) is constant and
the marginal productivity of labour is also constant, then the technical progress is Solow –
neutral.
However, if the marginal productivity of labour is not constant along a path when Y/L
is constant, the technical progress is non-neutral. If the change in marginal productivity of
labour is positive, the technical progress is labour augmenting. On the other hand, if the
change in marginal productivity of labour is negative, then the technical progress is capital
augmenting.
Given the production function;
Y= F (K, L,t) where t represents time. If the technical progress takes place, the output
will increase without any increase in inputs. This is because the technical progress increases
the efficiency of factors. Let A (t) and B(t) be the efficiency function associated with capital
and labour respectively.

89
Now, by incorporating these efficiency functions in the production function, we get,
Y= F[A(t) K, B (t) L]
This is called factor augmenting production function. Given the production function,
if A(t) > 1 and B(t) =1, then the technical progress is called Solow neutral. Thus, Solow
neutral technical progress is capital augmenting. This means that efficiency of labour has
remained constant and that of Capital has increased. This encourages the use of more capital
and discourages the use of labour. So, it is called capital augmenting or labour- saving
technical progress.
Thus, we find that a technical progress is Harrod neutral, if the rate of profit or the
marginal productivity of capital remains constant, along the path where capital-output ratio is
constant. The increase in output is achieved due to increase in productivity of labour so,
Harrod neutral technical progress in labour augmenting.
In the case of Solow neutral technical progress, the marginal productivity of labour
remains constant along the path where output-labour ratio is constant. The increase in output
is achieved due to increase in productivity of capital. So, Solow neutral technical progress is
capital augmenting.
5.5 Disembodied and embodied Technical Progress
The technical progress can be embodied or disembodied. The attempt to measure the
contribution of technical progress was made by Abramovitz in 1956 followed by Kendrick
and Solow. They considered the technical progress to be disembodied.
5.5.1 Disembodied Technical Progress
Disembodied technical progress is one which allows more output to be produced from
the same inputs. Disembodied technical progress is based on the assumption that all labour
and capital are homogenous. Disembodied technical progress affects all factors of production
which are in current use equally and alike. It improves the productivity of all factors of
production and of those already in existence. In case of disembodied technical progress,

90
technical knowledge is assumed to come from outside the system like the falling of manna
from the heaven. If the rate of technical progress depends on non-economic factors it can be
regarded as exogenous. But if it depends on the economic factors like rate of capital
formation or the rate of profit then the technical progress can be regarded as endogenous.
Disembodied technical progress shifts the production function in such a way that
leaves the balance between capital and labour undisturbed in the long-run. The production
function for such technical change is:
Y = F(K, L; t)
Where, Y is the output and K and L are capital and labour and t represents the
technical change. Taking Hicks-neutral technical change as the basis, the production function
in the special form can be written as;
Y = A(t) F (K, L)
Where A (t) in the index of technical progress which shifts the production function. It
implies that the technical progress is organizational in the sense that its effects on
productivity do not required any change in the quantity of the factors. It just shifts the
production function upward through time.
Criticism
The disembodied technical progress suffers from the following drawbacks;
a) It emphasizes only on the technical progress and undermines the role of investment in
the growth process.
b) It is based on unrealistic assumption of perfect competition, constant returns to scale
and homogeneity of the capital stock.
c) It assumes that the output changes only due to technical progress. But output may also
change due to change in quality of inputs, economies of scale and advances in
knowledge.

91
5.5.2 Embodied Technical Progress
On the other hand, embodied technical progress is one in which the technical progress
comes from within the system. In case of embodied technical progress all factors of
production are not equally affected. It considers new capital formation as the vehicle of
technical progress. The technical progress increases the productivity of only some factors.
Embodied technical progress increases the productivity of only those machines which are
built in the current period compared to the machines built in the previous periods. Technical
progress does not increase the productivity of machines already in existence. In this case, the
technical progress is said to be ‘embodied’ in new machines or the currently employed
labour. Machines built in different dates are called machines of different vintages. Embodied
technical progress is based on the assumption that machines built in different vintages are not
similar and hence capital is not homogeneous. Similarly labour of one vintage is different
from the labour of other vintages. However, each vintage consists of homogenous capital and
labour. Therefore, a separate production function is needed to analyse the each vintage.
Accordingly labour may also be treated in a similar way. Men of different vintages can be
distinguished by age and training. Men of current vintage may be more productive than those
of early vintages due to provision of better education and training.
Thus, the main point of difference between the disembodied and embodied technical
progress is that while the former assumes that labour and capital are homogenous, the later
holds that labour and capital of different vintages are not homogenous.
5.6 Overview of Endogenous growth theory
The endogenous growth theory explains that the long-run growth rate of an economy
is determined by the exogenous factors. Since the growth is taken to be endogenously
determined, the theory did matters the role of government. The endogenous growth theory
criticized the neoclassical growth theory and extended the theory by introducing endogenous
technical change.

92
The endogenous growth models have been developed by Arrow, Romer and Lucas.
The endogenous growth models emphasis on technical progress which comes from the rate of
investment, capital stock, the stock of human capital and serving rate.
Assumption
The endogenous growth models are based on the following assumptions;
1) There are a number of firms in the market.
2) Technological advance is a non-rival good.
3) There are increasing returns to scale to all factors taken together and constant returns
to a single factor.
4) Technological advance is based on innovative ideas of people.
5) The individuals and firms earn profits from their innovations.
Given these assumptions, the three models of endogenous growth can be briefly
explained as follows;
5.6.1 Arrow’s learning by doing model
Arrow in his famous article “The Economic Implications of learning by Doing” in
1962 introduced the concept of learning by doing for the firm. In this model technical
progress is regarded as an increase in some kind of knowledge and skill which come from the
learning process. Learning is the product of experience. More is the experiences greater will
be the learning and the faster will be the rate of technical change. According to Arrow, it is
the cumulative gross investment in the economy which is used as an index of experience and
not the cumulative output. Arrow uses a vintage approach in which technical progress is
embodied in new machines. Labour requirement per unit of output on new machines decline
over time as experience increases.
Arrow uses the following function expressing the labour requirement of the latest
machine in a specific form as – G-M, where G is the total number of machines ever produced
and M is a parameter, O< M < 1. The technical progress is assumed to be embodied in new
machines. So are act of investment does not raise the productivity of labour working on
existing machines, but it raises the productivity of labour working on any machines that are
built subsequently as it raises G.

93
Arrow shows that output in this model is capable any steady growth at the rate 𝑛
𝐼−𝑀.
Where n is the rate of growth of population. The steady growth requires an equal rate of
increase of G and output. The population growth provides a source of increase in output and
experience which comes from the investment in learning process provides additional impetus
to the growth. Growth could be maintained at a steady rate if there are some exogenous
technical progress going on as well as learning.
5.6.2 The Romer’s Model
Paul M. Romer in his paper ‘Increasing returns and long-run Growth’ in 1986
presented a variant of Arrow’s model which is known as learning by investment. According
to Romer knowledge which is the product of investment has two components. The first
component is the human capital which specific to person and can be regarded as a rival good.
The second component is the technology which is available to the public and is a non-rival
good. It is non-rival in the sense that its use by one firm does not limit its use by others. But
human capital is a rival good because the person who invests in its accumulation solely
receives the rewards from it. Technology is non-rival as the benefits of new technology come
to the others as well. That is the benefits do not come only to the discoverer. The knowledge
spillovers and will also use the new technology. Hence, there is a positive externality of
investment which leads to creation of knowledge.
Romer assumes human capital to be fixed. A part of it is used for the production of
the final good and a part is used for improvement of technology.
Suppose So is the fixed supply of human capital, Sy is the amount of human capital
used in production of final goods (Y) and SA is the supply of human capital for the
improvement of technology (A), then,
Sy + SA = So
The technology A is not fixed as it can be created by using a part of human capital
(SA) in research and applying the existing technology A as follows:

94
�̇� = 𝜎𝑆𝐴. 𝐴
𝐴𝐴⁄̇
= 𝜎𝑆𝐴
Where; 𝜎is the research success parameter. 𝐴 𝐴⁄̇
is the rate of growth of technology. 𝐴 𝐴⁄̇
will
be positive so long as both 𝜎 and SA are positive. Thus, research is assumed to be human
capital intensive and technology intensive with no capital (K) and ordinary unskilled labour
(L) engaged in that activity.
Romer takes knowledge as an input in the production function which is specified as
follows:
Y = A (R) F ( (Ri Ki, Li)
Where Y is the output, A is the stock of knowledge from R research and development,
Ri is the stock of results from expenditure on research and development by firm I, and Ki and
Li are capital and labour of firm i respectively.
He assumes the function to be homogeneous of degree one in all inputs.
The three key elements of the model are: internalities, increasing returns in the
production of output and diminishing returns in the production of new knowledge. According
to Romer, it is the research efforts by a firm which leads to creation of new knowledge or
technology. The new technology spills over to the other firms and across the entire economy.
To Romer, new knowledge is the ultimate determinant of long-run growth and knowledge is
determined by investment in research. But research technology exhibits diminishing returns.
Moreover, the technology created by a firm spills over to other firms due to inadequacy of
patent protection. The other firms also use the new technology and increase their production.
Thus, the production of goods from increased knowledge exhibits increasing returns. Romer
takes investment in research technology as an endogenous factor in terms of the acquisition
of new knowledge by profit maximizing firms.

95
5.6.3 The Lucas Model
Robert Lucas in his article on the Mechanics of Economic Development in 1988
regarded investment in human capita as endogenous factors. He assumes that investment on
education leads to creation of human capital which is the key determinant of growth. He
distinguishes between the internal and external effects of human capital. Internal effects of
human capital makes the workers undergoing training more production. The external effects
of human capital refer to the spillover which increases the productivity of capital and other
workers in the economy. Thus, it is the investment in human capital which ahs spillover
effects and increases the level of technology.
The production function of firm i can be written as ;
Yi = A (Ki) . (Hi). He
Where A is the technical coefficient, Ki and Hi are the physical capital and human
capital used by the firm i.
Yi is the output produced by firm i, the variable H is the average level of human
capital of the economy, e shows the strength of the external effects from human capital to
each firm productivity.
In this model each firm experience constant returns to Scale, while the economy as a
whole experiences increasing returns to scale. Each firm benefits from the average level of
human capital in the economy. Thus, it is the average level of skills and knowledge in the
economy which is vital for growth.
The endogenous growth models showed that it is the endogenous factor which
determines long-runs growth. However, the theory suffers from certain problems such as too
much emphasis on the role of human capital and neglects the role of institutions, no clear
distinction between physical and human capital.

96
5.7 Growth under vintage capital model
The vintage capital approach is based on the embodied technical progress. The model
considers capital accumulation as the vehicle to technical progress. In this model, the
technical progress which is the source of growth in output is embodied in machines built in
any particular period compared with machines built in the previous period. The technical
progress increases the productivity of new machines but it does not increase the productivity
of old machines. This is because the technical progress in embodied in the new machines.
The machines built in different dates are the called the machines of different vintages. They
are not similar in quality and they are not similar in quality and they cannot be aggregated
into single measures of capital so a separate production function is required to measure the
contribution each vintage.
The total output can be obtained by aggregating the outputs from all the vintage in use.
Assumptions: The model is based on the following assumptions:
1) The machines of different vintages constitute capital stock.
2) the machines of different vintages are not homogeneous.
3) New machines are more productive than the older ones.
4) the technical changes takes place at some proportion rate.
5) The technical changes are embodied in new machines.
6) Machines embody all the latest knowledge at the time of construction.
7) It considers only gross investment in new machines.
8) All technical change is uniform.
9) The production functions is linear homogeneous of Cobb-Douglas type.
Given these assumption, the model can be explained as follows;
In this model we need two time variable; one for the time in usual sense, say t, and the
other, say V, for date of vitages of machines in use at time t.
Machines may be subjected to depreciation so as machines get older, their quasi-rent
falls and eventually becomes zero when the machines are scrapped. For Simplicity it is

97
assumed that there is no depreciation. Hence, it is important to find out the economic life (J)
of machine of a particular vintage as a variable in the model. Generally, the machines in use
at time t are of vintages V, where, t – T ≤ V≤ t.
The model assumes that technical progress falls from the outside only on new
machines. At time t, machines of vintages V are benefited from the technical progress. It is
important to consider the substitutability between machines and labour before and after the
installation of new machines. The substitutability between machines and labour can be
assumed according to a smooth production. In general, the function will vary from one vitage
to another.
Now, the production function for machines of vintage V, at time t, may be written as;
Qv = Fv (Kv, Lv) ---- (1)
Where, Kvis the number of machines Lv is the number of labour inputs and Qv is the
output. For simplicity, let us assume that the same function is applicable for all vintages. In
Cobb-Douglas form, the above function may be written as –
𝑄𝑣 = 𝛼𝜕𝑣𝐾𝑣𝛼𝐿𝑣
1−2 − − − −(2)
Where 𝜕 is the rate of technical progress, 𝜕 > 𝑜 𝑎𝑛𝑑 𝑜 < 𝛼 < 1
If the production function is of the Cobb-Douglas from
𝑄𝑡 = 𝑒𝜕𝑡𝐾𝑡�̇�𝐿𝑡
1−𝛼
𝜕 > 𝑜 𝑎𝑛𝑑 𝑂 < 𝜕 < 1
In Harrod-neutral technical change, it can be written as
𝑄𝑡 = 𝐾𝑡𝛼(𝑒
𝜕𝑡
1−𝛼𝐿𝑡)1−𝛼
= 𝐾𝑡𝛼(�̅�𝑡)1−𝛼
Where,
= �̅�𝑡 = 𝑒𝜕𝑡
1−𝛼. 𝐿𝑡1−𝛼
= e mt.Lt
Here, m = 𝜕
1−𝛼

98
or, 𝜕 = m (1- 𝛼)
It is the efficiency units of labour m represent the Harrod-neutral technical progress.
In Solow-neutral technical progress, the production function may be written as,
𝑄𝑡 = (𝑒𝜕
𝛼𝑡𝐾𝑡)𝛼. 𝐿𝑡
1−𝛼
(𝐾𝑡)𝛼 . 𝐿𝑡1−𝛼
Where, 𝐾𝑡 = 𝑒𝜕
𝛼𝑡𝐾𝑡𝐾𝑡 is the efficiency units of machines = 𝑒𝑚′𝑡𝐾𝑡
Where m’ = 𝜕
𝛼 is the rate of Solow-neutral technical progress.
m’ = 𝜕
𝛼=
𝑚(1−𝛼)
𝛼
Thus, the Cobb Douglas production function represents both Harrod-neutral and
Solow – neutral technical progress.
The question that arises in this model relates to the substitution between machines and
labour at any time after the installation of the machines of Vintage V in time t. There are two
alternative cases which are possible:
Case I – The substitution between labour and capital countries.
Case II- After the installation of new machines, labour and capital are used in fixed
proportion.
Let us consider the first case, which has smooth substitution between labour and
capital both before and after the installation of new machines. This case is called Putty-Putty
case following Phelps. Machines are installed in a continuous of vintages. The number of
machines of vintage V is KV which varies with V. KV is the rate of installation per unit of
time and KVdv. The machines are assumed to of infinite life and the number of machines of
vintage v in use at time t remains as Kv for all t. v.
The production function is assumed to be Cobb-Douglas form for all vintages. It can
be written as ;
Qv(t) = 𝑒𝑚(𝐼−𝛼)𝑣𝐾𝑣𝛼{𝐿𝑣(𝑡)}𝐼−𝛼 − − − − − (3)

99
It shows that technical progress at Harrod neutral rate m is operative up to the time v
at which the machines are brought in, but not thereafter. The number of machines of vintage
V in use remains constant at KV. So, Lv(t) and Qv(t) are only the time variable in the
equation ---(3)
Regarding the contribution of labour to the total output, it is assumed that under
perfect competition in the labour market all homogeneous units of labour must receive the
same wage. Hence, the wage rate W(t) equals the marginal product of labour for machines of
each vintages at time t
𝑊(𝑡) = 𝜕𝑄𝑣(𝑡)
𝜕𝐿𝑣(𝑡) 𝑓𝑜𝑟 𝑒𝑎𝑐ℎ 𝑣 𝛼+ > 𝑣.
From equation (3) we get
𝜕𝑄𝑣(𝑡)
𝜕𝐿𝑣(𝑡)= w(t) for each V and t ≥ v ---- (4)
The allocation of labour follows from (3) and (4) which determines Qv (t) and Lv(t) at
ruling wage rate W(t).
From (3) we have –
Qv(t) = 𝑒𝑚(1−𝛼)𝐾𝑣𝛼{𝐿𝑣(𝑡)}1−𝛼
But from equation (4) we get
Lv(t) = (1−𝛼)𝑄𝑣(𝑡)
𝑊(𝑡)
Thus, we have,
Qv(t) = 𝑒𝑚(1−𝛼)𝑣𝐾𝑣𝛼{
(1−𝛼)𝑄𝑣(𝑡)
𝑊(𝑡)}1−𝛼
𝑂𝑟, {𝑄𝑣(𝑡)}𝛼𝑒𝑚(1−𝛼)𝑣𝐾𝑣𝛼(1 − 𝛼)1−𝛼 {𝑊(𝑡)}−(1−𝛼)
∴ 𝑄𝑣(𝑡) = 𝑒𝑚(1−𝛼)
𝛼𝑣 . 𝐾𝑣 . (1 − 𝛼)
1−𝛼
𝛼 . {𝑊(𝑡)}−(1−𝛼)
𝛼

100
𝑂𝑟, 𝑄𝑣(𝑡) = 𝑒𝑚′𝑣 . (1 − 𝛼)1−𝛼
𝛼 . {𝑊(𝑡)−(1−𝛼)
𝛼 . 𝐾𝑣 − − − − − (5)
Where m’ = 𝑚(1−𝛼)
𝛼
Again Lv(t) = (1−𝛼)𝑄𝑣(𝑡)
𝑊(𝑡)
(1−𝛼)
𝑤(𝑡). 𝑒𝑚(1−𝛼)𝑣𝐾𝑣
𝛼{𝐿𝑣(𝑡)}1−𝛼
𝑂𝑟, {𝐿𝑣(𝑡)}𝛼. 𝑒𝑚(1−𝛼)𝑣𝐾𝑣𝛼
∴ 𝐿𝑣(𝑡) = (1 − 𝛼)1
2. 𝑒𝑚(1−𝛼)
𝛼𝑣 . 𝐾𝑣
Or, 𝐿𝑣(𝑡) = 𝑒𝑚′𝑣 . (1 − 𝛼)1
2. 𝑊(𝑡)1
2. 𝐾𝑣
The equation, (5) and (6) shows that labour and output per machine for any vintage V
depend only on the changing wage rate overtime. If W(t) increases then the allocation of
labour to a machine of a given vintage will decline and output from the machine will also
decline.
If Q(t) is the output obtained from all machines and L(t) is the labour employed, at
time t, then the total output is given by the integration over all layers of capital stock. Thus,
we have –
𝑄𝑡 = (1 − 𝛼)1−𝛼
𝛼 {𝑤(𝑡)−(1−𝛼)
𝛼 ∫ 𝑒𝑚′𝑣
𝑡
−∞
𝐾𝑣 . 𝑑𝑣
𝑎𝑛𝑑 𝐿(𝑡) = (1 − 𝛼)1
2{𝑤(𝑡)1
2 ∫ 𝑒𝑚′𝑣
𝑡
−∞
𝐾𝑣 . 𝑑𝑣
∴𝑄(𝑡)
𝐿(𝑡)=
1
1−𝛼𝑤(𝑡)
Here, Q(t), L(t) and W(t) are time variables.
𝑤(𝑡) = (1 − 𝛼)𝑄(𝑡)
𝐿(𝑡)− − − − − (7)
And,
𝑄(𝑡) = (1 − 𝛼)1−𝛼
𝛼. {𝑊(𝑡)
−(1−𝛼)
𝛼. 𝐽9𝑡) − − − −(8)

101
𝐿(𝑡) = (1 − 𝛼)1
2. {𝑊(𝑡)}
−1
2. 𝐽(𝑡) − − − (9)
Where,
𝐽(𝑡) = ∫ 𝑒𝑚′𝑣 .𝑡
−∞𝐾𝑣𝑑𝑣
J(t) represents the aggregate capital stock which is obtained by integrating the
numbers of machines of various vintages. Solow calls the ‘J” variable as the effective stock
of capital which is productivity weighted sum of all the existing machines. Solow sound that
the higher is the rate of embodied technical progress, the more productive will be the new
capital than the older ones and the greater the scope for raising economic growth by
increasing investment.
5.7.1 Limitations
The model suffers from certain limitations which are as follows:
1. It does not take into account the influence of wage expectations on machine
construction.
2. The model does not consider the factor market imperfections as it is based on perfect
competition which is unrealistic.
3. It assumes that machines depreciate exponentially which is not true for most
machines.
4. The model assumes that machines are of different vintages and new machines are
better than old ones. But it does not consider capital in general which is known as the
aggregation of capital stock.
5. The model assumes that technical progress is embodied in new machines and ignores
the innovations which come through the learning process and investment in research.
Despite, this limitation, the model has very interestingly explained the role of
embodied technical progress in economic growth.
5.8 Let’s Sum UP
The technical progress plays an important role in economic growth. Technical
progress can neutral and non-neutral. In case of neutral technical progress, the productivity of

102
both labour and capital equally and encourages their use. It is neither labour saving nor
capital saving. But in case of non-neutral technical progress, the productivity of one of the
factors raises more than that of others so the non-neutral technical progress can be either
labour saving or capital saving. In Harrod neutral technical progress the productivity of
capital or the rate of profit remains constant at unchanged capital output ratio. But in case of
Solow-neutral of Solow-neutral technical change the marginal productivity of labour remains
constant at unchanged output-labour ratio.
On the basis of source of origin, the technical progress can be disembodied and
embodied. Disembodied technical progress is one which came from outside and is
exogenously determined. On the other hand, embodied technical progress is one which comes
from within the system and is determined by endogenous factors like rate investment. The
technical progress is considered to be embodied in now machines which increases the
productivity of only some factors.
The endogenous growth theory which was developed against the neo-classical growth
theory showed that the growth is determined by the endogenous factors. These endogenous
factors are the investment in education and research and development which creates
knowledge, human capital and technology. The vintage capital model shows that the growth
is determined by the technical progress which embodied in the new machines. the model
assumes that capital goods or machines of different vintages are not homogenous. The new
machines are more productive than the older ones as technical progress is embodied in new
machines. The total output is obtained by integrating over all layers of capital stock.
5.9 Key Words
Capital-Output ratio: It is the amount of capital required to produce one
unit of output of a given commodity.
Capital-labour ratio: It the amount of capital needed to employ one unit
of labour.
Homogenous: It is used to denote identical or similar products or
factors.
Human capital: It refers to the skills, knowledge and experience
possessed by an individual.

103
Vintage capital: It refers to the machines or capital built in a
particular period.
5.10 Questions
1. Distinguish between neutral and non-neutral technical change. Explain the Harrod
neutral technical change.
2. Explain the Hicks-neutral technical change.
3. Analyse Harrod and Solow versions of labour and capital augmenting technical
change.
4. Differentiate between disembodied and embodied technical change.
5. Outline the overview of the endogenous growth theory.
6. Evaluate the growth under vintage capital model.
5.11 Further/Suggested Readings
Sarkhel, J., Growth Economics, Book Syndicate Pvt. Ltd.
Thirwal, A.P., Growth and Development, MacMillan, London.
Solow, R.M., Growth Theory-An Exposition, Oxford University Press.
Sen, A., (Ed.), Growth Economics, Penguine

104
UNIT-VI
APPROACHES TO ECONOMIC DEVELOPMENT
Structure
6.1 Introduction
6.4 Objectives
6.3 Traditional approaches to Development
6.4 Rodan’s Theory of big push
6.5 Nurkse's Model of Balanced Growth
6.5.1 Size of market and incentive to invest
6.5.2 Determinants of the size of market
6.5.3 Productivity and economic development
6.6 Unbalanced Growth –Hirschman’s Strategy
6.6.1 Criticism of unbalanced growth theory
6.7 Ranis –Fei Model
6.8 Let us sum up
6.9 Key Terms:
6.10 Long Questions
6.11 Further/Suggested Readings.
6.1 Introduction
This unit deals with the various approaches to economic development. Broadly, there
are two approaches to economic development, namely balanced growth and unbalanced
growth. Most of theories of balanced and unbalanced growth were developed during 1940s
and 1950s. During those periods many newly independent countries were struggling to
promote their economic development. The development missions were aimed to guide those
countries to adopt the best strategy to achieve faster rate of development.
6.5 Objectives
The objectives of these units are to discuss the important the theories and approaches to
development of underdeveloped countries.

105
6.3 Traditional approaches to Development: Balanced versus unbalanced growth
The doctrine of balanced growth states that there should be balanced growth of all
sectors of the economy simultaneously. It calls for a big push or a large scale planned
investment in a wide range of activities in order to overcome the low level equilibrium trap. It
implies that simultaneous investment in all sectors such as agricultures industry,
manufacturing and services etc. It needed to promote development: Balanced growth requires
a balance between different consumers’ goods industries and between consumer goods and
capital goods industries. It also requires a balance between agriculture and industry, balance
between export and import sector. Further, it requires balance between social and economic
overheads and directly productive activities.
The theory of balanced growth implies that there should be simultaneous and
harmonious development of different sectors of the economy. The theory of balanced growth
was supported by economists like Ragnar Nurkse, Arthur Lewis, Rosenstein Rodan and Allyn
Young.
On the other hand the doctrine of unbalanced growth states that investment should be
made in certain selected sectors or industries rather than simultaneously in all sectors of the
economy. The theory argues that underdeveloped countries do not possess sufficient capital
and other resources to invest simultaneously in all the sectors of the economy. The theory of
unbalanced growth was supported by economists Albert O. Hirschman, Hans Singer, paul
Streeten.
According to the proponents of unbalanced growth, deliberate unbalancing of the
economy is the best way to achieve development in underdeveloped countries. The theory
states that investment is strategically selected industries or sectors of the economy will
generate external economies and create new investment opportunities. This will pave the way
for further economic development.
6.4 Rodan’s Theory of Big Push
Paul N. Rosenstein Rodan is one of the proponents of balanced growth. He developed
the theory of big push in 1943. The theory of big push states that a big push in the form of a

106
high minimum quantum of investment is needed in as underdeveloped country to overcome
the obstacles to development and to lunch it on the path of progress. The theory states that
proceeding bit by bit will not make sufficient effects to launch the economy successfully on
the development path. A minimum quantum of investment is necessary conditions of success.
In his theory, Rodan Stressed on the limitations imposed by the size of the market in
an underdeveloped economy. He has restated his theory in terms of “three indivisibilities”.
He stressed upon the necessity of obtaining external economies for development. There
indivisibilities and external economies require a high minimum quantum of investment.
The three different kinds of indivisibilities are as follows;
1. Indivisibilities in the production function (supply of social overhead capital)
2. Indivisibility of demand. (Complimentarily of demand)
3. Indivisibility in the supply of savings.
Rodan argued that because of these indivisibilities proceeding ‘bit by bit’ will not be
sufficient to overcome the problems of underdeveloped countries. Therefore, he calls for a bit
push in the form of a high minimum quantum of investment. According to him a big push is a
necessary condition of success.
Rondan’s three indivisibilities which necessitate big push are discussed as follows;
Indivisibilities in the production function
The most important indivisibility and external economies on the supply side is the
supply of social overhead capital such as power, transport, communications, housing etc.
their production requires wage investment and has long gestation period. Social overhead
capital is irreversible in time. It must be supplied prior to directly productive investment. It is
important for development because it creates investment opportunities in other industries.
Indivisibility of Demand
Rodan also stressed on the indivisibility of demand. It refers to the complementarities
of demand. Different industries catering to consumer goods are interdependent in the sense

107
that they provide market for each other and thus help each other and flourish. Therefore, he
calls for large scale investment in setting up a number of interdependent and complementary
industries. To him, individual investment projects have a high risk as there is always an
uncertainty of demand.
Rodan uses an example of shoe making industry to explain the complementarily of
demand. Suppose, in a closed economy if 100 workers who were undisguised employment
were put into a shoe making factory, their wage would constitute additional income. If the
newly employed workers spend all of their income on shoe they produce, the shoe factory
would find a market and would probably succeed. However, the fact is that they would not
spend their entire income on shoes. Hence, the risk of not finding market reduces incentives
to invest. The three factory investment will probably be abandoned.
Now, let us change the example and instead put ten thousand workers in one hundred
factories which produce different consumer goods. The workers will spend their income in
purchasing goods produce in each other’s industries and complement each other. The
complementarity of demand would reduce risk and encourage investment and promote
development.
Indivisibility in the Supply of Savings
A high income elasticity of savings is the Rodan’s third indivisibility. To him a high
minimum size of investment requires a high volume of savings which is not easy to achieve
in underdeveloped countries. To overcome this problem, he suggests that when income
increases due to an increase in investment, the marginal rate of saving should be higher than
the average rate of savings.
Given these indivisibilities and external economies to which they give rise, Rodan
Stressed that a big push or a large quantum of investment is needed to launch an
underdeveloped country on the path of development.

108
Criticism
The big push theory has criticized on the following grounds:
1. Big push beyond the capacity of underdeveloped countries: Underdeveloped
countries are poor and suffer from scarcity of resources. So, it is very difficult for
them to give a big push or large scale investment in all sectors or industries. Big push
is desirable but not feasible in underdeveloped countries.
2. Neglects investment in agriculture: The theory emphasizes the importance of a high
level of investment in all types of industries except agriculture and other primary
industries. But an underdeveloped country needs a big push in agriculture sector for
irrigation facilities, transport facilities, supply of improved seeds, inputs and tools and
implements.
3. Ignores export and import substitutes: The theory calls for a big push or large scale
investment in social overhead capital for realization of extensive external economies.
But Viner pointed out that underdeveloped economies realize greater external
economies through international trade.
4. Big Push generates inflationary pressure: Big push on social overhead capital may
lead to inflationary pressure in the economy as social overhead capital has a high
capital-output ratio and a very long gestation period. The inflationary pressure may
adverse affect the development process underdeveloped countries.
5. Administrative and Institutional problems: The theory emphasizes on the role of
state or government in undertaking large scale investment. But the administrative and
institutional machineries in underdeveloped economies are weak and insufficient.
6. Big push not a historical fact: Big push or balanced growth is not a historical fact.
According to Prof. Hagen, historically, the presence or absence of a big push has not
been a distinguishing feature of growth anywhere. Many things have grown but
everything has not grown simultaneously.
Despite these criticisms, it can be concluded that Rodan’s big theory has show
the path of development to underdeveloped countries.

109
6.5 Nurkse's Model of Balanced Growth
Ragnar Nurkse was one of pioneers of balanced growth theory. The theory states that
an underdeveloped country needs to make large investments in a number of industries
simultaneously to overcome the obstacles to development. This will enlarge the market size,
increase productivity, and provide an incentive for the private sector to invest. His argument
resembles Rodan's idea and indeed he cites Rodan's famous example of shoe making
industries to support his statement.
According to Nurkse balanced growth in both the industrial and agricultural sectors of
the economy is required to promote growth. He recognized that the expansion and inter-
sectoral balance between agriculture and manufacturing is necessary so that each of these
sectors provides a market for the products of the other and in turn, supplies the necessary raw
materials for the development and growth of the other.
Nurkse's argues that the main problems of an underdeveloped country are; small size
of market and vicious circles of poverty. The small size of market leads to low inducement to
invest and capital deficiency. He also discusses the various determinants of the market size
and puts primary focus on productivity. There are vicious circles of poverty in
underdeveloped countries which work on both demand and supply sides. On the demand side,
an underdeveloped country has low productivity, low income which leads to low demand,
low investment. Capital deficiency and again to low productivity. On the supply side, low
productivity leads to low income, low savings, low investment, capital deficiency and again
to low productivity.
According to Nurkse, development can place in such country only when the vicious circles
are broken and the size of market is enlarged. Therefore, he calls for balanced growth in the
form of large scale investment in a wide range of industries. To him most of the industries
catering for mass consumption are complementary in the sense that they provide market for
each other and thus support each other. The establishment of a number of interdependent
industries will expand the size of market and increases incentive to invest. This will lead to
capital formation and increases productivity. According to him, if the productivity levels rise
in a less developed country, its market size will expand and thus it can eventually become a
developed economy.
110
According to him substantial use of capital by an individual entrepreneur in an
industry may not be profitable due to small size of market. On the other hand, a synchronized
application of' capital in a wide range of projects in different industries may raise the general
level of economic efficiency and enlarge the market size, promote investment and accelerate
economic growth. In underdeveloped countries people lack adequate purchasing power. Low
purchasing power means that the real income of the people is low. It is to be noted that a low
purchasing power means that domestic demand for commodities is low.
6.5.1 Size of market and incentive to invest
The size of the market determines the incentive to invest. This is because
entrepreneurs invariably take their production decisions by taking into consideration the
demand for the concerned product. For example, if an automobile manufacturer is trying to
decide which countries to set up plants in, he will naturally only invest in those countries
where the demand is high. Therefore, he favours large scale investment in many industries
and sector simultaneously as there is complementarities of demand between different sectors.
This will expand the size of market and promote economic growth.
6.5.2 Determinants of the size of market
According to Nurkse, expanding the size of the market is crucial to increase the
inducement to invest. The vicious circle of poverty can be broken only by expanding the size
of market. The size of the market is determined by the following factors:
Money supply: According to Nurkse the problem of underdeveloped countries is the
lack of real purchasing power which is due to low productivity levels. Thus, merely
increasing the supply of money will not expand the market but will in fact cause inflationary
pressure.
Population: Nurkse argued against the notion that a large population implies a large
market. Though underdeveloped countries have a large population, their levels of
productivity are low. This results in low levels of per capita real income. Thus, consumption
expenditure is low and savings are either very low or completely absent. On the other hand,

111
developed countries have smaller populations than underdeveloped countries but by virtue of
high levels of productivity. Their per capita real incomes are higher and thus they create a
large market for goods and services.
Geographical area: Nurkse rejected the view that country's geographical area is
large. The size of its market also ought to be large. A country may be extremely small in area
but still have a large effective demand. For example, Japan. In contrast, a country may cover
a huge geographical area but its market may still be small. This may occur if a large part of
the country is uninhabitable or if the country suffers from low productivity levels and thus
has a low National Income.
Export promotion: The size of market can also be expanded through promotion of
export. Nurkse emphasized that tariff duties, exchange controls, import quotas and other non-
tariff barriers to trade are major obstacles to promoting international cooperation in exporting
and importing. As a result, the amount of capital accumulation remains small. To overcome
this problem customs unions have been formed to promote trade by removing customs duties.
However, Nurkse did not agree with this view. He view that underdeveloped countries
produced mainly primary products which of low elasticity of demand. So he is regarded as
export pessimist.
Sales promotion: It argued that demand for products can be increased through
extensive use of advertisement and other sales promotion technique. However, Nurkse argues
that such activities cannot succeed at the macro level to increase a country's aggregate
demand level. He calls this the "macroeconomic paradox".
According to Nurkse increase in productivity is the best way to expand the size of
market. To him productivity is the primary determinant of the size of the market. An increase
in productivity increases the flow of goods and services in the economy. As a response,
consumption also rises. Hence, underdeveloped economies should aim to raise their
productivity levels in all sectors of the economy, in particular agriculture and industry. This
requires large investment in all the sectors. So he calls for balanced growth.
6.5.3 Productivity and economic development
Nurkse also discusses the relationship between productivity and economic development. In
most underdeveloped economies, the technology used to carry out agricultural activities is

112
backward. There is a low degree of mechanization coupled with rain dependence. So while a
large proportion of the population around 80 per cent is actively employed in the agriculture
sector, the contribution to the Gross Domestic Product is usually low. Hence, there is a need
to increase productivity. For this the government should invest in providing facilities such
irrigation facilities. High-yielding variety seeds, pesticides, fertilisers, tractors etc. This will
lead to increase in farmers' income and purchasing power. Their demand for other products in
the economy will rise and this will provide industrialists an incentive to invest in that country.
Thus, the size of the market expands and improves the condition of the underdeveloped
country.
Nurkse is of the opinion that in underdeveloped countries, if the money incomes or
the people rise while the price level in the economy stays the same, the size of the market will
still not expand till the real income and productivity levels rise. Nurkse approves Say's law
and stales that "In underdeveloped areas there is generally no 'deflationary gap' through
excessive savings. Production creates its own demand, and the size of the market depends on
the volume of production. In the lust analysis, the market can be enlarged only through all-
round increase in productivity Capacity to buy means capacity to produce.
Finally, Nurkse calls for a large amount of investment in the economy which expands
the market size expands and leads to higher productivity levels, increasing returns to scale
and eventually the development of the country in question. However, most economists who
favoured the balanced growth hypothesis believed that only the state has the capacity to take
on the kind of heavy investments the theory propagates. Further, the gestation period of such
lumpy investments is usually long and private sector entrepreneurs do not normally undertake
such high risks. Nurkse contends that the choice between public and private enterprises for
achieving the required.
6.5.4 Criticisms
Nurkse's balanced growth theory has been criticised by Hirschman and Hans Singer
on the following grounds.
(a) Balanced growth beyond the capacity of underdeveloped countries: Hirschman
argued that underdeveloped economies lack of resources both .financial and human.
They do not have resources such as skilled labour and technology. Thus, to assume that

113
an underdeveloped nation can undertake large scale investment in many industries of its
economy simultaneously is unrealistic due to the paucity of resources.
(b) Balanced growth applicable to developed economy: Hans Singer asserted that the
balanced growth theory is more applicable to cure an economy facing a cyclical
downswing which is a feature of advanced countries rather than of underdeveloped
countries.
(c) Say's Law of market does not operate: Nurkse states that Say's Law of' market
operates in underdeveloped countries and Supply creates a matching demand for the
output. However, Keynes stated that Say's Law is not operational in any country
because people do not spend their entire income; a part of it is saved for future
consumption.
(d) Focuses only on complementary industries: Nurkse states that if demand for the
output of one sector rises, due to the complementary nature of demand, the demand for
the output of other industries will also experience a rise. Thus, if large investments are
made in a large number of industries simultaneously, an underdeveloped economy can
become developed due to the phenomenon of complementary demand. However, the
theory ignores substitute goods which are in competition with each other.
(e) Wrong assumption about underdeveloped countries: Nurkse assumes that an
underdeveloped economy starts with nothing at hand. Hans Singer did not agree with it.
To him, an economy usually starts at a position which reflects the previous investment
decisions undertaken in the country.
(f) Balanced growth not a theory of growth: Hirschman believed that Nurkse's balanced
growth theory was not in fact a theory of growth. Growth implies the gradual
transformation of an economy from one stage to the next stage. However, the balanced
growth theory involves the creation of a brand new, self-sufficient modern industrial
economy being laid over a stagnant self-sufficient traditional economy. Thus, there is
no transformation.
6.6 Unbalanced Growth –Hirschman’s Strategy
The theory of unbalanced growth was advanced by Albert Hirschman-1958 as against
the doctrine of balanced growth. Hirschman carries Singer’s idea further and contends that
deliberate unbalancing of the economy, in accordance with a predesigned strategy, is the best
way to achieve economic growth.

114
He agrees with both Nurkse and Singer. He does not deny the need for a big push. On
the contrary, he argues that ability to invest is one of the serious bottle-necks in
underdeveloped countries. The ability to invest depends mainly on how much investment has
already been made.
An underdeveloped country need a big push to get off dead center at the same time
such a country cannot manage simultaneously a balanced investment package in industry and
in agricultural improvement. What to do?
Hirschman suggests undertaking big push in strategically selected industries or sectors
of the economy. [A Hirschman, the Strategy of Economic Development 1958].
He points outs the industrialized countries did not get where they are through
“balanced growth”. Everything has not grown at the same rate throughout the century.
Development has proceeded with growth being communicated from the leading sectors of the
economy to the followers, from one industry to another, from one firm to another.
According to him development can take only by unbalancing the economy.
The economy can be unbalanced by two methods –a) Investing in SOC; b) Investing
in direct production activities (DPA). The
farmer creates external economies while the
latter appropriates external economies.
Costs of new investment in SOC are
measured
on the horizontal axis, and costs of related
output of PDA on the vertical axis. At the
far right SOC is plentiful and costs of DPA
are low. As we move left, costs for my given
output of DPA rise, firstly slowly then more
rapidly. The 45o line expresses the idea of
balanced growth of DPA & SOC.
The real scarcity, in Hirschman’s view is not
the resources themselves, but the ability to
Soc availability & Cost Figure 6.1
a
b c
d
B1
45o
A
1
O
A
Tota
l C
ost
of
DP
A o
utp
ut
C1
D1
B
2
c
2
B
C
D
Balanced growth path

115
bring them into play. To illustrate this principle, he makes the simplifying assumption that
SOC and DPA cannot be expanded simultaneously, because of limited ability to utilize
resources.
Thus, the planning problems are to determine the sequence of expansion that will
maximize in induced decision making.
If we adopt the first course i.e. by expanding Soc, the economy will follow the heavy
line AA1 BB2C. The increase in Soc from A to A1, induces DPA to increase until balance is
respond at B, and so on. Hirschman calls this process “development via excess capacity of
(SOC).
If we take the other route we follow the dotted line AB, BC1C. When we increase
DPA to B1, balance requires increasing SOC to B, and so on. He calls this route
“development via shortages of SOC.
According to him that sequence of expansion should be adopted which maximizes
‘induced decision making’? He prefers that sequence which is vigorously self-propelling, to
him, development via excess SOC is more continuous and smooth than the second path with
is compulsive. The first path is permissive [divergent series – create more external
economies].
The balanced growth of SOC & DPA is not only unattainable in most underdeveloped
countries; it may not even be desirable. The rate of growth is likely to be faster with chronic
imbalance, preciously because of the ‘pressures’ it sets up.
Linkages: Some projects have both backward and forward linkages. The task is to find the
project with greatest total linkage. A backward linkage effect is produced when the cost is
reduced in the first industries. By the increased in demand, the primary production activities
mostly of enclave type leading to exports have little development effects on the economy,
Hirschman, therefore advocates the setting up of last stage industries first as they have high
backward linkage effects. According to Hirschman, Iron & steel industries and import
replacing industries have the highest linkage effects. In making products, a developing
country need not undertake all the stages of production simultaneously. It can begin with
manufacture of durable consumer goods at the final stage of production. It can import many
converting, assembling and mining plants for final touches to almost finished products. For

116
this way the country can turn out finished product that it was previously importing and then
move to the higher stages of production – to intermediate goods and machines through
backward linkage effects.
When the demand for import-replacing commodities increases and reaches a certain
threshold, it is advantageous to manufacture the product at home when threshold is reached,
Hirschman suggests subsidies and protection to import replacing industries.
LDCs do not give due important to part played by exports in economic development.
He therefore, suggests exports promotion which is the only practical way of achieving
industrialization via import substitution.
6.6.1 Criticism of unbalanced growth theory
The unbalanced growth theory propounded by Hirschman has realistically taken into
account most of the aspects of development planning The theory shows how a resource
search underdeveloped country can accelerate its economic development by prioritizing the
allocation of resources to the most strategic sectors or industries. However, the theory suggest
from certain limitation which are as follows.
1. No attention to optimum degree of imbalance – The theory states that there is a
need to unbalance the economy by investing the limited resources in the strategically
important sector. But it does not say anything about the optimum degree of
imbalance.
2. Neglects Resistance –The theory focuses only on the stimuli to expansion from
unbalanced investment. But it neglects the resistance caused by the unbalanced
growth.
3. Inflationary pressure– The theory calls for large investment in certain strategic
sectors. Such investments are likely to result in rise in money income which tend to
increase demand for consumer goods relative to their supply. They may lead to
inflationary pressure in the economy.

117
4. Factor immobility – The inducement mechanism described by the theory is possible
in countries where there is internal mobility of resources. But in underdeveloped
countries mobility of factors is limited. It is very difficult to move resources and
factors from one sector to another.
5. Ignores institutional factors – The theory lays emphasis only on investment
decisions. It ignores institutional factors like administration, management and policy
decision which also play important role in the development process.
Despite, the above limitation, the unbalanced growth strategy has been accepted as a
novel strategy for development.
6.7 Ranis –Fei Model
John Fei and Gustar Ranis developed of model for development of underdeveloped
countries in their article entitled, “A Theory of Economic Development”, which was
published in 1961. In their model, they try to analyse the process of development of an
underdeveloped country. The model shows how an underdeveloped economy can move from
a situation of stagnation to self-sustained growth through transfer of surplus labour from
agriculture to industrial sector. The model is similar to Lewis model. However, it takes into
both agriculture and industrial sectors. So it is an improvement over the Lewis model.
The model is based on the following assumptions;
1. The economy is a closed one.
2. The supply of land is fixed.
3. The economy consists of two sectors – agricultural and industrial sectors.
4. There exists surplus labour in the agriculture sector.
5. The output of agriculture sector is a function of land and labour.
6. The output of industrial sectors is a function labour and capital
Given their assumptions, Ranis and Fei discusses the process of development in three
phases. These phases are discussed and depicted in the figure as follows;

118
Phase I: In the first phase the labour with zero marginal productivity are transferred to the
industrial sector at constant industrial wage rate. In this phase, the transfer of labour from
agriculture to industrial does not lead to decline in agricultural output as the marginal
productivity of those labour are zero. This phase ends with the transfer of all zero value
labour. In the figure, the marginal productivity of LM Labour is zero. This amount of labour
gets transferred in the first. In this phase agriculture surplus remains constant as total
agricultural output remains the same. This is shown by S R Portion of the SZ curve in figure
B. The amount of labour i.e. LM transferred is indicates by OL1 in industrial sector in figure
A
(A)
L3
D1
L2 O
D3
Mar
gin
al p
rod
uct
ivit
y &
wag
es
D3
D2
L1
J U
SL
V
D2
D1
W
Phase III
Q R S
L M N K
Z
O
(B)
Agr
icu
ltu
ral s
urp
lus
L M N K O
B
D
E
Phase I
Phase II
X A F C
Ou
tpu
t
(C)
G
O

119
In the figure OX is the total product curve and LMQP is the marginal product curve of
labour. The figure B and C relates to the agricultural sector. The figure B shows how much
agricultural surplus per labour can be released by agricultural sector to industrial sector at
different points of time when labour is moving out from agricultural sector. The figure A
shows the expansion process of industrial sector.
Phase II: In the second phase, those agricultural labourers who marginal productivity is
positive but less than institutional wage are transferred to the industrial sector. In these stage
MN units of labour is transferred. This leads to fall in total agricultural output as their
marginal productivity was positive. As a result agricultural surplus will fall as shown by RZ
position of the SZ curve, this will change the terms of trade in favour of agriculture sector.
Hence, more industrial good are paid for the given amount of agricultural products. This will
cause an upward down on labour supply curve WSL for industrial sector from the point J
onwards n figure A.
Phase III – In the Phase III, the marginal productivity of labour in the agriculture sector
becomes more than the institutional wage. SO, in this phase, labour can be transferred to
industrial sector only at higher wage rate. It makes the beginning of commercialization of
agriculture as the wages in the agriculture sector are guided by the market forces.
Further, transfer of labour from agriculture sector to industrial sector cause a greater
loss in production. As a result average agricultural surplus declines at greater rate. So, in this
phase labour curve to industrial sector becomes still steeper as shown in figure A.
The transfer of labour and reinvestment of profit by the capitalist in industrial
expansion results in increase in income of workers in both the sector. However for balanced
growth there must be harmonious growth of both the sectors.
6.7.1 Criticisms
The model has very elaborately explained the process of development underdeveloped
countries. It has considered the process of development of both the sectors. However, the
model has certain limitations which are as follows.
120
1. The model assumes that labour from agricultural sector can be easily transferred to
industrial sector at the institutional wage. However, it is not easy to shift the labourers
as they may hesitate to move to industrial sector due to their long association with
family, farming and customs.
2. The model also assumes that the per capita consumption of the workers remains
unchanged even after the transfer of labour to industrial sector. This may not be
correct especially in phase-I when agricultural output does not fall. Even in other
phases, the workers who are still left in agricultural sector have more output. Hence,
per capita consumption of food may go up.
3. The model considers increase in agricultural labour productivity to be independent of
labour transfer. But labour transfer itself can result in better organization of
agriculture leading to a higher productivity of labour.
4. the model is based on a closed economy. However, in the present day even
underdeveloped countries are open and are involved in exporting and importing of
commodities.
5. The model assumes that there exists zero value labour in underdeveloped countries.
But Schultz and few other economists did not agree. They argued that zero value
labour does not exist in agriculture.
6. The model assumes that the level of institutional wages in the agriculture sector will
remain unchanged even after the rise in agricultural productivity. This is wrong
because with in productivity wage rate may also increase.
Despite the above limitations, the model chase very clearly illustrated the process of
development of both agriculture and industrial sectors of underdeveloped countries. The
model shows how an underdeveloped country can transform it economy into a self-sustained
growth through the transfer of labour from the traditional agriculture sector to industrial
sectors. It has incorporated the process of commercialization of agriculture as well as
expansion process of industrial sector.
6.8 Let us sum up
In this unit, we discussed the various theories of development of underdeveloped
countries. Most of the theories of development were developed during 1940s and 1950s as
during those times many newly independent underdeveloped countries were struggling to
promote economic development. The approaches to development have been grouped into two

121
broad groups-Balanced growth and unbalanced growth, while the balanced growth calls for
simultaneous investment in all the sectors or industries of the economy, the unbalanced
growth advocated for investment in certain strategically important sector of the economy to
promote economic development of underdeveloped countries.
6.9 Key Terms:
External Economies: It refers to the investment opportunities created in new
projects through reduction in costs.
Social and Economic Overheads: It denotes infrastructure facilities such as power,
transport, communications etc.
Deflationary gap: It refers to shortfall in aggregate demand from the level
required to maintain full employment in an economy.
Agricultural surplus: It is the quantity of output which can be released by the
agricultural sector for other sectors.
6.10 Long Questions
1. Distinguish between balance growth and unbalance growth.
2. Examine the Rodan’s theory of big push.
3. Explain the Nurkse’s model of balanced growth.
4. Illustrate the Hirschman’s strategy of unbalanced growth.
5. Discuss the Ranis-Fei model of development.
6.11 Further/Suggested Readings.
Higgins, B., Economic Development Norton and Co. publisher.
Thirlwall, A. P., Growth and Development, Palgrave Macmillan.
Soni, R.N., Agricultural Economics, Vishal Publishing Co.

122
UNIT –VII
HUMAN CAPITAL AND SOCIAL CAPITAL
Structure
7.0 Objectives
7.1 Human Capital
7.2 Process of Human Capital Formation
7.3 Human Capital and Unemployment:
7.4 Role of Market in an Economy:
7.4.1 Market Efficiency:
7.4.2 Sources of Market Failure:
7.5 Role of Government in Developing Economies
7.5.1 Government Failure and Washington Consensus
7.6 Role of Community in Economic Development
7.6.1 Trust as an Economic Variable and Prisoner’s Dilemma:
7.6.2 Role of Community in Providing Local Public Goods
7.6.3 Community in the Management of Forest Resources
7.6.4 Economics of Social Norms
7.6.5 Critical Evaluation of Social Capital Approach in Economic Development:
7.6 Key Words
7.7 Short Questions:
7.8 Long Questions:
7.9 Suggested Readings:
7.0 Objectives
The learners are expected to acquaint themselves with the various concepts and
approaches relating to human and social capital.
Process of human capital formation,
human capital and unemployment.
Community approach to development: State, market and community
Market and prisoner's dilemma- Community,
social capital and development
123
Critical evaluation of the social capital approach to development.
7.1 Human Capital
In economics, “capital” refers to all of the assets a business needs to produce the
goods and services it sells. In this sense, capital includes equipment, land, buildings, money,
and people i.e., human being. The productive resources of a society (country) may be
classified into human and nonhuman capital. Human capital indicates the productive capacity
of the individual or of the population. Human capital have some distinct features from other
types of capital. Human capital is unique and differs from any other capital. Human capital is
not only a means of production, but also the ultimate objective to be achieved by the society.
Human capital is the stock of habits, knowledge, social and personality attributes (including
creativity) embodied in the ability to perform labour so as to produce economic values.
According to Encyclopedia Britannica, “Human capital is the intangible collective resources
possessed by individuals and groups within a given population. These resources include all
the knowledge, talents, skills, abilities, experience, intelligence, training, judgment, and
wisdom possessed individually and collectively, the cumulative total of which represents a
form of wealth available to nations and organizations to accomplish their goals.”
In a deeper sense, however, human capital is more than simply the physical labor of the
people who work for an organization. It is the entire set of intangible qualities those people
bring to the organization that might help it succeed. A few of these include education, skill,
experience, creativity, personality, good health, and moral character.
In the long run, when employers and employees make a shared investment in the
development of human capital, not only do organizations, their employees, and clientele
benefit, but so does society at large. For employers, investment in human capital involves
commitments like worker training, apprenticeship programmes, educational bonuses and
benefits, family assistance, and funding college scholarships. For employees, obtaining an
education is the most obvious investment in human capital. Neither employers nor employees
have any assurances that their investments in human capital will pay off. For example, even
people with college degrees struggle to get jobs during an economic depression; and
employers might train employees, only to see them hired away by another company.
However, the level of investment in human capital is directly related to both economic and
societal health.

124
7.2 Process of Human Capital Formation
The term human capital formation implies the creation of abilities and skills among
the population of a country. It is the process of transforming the liability of the huge size of
population into assets. Accordingly, human capital formation indicates the process of
acquiring and increasing the number of persons who have the education, skills and experience
which are critical for the economic and overall development of the nation. Human capital
formation is thus associated with investment in human beings and his development as a
creative and productive resource.
In order to develop various sectors of the economy, a country should introduce
manpower planning for the development of its human resources. Manpower planning
indicates planning of human resources for meeting the development needs of the economy.
Different ways of human capital formation may be explained with the following points;
(i) Health and Nutrition:
As the poor health and undernourishment adversely affect the quality of manpower, the best
way to improve the quality of manpower in underdeveloped countries is to provide adequate
food and proper nourishment to people along with adequate health and sanitation facilities.
(ii) Education and Training:
The second composition of human capital formation is to provide education and training
facility to the people in general. Investments made in education can accelerate economic
growth. Proper utility of manpower depends on system of education, training and industrial
experience of the people. Investment in education is not only highly productive but also
yields increasing returns, with positive externalities.
iii) In on-the-job training, including aid type apprenticeships organised by firms.
(iv) Adult education and training is also another integral part of manpower planning.
(v) Migration of individuals and families to adjust to changing job opportunities.
(iv) Housing Development:
The final component of human capital formation is the development of housing facilities for
the people, which is an important determinant of human resource development. In
underdeveloped countries special incentives for private house construction should be
provided in order to provide healthy living conditions to the people. Moreover, steps must be
taken to introduce subsidised housing schemes.

125
7.3 Human Capital and Unemployment:
Unemployment is one of the major problems in approximately all countries of the
world. Unemployment is defined as the number of persons searching work, but unable to find
the job. Those people are not regarded as unemployed, who are willingly out of workforce.
For developing countries striking increase in the level of unemployment is a major problem.
It does not mean that there is no unemployment in the developed countries. However, the
nature of unemployment in the developed countries is somewhat different from that in the
underdeveloped countries. A number of social evils are link with high growth of
unemployment, for example unemployment increases suicides, crimes, and poverty rates.
Human capital is the most important determinant of economic structure. It determines
the productivity of the workers, and ultimately the economic growth and development of the
different sectors. Human capital indicates the abilities and skills of the masses. It has very
positive effect on economic growth and development. Increase in the human capital will leads
to reduce in the mistakes and to improve plans and modalities of the peoples. Human capital
is the best instrument to reduce unemployment. Human capital formation leads to increase in
productivity of labour force. Increased labour productivity increases profitability. And
increased profitability leads to increase in production and employment. Thus, there is an
increase in demand for labour. Increased demand for labour have positive impact on wage
rate. This increased wage rate ultimately encourages those to be part of work force, who used
to be unemployed previously.
There are some determinants of human capital like education, health, Expected life,
and population. Education is a key factor to promote the efficiency and capabilities of the
masses. It is that factor which affects the whole sector of the economy. Empirical study
reveals that education and health have positive significant impact on employment and wages
of female workers. There is a strong link between the education level and unemployment rate.
When people invest in their educations, it reduces their unemployment opportunity cost. Rate
of return to education and youth unemployment have positive relation. Educated workers are
more efficient than non-educated people in seeking new jobs and gaining more wages. There
is a lower risk of unemployment at higher educational levels. Educated workers can find new
jobs or adjust to the workforce market easily because of job training and market demands.
Declining standard of education in the educational organizations and literacy rate putting a

126
large amount in rising unemployment rate. Further, education gives an individual enough
confidence to start his own business. In other words, educated people are ready to undertake
their own business. Thus, a skilled individual not a job seeker, rather he is a job creator.
However, sometimes it so happens that the educated people are interested to
undertake white collar job only and reluctant to do physical labour. Moreover, education may
not add any skill in those individuals. In such cases, increase in the level of education may
cause in the volume of unemployment.
Health is also having significant impact on employment level. Healthy worker is more
efficient and more productive. Unemployment increases due to less efficient workers because
they are likely to produce less so they remain unemployed which effect the whole economy
negatively. Expected life of the people also have massive impact on unemployment. High life
expectancy indicates the health, physical fitness and experience of the people which is the
imperative factor of human capital. One with better health is able to work for a longer
duration. Moreover, healthy individual can work in any environment.
Population is major factor to impact unemployment rate. If the population in country
are educated and healthy, the level of unemployment would be lower. They would have
higher level of income and higher standard of living. Society with higher standard of living
always have lower birth rate and ultimately lower population growth. Lower population
growth rate ultimately leads to decline in unemployment rate.
7.4 Role of Market in an Economy:
Before discussing the role of market in an economy, let’s have an idea about the
definition of market. A market is an institutional mechanism that brings the buyers and sellers
of a product closer, where they bargain for the price of that product, the price of the product
is determined and the product is sold in the market. Thus, to be a market a specific place is
not necessary. The ultimate objective of the market is resource allocation.

127
7.4.1 Market Efficiency:
If the market is able to allocate the resources in the economy efficiently, it is known
as market efficiency. The concept of economic efficiency most often used in economics is
called Pareto efficiency (or optimality), which states that an economy is efficient if it is not
possible to make at least one person better off without making someone else worse off. If the
gain to the society from one small change is called the marginal social benefit and the cost of
the change is the marginal social cost, then a general efficiency rule for evaluating changes
can be stated as follows: If marginal social benefit equals marginal social cost, then the
economy is efficient because there is no net gain from any change. If marginal social benefit
is greater or less than marginal social cost, the economy is not efficient, and the proposed
change would improve economic efficiency. Suppose, for example, that it is possible to
produce more goods with the same resources by changing to a different production process.
With more goods, the welfare of some consumers could be improved at no cost to society.
That economy was not producing goods efficiently.
If the market is allowed to work without any interference, it is possible to achieve
efficient allocation of resources. Here queries arise, how do competitive markets achieve
efficiency? It can be explained with the help of the figure 7.1.

128
Figure 7.1
The long-run equilibrium of a competitive market is depicted in part A of Figure 7.1. The
market demand for the product approximates the marginal benefit to consumers consuming
this good, and the market supply corresponds to the marginal cost of producing the good. At
the market equilibrium, the marginal cost of producing one more unit equals the marginal
benefit—all the possible aggregate social gains from producing this good or service have
been achieved. The equilibrium price P is equal to both the marginal cost and the marginal
benefit. From the point of view of a typical firm in this competitive market, the equilibrium
price also equals the lowest possible production cost per unit—that is, the minimum of the
average cost function (please refer to part B of Figure 7.1). At that price, firms are earning
normal profits—that is, rates of return equal to those available elsewhere in the economy.
Because investors are doing exactly as well in this business as they could in any other, there
is no incentive for changes in output or prices. The results in a competitive market when
producers act to get the highest possible profits and consumers act to get the greatest possible
satisfaction are as follows:
(a) Marginal cost equals marginal benefit, with both equal to price.
(b) Price equals the lowest possible production cost and producers earn normal profits.
MC
AC
PH
H
X
Y
O Q
OUTPUT XP
YQ
OT
P
QAP
AP
SUPPLY or MARGINAL SOCIAL COST
DEMAND or MARGINAL SOCIAL BENEFIT
OUTPUT Productivit
y
PR
ICE
Low
D
ema
nd
PART A: MARKET PART B: FIRM

129
To achieve efficiency in the market many conditions are to be satisfied (the
assumptions of a perfectly competitive market). However, many times it is difficult to fulfill
such conditions, which leads to inefficient allocation of resources in the economy. This is
known as market failure.
7.4.2 Sources of Market Failure:
We have already discussed about market efficiency. If the market is efficient
there is no need of any other intervention in the market. But in certain cases either market
does not exist or market does not work efficiently. The causes for market failure are
discussed below:
(a) Public Goods: Public goods have two properties i.e. non-rival and non-excludable. Non-
rival means that one additional person can consume the good without reducing any other
consumer’s benefit; after the good or service is produced. In other words, consumption
of a public good by someone does not reduce its availability for the others. Non-
excludable means that it is not possible (at least at reasonable cost) to exclude consumers
who do not pay the price from consuming the good or service. For example, one
particular resident of a city cannot be excluded from enjoying clean environment, once it
is provided by the municipal authority. In other words, someone can enjoy the benefits
of public goods even without stating his preference for it. So, no one state his/ her
preference (demand) for it. As a result, it is impossible to derive the aggregate demand
function for such goods. In other words, there is no market for public goods.
(b) Externality: Externality exists when one economic agent’s (consumer or producer)
action (consumption or production) affects another agent’s welfare directly rather than
through market price or quantity. In other words, one person’s consumption (or one
firm’s production) imposes cost or benefits on another consumer or producer. Externality
may be positive (benefit) or negative (cost). In case of positive externality, marginal
social benefit of production (or consumption) is greater than that of marginal private
benefit. Now, if the supply of such products is to be done by the market, its supply
would be less than socially desirable level. As private supplier would supply that much
where marginal cost is equal to marginal private benefit (which is less than marginal
social benefits). So, government interference become necessary.
(c) Natural Monopoly: A natural monopoly is a firm that can produce the entire output of
the market at a cost that is lower than what it would be if there were several firms. In

130
case of natural monopoly, the particular enterprise has a downward sloping marginal cost
curve. And average cost curve lies above the marginal cost curve. Natural monopoly
arises when there are strong economies of scale. Generally, a natural monopolist has
huge amount of fixed investment at the initial stage. If a firm is a natural monopoly, it is
more efficient to let it serve the entire market rather than have several firms compete.
Thus, price mechanism cannot work in case of natural monopoly and government
intervention become necessary in such case. Price regulation is most often used for
natural monopolies. Electricity distribution companies, railway etc. are example of
natural monopolies, where government intervention become necessary.
7.5 Role of Government in Developing Economies
In modern times, State participation in economic activity can hardly be a matter of
disagreement. The free play of economic forces, has often meant large unemployment and
instability of the economic system, not only in the developing countries, but also in highly
developed capitalist countries. In the advanced countries, State intervention has been invoked
to ensure economic stability and full employment of resources. State action is all the more
inevitable in under-developed economies which are struggling hard to get rid of poverty and
to attain higher living standards. Accordingly, Governments has been playing a vital role in
the development of under-developed economies. The role of the governments in the
developing countries can be discussed in the following respects:
(a) Comprehensive Planning
In an under-developed economy, there is a circular constellation of forces tending to act and
react upon one another in such a way as to keep a poor country in a stationary state of under-
development equilibrium. The vicious circle of under-developed equilibrium can be broken
only by a comprehensive government planning of the process of economic development.
Planning Commissions have been set up and institutional framework built up.
(b) Economic Planning
The role of government in development is further highlighted by the fact that under-
developed countries suffer from a serious deficiency of all types of resources and skills, while
the need for them is so great. Under such circumstances, what is needed is a wise and
efficient allocation of limited resources. This can only be done by the government. It can be
done through central planning according to a scheme of priorities well suited to the country’s
conditions and need.

131
(c) Institution of Controls
A high rate of investment and growth of output cannot be attained, in an under-developed
country, simply as a result of the functioning of the market forces. The operation of these
forces is hindered by the existence of economic rigidities and structural disequilibria.
Economic development is not a spontaneous or automatic affair.
On the contrary, it is evident that there are automatic forces within the system tending to keep
it at low level. Thus, if an underdeveloped country does not wish to remain caught up in a
vicious circle, the Government must interfere with the market forces to break that circle. That
is why, various controls have been instituted, e.g., price control, exchange control, control of
capital issues, industrial licensing.
(d) Social and Economic Overheads
In the initial phase, the process of development, in an under-developed country, is held up
primarily by the lack of basic social and economic overheads such as schools, technical
institutions and research institutes, hospitals and railways, roads, ports, harbours and bridges,
etc. It requires very large investments. Such investments will lead to the creation of external
economies, which in their turn will provide incentives to the development of private
enterprise in the field of industry as well as of agriculture. The Governments, therefore, must
go all out in building up the infrastructure of the economy for initiating the process of
economic growth.
Private enterprise will not undertake investments in social overheads. The reason is
that the returns from them in the form of an increase in the supply of technical skills and
higher standards of education and health can be realised only over a long period. Besides,
these returns will accrue to the whole society rather than to those entrepreneurs who incur the
necessary large expenditure on the creation of such costly social over-heads. Therefore,
investment in them is not profitable from the standpoint of the private entrepreneurs, however
it may be productive from the broader interest of the society. This indicates the need for
direct participation of the government by way of investment in social overheads, so that the
rate of development is quickened.
Investments in economic overheads require huge outlays of capital which are usually
beyond the capacity of private enterprise. Besides, the returns from such investments are
quite uncertain and take very long to accrue. Private enterprise is generally interested in quick
returns and will be seldom prepared to wait so long. The State is in a far better position to
find the necessary resources through taxation borrowing and deficit-financing sources not
open to private enterprise. Hence, private enterprise lacks the capacity to undertake large-
132
scale and comprehensive development. Not only that, it also lacks the necessary approach to
development. Hence, it becomes the duty of the government to build up the necessary
infrastructure.
In order to cope with the growing requirements for finance, the government has to
establish special financial institutions for providing agricultural, industrial and export finance.
(e) Institutional and Organisational Reforms
It is felt that outmoded social institutions and defective organisation stand in the way of
economic progress. The Government, therefore, sets out to introduce institutional and
organisational reforms. Institutional and organizational reforms cover land reforms (abolition
of zamindaries and ceiling on holdings), tenancy reforms, introduction of co-operative
farming, nationalisation of insurance and banks etc.
7.5.1 Government Failure and Washington Consensus
Government intervention to resolve market failures may also fail to achieve a socially
efficient allocation of resources. Government failure is a situation where government
intervention in the economy to correct a market failure creates inefficiency and leads to a
misallocation of scarce resources.
(a) Sometimes government award subsidies to the producers (firms). But this may protect
inefficient firms from competition and create barriers to entry for new firms because
prices are kept ‘artificially’ low. Thus, subsidies, and other assistance, may lead to moral
hazard problem.
(b) Taxes on goods and services can raise prices artificially and distort the efficient
operation of the market. In addition, taxes on incomes can create a disincentive effect
and discourage individuals from working hard.
(c) Governments can also fix prices, such as minimum and maximum prices, but this can
create distortions which lead to shortage or surpluses.
Shortages, which may arise when government fixes price below the market rate. Because
public healthcare is providing free at the point of consumption there will be long waiting
lists for treatment.
Surpluses, which may arise when government fixes prices above the natural market rate, as
supply will exceed demand. For example, guaranteeing farmers a high price encourages
over-production and wasteful surpluses. Setting a ‘minimum wage’ is likely to create an

133
excess of supply of labour in markets where the ‘market clearing equilibrium’ is less than
the minimum.
(d) Information failure is also an issue for governments. Government does not necessarily
‘know’ enough to enable it to make effective decisions about the best way to allocate
scarce resources. Many economists believe in the efficient market hypothesis, which
assumes that the market will always contain more information than any individual or
government. The implication is that market prices and market movements should be free
from interference because markets cannot be improved upon by individuals or
governments.
(e) Excessive bureaucracy is also a potential government failure. This is caused by the
public sector when it tries to solve the principal-agent problem. Government must
appoint bureaucrats to ensure that its objectives are pursued by the managers of public
sector organizations.
(f) Finally, there is the problem of moral hazard associated with the payment of welfare
benefits. If individuals know that the state will provide unemployment benefit, or free
treatment for their poor health, they are less likely to take steps to improve their
employability, or to avoid activities which prevent poor health, such smoking, a poor
diet, or lack of exercise.
Towards the end of last century, many developing countries experienced
government failure in terms of corruption and nepotism. The public sector undertakings
experienced huge losses. The government failure encouraged the supporters of free market
economy for advocating strategies with greater role for free market economy. The economists
in headquarters of International Monetary Fund (IMF), the World Bank and the United States
Treasury Department reached some consensus regarding the role of government in the
developing and underdeveloped countries. As all these three agencies have their headquarters
in the Washington D.C., this consensus is known as Washington Consensus. According to
John Williamson, a former World Bank Manager Washington Consensus consists of ten basic
principles; which are not mutually exclusive. The basic points of Washington Consensus are:
(a) Fiscal Discipline: Fiscal discipline means the minimization of the gap between
government expenditure and government income. Accordingly, it advocated for
maximum limit on fiscal deficit and revenue deficit.

134
(b) Concentration of public expenditure on public goods including education, health and
infrastructure. Accordingly, it advocated for reducing government unproductive
expenditure.
(c) Tax reform: Majority of the developing countries have narrower tax base and highly
progressive tax rate. It encourages tax evasion which results in reduction in tax
revenue. So, it advocated for broadening the tax base with moderate tax rate.
(d) In most of the developing countries capital is made artificially cheaper through
government interference with the interest rate. The ultimate objective is to increase
the level of investment. However, it leads to misuse of capital. So, it advocated that
Interest rates to be market-determined and positive.
(e) Competitive Exchange Rates: During those days (at the time of Washington
Consensus) most of the developing countries had fixed exchange rate. It overvalued
the currencies of developing countries; which results in increase in the volume of
import and export reduction. It ultimately deteriorated in their terms of trade. So, it
advocated for flexible exchange rates as a measure to correct their terms of trade.
(f) Trade liberalization: It advocated for openness towards international trade. Trade
liberalization advocates ending up of tariffs, quotas etc. Trade liberalistion increases
competitiveness in the economy and also benefits the common people (though lower
price of products).
(g) Openness to Foreign Direct Investment: During those days most of the developing
countries followed policies towards restricted foreign direct investment (FDI).
However, FDI is crucial for employment generation and technological development in
those countries. So, Washington consensus advocated for openness towards FDI.
(h) Privatisation of State Enterprises: The state enterprises in the developing countries
experienced huge losses, which ultimately deteriorates fiscal discipline of those
countries. So, it advocated for privatization of those enterprises for better fiscal health
of those countries.
(i) Deregulation: It includes policies such as abolishment of regulations that impede
entry or restrict competition. However, in some areas government regulation is
necessary for safety, environmental and consumer protection grounds, and prudential
oversight of financial institutions.
(j) Legal Security for Property Rights: To have private investment legal security of
private property is necessary. If private property does not have legal security it
discourages investors to invest. So, it advocated for legal security of private property.

135
7.6 Role of Community in Economic Development
We have already discussed about the role of government and market mechanism in
economic development. However, there is certain areas where both the market and the
government cannot function efficiently. Hence the role of the community increases in such
countries. The community (social capital) plays a vital role in an economy, specially in the
underdeveloped and developing countries. For example, the buyer in a market may refuse to
pay the agreed price of a product. In such a situation the producer (seller) may take the help
of the judicial system of the country. But the judicial system in a under developed country
itself is not efficient to protect the rights of that producer; as the judicial system in such
country is either corrupted or a costly affair. In such a situation the social capital can play an
important role. Social capital includes three institutions. These are, Social Trust, Social
Norms and Social Network.
7.6.1 Trust as an Economic Variable and Prisoner’s Dilemma:
How social trust leads to a profitable business can be explained with the help of
Prisoner’s dilemma. It is a classic example of Nash Equilibrium, where equilibrium takes
place at a sub-optimal level. Let’s assume that two suspected persons A and B were caught
by the police and keep them in two cells separately. They are interrogated by a prosecutor
who alternatively threatens each suspects with a heavy penalty should he continue to deny the
charges while the other suspect confesses; and tempts each with a reduce penalty if he
confesses while other continue to deny. The payoff of the prisoners’ can explain with the help
of the following pay off matrix, given in Table 7.1.
Table 7.1: Payoff Matrix of the Prisoners
Prisoner B’s strategy
Prisoner A’s
Strategy
Confess Non- Confess
Confess (5, 5) (0, 10)
Non Confess (10, 0) (0, 0)
From the above pay off Table7.1 it can be read that if both A and B confess their
guilty both of them will be given five years imprisonment. Again if none of them confess
both of they would be freed. And if one of them is confessed, while the other does not; one

136
who confessed would be freed and the other will be given imprisonment of ten years. Thus,
both of them would be benefited if none of them confessed their crime. But as both of them
are kept in separate cells; the optimum pay off can be achieved provided they have trust on
each other. If they do not have trust on each other the game would finish with sub optimal
solution, where both of them would confess and ultimately both would be given
imprisonment of five years. Thus due to lack of trust they are not able to achieve the optimum
result.
The role of trust in the day to day life can be understood with some other examples.
For example, a customer goes to the jewelry shop to purchase some ornaments. The jeweler
tells the customer about the price of the ornaments. But, if the customer believes that the
jeweler may deceived him by selling low quality gold at higher prices and he wants to reduce
the price; the jeweler will incur losses and ultimately he is made to supply low quality gold.
Thus, the lack of trust among the customer and the seller leads to collapse of the gold market.
But if the jeweler is well known to the customer and they have belief on each other the
situation will be different.
Another example of the role of trust can be explained with the working of the Self
Help Groups. The Self Help Group- Bank linkage programme in India is the world's single
largest micro- finance programme. This programme is becoming immensely popular as an
alternative source of rural credit, after the failure of government subsidized credit
programmes to make the rural poor free from the grip of money lenders. The distinguishing
feature of this programme from the earlier programmes is that under this programme credit is
not provided to any individual, rather it is provided to a group of people (or to the individual
members of such group); on the condition that even if any one of them fails to repay loan,
none of the members will be able to get further loans. It is believed that all the clients will try
to form their group with good credit risk (those have good records of repayment). Ultimately
bad credit risks will be eliminated from the market. Thus the task of selection of clients is
shifted to the groups from the financial institutions and the collective group efforts are
recognized as the substitute of physical collateral. In this way the trusts among the members
of SHG acts as an alternative for physical collateral and also reduce the transaction cost of the
Formal Financial Institutions (FFIs).

137
7.6.2 Role of Community in Providing Local Public Goods
Community has comparative advantage over the market and the state in the
supply of local public goods. Because, the community relationship is effective in preventing
free- riders. When residents in one village have agreed to undertake collective work on
construction of a country road, a villager’s private benefit can be maximized, if he is a free
rider. In other words, he uses the road built by other villagers, while not contributing any to
the project is violation of the village community’s agreement. How close to a social optimum
level the supply of local public goods would increase depends, to a large extent, on how
strong the trust forged among the people in the community and, hence, how severe the social
sanction would be against a violator of the community’s agreement. As there is close
relationship among the community members and it is possible to monitor each and every
member of the society, it is easier to detect the free rider. However, it is very difficult to
detect the free rider, if the supplier of public goods is the government.
7.6.3 Community in the Management of Forest Resources
The social networks also have economic values. For example, most of the Tribes in
India were originally forest dwellers. But during the British rule in India most of the forest
products were nationalized and the existing forest dwellers were excluded from enjoying the
benefit they used to have. But in the latter period it was found that the protection of forest
resources by the state is both costlier and inefficient. So, in the latter period people lives
nearby the forest are also make a part of the forest protection force. This new system to
protect the forest is known as the Joint Forest Management (JFM). Under this system the
forest dwellers have the right to use some of the products of the forest such as fruits, small
branches of trees as fire wood, uses of grasses as grazing field for their cattle etc. Moreover,
they are also given some percentage of the final products of the trees. But they are not
allowed to cut the trees in the forest. This is nothing but some type of network between the
government agencies and the society of the forest dwellers. And finally this system proves to
be more efficient to protect forest resources.

138
7.6.4 Economics Social Norms
Social Norms are equally important in a society. Such norms are generally known as
unorganized institutions. Sometimes, these are also termed as the soft social infrastructure.
The important role of the social norms in the society can be understood with the help of some
example. For example, in some society the social norm is against fishing in the water bodies
during the reproduction period of the fish and if somebody does not obey this norm he is
punished with heavy penalty. Such norms are helpful in regenerating the fish population in
such area.
Again in some agricultural society it so happens that all the members of a village
work in the paddy fields of each and every family of that village. Moreover, the farm
production of each family is also distributed among all the families. Thus each and every
household of the society earns a portion of the product of other household. The benefit of
such system is that if there is crop failure of some particular households the cost of such crop
failure is shared by all the households of the society. This is some type of risk sharing as is
done by the modern insurance companies.
Similarly, in the rural Assamese society till few years back whenever there was excess
pressure of work in paddy field during pick season, the cultivator invites the other villagers to
help him. The villagers happily help him and on that particular day they are provided special
lunch by that particular farmers. Similarly, in some society on the occasion of some
ceremony (such as wedding) in a particular family, all the members of society help that
family both financially as well as though physical labour. The existence of such norms in the
society makes the social life comfortable; otherwise it becomes difficult.
7.6.5 Critical Evaluation of Social Capital Approach in Economic Development:
Thus the community participation (social capital) can play an important role in the
economic development of a society. But it is not necessary that all the social norms as well as
the social network would be equally important for economic development of a society.
Sometimes such rules or norms may be equally harmful for the economy. Moreover, it so
happens that the community norms are established over a longer period, but they become
more and more rigid over the period. For example, the relation or cooperation among the

139
members of a community may be against the outsiders. In such a situation the community
participation may be against innovation and competitive environment. It may restrict the
introduction of new technology and products.
Due to these probable reasons (problems) sometimes attempts is made to
substitute the role of community by the government activities. But it may not be successful in
all times. For example, the shifting of the responsibility of forest management to the
government in the age already proved to be inefficient. The ideal situation would be the joint
collaboration among the market, state and the community
7.6 Key Words
Goods : the characteristic of a commodity or a service that lends
positive satisfaction
Norms : a set of standard or attributes accepted as a bench mark
Market : any place of interaction and interchange of goods and
services
Deregulation : doing away with restrictive regulations
7.7 Short Questions
1. What is meant by human resource?
2. In what sense, human capital is different from other capital?
3. What is natural monopoly?
4. What is meant by externality?
5. What is social capital?
7.8 Long Questions
1. How does human capital affect the economic development of a country?
2. How does social trust help in economic development? Explain briefly using prisoner’s
dilemma.
3. Critically discuss the role of community co-operation in economic development?

140
4. Critically discuss the role of government in economic development of a country?
What are the main points of Washington consensus?
5. Explain, how market mechanism leads to efficient allocation of resources? What are
the sources of market failure?
6. What are the factors those affect human capital formation? Is there any relationship
between human capital formation and the level of unemployment?
7.9 Suggested Readings:
3. Hayami, Yujiro & Yoshihisa Godo (2009): Development Economics, New Delhi:
Oxford University Press.
4. Todaro, M. P. & S. C. Smith (2003): Economic Development, Pearson Education.

141
UNIT – VIII
ALLOCATION OF RESOURCES AND ECONOMIC DEVELOPMENT
Structure
8.0 Objectives
8.1 Need for Investment Criteria in Developing Countries
8.2 Rate of Turnover Criterion
8.3 Social Marginal Productivity Criterion
8.4 Marginal Per Capita Re-investment Criterion
8.5 Time Series Criterion
8.6 Little- Mirrlees Cost Benefit analysis of Projects
8.7 Key words
8.8 Short Questions
8.9 Long Questions
8.10 Suggested Readings
8.0 Objectives
The learners are expected to acquire the knowledge of criterion and principles on
which resource allocation are usually based for economic development.
Need for investment criteria in developing countries
Alternative investment criteria: Rate of turnover criterion,
social marginal productivity criterion,
marginal per capita reinvestment criterion and time series criterion
Cost-benefit analysis of projects: Little-Mirrlees.
8.1 Need for Investment Criteria in Developing Countries
Before discussing the need for investment criterion for the developing and
underdeveloped countries, here queries arise regarding the meaning of investment criterion.
Investment criterion means the criteria or the guidelines according to which the economic
planner of a country distributes the total amount of the community’s investible funds into
different sectors. In other words, the main problem is to distribute the investible funds in the
different sectors of the economy.

142
While deciding about the investment criterion for a developing country, additional
care is needed to be taken. Because, the problem of an underdeveloped country is not merely
one of assuring sufficient productive investment but also of directing that productive
investment in such channels as will provide for the most rapid growth of productive power of
national economy. The aggregate volume of investment to be undertaken becomes,
meaningful when expressed in terms of concrete investment projects. The programming
aspect of investment planning is an important problem of planning in underdeveloped
countries. The different objectives of investment criterion are given below:
(a) All-round development of the country.
(b) Balanced and rapid growth of the economy.
(c) To raise the gross national product and per capita income.
(d) Equal distribution of income and wealth.
(e) Proper allocation of existing resources.
(f) Efforts to correct the balance of payment.
(g) To keep watch the interest of the future generation.
The traditional micro-economics theory assumes perfectly competitive market in the
economy. And the working of the perfectly competitive market would lead to the efficient
allocation of investible resources by equalizing the marginal products of resources in
different activities. It would result in maximum utilization of the investible resources.
However, the actual situation is somewhat different in the developing countries.
In underdeveloped countries the availability of investible resources are limited compared to
their increasing needs. Therefore, the planners have to decide regarding the distribution of
resources between industry and agriculture, capital investment and consumer goods
industries, public sector and private sector. The flow of investment resources in these
different sectors is influenced by political, social and economic factors.
Moreover, the investment criterion should take into account the need of the present as
well as future generation. Inter-generational conflicts may arise while deciding an investment
criterion.
Allocation of investment resources becomes a difficult task due to the existence of a number
of development objectives. These objectives may be conflicting in the short run and hence
there are no simple criteria for fixing up the investment priorities.

143
Moreover, the allocation of investment will affect not only total output but also the supply
and distribution of the labour forces, social and cultural conditions, growth and quality of the
population, tastes and technological progress.
8.2 Rate of Turnover Criterion:
This criterion is also known as capital turn over criterion or capital intensity criterion.
This criterion was put forwarded by J. J. Polak and N. S. Buchanan. Capital turnover is the
increase in output resulting from one-unit investment in a project. In other words, it is the
ratio of increased national output to investment made in a project.
Capital Turnover = Y/I
Where, Y is the change in national income (output) and I is the volume of investment.
Further, I is equal to change in the stock of capital i.e. K.
Thus, this criterion is just reciprocal of the incremental capital output ratio K/∆Y. So, this
criterion is also known as capital output ratio criteria.
In those countries where capital is scarce, funds should be invested in those projects
which have the lowest capital intensity. Most of the developing and underdeveloped countries
are capital scarce. Since capital is scarce in underdeveloped countries, those projects should
be chosen which yield maximum output per unit of capital invested. Quick yielding projects
with low capital intensity are also desirable because they make it possible for the scarce
capital resources to be released soon for investment in other projects. Such projects also
generate more employment which may be very desirable in the context of underdeveloped
countries.
The specific advantages of this criterion are as follows;
(a) By favouring capital light and quick yielding projects, it will increase the
production of consumer goods in the short run. This will be helpful in controlling
inflation in those countries.
(b) Projects with high turnover are less dependent on heavy machinery, which are
needed to be imported. So, those industries do not put pressure on the scarce
foreign exchange reserves of the less developed countries.
(c) This criterion advocates for the establishment of the industries with low capital
intensity and high labour intensity. It is helpful in ensuring equitable distribution
of income.

144
However, this criterion is not free from criticisms. The rate of turnover criterion has been
criticized on the following grounds:
(i) The difficulty arises in estimating capital-output ratio in poor countries and comparing it
with that of advanced countries due to lack of data. Hence, any criterion based on capital
output ratio is likely to create practical problems.
(ii) This criterion does not take into account the time element. It assumes constant
incremental capital output ratio over the life time of the project. However, a particular project
may be less capital intensive in the short run but may turn out to be more capital intensive in
the long run.
(iii) This criterion assumes marginal private benefit of an investment project is equal to that
of marginal social benefits. The positive (negative) externalities of a project are not taken into
consideration. It is possible that a project may be more capital intensive but it confers
important supplementary benefits on the economy (positive externality) which may outweigh
its high capital cost. Thus the projects with low capital output ratio have greater importance
for developing economy.
(iv) The employment argument in favour of less capital intensive projects may not hold good
every day. A more capital-intensive project can also contribute substantially in providing
more employment in the long-run.
(v) Labour intensive projects may increase the volume of employment but they tend to reduce
productivity. So, capital intensive projects are also equally important for underdeveloped
countries if the level of output is to be increased substantially.
(vi) The maximization of employment argument implied in this concept may hold good in
short run. A capital intensive project may absorb little labour to start with, but may maximize
the amount of labour per unit of investment in the long run.
8.3 Social Marginal Productivity Criterion:
One of the limitations of the capital turnover criterion is that it does not consider the
difference between private marginal benefits (costs) and social marginal benefits (costs). The
social marginal productivity criterion of investment considers both social and private benefits
as well as costs. This theory was put forward by A. E. Kahn and Hollis B. Chenery. Social
Marginal Productivity of investment may be defined as the return to the private investor plus
the net contribution of the investment to the national product. According to this criterion, the
projects must be ranked according to their marginal social value.
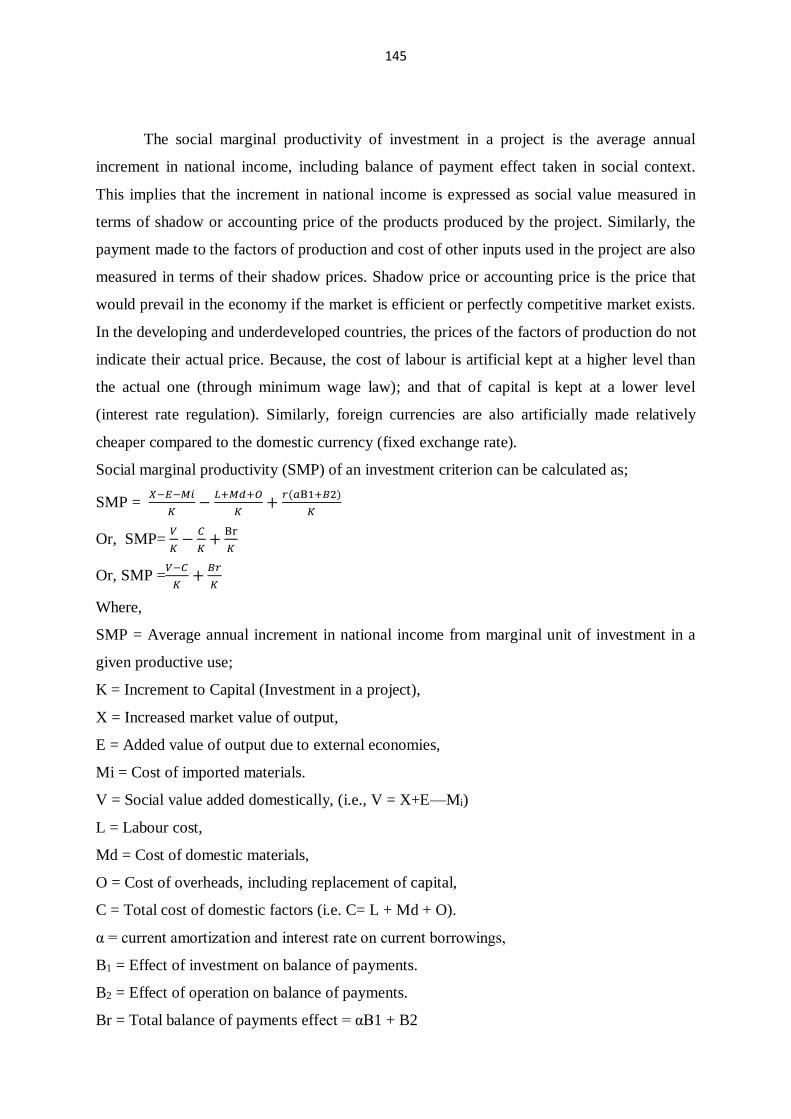
145
The social marginal productivity of investment in a project is the average annual
increment in national income, including balance of payment effect taken in social context.
This implies that the increment in national income is expressed as social value measured in
terms of shadow or accounting price of the products produced by the project. Similarly, the
payment made to the factors of production and cost of other inputs used in the project are also
measured in terms of their shadow prices. Shadow price or accounting price is the price that
would prevail in the economy if the market is efficient or perfectly competitive market exists.
In the developing and underdeveloped countries, the prices of the factors of production do not
indicate their actual price. Because, the cost of labour is artificial kept at a higher level than
the actual one (through minimum wage law); and that of capital is kept at a lower level
(interest rate regulation). Similarly, foreign currencies are also artificially made relatively
cheaper compared to the domestic currency (fixed exchange rate).
Social marginal productivity (SMP) of an investment criterion can be calculated as;
SMP = 𝑋−𝐸−𝑀𝑖
𝐾−
𝐿+𝑀𝑑+𝑂
𝐾+
𝑟(𝑎B1+𝐵2)
𝐾
Or, SMP= 𝑉
𝐾−
𝐶
𝐾+
Br
𝐾
Or, SMP =𝑉−𝐶
𝐾+
𝐵𝑟
𝐾
Where,
SMP = Average annual increment in national income from marginal unit of investment in a
given productive use;
K = Increment to Capital (Investment in a project),
X = Increased market value of output,
E = Added value of output due to external economies,
Mi = Cost of imported materials.
V = Social value added domestically, (i.e., V = X+E—Mi)
L = Labour cost,
Md = Cost of domestic materials,
O = Cost of overheads, including replacement of capital,
C = Total cost of domestic factors (i.e. C= L + Md + O).
α = current amortization and interest rate on current borrowings,
B1 = Effect of investment on balance of payments.
B2 = Effect of operation on balance of payments.
Br = Total balance of payments effect = αB1 + B2

146
r= Average overvaluation of national currency at existing rate of exchange or the premium
attached to foreign exchange earnings and savings.
All the variables given above, except B1 and K are annual flows.
In less developed countries foreign exchange is more valuable than domestic
currency. So, there is actually a large difference between the actual and official value of
foreign exchange. Chenery has expressed the ratio of the difference to the official value as r.
A zero r means equilibrium in the balance of payment as well as official and actual value of
foreign exchange. A positive r represents the undervaluation of foreign exchange and a deficit
in balance of payment. Similarly, negative r represents overvaluation of foreign exchange and
surplus in balance of payment.
Thus the social marginal productivity is divided into three elements; i.e.
(a) Value added in the domestic economy for unit of investment;
(b) Total operating costs per unit of investment; and
(c) Balance of payments premium per unit of investment.
Thus, a decrease in the rate of capital turnover may be offset by a proportionate increase in
the value margin and vice-versa.
The limitations of this investment criterion are given below:
(a) This criterion does not consider the multiplier impact of investment on income, savings
and consumption. It only considers the first round impact.
(b) The concept is vague. It is less definite than the private profit criterion although it is more
generally applicable.
(c) The market prices do not exactly reflect social values and as such, quantitative assessment
of the costs and benefits arising out of investment is extremely difficult.
(d) It is difficult to measure the costs of a larger number of items which contribute to the total
cost of a project;
(e) It is pointed out that the effect of an investment on balance of payments arises not only
from the cost incurred in connection with installation and operation of the plant but also on
the availability of foreign loans, their expected flow over time and conditions of repayment;
(f) This criterion does not consider structural interdependence and the nature and value of
external economies.
(g) SMP criterion helps in the maximization of output that can be attributed to the current
investment effort but it does not take into consideration as to what happens to the final
product during any period, which in turn, influences the investment rate in future.

147
8.4 Marginal Per Capita Re-investment Criterion:
Walter Galenson and Harvey Leibenstein introduced the concept of marginal per
capita reinvestment quotient criterion for investment in the underdeveloped countries. The
rate of investment per unit of capital invested is given by
r = p – ew
𝑐 ………………… (i)
Where,
r = rate of reinvestment per unit of capital
p=output per machine,
e=number of workers for machine,
w = real wage rate,
c = cost per machine.
Now, dividing both the denominator and the numerators of both sides by the volume of
employment, we have
r/e = p/e – ew/e
𝑐/𝑒
Per capita MRQ= pc – w
𝑎 ………… (ii)
Where, pc or p/e = Productivity per worker and 𝑎= capital intensity per worker.
Thus, per capita MRQ can be defined as the productivity per worker minus consumption per
worker to capital per worker. This investment criterion prefers capital intensive projects from
the point of view of accelerated rate of growth even where capital is scarce. In the less
developed countries population growth rate is higher. So, unless productivity of the workers
is increased through application of more capital, output per head would decrease; which
ultimately would lead to decline in capital formation.
This criterion is thus designed to take into account the influence of choice of projects on the
rate of capital accumulation. If we assume that all profits are reinvested while all wages are
consumed, this reinvestment quotient is nothing but the rate of profit. This reinvestment
quotient is likely to be higher in capital intensive than in labour intensive projects.
The main shortcomings of the marginal per capita reinvestment quotient criterion are given
below;
(a) This criterion would have adverse effect on income distribution and employment. In many
countries reduction of income disparities and unemployment are the main objectives of
planning, so this criterion cannot be adopted in these countries.

148
(b) It is against the principle of diminishing marginal productivity of capital. As the amount
of capital is increased in successive doses and offers a point where its productivity starts
declining and hence there is fall in output per capita.
(c) It does not consider the effect of balance of payments on investment. In the under
developed countries there is an acute scarcity of capital goods which have to be imported.
(d) It neglects the importance of consumption; rather it advocates its curtailment. But current
consumption may be more important than future consumption and the re-investible surplus
may have to be cut down in the interest of the community. The ignorance of consumer goods
sector in favour of capital goods sector brings serious consequences for such country.
(e) Adoption of highly capital intensive techniques may create certain practical difficulties in
underdeveloped countries. These countries are generally short of capital and due to this it is
not possible for them to concentrate on capital intensive project. Shortage of skilled
manpower and entrepreneurial ability may create another difficulty.
(f) Capital deepening of investment does not ensure the best utilization of the available
capital resources. It may result in such an inefficient allocation of capital resources that the
increase in income may be very small.
(g) Growth rate cannot be maximized by choosing the investment which has higher re-
investible profit per unit of capital. Prof. A.K. Sen points out that a mere choice of investment
with a higher reinvestment quotient cannot ensure a higher rate of economic growth.
8.5 Time Series Criterion:
This criterion was put forward by M. Dobb and Prof. A.K. Sen. This criterion states
that time factor is an important factor in the choice of techniques. According to this criterion
the people of any country cannot wait indefinitely to enjoy the benefits of present investment
effort in terms of income, consumption and employment. Therefore, a time horizon of
investment planning must be adopted. This time horizon depends on the value judgement of
the planner which takes into account the capacity of the community to wait to reap the reward
of their present investment. But once the time horizon is chosen, the choice of the investment
project will depend upon the comparison of total return to the society (measured in terms of
total output) from different projects, over a definite time horizon. And that project is selected
which gives highest cumulative return over the period of time chosen by the planner.

149
Table: 8.1
Period (in
Years)
Return from
Capital Intensive
Project (H) (in
Million)
Cumulative
Return from H
(in Million)
Return from
Labour Intensive
Project (L) (in
Million)
Cumulative
Return from L (in
Million)
1 2.0 2.0 4.5 4.5
2 3.0 5.0 5.0 9.5
3 4.0 9.0 6.0 15.5
4 5.5 14.5 7.0 22.5
5 11.0 25.5 10.0 32.5
6 12.0 37.5 11.0 43.5
7 15.5 53.0 12.0 55.5
8 17.0 70.0 14.5 70.0
9 18.0 88.0 15.0 85.0
10 20.0 108.0 16.0 101.0
The time series criterion of investment can be explained with the help of Table: 8.1.
Suppose that there are two projects H and L. Here, H is capital intensive project and L is
labour intensive project. The returns of the H project are less in comparison to project L over
the first four years, while in the remaining six years the returns of H are more than the project
L. The cumulative return from project H is lower than that of L up to 8th period. Thereafter,
cumulative return from project H is higher than that of project L. Between H and L, which
project will be selected by the planner, depends upon the capacity of the community to wait
to enjoy the benefit of the project. If the waiting time is less than 8 years, the labour intensive
project will be selected; as up to 8th period cumulative return from the labour intensive
project is higher than that from capital intensive project. If the community is ready to wait for
more than 8 years to reap the benefit of the project, then the capital intensive project will be
selected. If the time horizon is adjectly 8 years, the planner would be indifferent between
project H and L.
Nothing is free from criticisms. Accordingly, time series criterion of investment also
has some limitations and Sen himself has mentioned about such limitations.
(a) It has arbitrary fixed the time horizon. There is no specific law on the basis of which
period of recovery for a particular project can be fixed up.

150
(b) The return pattern of investment over time depends not only on technique, organization
and operation of the project, but also on external economies; and the growth and stagnation in
other sectors. It is not taken into consideration by this criterion.
(c) It is not possible to derive the time series for all times to come. Therefore, the planning
period has to be definitely fixed but this creates some serious problems. When the time limit
is about to end, labour intensive technique might be selected in order to inflate the quality of
output and thus capital formation is neglected.
(d) The factors like technological change, wage rate, propensity to consume etc. on which the
study of time series depends may all be changing and make the forecasting of future
investment.
8.6 Little- Mirrlees Cost Benefit analysis of Projects:
While taking business decisions the private firms being driven mainly by profit
motive take into account only the direct effects and do not take the longer and wider view of
their activities from the social point of view. But public enterprises and non-profit institutions
have to take a broader social repercussion of their resource allocation and investment
decisions. That is, they take into account both direct and indirect effects of their business
decisions.
An analytical model called social cost-benefit analysis is used to analyse the wider
impact of resource allocation and investment decisions. Thus in social cost-benefit analysis,
we estimate both the direct and indirect costs of a project to the society and both the direct
and indirect benefits to it. These indirect costs and indirect benefits are often called
externalities. Thus social cost and benefit analysis in addition to the direct costs and benefits
take into account the externalities (both positive and negative) of an investment project.
According to the social cost-benefit analysis, the actual revenue or receipts from a project do
not truly reflect the social benefits from a project nor the expenditure incurred on the inputs
valued at market prices used as the true social costs. Besides, in calculation of social costs
and benefits, the Government or planner takes into account the external effects (both external
economies and diseconomies) of the public investment projects whereas private enterprise
will ignore them in its evaluation of a project.
There are no simple rules or steps which government or any public authority should follow to
undertake social cost-benefit analysis. Through cost-benefit analysis we seek to find social

151
profitability of a project. The social profitability is judged by the difference between social
benefits (both direct and indirect) and social costs (both direct and indirect). The whole
process of calculating social profitability or social costs and benefits can be divided into the
following four steps:
(a) Specifying Social Objective Function
The first step in making cost-benefit analysis is to specify the social objective function that
has to be maximised. In the objective function the weights are to be assigned to different
benefits (e.g. increase in per capita consumption, increase, in employment, desired income
distribution). These weights will reflect the importance given to the various benefits of the
project.
(b) Identifying Various Benefits and Costs
The second step in cost-benefit analysis is to identify and enumerate all benefits and costs,
both direct and indirect, of investment projects. The direct benefits of a project can be
measured by the extra quantity of goods and services produced if the project is undertaken
compared to the conditions without it.
For example, the direct benefit of an irrigation project is the quantity of extra crop
produced net of extra costs in the form of more labour, seeds and equipment used as
compared to the non-irrigated land. Similarly, direct costs cover capital costs incurred on
capital equipment, machines installed, land acquired to undertake and implement the project
and the operating and maintenance costs incurred over the life span of the project.
In addition to the direct effects of an investment project, there are invariably indirect or
external effects. These indirect or external beneficial effects are classified into two types: real
or technological and the pecuniary effects.
The real external benefits may include reduction in costs to be incurred on other
Government programmes. For example, the construction of an irrigation dam may lead to
reduction in flooding and soil erosion which would reduce the Government outlay on flood
control and anti-soil erosion programmes. Such real indirect benefits are counted in cost-
benefit studies. On the other hand, indirect (external) pecuniary benefits are not generally
included in the enumeration of benefits and costs in a cost-benefit study. These external
pecuniary benefits accrue in the form of increased volume of business or increase in land
values as a consequence of undertaking a project.

152
(c) Evaluation of Social Benefits and Costs:
The third step in the social cost-benefit analysis is to measure social values of benefits, that
is, outputs (goods and services) produced by the project and social costs of inputs used in the
project. For evaluation of outputs of goods and services, their shadow prices (also called
accounting prices) are used instead of their market prices. Shadow prices are used to measure
social values of outputs since there is divergence of market prices from their true social
values. In fact, the greater the divergence between the shadow prices and market prices, the
greater the need for social cost-benefit analysis for deciding about public investment.
Similarly, in cost-benefit analysis costs are also measured using shadow prices of inputs or
factors used in the project. It is noteworthy that shadow prices of inputs or factors are their
opportunity costs or the values foregone by the factors and resources used for the initial
capital investment and production during the life period of the project. This is because
resources have to be withdrawn from other activities to the implementation of the proposed
project. For example, if for undertaking an irrigation project, 50 per cent of required labour is
withdrawn from the ranks of unemployed labour force. The social opportunity cost of such
labour is zero and ought to be calculated as such in cost-benefit analysis though the workers
employed will be paid market wages. The same holds in case of idle land used for a project.
With no alternative use, the opportunity cost of idle land is zero. This is so despite the fact
that Government has actually to pay compensation to the landowners for acquiring this idle
land. This compensation will affect only the distribution of benefits from the project for use
of land and not the social cost of the project.
Another important issue in the calculation of social benefits and costs is in what
common unit of account (also called numeraire) social benefits and social costs are measured
and expressed. It becomes more important when a country has trade relations with other
countries of the world and, therefore, needs to sell and buy abroad. This common unit is
required to make domestic and foreign goods comparable. In the Little-Mirrlees approach
benefits and costs of projects are measured at world prices so that they should depict the
opportunity costs of outputs and inputs. The use of world prices for measuring benefits and
costs helps in avoiding the use of shadow exchange rate. Further, in Little-Mirrlees approach,
instead of consumption, public saving in foreign exchange is used as numeraire.
That is, benefits and costs in this approach are evaluated in terms of foreign exchange
equivalent. However, this does not mean that project accounts are kept in foreign currency
but only that in the project appraisal report values are recorded in terms of foreign exchange
equivalent so as to estimate how much foreign exchange is earned by the project.

153
(d) Finding Social Discount Rate:
In the cost-benefit analysis the next step is to choose an appropriate social discount rate.
Since benefits from an investment project are reaped mostly in the future years and costs are
also incurred for a long period in future, it is discounted social benefits and discounted social
costs that are compared to decide about the social desirability of a project.
For this a social discount rate is required. The private enterprises in their calculation
of commercial profitability market rate of interest are used to discount the future benefits and
costs. However, for social profitability of the public sector investment, market rate of interest
is not appropriate for discounting future social benefits and costs. The private individuals
hope to live only a certain number of years and therefore discount the future at a higher rate
which is reflected in the market rate of interest. On the other hand, since the planners or the
government in developing countries would like to take a longer view and give greater
importance to the consumption and welfare of the future generations, they will use a lower
discount rate for discounting a stream of future social benefits and costs, both evaluated using
shadow prices.
Finally, it has to be decided whether an investment project should be accepted for
investment by the government or rejected. For this a decision criterion is required. The most
commonly used criterion is net present value (NPV) criterion. To use this criterion we have to
find the net present value of the proposed project by using the following formula-
NPV= (𝑉𝑡−𝐶𝑡
1+𝑟𝑡) – K0 , where t= 1,2,3,……n
Where,
Vt = the stream of social benefits measured by using shadow prices of goods produced, Ct =
the social cost of inputs measured by their shadow prices (i.e., opportunity costs), r t = the
social rate of discount and
Ko = the social cost of investment in the project.
Now, an investment project is economically profitable from the viewpoint of the
society if the net present value (NPV) of the project using social rate of discount is positive
(i.e., exceeds zero). In other words, the proposed investment project should be accepted for
investment if the present value (PV) of benefits of the project exceeds the social cost of
initial capital investment (K0) of the present. On the other hand, if present value of benefits is
less than the present value of costs, the proposed project or investment programme is
economically inefficient and should be rejected. Further, it is possible to rank the investment
projects based on net social benefit. Investment projects with higher NPV would be given
higher rank.

154
Besides being used to evaluate the economic justification of the entire investment
project, the cost-benefit analysis is used to determine whether the size of project under
implementation be increased and if so to what extent. Such decision is usually made by using
traditional marginal analysis is estimating additional benefits from the proposed increase in
size and additional costs to be made.
8.7 Key words
Intergenerational : from one generation to another
Criterion : principle or standard
Incremental : marginal increase/decrease
8.8 Short Questions
1. What is social discount rate?
2. What is the difference between social marginal cost and private marginal cost?
3. What is net present value?
4. Define capital turnover?
5. What are the short comings of social marginal productivity criterion of investment?
8.9 Long Questions
1. What is the necessity of a separate investment criterion for the developing countries?
Explain briefly.
2. Explain, Little- Mirrlees social cost benefit analysis criterion of investment.
3. Explain marginal per capita re-investment criterion of investment?
4. Critically discuss time series criterion of investment.
5. Explain briefly, social marginal productivity criterion of investment?
8.10 Suggested Readings
5. Thirlwall, A. P. (2011): Economics of Development, Ninth Edition, Palgrave
Macmillan.

155
UNIT – IX
DEVELOPMENT PLANNING
Structure
9.1 Introduction
9.2 Objectives
9.3 Economic Planning
9.3.1 Rationale for planning in developing economies
9.4 Input-output Analysis
9.4.1 Input-output Analysis (closed model)
9.4.2 Input-output Table (open model)
9.4.3 Hawkins–Simon Condition
9.4.4 Samuelson Substitution Theorem
9.5 Sectoral Projection in Planning: Plan models in India
9.5.1 Mahalanobis Model of Planning
9.5.2 Mahalanobis Four-Sector Model
9.6 The Fifth Plan Model
9.7 Plan in a Market Oriented Economy
9.8 Let us sum up
9.9 Key terms:
9.10 Long Questions
9.11 Further/Suggested Readings
9.1 Introduction
Development planning is considered important in developing countries. It is argued
that without planning underdevelopment countries are likely to suffer economic retardation
due to wastage of resources underdeveloped countries are poor in resources. So they cannot
afford to waste their limited resources in unproductive times of production. Therefore, such
countries need to divert their resources in the most productive lines of production and which
can give them maximum benefits or returns. Hence, they need to formulate proper planning
to allocate their scarce resources. This unit discusses the need or rationale for economic
planning and various techniques of planning. It also discusses the models of planning in
Indian and plan in a market oriented economy.

156
9.2 Objectives
The objective of this unit is to imform the students about the meaning and importance
of development planning. It also aims to introduce various planning techniques and models.
These are expected help the students to understand the formulation of planning and allocation
of resources in the most productive manner.
9.3 Economic Planning
Economic planning may be described as a deliberate Governmental attempt to
coordinate economic decision making over long run and to influence, direct, and some cases
even control the level and growth of a nation’s principle economic variables – income,
consumption, employment, investment, savings, exports, import etc., in order to achieve a
predetermined set of development objectives. An economic plan is simply a specific set of
quantitative economic targets to be reached in a given period of time.
9.3.1 Rationale for planning in developing economies
Proponents of economic planning having argued that uncontrolled market economy
can subject developing countries to economic stagnation, fluctuating prices, and low levels of
employment. In such economies, market mechanism does not lead to mobilizing of limited
resources in a way that will bring about the structural change necessary to stimulate a
sustained and balanced growth of the entire economy. Therefore, planning has come to be
accepted and an essential and pivotal means of guiding and accelerating economic growth in
almost are developing countries.
Arguments for planning
1. The market–failure argument: In LDCs, markets are permeated by imperfections of
structure and operation, commodity and factor markets are often badly organized and
the of existence of distorted prices often means that producers and consumers are
responding to economic signaled and incents that are a poor reflection of the real cost
to society of these goods and services, and resources. It is therefore, argued that
government has an important role to play in integrating markets and modifying prices.
Market failure also leads to gross disparities between social and private valuations of
alternative investment projects. In the absence of government, therefore, market may

157
lead to a misallocation of present and future resources. UNIDO (1970 publications)
argued that planning has become an essential and integral part of industrial
development programmes because market forces, cannot overcome structural
rigidities in the economies of developing countries.
2. The Resource Mobilization and allocation Argument: The third world countries
cannot afford to waste their limited resources –financial as well as skilled manpower,
on unproductive ventures. Investment projects must not be chosen on the basis of
partial productivity analysis dictated by individual industrial capital-output ratios but
in the content of overall development programme that takes account of external
economies, indirect repercussions’ and long term objectives. Skilled man power must
be utilized where its contribution will be most widely felt. Economic planning can
help to restraint influence of limited resources by recognizing the existence of
particular constraint and by choosing and coordinating investment projects so as to
productive outlets. It is argued that competitive markets will tend direct investment
into society low – priority areas.
3. The Attitudinal or Psychological argument: It is assumed that a detailed statement
of national economic and social objectives in the forms of a specific development
plan can have an important attitudinal or psychological impact on diverse and often
fragmented populations. It may succeed in rallying the people behind the government
in a national campaign to estimate poverty, ignorance and disease. Through planning
the government can invite support and cut across class, caste, racial, religious or tribe
functions with the plea to all citizens to work together toward building the nation. In
this way, the government can best provide the needed incentives to overcome the
inhibiting and often decisive forces of sectionalism and traditionalism in a common
quest for widespread material and social progress.
4. The Foreign Aid agreement: Developing countries face the problem of scarcity of
finance resources to increase their land of development. They have to depend on
foreign aid to supplement their resources to achieve a higher level of development. It
has been argued that the formation of detailed dev elopement plans with specific
sectoral output target and carefully designed investment projects are necessary
condition for the receipt of foreign aid. Some argued that the developing countries
construct development plans, mainly to secure more foreign aid. Thus, the planning is
essential in developing countries to persuade the donors that their money will be sued
158
as our essential ingredient in a well conceived and internally constituent plan in
action.
9.4 Input-output Analysis
Input-output analysis is a novel technique of planning invented by Wassily W.
Leontief in 1951. It is used to analyse inter-industry relationship in order to understand the
interdependencies and complexities of the economy and for maintaining equilibrium between
supply and demand.
The input-output analysis tells us that these are inter-dependencies in the economic
system as a whole. The inputs of one industry are the output of another industries and vice-
versa. For example coal is an input for steel industry and steel is an input for coal industry but
both are output of their respective industries.
The input-output table provides information to the planners about the amount output
which is needed to satisfy the final demand given the inter-industry transactions. Hence, the
input-output analysis can be used for economic planning.
Uses of input-output Analysis
The input-output analysis can be used for the following purposes.
1. In all countries which have adopted some kind of planning it is used for achieving
consistency in plans.
2. It is used for simulation purpose. Simulation refers to examining of what is
economically feasible.
3. It is also used to forecast import requirements.
4. It is used to forecast labour requirements consistent with a given growth target.
5. It can also be used to forecast investment requirements consistent with the given
growth target.
6. It is also used to find the strength of linkages between activities in an economy.

159
Assumptions of input-output Analysing
The input-output analysis is based on the following assumptions.
1. It assumes that there are no joint products. This implies that each industry produces
only one product.
2. The economy is divided into two sectors inter-industry sector and final demand
sector.
3. The technical progress is static and production functions are subject to constant
returns to scale.
4. It is based on the assumption of diminishing returns to a factor. That is as we employ
more of a factor in production output increased at a diminishing rate.
5. It is based on assumption of fixed coefficient of production. It analyses that there
exists a single process for the production of each commodity and there is not scope to
change factor proportion.
9.4.1 Input-output Analysis (closed model)
The closed model of input-output takes into account only the interdependencies
between domestic industries. It is applicable to a closed economy where there is no exports
and imports. The closed model of input-output can be explained with the help of following
input – output table (Table 9.1).
Table 9.1
Input-output Table
X01 X02 X03 ------ X04
Purchase by Intermediate Users industries Sales by X11 X12 X13 -------- -----X1n X1
X21 X22 X23------------- X2n
X31 X32 X33 ------------ X3n X2
‘ ‘ ‘ ‘ ‘ ‘ ‘ ‘ X3 ‘ ‘ ‘ ‘
X41 X42 X43------------- X4n X4
X01 X02 X03 ---------- X0n X0
Total Supply
Pro
cess
ing
ind
ust
ries
Payments to primary inputs
X1 --- X2--- X3 ------- Xn
1 2 3 4
Final Demand
Total Demand
F1 F2 F3 F4 ----- F
1 2 3 ‘ ‘ ‘ 4

160
The table shows the intra-industry transactions in which industries also use their own output
as inputs.
The input-output table highlights three important relationships. First, it shows that the
row total of each industry equals its column total which implies that the total output of the
industry is equal to the value of the total inputs used.
Secondly, it shows that the total output of an industry is equal to the sum total of its
output used as inputs in other industries plus its final demand.
For examples in case of industry 1, its total output is X1 which is equal to –
X11 + X12 + X13 + --- + X14 + F1 = X1
Or
∑ 𝑋1𝑗
𝑛
𝑗=0
+ 𝐹1 = 𝑋1 − − − (1)
Similar equations can be obtained from the input-output table for all other industries.
This equation is known as the balance equation of the input-output model.
Finally, the Column of the input-output table gives the input requirement of each
industry to produce the output. For example, industry 1 requires inputs (X11, X21, --- X24) and
primary inputs X01 to produce X1 level of output. It can be written in equation from as:
X11 + X21 + X31 + --- + X41 + X01 = X1
Or
∑ 𝑋𝑖1
𝑛
𝑖=1
+ 𝑋01 = 𝑋1 − − − (2)
Input coefficients
Input-coefficients show the extent of inter-industry dependencies. Input coefficients
can be obtained by dividing each column entry by Column total. Thus, we have,
𝑎𝑖𝑗 = 𝑋𝑖𝑗
𝑋𝑗⁄
Or xij= aij. Xj

161
Now, by substituting the values of Xij in equation (b) it can be re-written as
a11 X1 + a12 X2 + a13X3 + --- + a1nXXn + F1 =X1
the general equation for the industry would be –
∑ 𝑎𝑖𝑗𝑋𝑗
𝑛
𝑖=0
+ 𝐹𝑖 = 𝑋𝑖 − − − (3)
𝑂𝑟, 𝑋𝑖 − ∑ 𝑎𝑖𝑗𝑋𝑗
𝑛
𝑗
= 𝐹𝑖 − − − −(4)
Where Fi is the final demand, Xi is the total output or demand and
∑ 𝑎𝑖𝑗𝑋𝑗
𝑛
𝑗=1
is the sum of intermediate demand.
Now, for simplicity, let us consider a two –sector economy with just two industries. the
equation of the form (4) can be written as follows
X1 – a11X1 – a12X2 = F1
X2 – a21X1 - a22X2 = F2 (5)
For matrix from equation (5) can be written as :
[1 − 𝑎11 −𝑎12
−𝑎21 1 − 𝑎22] [
𝑋1
𝑋2] = [
𝐹1
𝐹2] − − − (6)
We can also write the system in equation (6) as follows ;
{[1 00 1
] − [𝑎11 𝑎12
𝑎21 𝑎22]} [
𝑋1
𝑋2] = [
𝐹1
𝐹2] − − − (7)
Where,
[1 00 1
] 𝑖𝑠 𝑎𝑛 𝑖𝑑𝑒𝑛𝑡𝑖𝑡𝑦 𝑚𝑎𝑡𝑟𝑖𝑥 (𝐼)
𝑎𝑛𝑑 [𝑎11 𝑎12
𝑎21 𝑎22] 𝑖𝑠 𝑡ℎ𝑒 𝑚𝑎𝑡𝑟𝑖𝑥 𝑜𝑓 𝑖𝑛𝑝𝑢𝑡 𝑐𝑜𝑒𝑓𝑓𝑖𝑐𝑖𝑒𝑛𝑡𝑠 (𝐴)
The equation (7) may be written in matrix notation as;

162
(I – A) X = F --- (8)
Where, (I – A) is known as the Leontief matrix
Thus, X = (I-A)-1.F --- (9)
The equation (9) shows that one has to find out (I-A)-1 (inverse of the Leontief
matrix) to solve for X and F.
9.4.2 Input-output Table (open model)
The open model of the input-output analysis is relevant for the open economics.
Nowadays, almost all the countries of the world are open to a greater or less extent. In the
open economies imports and exports play an important role in economic development. Both
producing and consuming sectors rely on imports to fulfill their requirements. The producing
sector imports inputs which are not available in the domestic country or are cheap in foreign
countries. So imports are treated as inputs in the input-output table. On the other hand, the
producing sector sells output not only in the domestic market but also exports some part of
output in the foreign markets. So, exports are treated as foreign final demand in the table.
The input-output model for an open economy can be explained with the help of the
following table 9.2.
Table 9.2

163
Purchases by Intermediate Users Industries Final Demand
Total
Demand
Sales by
1 2 3 --- N Domestic
Demand
D
Exports
E
Pro
cess
ing
Indust
ries
1 X11 X12 X13 --- X1 D1 E1 X1
2 X21 X22 X23 --- X2n D2 E2 X2
3 X31 X32 X33 --- X3n D3 E3 X3
‘ ‘ ‘ ‘ ‘ ‘ ‘ ‘ ‘
‘ ‘ ‘ ‘ ‘ ‘ ‘ ‘ ‘
‘ ‘ ‘ ‘ ‘ ‘ ‘ ‘ ‘
‘ ‘ ‘ ‘ ‘ ‘ ‘ ‘ ‘
n Xn1 Xn2 Xn3 ---- Xn4 Dn En Xn
Pay
men
ts
Wages W1 W2 W3 --- Wn --- --- W
Rent R1 R2 R3 --- Rn --- --- R
Interest I1 I2 I3 --- In --- --- I
Profits P1 P2 P3 --- Pn --- --- P
Imports M1 M2 M3 --- Mn --- --- M
Total Supply X1 X2 X3 --- Xn D E
The table shows the various transactions. In the processing sector X’s stand for the
value of output Xij denotes sales by industry i to industry j. The disposal of output to final
uses is represented by Di and Ei, where Di represents final demand for output of ith industry
from domestic consumers and Ei denotes exports by output of ith industry.
In the payment sectors, the subscript refers to the industry making payment factors of
production and the same for imports.
In the processing half of the table, each row shows how the output of each industry is
disposed of and each column shows the inputs requirements of each industry. The sum of
each row gives the total demand for the output of each industry.

164
In the payments half of the table, sum of each row gives the value of the various
factor payment, and sum of each column gives the total value added to the inputs bought by
the different industries.
The rows of the tables give the total output of each industry which is disposed off
between intermediate and final uses.
Thus, for industry 1, we have,
X1 = X11 + X12 + X13 --- + X1n + (D1 + E1)
𝑂𝑟, 𝑋1 = ∑ 𝑋1𝑗
𝑛
𝑗=1
+ (𝐷1 + 𝐸1) − − − − − −(1)
But the output of industry 1, must equal the value of inputs used plus the value added
to inputs by employing factors of productions to work on them plus imports. Thus, we have,
X1 = X11 + X21 + X31 +--- + Xn1 + W1 + R1
𝑂𝑟, X1 = ∑ 𝑋𝑖1
𝑛
𝑖=1
+ 𝑊1 + 𝑅1 + 𝐼1 + 𝑃1 + 𝑀1 − − − − − −(2)
Input Coefficients
Input-coefficients can be obtained by dividing each column entry by the sum for the
column. If aij stands for the input co-efficient, then,
𝑎𝑖𝑗 = 𝑋𝑖𝑗
𝑋𝑗⁄
or, Xij = aij.Xj ---- (3)
Now, substituting input coefficients in equation (1) we can rewrite it as;
𝑋1 = ∑ 𝑎1𝑗 . 𝑋𝑗 + (𝐷1 + 𝐸1)
𝑛
𝑗=1

165
𝑂𝑟, 𝑋𝑖 = ∑ 𝑎𝑖𝑗 . 𝑋𝑗 + (𝐷𝑖 + 𝐸𝑖)
𝑛
𝑗=1
Taking Yi = Di + Ei,
We have,
𝑋𝑖 = ∑ 𝑎𝑖𝑗 . 𝑋𝑗 + 𝑌𝑖
𝑛
𝑗=1
Now, specifying the final demands,
We have
𝑋1 − ∑ 𝑎𝑖𝑗 . 𝑋𝑗 = 𝑌𝑖
𝑛
𝑗=1
− − − − − −(4)
Where Yi is the total final demand and Xi is the total output.
Now, taking the case of an economy with just two industries and final demand sector,
the equation (4) become:
X1 –a11X1 – a12X2 = y1
X2 – a21X1 – a22X2 = Y2 --- (5)
In the matrix form:
[1 − 𝑎11 𝑎21
−𝑎21 1 − 𝑎22] [
𝑋1
𝑋2] = [
𝑌1
𝑌2] − − − (6)
The System in equation (6) may be written as :
{[1 00 1
] − [𝑎11 𝑎12
𝑎21 𝑎22]} [
𝑋1
𝑋2] = [
𝑌1
𝑌2] − − − (7)

166
In matrix notation, the input – output system in equation (7) may be written as :
[I – A ]X = Y ------ (8)
Here, (I – A) is called the Leontief matrix.
It follows that:
X = (I – A) -1 Y ---- (9)
This equation shows that to solve for X and Y we need to find the inverse of Leontief
matrix.
9.4.3 Hawkins–Simon Condition
D. Hawkins and H. A. Simon developed a mathematical condition which must be met
by any acceptable input-output system. According to them, the solution of input-output
equations of a given data yield negative numbers. If it yields negative numbers, it would
imply that negative output of some commodities required in order to achieve the final
consumption targets.
For example, a negative coal output would mean that more than one ton of coal is
used up in the process of production of every ton of coal output. If we have such an
unfortunate situation only a negative amount of coal will be left over for consumer’s use.
This would drain the nation’s wealth. According to Hawkins and Simon such a situation
should not occur. So, they developed a mathematical condition which is useful as a check on
input-output system.
To explain Hawkins – Simon conditions. Let us consider a very simple input-output
model with just two industries say steel and coal. In which, neither steel nor coal industry
uses up any of its own product. Thus, we have the input-output equations as;
𝑆 = 𝑎𝐶 + 𝑇𝑠 − − − −(1)
𝐶 = 𝑏𝑆 + 𝑇𝑐 −−−−−− (2)
Now, substituting equation (2) in (1)
We get
𝑆 = 𝑎 (𝑏𝑆 + 𝑇𝑐) + 𝑇𝑆
= 𝑎𝑏𝑆 + 𝑎𝑇𝑐 + 𝑇𝑠
𝑂𝑟, (𝑆 − 𝑎𝑏𝑆) = 𝑎𝑇𝑐 + 𝑇𝑠
= 𝑂𝑟, 𝑆(1 − 𝑎𝑏) = 𝑎𝑇𝑐 + 𝑇𝑠

167
For positive final demand, we should have,
𝑆(1 − 𝑎𝑏) > 0
Or, 1-ab>0
Or, ab<1
Or, a<1/b
This is the Hawkins –Simon conditions. If ab>1 or a>1/b, Howkins- Simon conditions
are violated.
9.4.4 Samuelson Substitution Theorem
A restrictive assumption of the input-output analysis is the premise that there are fixed
technological coefficients – That is factor substitution is not possible, so factor proportion
remains unchanged to produce each unit of output (say X man-Gross, Y units of raw material
of a given type and so on.)
There is no possibility of any other input proportion. The firm has no choice of using
or rejecting, e.g. labour-saving devices.
Prof. Samuelsson has proved that in some circumstances this restriction is not as
serious as it appears. He has shown that even where variation of input proportions is possible,
it will never be advantageous provided that
1) There are constant returns to scale,
2) There is only one scarce factor (Say Labour)
3) There are no joint products.
In other words, the input-output may be fixed as is assumed, but they will then be
fixed by considerations of productive efficiency rather than technological requirement.
For each commodity there will simply exists one most, efficient capital labour ratio
and no changes in the hand of output of that commodity will affect this ratio.
With fixed input prices and a linear homogeneous production function it will never
pay to change input proportions no matter what the level of output.

168
Suppose that there is only on scarce input, labour, and nothing else preventing the
indefinite expansion of rational output. This means that real cost to society of the
manufacture of any output or any other input must be calculated in terms of the amount of
labour required to produce it.
The real price of input A will be, say, two man-hours per unit that of input B will be
twelve man-hours. With constant returns to scale and unchanged input proportions there
labour prices will not change. It follows that any output should always be produced in a
manner which uses the same input proportions. The most efficient input proportions will in
fact be there which make the smallest drains on the economy’s scarce labour supply.
Unfortunately, if there is more than one resource in limited supply, this substitution theorem
no longer holds.
9.5 Sectoral Projection in Planning: Plan models in India
The models of planning and sectoral projection are discussed as under:
9.5.1 Mahalanobis Model of Planning
The important models of Planning Developed by P C Mahalanobis are; two sector
model and four sector model.
Mahalanobis two-sector model
Mahalanobis developed two – sector model of planning in 1953. This model of
planning is based on the following assumptions
1. The economy consists of two sectors-capital goods sector and consumer goods sector.
2. The economy is a closed one.
3. There is a full capacity production in both the sector.
4. Investment is determined by the supply of capital goods.
5. The prices are assumed to remain constant.
Given this assumption, the model is explained as follows.
The important parameters of the model are :
𝜕1 = 𝑝𝑟𝑜𝑝𝑜𝑟𝑡𝑖𝑜𝑛 𝑜𝑓 𝑖𝑛𝑣𝑒𝑠𝑡𝑚𝑒𝑛𝑡 𝑔𝑜𝑖𝑛𝑔 𝑡𝑜 𝑐𝑎𝑝𝑖𝑡𝑎𝑙 𝑔𝑜𝑜𝑑𝑠 𝑠𝑒𝑐𝑡𝑜𝑟
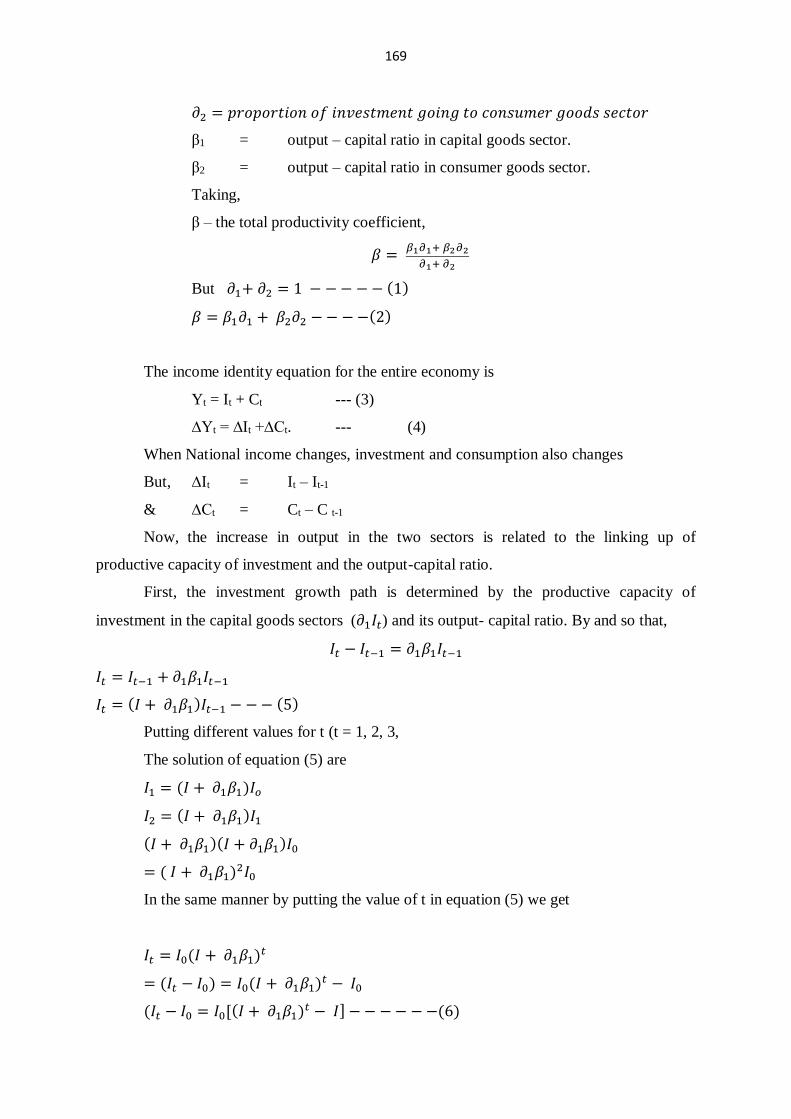
169
𝜕2 = 𝑝𝑟𝑜𝑝𝑜𝑟𝑡𝑖𝑜𝑛 𝑜𝑓 𝑖𝑛𝑣𝑒𝑠𝑡𝑚𝑒𝑛𝑡 𝑔𝑜𝑖𝑛𝑔 𝑡𝑜 𝑐𝑜𝑛𝑠𝑢𝑚𝑒𝑟 𝑔𝑜𝑜𝑑𝑠 𝑠𝑒𝑐𝑡𝑜𝑟
β1 = output – capital ratio in capital goods sector.
β2 = output – capital ratio in consumer goods sector.
Taking,
β – the total productivity coefficient,
𝛽 = 𝛽1𝜕1+ 𝛽2𝜕2
𝜕1+ 𝜕2
But 𝜕1+ 𝜕2 = 1 − − − − − (1)
𝛽 = 𝛽1𝜕1 + 𝛽2𝜕2 − − − −(2)
The income identity equation for the entire economy is
Yt = It + Ct --- (3)
∆Yt = ∆It +∆Ct. --- (4)
When National income changes, investment and consumption also changes
But, ∆It = It – It-1
& ∆Ct = Ct – C t-1
Now, the increase in output in the two sectors is related to the linking up of
productive capacity of investment and the output-capital ratio.
First, the investment growth path is determined by the productive capacity of
investment in the capital goods sectors (𝜕1𝐼𝑡) and its output- capital ratio. By and so that,
𝐼𝑡 − 𝐼𝑡−1 = 𝜕1𝛽1𝐼𝑡−1
𝐼𝑡 = 𝐼𝑡−1 + 𝜕1𝛽1𝐼𝑡−1
𝐼𝑡 = (𝐼 + 𝜕1𝛽1)𝐼𝑡−1 − − − (5)
Putting different values for t (t = 1, 2, 3,
The solution of equation (5) are
𝐼1 = (𝐼 + 𝜕1𝛽1)𝐼𝑜
𝐼2 = (𝐼 + 𝜕1𝛽1)𝐼1
(𝐼 + 𝜕1𝛽1)(𝐼 + 𝜕1𝛽1)𝐼0
= ( 𝐼 + 𝜕1𝛽1)2𝐼0
In the same manner by putting the value of t in equation (5) we get
𝐼𝑡 = 𝐼0(𝐼 + 𝜕1𝛽1)𝑡
= (𝐼𝑡 − 𝐼0) = 𝐼0(𝐼 + 𝜕1𝛽1)𝑡 − 𝐼0
(𝐼𝑡 − 𝐼0 = 𝐼0[(𝐼 + 𝜕1𝛽1)𝑡 − 𝐼] − − − − − −(6)

170
Similarly, by putting the value of t (t = 1,2,3, ) in the consumption growth path)
∆𝑐𝑡 = 𝐶𝑡 − 𝐶𝑡−1 = 𝜕2𝛽2𝐼𝑡−1
𝐶𝑡 − 𝐶0 = 𝜕2𝛽2𝐼𝑡−1
C2 – C1 = 𝜕2β2I1
Ct – C0 = 𝜕2𝛽2 (I0 + I1 + I2 + -- + It)
Now substituting the values of I1, I2 and …. It in equation (6) and its related
equation, the above equation may be solved as
Ct – C0 = 𝜕2𝛽2 [I0 + (1 +𝜕2𝛽2) I0 + (1 + 𝜕1𝛽1)2 I0 + --- + (1 + 𝜕1𝛽1)t I0]
= 𝜕2𝛽2I0[1 + (1 + 𝜕1𝛽1) + (1 + 𝜕1𝛽1)2 + --- + (1 + 𝜕1𝛽1)t]
= 𝜕2𝛽2I0[(1+ 𝜕1𝛽1)𝑡−1
(1+𝜕1𝛽1)−1 ]
Ct – C0 = 𝜕2𝛽2I0[(1+ 𝜕1𝛽1)𝑡−1
𝜕1𝛽1]---------------------------------------( 7)
Now, the growth path of income for the whole economy on the basis of equation (4) is
∆ Yt = ∆It + ∆Ct
or, Yt – Y0= (It –I0) + (Ct-C0)
By substituting the values of equation (6) and (7) in the above equation 1 we get
Yt – Y0 = (I0[(I+𝜕1𝛽1)t -1] + 𝜕2𝛽2I0[(1+𝜕1𝛽1)𝑡−1
𝜕1𝛽1]
= I0[(I+𝜕1𝛽1)t-1] [1 +𝜕2𝛽2
𝜕1𝛽1]
= I0 [(1+𝜕1𝛽1)t-1 [𝜕1𝛽1+𝜕2𝛽2
𝜕1𝛽1]
Supposing I0 =α0.Y0 and substituting it in the above equation, we have,
Α0= rate of investment in base year
Yt – Y0 = [(1 + 𝜕1𝛽1)𝑡] [𝜕1𝛽1𝜕2𝛽2
𝜕1𝛽1]
or, Yt = α0Y0[1 + 𝛼0.𝜕1𝛽1𝜕2𝛽2
𝜕1𝛽1. {(1 + 𝜕1𝛽1)𝑡 − 1}]
Where, Yt = Gross National income in year t.
In this model the total investment consists of two parts, 𝜕1𝑎𝑛𝑑 𝜕2. 𝜕1+𝜕2, =
1. The ratio = [𝜕1𝛽1+ 𝜕2𝛽2
𝜕1𝛽1] of the equation is the annual capital coefficient. Assuming
𝛽1𝑎𝑛𝑑 𝛽2 to be given the growth rate of income will depend upon 𝛼0 & 𝜕2. Further, assuming
𝛼0 to be constant, the growth rate of income depends upon the policy instrument 𝜕1.

171
The expression (1+𝜕1𝛽1)t of the equation shows that after a critical range of time. The
larger the investment in capital goods industries, the larger will be the income generated.
An important policy implication of the model is that for a higher rate of investment in
capital goods sector𝜕1. The marginal rate of saving must also be higher. A higher rate of
investment on capital goods in the short-run would make available a smaller volume of
output for consumption, but in the long-run it would lead to higher growth of consumer goods
sector.
9.5.2 Mahalanobis Four-Sector Model
Mahalanobis developed this model in 1955. This model became the basis of Indi’s second
five year plan
Economy consists of four sectors.
1. Sector- 1 : Investment goods sectors
2. Sector -2 : Consumer goods sector
3. Sector -3 : Household sector producing consumer goods
4. Sector-4 : Service producing sector (health, education, etc.)
𝜕𝑖 = proportion of investment going to ith sector
I = (1 to n)
∑ 𝑋𝑖
𝑛
𝑖=1
= 1 − − − (1)
𝛽𝑖= 𝑜𝑢𝑡𝑝𝑢𝑡 − 𝑐𝑎𝑝𝑖𝑡𝑎𝑙 𝑟𝑎𝑡𝑖𝑜 𝑜𝑓 𝑖𝑡ℎ 𝑠𝑒𝑐𝑡𝑜𝑟
∅𝑖 = 𝑐𝑎𝑖𝑡𝑎𝑙 − 𝑙𝑎𝑏𝑜𝑢𝑟 𝑟𝑎𝑡𝑖𝑜
Let,
A = Total amount of investment to be made during the plan period.
N = Total employment to be generated during the planning period.
E =Income to be generated during the plan period.
Here, A is the instrument variable and N and E are target variable and N and E are
target variable.
A = A1 + A2 + A3 + A4 -- -- (2)
N = N1 + N2 + N3 + N4 --- (3)
E = E1 + E2 + E3 + E4 ---- (4)
Then equation shows how much amount of investment is required to generate
employment in each sector and how much of employment is to be generated in each sector.

172
Let us take
Ni = employment to be generated in the ith sector.
𝑁𝑖 = 𝑇𝑜𝑡𝑎𝑙 𝑖𝑛𝑣𝑒𝑠𝑡𝑚𝑒𝑛𝑡 𝑖𝑛 𝑡ℎ𝑒 𝑖𝑡ℎ𝑠𝑒𝑐𝑡𝑜𝑟
𝐶𝑎𝑝𝑖𝑡𝑎𝑙−𝑙𝑎𝑏𝑜𝑢𝑟 𝑟𝑎𝑡𝑖𝑜
𝑜𝑟, 𝑁𝑖 = 𝜕𝑖.𝐴
∅𝑖 𝐺𝑖𝑣𝑒𝑛 ∅𝑖,ℎ𝑖𝑔𝑒ℎ𝑟 𝑖𝑠 𝑡ℎ𝑒 𝜕𝑖 ℎ𝑖𝑔𝑒ℎ𝑟 𝑤𝑖𝑙𝑙 𝑏𝑒 𝑒𝑚𝑝𝑙𝑜𝑦𝑚𝑒𝑛𝑡 𝑔𝑒𝑛𝑒𝑟𝑎𝑡𝑒𝑑 − − −
(5)
𝑜𝑟, 𝜕𝑖𝐴 = 𝑛𝑖∅𝑖 -----in ith sector--- (6)
A = Total investment ∅𝑖 𝑠ℎ𝑜𝑢𝑙𝑑 𝑏𝑒 𝑎𝑠 𝑠𝑚𝑎𝑙𝑙 𝑎𝑠 𝑝𝑜𝑠𝑠𝑖𝑏𝑙𝑒
𝐴 = ∑ 𝑛𝑖∅𝑖
𝑛
𝑖=1
− − − (7)
Total employment
𝑁 = ∑ 𝑛𝑖
𝑛
𝑖=1
− − − (8)
From these equations we can find out income generated in each sector
𝐸𝑖 = (𝑂𝑢𝑡𝑝𝑢𝑡 𝑖𝑛 𝑖𝑡ℎ𝑠𝑒𝑐𝑡𝑜𝑟
𝐶𝑎𝑝𝑖𝑡𝑎𝑙 𝑖𝑛 𝑖𝑡ℎ 𝑠𝑒𝑐𝑡𝑜𝑟) 𝑋 𝐶𝑎𝑝𝑖𝑡𝑎𝑙 𝑖𝑛 𝑖𝑡ℎ 𝑆𝑒𝑐𝑡𝑜𝑟
𝐸𝑖 = 𝛽𝑖 . 𝜕𝑖 . 𝐴
𝐸𝑖 = 𝛽𝑖 . 𝑛𝑖. ∅𝑖
∴ 𝐸 = ∑ 𝛽𝑖𝑛𝑖∅1
𝑛
𝑖=1
− − − − − (9)
Also, 𝐸 = 𝑦𝑜[(1 + ɤ)5 − 1]
We can find out income generated during the plan period given, ɤ and Yo. β’s∅′𝑠and
are structural parameters which are determined by technological conditions and assumed to

173
remain consent during the plan period. The 𝜕𝑠 are the allocation parameters which are
determined by the planners.
9.6 The Fifth Plan Model
The final Draft of fifth plan (1974-78) was prepared and launched by D.P. Dhar in the
backdrop of economic crisis arising out of run-away inflation fuelled by hike in oil prices and
failure of the government took over of the wholesale trade in wheat. When the fifth five year
plan was chalked out the world economy was in a troublesome state. This had a negative
impact on the India economy. Prices in the energy and food sector sky rocketed and as a
consequence inflation became inevitable. Therefore, the priority in the fifth five year plan
was given to the food and energy sectors. The Plan laid stress on employment generation,
'removal of poverty' and attainment of self-reliance in agricultural production'. In the later
stages the increase in the supply of food grains and the export of minerals and oil reserve
earned quite a good amount of foreign exchange to the Indian Economy.
The Minimum Needs Programme (MNP) was introduced in the first year of the Fifth
Five-Year Plan (1974-78).The objective or the programme is to provide certain basis
minimum needs and thereby improve the living standards of the people.
Promotion of high rate of growth, better distribution of income and significant growth
in the domestic rate of savings were seen as key instruments. Due to high inflation, cost
calculations for the Plan proved to be completely wrong and the original public sector outlay
had to be revised upwards. After promulgation of emergency in 1975, the emphasis shifted to
the implementation of Prime Ministers 20 Point Programme. The Fifth Five Year was
relegated to the background and when Janta Party came to power in 1978, the Plan was
terminated. The target growth rate was 4.4% and the actual growth rate was 4.8%.
Contents of the 5th Five Year Plan
The 5th Five Year Plan was laid out during a crisis period. Hence, the 5th Five Year
Plan was designed in a way to meet the needs of the time. The issues that were emphasis
were:

174
Reducing the discrepancy between the economic developments at the regional,
national, international level. It emphasized on putting the economic growth at par
with each other.
Improving the agricultural condition by implementing land reform measures.
Improving the scope of self-employment through a well-integrated program.
Reducing the rate of unemployment both in the urban and the rural sectors.
Encouraging growth of the small scale industries,
Enhancing the import substitution in the spheres including chemicals paper
mineral and equipment industries.
Applying policies pertaining to finance and credit in the industrial sector.
Stressed on the importance of a labour intensive production technology in India
The Model
The approach to the Fifth Plan considers the removal of poverty and attainment or
self-reliance as the two most important objective of the Plan. These objectives are to be
achieved through the a redistribution of consumption from the top 30 per cent to the bottom
30 per cent of the population and by a reduction in net foreign aid inflow by the terminal year
of the Plan.
The model has three parts: a macro-model for estimating investment an input-output
model for estimating sectoral output levels and imports and a consumption model for
deriving sectoral consumption levels under alternative assumptions.
The Plan considers 66 sector input-output model. The equation used in the Firth Plan
model is as below:
𝑿𝒊𝟏 = ∑ 𝝏𝒊𝒋𝟏𝑿𝒊
𝟏 + 𝑪𝒊𝟏 + 𝑮𝒊
𝟏+𝑰𝒊𝟏 + 𝑬𝒊
𝟏+𝑺𝑻𝒊𝟏 + 𝑴𝒊
𝟏 (𝒊 = 𝟏, 𝟐, 𝟑 … . 𝟔𝟔 𝒔𝒄𝒕𝒐𝒓𝒔)
𝒏
𝒊=𝟏
Where 𝑿𝒊𝟏 represents total output at factor cost of I sector in period t: C\j/ input
coefficient of I sector per unit of sector j. in period t; 𝑿𝑪𝒊𝟏is the private consumption of i
sector: 𝑮𝒊𝟏is the public consumption at factor cost; + 𝑰𝒊
𝟏 is the total investment goods
produced by sector I in period t: 𝑬𝒊𝟏is the export at factor cost of I sector; 𝑺𝑻𝒊
𝟏 is the change in
stock or sector I in period t: 𝑴𝒊𝟏 is the import of sector I in period t.

175
The model involves the use of input-output matrix and system of material balance. It
was a 66 sector input-output model with consumption sub-model.
In steps one of the model, the gross domestic product at factor cost far the terminal
year is estimated by assuming an average annual rate of growth of 5.5 per cent to the base
year figure. The gross domestic product at market price was obtained by adding the total
indirect taxes. Next the gross investment for the entire plan period was estimated by applying
(1 global capital-output ratio to the difference in the GDP at market price between file
terminal year and the base year. The yearly gross investment figures at market prices are
obtained by choosing an appropriate annual rate of increase to the base period investment
which will make them consistent with the aggregate amount of investment derived earlier.
Exports and public consumption are exogenously given. If the values of imports and private
consumption are known, the estimates of gross domestic savings and net foreign aid can be
obtained.
In step two, the annual gross investment is estimated by employing the equation of the
macro-model. Import and private consumption are derived by solving simultaneously a set of
equations obtained by combining some from the macro-model with some from till' input-
output sub-model. The solution of this system of simultaneous equations will provide the
value of imports and of aggregate private consumption.
In step three, the aggregate private consumption expenditure is utilized in the final
solutions of the model where estimates of sectoral consumption of outputs and imports are
obtained. The aggregate private consumption expenditure is divided into expenditure in the
rural and urban sectors. The total consumer expenditure of each of these sectors is further
allocated among 27 expenditure classes on the basis of the log-normal distribution fitted to
the consumer expenditure data obtained through the 22nd Round of the National Sample
Survey. The commodity composition of consumption for each of the expenditure classes is
obtained by applying base-year consumption proportions to the total expenditure or the
respective expenditure class in the terminal year. The total private consumption expenditure
on each commodity is then obtained by aggregating the expenditure of all classes on that
commodity.

176
The gross value of output of each commodity/sector can be obtained by solving the
equations of the input-output model in which the requirement or a commodity for final use
for investment and exports are all specified exogenously. The stock demand is specified by
another set of equations which can be combined with the input-output model for the
estimation or the gross value of outputs, The estimated gross values of output can in turn be
utilized to obtain the sectoral import requirements by solving the import equations,
The salient feature of the Fifth Plan Model is the redistribution or consumption and its
impact on removal of poverty and reduction in demand for imports. This novel feature was
ignored in similar earlier models. The implications of redistribution 01' consumption from the
richer sections to the poorer sections of the community for the growth or sectoral outputs and
of imports have been explicitly introduced in the model. The redistribution or consumption is
essential not only for 'removal of poverty' but also for attaining self-reliance. The approach
paper to the Fifth Plan observes that the reduced inequality in consumption expenditure leads
to reduction in total demand for imports as it reduces the demand from affluent sections. Self-
reliance also calls for the redistribution of consumption in favour of' the low income groups.
Even though the net effects of redistribution of consumption on import-, appear
negligible, it can be argued that when import requirements are disaggregated at the
commodity or sector level, the shift from items required for the production or luxury items to
items needed for expanding the production of mass consumption would be significant.
In the model investment is estimated through a Harrod-Domar type or equation. The
value of the incremental capital-output ratio is taken to be 3.14 for fixed investment
rises to 3.42 when inventories are also included. Since the average annual growth rate in GDP
is assumed to be 5.5 per cent for all variants, with and without import substitution,
incremental output between the base and terminal year will be the same. The value of gross
investment also happens to be the same in all the variants. The sectoral composition or
investment is also assumed to be invariants with respect to the composition of gross output or
magnitude of import substitution.

177
Conclusion
The Fifth Plan model is very interesting in the sense that for the first time it has demonstrated
the implications of redistribution of consumption for the solution to the problem of poverty
and to achieve self-reliance. The model has brought out the lack of any obvious relation
between redistribution and self-reliance. It shows that import saving is achieved in the
preferred variant only by altering a priori import coefficients. However, it is found that
consumption sub-model which is described as the most innovative part of the model is
probably the most confusing one. Further, it is estimated that a significant reduction in
imports is brought about by reducing the import proportion for investment requirements.
Since, sectoral investment me exogenously specified, the claim by the approach paper that
redistribution of consumption also leads to a decline in import requirements appears
unrealistic.
9.7 Plan in a Market Oriented Economy
A market oriented economy can be defined as an economy where the market plays the role of
"invisible hand" (Adam Smith-Wealth of Nations. 1776) in producing and distributing
resources efficiently in a system. It brings about the highest levels of productive efficiency.
The essential feature of the market economy is that what to produce, for whom to produce are
all decided by the market forces of demand and supply. There is also a private ownership
over the means of production and consumption decisions are taken according to the market
forces of demand and supply.
With the fall of the USSR (Union of Soviet Socialist Republics) in 1991, the great
belief in the efficacy of the Communist system of government and production and
distribution received a body blow. After that many countries began to adopt a market oriented
strategy to bring about higher productivity and growth supposedly championed by the United
States.
In market economy prices are free to fluctuate in a free market where the forces of
demand and supply determine the price level for a particular product. On the other hand, in
the planned or socialist economy (Soviet Union) prices are administered by the government.

178
If there were perfect competition, prices determined by the market forces would be
unique and the price offered by the consumers would equal the price willing to be charged by
producers calculated on the basis or their costs of production for the product. However, the
perfect competition situation is not round in a real world system. In reality it either that
condition of monopoly or oligopoly exists where the firms make supernormal profit the
global response to the free enterprise system has been tepid in many ways, While some
countries such as India and China and many Western countries have adopted a mixed
economic model where the public and private ownership go hand-in-hand, many countries
such as the USA, Singapore and Hong Kong have a relatively more open market system.
According to the "Index of Economic Freedom" created by the Heritage Foundation
and the Wall Street Journal , economic freedom can be categorized broadly into the factors
such as business freedom, trade freedom, investment freedom, monetary freedom, freedom of
Government, labour freedom and freedom from corruption and property rights. Countries
achieving the highest degrees of economic freedom have shown high per capita income, high
life expectancy; lower in fact mortality and high rates of literacy. These countries have also
shown relatively high shares of the Gross Domestic Product (GDP) being allocated to the
poorest 10% of the population. The market economy has mainly been found to be successful
in the developed countries with high levels of per capita GDP if judged by the index of
economic freedom, USA and most of the West European countries fit in this example.
The disconcerting factor of the free market or the laissez-faire economy has been its
link with Capitalism. This has mainly been brought about a dimension of social welfare and
to accommodate the persons thrown off the system with comparatively low purchasing
powers in market oriented economy, mixed economic models undertaken in China and India
have been particularly successful. In the mixed economy, while the government or the public
sector retains ownership over the strategic sectors of defence and artillery, maintenance of
law and order, building of infrastructure and telecommunications, private equity participation
is encouraged in some of the sectors. There have been high flows of Foreign Direct
investment in various sectors and many infrastructure projects have been funded by foreign
equity capital. For example, many special Economic Zones (SEZ’s) in both these countries
are being built with the help of FDI flows from abroad. As per the private equity
participation, private equity in the telecom sector has been permitted up to 74% and 100% in

179
case of India. The shift to a more market oriented economy since the 1990’s from a more
centrally planned economy before has led to both countries recording record growth rates of
about 8% - 9% over the past few years. Another model where both public and private
participation is encouraged thereby utilizing the benefits of high growth associated with free
market economies is the social market economy model adopted by Germany.
Market oriented economy model is the most efficient model of the economy where we
can have high growth rates of the economy coupled with high per capita incomes. With
increased FDI flows to the domestic economy, even countries part of the erstwhile Soviet
Union and formerly Communist and Socialist economies such as Vietnam have experienced
high standards of living in the recent years. Increased FDI flows generally leads to import of
sophisticated technology and technical know-how which can lead to higher productive levels
in the recipient economies.
However, unless structural challenges such as poverty and illiteracy are addressed in a
comprehensive manner in the developing countries such as India and China, the fruits of a
free market enterprise with high growth rates and per capita incomes shall only be restricted
to a privileged few in a situation of rising income inequalities. Hence, planning is needed to
overcome these challenges.
9.8 Let us sum up
Economic planning is important in developing countries as it helps them to allocate
resources in proper way. Underdeveloped countries do not have sufficient resources, so they
cannot effort to waste their limited resources in unproductive ventures. Such countries cannot
rely on market system for resource allocation as markets in these countries are characterised
by imperfection. The planning helps them to identify the priority sectors and areas and
allocate resources efficiently. Input-output technique is a technique of planning which
basically focuses on the interdependencies among the various industries and thus help in
achieving consistency and economic feasibility. Mahalanobis model shows how the planners
can promote economic development by changing the allocation of resources. The market
oriented economy also needs planning to overcome certain problems caused by the market.

180
9.9 Key terms:
Planning: It refers to the systematic allocation of resources to achieve a
set of targets within a given period of time.
Simulation: It is the study of economic feasibility of a particular activity.
Market failure: It refers to a situation when the market can not function
properly to allocate resources efficiently.
Stagnation: It is situation in which the level of income of an economy
remains constant.
9.10 Long Questions
1. What is economic planning? Discuss the rationale for economic planning developing
economies.
2. What is input output analysis? What are its uses and assumptions?
3. Explain the input-output model for a closed economy.
4. Explain the input-output model for an open economy.
5. Examine the Fifty Plan model of India.
6. What is market oriented economy? Why does it need planning?
7. Evaluate Mahalanobis model of planning.
9.11 Further/Suggested Readings
Thirwal, A.P, Gowth and Development, Macmillan, London
Todaro, M.P, Economic Development, Longman London.
Jhingan, M.L., The Economics of Development and planning.
Krishnan, J.N., the Fifth Five Year plan mode, EPW Aug, 1973.

181
UNIT X
TRADE AND POLITICAL ECONOMY OF DEVELOPMENT
Structure
10.1 Introduction
10.2 Objective
10.3 Import substitution and export led growth
10.3.1 Import substitution strategy
10.3.2 Export–led Growth Strategy
10.4 Krueger’s Model of Rent seeking society
10.5 Institution and Development: Contribution of Stephen Knock and Philip Keefer
10.6 Foreign Direct Investment, Institutional Investment Development
10.6.1 Foreign Direct Investment and Economic Development
10.6.2 Foreign aid and Economic Development
10.7 Let Us Sum Up
10.8 Key Terms:
10.9 Questions
10.10 Further/Suggested Reading
10.1 Introduction
These units deal with the trade strategies of development. It also discusses the model
of rent seeking society and impact of institution on economic development. In the last few
decades, there has been rapid growth of foreign investment in various countries. So, it also
discusses the role of foreign investment and foreign aid in economic development.
10.2 Objective
The objective of this unit is to impart the knowledge of trade strategies and
development. It also aims acquaint the students about the importance of foreign capital.
10.3 Import substitution and export led growth
There are two trade strategies of development. They are import substitution and export
promotion. These trade strategies of development are discussed as follows:

182
10.3.1 Import substitution strategy
The advocates of import substitution strategy of development believe that
underdeveloped country should initially substitute domestic production of imported simple
consumer goods and then substitute through domestic production for a wide range of more
sophisticated manufacture items. The idea is that infant industry should be protected by
imposing high tariff and quotes in imports. When
the country, achieves economies of scale and low
costs of production, it should start exporting those
goods.
Import substitution strategy entries, an
attempt to replace commodities that are being
import with domestic source of production and
supply. This can be done by restricting imports by
imposing high tariffs and quotas. Import –
substituting industries will achieve economies of scale after certain period. Infant industry
will grow and be able to compete in world markets. It will then generate met export earnings.
A principle mechanism of import substitution is erection of tariff walls or quotas,
behind which are industries are allowed to operate. The economic rationale is –infant industry
protection with enough time and protection, infant industry will eventually grow up and be
competitive with the developed countries producers and therefore no longer need protection.
The theory of import substitution can be explained as;
If there is no trade, equilibrium will take place at e, with Q, domestic demand and supply at
P1 price. If the economy opens, it face world price P2. At P2 price domestic demand is Q4 but
supply is Q1, so import is Q1Q4. Domestic consumers get benefit from lower price of imports
while domestic producer and employees will lose.
This import results in loss of domestic production and jobs as a result of free trade.
Now, let the country imposed tariff to protect infant industries. Let to be the rate of
tariff which causes the domestic price of importable goods to rise to P2 to Pt,
e d P2
Pt
P1 c
a
e
f
b
Q1 Q2 Q Q3 Q4
S
O
D
Figure 10.1

183
Pt = P2 (1+ to). Pt> P2
As a result demand falls to Q3. Domestic producer can now expand production up to
Q2 fromQ1. The area ‘cdef’ the tariff revenue clearly the higher the tariff, the closer will be
the sum of the world price plus important to the domestic price. However, the consumer’s
surplus decreases and producer’s surplus increases.
Thus, tariff redistributes income from consumers to produces. In the long-run,
advocates of IS protection for LDC infant industries argue that everyone will benefit as
domestic manufacturers achieve scale of production, lower cost etc. Production will take
place for both domestic and foreign market. It all grounds, very logical and persuasive theory.
However, the import substitution strategy does not allow the country to participate in
the world trade and expand market for its products. So, its popularity has declined with the
opening up of economies of the world.
10.3.2 Export–led Growth Strategy
The export promotion strategy is a very important strategy for development in LDCs.
The promotions of LDC exports, either primary, secondary, has been considered a major
development strategy. Some neoclassical has assigned to much important role to foreign trade
that they called foreign trade as engine of growth. The export promotion strategy can be very
beneficially used by the LDCs. This strategy can help them to overcome the problem of
limited size of market. The LDCs can specialize in the production of labour intensive primary
products in which they have comparative advantage. It gains from trade and there is increase
in National income and employment. Thus, higher level of output through trade tends to
promote economies development.
One of the obstacle to development in LDCs in small size of domestic which leads to
how inducement to invests. Export promotion measures and international trade widens
market for the products LDCs and increases inducement to invest and official allocation
sources.

184
According to vent for surplus theory international trade increases possibility of vent
for surplus in LDCs, into LDCs land and resources are underutilized. Trade can help to
produce surplus of primary products in exchange for manufactured products.
Before trade or country is producing and
consuming OX1 if primary product. AB is the PP
curve, with opening up of foreign trade E moves
to D. Production increases to OX2.
So, ED of x in exchanged for EC of M.
Many cost Asian economies like Korea, Taiwan,
Singapore, and Hong Kong succeed in
accelerating their economic development by
adopting employment promotion measures (1960s) EP.
The advocates of exports promotion measures cite the efficiency and growth benefits
of free trade, importance of substituting large world markets for narrow domestic markets,
etc.
The LDCs mainly rely on primary products which constitute 70% of their exports
earnings. They have great advantage in producing and exporting p products. The export
promotion strategy can help to widen the size of market and theory increased export earnings
to LDCs.
But there are various factors affecting demand and supply of primary products.
On the demand side there are factors which work against the rapid expansion of third
world primary product, export to developed countries.
They are –
1. The income elasticities of demand for primary products (food stuff) are relatively low
compared with the manufacturers, fuel, etc. less than 0.5.
2. Developed country population growth rates are now at near the replacement level so
that little expansion can be expected from this source.
D
P
O
Y2
Imp
ort
able
E
C
Exportable
D
X1 X2
X2 B
Figure 10.2

185
3. Development of synthetic substitutes and growth of agricultural protection in
developed countries. These are perhaps the most important factors working against
the LDCs exports of primary products. The synthetic share of world market export has
increased and share of natural product has fallen.
The common agricultural policy of EEC, is much more discriminatory against LDC
exports.
On the supply, side, factors include inelasticities of supply due to structural rigidities,
non-productive land tenure system, poor climate, socio-economic structures, low
productivity, uneconomic holding, population pressure etc.
We may conclude that successful promotion of primary product exports cannot occur
unless there is reorganization of rural society and economic structures to raise total
agricultural productivity and distribute the benefits more widely.
Expanding exports of manufactured goods
The expansion manufactured exports, has been given great stimulus by the spectacular
export performance of countries like South Korea, Taiwan, Hong Kong, Singapore etc. Their
success has given impetus to argument that LDCs economic growth is best served by
allowing free market forces and opening to trade.
The demand problem faced by the manufactured exports of LDCs is the same as those
faced by primary product.
Methods of export promotion
i. Reduce import duties or import quotas for exports – one of the main ways in which
exports are presented is by making the imported materials needed for manufacture of
exports relatively easy to obtain. Exports are often permitted to obtain needed imports
at lower rates.

186
ii. Preferential credit – lack of plentiful credit can impede expansion and innovation
Bank are often directed to provide credit on easier terms to those firms who export
products lower interest rates or a larger loan size.
iii. Export subsidies – To promote exports subsidies are given to exporters. Instrument of
export promotion – the export subsidy
The export subsidy:
Domestic Demand and supply curve for some product. Initially, international price of
the product is P*. Domestic Sale = OA
Supply = OB
Export = AB exported
Now, suppose that the government
wishes to promote export of his commodity
by an advalorem subsidy – i.e. payment of
5% of the export price for every unit of
goods that is exported. This shifts the
international price for the producer up to P*
(I+s/100) = P*
The production of the commodity
will be stimulated OD, but the domestic sales will come down – to OC, Exported = CD
Clearly CD> AB means export is promoted. This happens if there is no change in
exchange rate or international prices.
But increased export might lead to fall in international price of that goods as greater
supplies arrive and on the market prize may fall to P**. So that at the new equilibrium the
international price falls while the domestic price rises.
If the international price does not fall at all or fall by very little, the export subsidy
will lead to an increase in export revenue at the going exchange rate. The supply of dollar
curve shift to the right and exchange rate may be appreciated (domestic currency appreciate).
S’
O
P1*
P*
Pri
ce E
Quantity
C A B D
D’
D’
S’
Figure 10.3

187
In contrast, if international price falls significantly, as a result of export derive revenues may
even fall. This may lead to a depreciation of the exchange rate.
The effectiveness of the policy depend on the elasticity of demand for exports of
home country. If the elasticity is high, then prices will not fall much as the greater quantity of
exports gets absorbed in the other countries. But if elasticity is, low the reduction will fall
significantly and the policy of export subsidy will be ineffective.
Thus, export promotion can be an important strategy for economic development in
developing countries. However, it is found that these are numerous challenges for promoting
exports from the underdeveloped countries. Therefore, the underdeveloped countries need to
diversity their products and adopt new technology to produce different products in a cost
effective way. This will help them to expand exports and realize greater benefit from
international trade.
10.4 Krueger’s Model of Rent seeking society
Anne O. Krueger developed a model of rent seeking society in her article, the political
economy of the Rent seeking society in 1974.
Krueger argues that government restriction upon economic activities create rent which
give rise to rent seeking behavior and competition for rent. The most important way in which
governments create rents is by issuing licenses permit to engage in various forms of
economic activities. For example, import license to import and pursuit to make an investment
by building a factory. Such licenses have no alternative use so whole of the returns earned by
their holdings are rents.
Krueger has used the concept of economic rent in her model which is defined as the
excess of return on an asset over and above returns in its next alternative use. She developed
a simple model of competitive rent seeking for the important case when rents originate from
quantitative rest notions upon international trade.
Krueger has concentrated mainly on rents and the rent seeking behavior generated by
the issue of import licensed. When the government imposes restriction on imports by

188
imposing import quotes it creates rent by restricting economic activity. As a result import
license becomes a valuable commodity. This give rise to competition for obtaining imports
license because it yields rent. Krueger argued that the competition for rent seeking may take
various forms; Legal or illegal. According to her rent seeking activities are often competitive
and resources are devoted to competing for rents.
The cost of legal means for rent seeking include proper works, time spend by
entrepreneurs in obtaining their licenses, travel cost, locating firms in the capital. The illegal
means for rent seeking include bribery, hiring relatives of official or employing the official
themselves on retirement.
In the former case, competition occurs through choice of location, expenditure of
resources upon travel and so on. In the later cases, government official themselves receive
part of the rents.
Krueger showed that quantitative restrictions on import creates rent and generates
competition for rent seeking. In such a case;
a. Competitive rent seeking leads to the operation of the economy inside its
transformation came.
b. Welfare loss associated with quantitative restriction is unequivocally greater than the
less from the tariff equivalent of those quantitative restrictions, and
c. Competitive rent seeking results in a divergence between the private and social cost
of certain activities.
The model has particular applicability to developing countries.
The government restrictions give rise to rents of variety of forms and people
often compete for the rents. Sometimes such competition is perfectly legal. In other
instance rent – seeking takes other forms such as bribery, corruption, smuggling and
blank markets.
The welfare effect of an import quota and total rents obtained by holders of import
licenses are shown in the figure.

189
Q & S are domestic demand and
supply causes of internationally trade able
commodity. In the absence of international
trade domestic market clears at point a with
price O point as O suppose that the country
opens up its economy so that it can import the
commodity at Pw price. Since Pw < pa, in the
absence of any government intervention, the
domestic consumers purchase Dt units of the
commodity. The domestic supply at pw price
is only Sf, so mf (Sf-Df) units of demand is
satisfied by imports.
The free trade increases consumer surplus by the amount equal to the area, a c pw pa,
and decreases producer’s surplus by a b pw pa. So the national gain from international trade
is given by the sum of the changes in producer surplus and to consumer surplus.
This is equal to ---
acpwpa – abpwpa = abc
Now suppose that the government imposes tariff t per unit of imports. The domestic
price of the import able will rise to pt = (pw + t). As a result demand falls to Dt but domestic
supply rises to St, and volume of imports falls to mt (St-Dt). The Gains from trade declines
from abc trade.
Tariff revenue = t x Mt =gdeh.
The net loss in nation welfare from the tariff policy is given by the triangles bdg and
ceh which are sometimes known as deadweight loss.
Let us suppose that instead of imposing tariff, the government imposes a quota that
limits imports to Mt. (equivalent to tariff t). This creates excess domestic demand at pw price.
As a result price rises to (pw+t), at which demand for import equals supply mt. But holders of
Pw+t
Pw
mf
D
e
c h g
d
b
Q
P
O
Pa
a
S
mt
Sf St D Dt Df
Welfare loss from tariff n equivalent quotas
Figure 10.4

190
the import licenses earn rent equal to t per unit. They can purchase at Pw price and sell at
Pw+t price. The total amount of rent is exactly equal to tariff revenue i.e. segh.
The net loss in nation welfare is the same whether the government imposes a tariff t or
a quota Mt. these are sometimes called equivalent policies.
But Krueger argued that both are not the same. The quantitative restriction such as
import quotas creates rent and generates competition for rent seeking Rent seeking is always
competitive and resources are devoted to rent seeking. It resources are devoted to competing
for quota licenses then, welfare loss from the quota policy will exceed the welfare loss from
tariff policy. Krueger argued that resources are always wasted in rent seeking activities.
According to her competition for rent seeking may take the form of large scale corruption
which may be the most damaging to economic development.
10.5 Institution and Development: Contribution of Stephen Knock and Philip Keefer
In the recent years many development and growth economists view good governance
as a pre-requisite to sustained increases in living standard and economic growth. According
to them, difference between developmental success and failure has little to do with natural
resources availability climate, foreign aid or luck. It is largely a function of the type of
institutions.
The importance of good governance for growth gradually gained adherents over the
1980s and 1990s, following several decades in which development failures are attributed
successively to capital shortages, low education, and policy distributions, with little attention
denoted to the political and institutional sources of these problems. Reynolds in his study of
long term economic growth in 40 non-industrialized nations from 1850 to 1950, conjectured
that the single most important explanatory variable was political organization and the
administration of government.
However, it is very difficult to measure political and social institutions and quality of
Governance. Despite these measurement difficulties numerous studies have analysed the
impact of institutions and the quality of governance on economic performance.
191
Stephen Knack and Philip Keefer in their article, “Institution and Economic
performance: Cross Country Tests using Alternative institutional measures, 1995, have
analysed the impact of institution and quality of governance on economic performance. In
their studies they used data by two private international risk assessment firms of services, viz
(1) International Country Risk Guide (ICRG) and (2) Business Environment Risk Intelligence
(BERI).
The first observations that these services have for any country are for BERI the vast
majority of observations are from 1972 and for ICRG nearly all observations are from 1982.
From the ICRG they constructed an index from the five indicators which have
greatest relevance to the security of private property and the enforceability of contract. These
indicators are – (1) corruption in government (2) Repute of law (3) Expropriation risk (4)
Repudiation of contracts and (5) Quality of the Bureaucracy.
The corruption in government and quality of bureaucracy are taken as ponies for the
general efficiency with which Government services are provided. When a country scores
poorly low on these dimensions, it is a strong indication that a bureaucracy lacks procedural
clarity or technical competence and likely to introduce criteria other than efficiency into the
determination of government policies and the allocation of public goods.
In addition bureaucracies where corruption is higher and competence is low are less
likely to provide strong bulwark against infringements on property rights. These results in
distortions in investment and trade which may reduce the quantity and efficiency of capital
investment and foreign technology introduced in the country.
Expropriation Risk and the rule of low are used a ponies for the security of private
property and to contract rights. A country scoring low as these dimensions is likely to suffer
a reduction in the quantity and efficiency of physical and perhaps even human capital
investment. This disclosure rages investment.
Repudiation of contracts by government is another indicator of contract enforcement.
It is also an indicator of government credibility.
192
From BERI, they constructed similar index from the four variables or indicators. They
are – (1) contract enforceability, (2) Nationalization Risk, (3) Bureaucratic Delays and (4)
Infrastructural quality.
The variable infrastructural quality allows some approximation to be made to the
efficiency with which governments allocate public goods.
The five ICRG variables and four BERI variables have been aggregated to from an
ICRG index (ICRG82) and a BERI index (BERI72) of the security of contractual and
property rights. Higher values of ICRG and BERI indices indicate better, conditions for
investment.
The Growth Equation
Barro (1991) constructed growth regression to compare the effects of political
violence and institutional indicators on growth.
GR6085 = 𝛼 + 𝛽1 GDP60 + B2SEC60 + P3PRIM60 + 𝛽4GOVCONS + 𝛽5REVCOUP
+ 𝛽6ASSA80 + 𝛽2 PPI60 DEV + ∑ 𝑒𝑖 --- (1)
Here, growth is a function of initial GDP, Secondary ad primary school enrollment in
1960. The percent of government consumption in GDP, frequencies of revolutions and
assassinations and the magnitude of the deviation of the summers and Hesston investment
deflator (US = 100) from the sample mean.
Unlike Bano, they focus in the growth over the period 1974-1984 and use the first
available observation for each country for their institutional indicators, 1982 for ICRG and
1972 for BERI for most countries.
Adding the ICRG index to a Barro-type growth regression, Knock and Keefer find
that a standard-deviation increase in index increases the annual rate of growth in per capita
income by 1.2 percentage points on average. Substituting the BERI index for the ICRG index
produces a similar association with growth. These induces particularly BERI prove to have
strong explanatory power for private investment also.

193
BERI and ICRG indictors have been the most widely used governance indictors in the
cross country empirical literature because of their much better cross country coverage.
10.6 Foreign Direct Investment, Institutional Investment and Development
Foreign capital can enter in a country in the form of –
1. Private foreign capital -
(a) Foreign Direct Investment (FDI)
(b) Institutional investment or portfolio investment
2. Public foreign Capital -
(a) Bilateral hard loans or foreign aid (in dollars)
(b) Bilateral soft loans – items sold for payment in local currency.
(c) Multilateral loans- i.e. contribution to the Aid India club by the member
countries. Also include loans made available by the various agencies like World
Bank, IFC UND etc.
(d) Inter government grants in case or kind. All official grants and concessional loan-
low interest rates.
Foreign Direct Investment: It means the concerns of the investing country exercise defunct
control over the assets created in the capital importing country by means of that investment. It
may take the form of formation of a subsidiary (joint nature) of a company of the investing
country in the capital importing country. Such company or consumers are known as MNCS
or TNCs. Dunning (1993) stated that FDI involves the transfer of resources viz. technology
management, organizational and marketing skills etc. from a foreign country to the host
country.
According to IMF, FDI is that category of investment that reflects the objective of
obtaining a lasting interest by a resident entity in one economy in an enterprise resident in
another economy. The ‘lasting interest’ implies the existence of long-term relationship
between the direct investor and the enterprise and a big degree of influence by the investor in
the management of the enterprise.

194
ACC to European law, foreign invest is labeled as FDI when the investor buy’s more
than 10% voting power of the investee company and portfolio investment, when the acquired
stake is less than 10%.
Institutional/Portfolio Investment - It consist mainly of the holding of transferable
securities (issued or guaranteed by the government of the capital importing country), shares
or debentures of the companies of home country by the firm or nationals of foreign countries.
Four holdings also not amount to a right to control the company. The share holders are
entitled to the dividend only. Multilateral indirect investments have also evolved in recent
years – purchase of bonds of the World Bank floated for financing a particular project in
some LDCs.
10.6.1 Foreign Direct Investment and Economic Development
Foreign direct investment plays a very important role in economic development of
underdeveloped countries. The main problem of underdeveloped countries is the scarcity of
resources. But they need to invest large amount to build up infrastructure and promote
development. Therefore, they need foreign capital to fill the gap between saving and
investment, to obtain new technology, generate employment and so on. The role of FDI in
underdeveloped countries can be discussed under the merits of FDI which are as follows;
Merits of FDI
The FDI has numerous merits for underdeveloped countries;
1. It provides finance, managerial, administrative and technical personnel, new
technology and technique of production to underdeveloped countries which are in
short supply in these countries.
2. It also encourages local enterprises to invest more in ancillary industries or in
collaboration with foreign enterprises.
3. It brings capital and foreign exchange in underdeveloped countries and helps to fill up
savings gap and foreign exchange gaps and thus help to promote economic
development in such countries.
195
4. A part of the profits from FDI is given ploughed back into the expansion, modernize
or development of related industries.
5. FDI adds more value added to output in the recipient country than the return capital in
this sense, the social returns are greater than the punt returns on forest investment.
6. FDI also brings revenue to the Government of an LDC when it taxes of profits of
foreign firms or gets royalties.
7. It helps in raising productivity and the real wages of local labour.
8. FDI also places less burden on the BOP of an LDCs in the early stages of
development, if FDI flows mainly into agriculture and extract industries which
produce primary goods for exports, it further help in earning the BOP position of
LDCS.
9. Lastly, it flowing into a developing country also encourages its entrepreneurs to invest
in other LDCs. Firms in India have started investing in Nepal, Uganda, Ethiopia and
Kenya and other LDCs while they are still borrowing from abroad.
10. It increases income and employment opportunities to the people of capital importing
underdeveloped countries and thus helps to ease the problem of unemployment.
Demerits of FDI
1. The recipient country needs to provide basic facilities. Such facilities and concessions
involve cost in absorbing LDCs resources that could be utilized elsewhere by the
government.
2. To attract, FDI, LDCs have to provide sufficient facilities for transferring profits,
dividends, interest and principal. If these payment lend to net capital outflow, they
creates serious BOP problem.
3. No doubt, FDI increases income, employment and savings in LDCs, but it adversely
affects income distribution.
4. Many MNCs in LDCs, reserves all senior executive posts for their national and train
local nationals for lower and middle level ports having little independent decision
making.
5. It brings in highly capital intensive technologies which do not fit in the factor
propositions of LDCs. Often obsolete and discarded technologies are imported which
involve high social cost.

196
6. It also involves costs in the forms of a loss of domestic autonomy when foreign firms
interfere in policy-making decisions of the government of an LDC which favour the
foreign firms by rules.
10.6.2 Foreign aid and Economic Development
Foreign aid refers to public foreign capital received by underdeveloped countries
either in cash or kind from the foreign governments or from multilateral agencies like World
Bank. Underdeveloped countries suffer from the scarcity of resources. They need to invest
huge amount for promoting economic development. But the mobilization of resources from
the domestic source often falls short of the requirement. Hence, they need the help of the
foreign capital. The private foreign investment inflow in underdeveloped countries requires
existence of basic facilities which are short in supply. So, it is very difficult to attract private
foreign capital which only flow to those countries which have sufficient basic facilities for
investment and ensure high rate of returns.
Therefore, public foreign capital or foreign aid can play an important role in
promoting level of investment and economic development is underdeveloped countries.
Foreign aid is important because it can be used by the recipient country in accordance with its
development programmes.
The foreign aid flows to underdeveloped countries in various forms such as loans,
assistance and grants from governmental and international organizations. At the same time,
foreign aid may be tied or untied. In the case of tied aid, foreign aids are made available to
underdeveloped countries, for undertaking particular projects. It can also be country tied in
which the aid recipient country is required to import materials for the project from the donor
country. Untied aids are made available to the underdeveloped countries for general purpose.
In case of untied aid, the recipient country is free to decide about its use in various projects.
Foreign aid helps to promote economic development in underdeveloped countries in
the following ways;
1. The underdeveloped countries are poor in capital. So, they have low savings and are
unable to make required investment the foreign aid help to reduce this constraint by

197
providing the government with much needed financial resources and raises the rate of
capital formation.
2. Underdeveloped countries also suffer from technological backwardness. This is
reflected in high average cost of production and low labour productivity. It is also
reflected in high capital output ratio. The foreign capital brings technical know-how,
skilled personnel, managerial skills, advance production techniques. This helps
underdeveloped countries to improve its level of technology and promote economic
development.
3. Underdeveloped countries do not have sufficient economic overhead capital which
directly facilitates investment. These countries need to build up roads, rails, power
plants which require huge investment. The foreign and helps the underdeveloped
countries to build up their economic overhead capital.
4. Underdeveloped countries need to investment large amount to industrialize their
economy. However, they do not have sufficient resource. In this case, foreign aid help
the country to make requisite investment and promote industrialization of the
economy.
5. In underdeveloped countries private investors are not willing to invest in risky
projects, like exploitation of untapped natural resources. Foreign aid and capital
undertakes all risks and invest in such risky project to exploit resources which help to
promote economic development. It also helps in removing regional imbalances.
6. The foreign aid also provides social gains to underdeveloped countries because it
creates employment opportunities in urban areas which absorbs surplus labour from
the rural areas and reduces pressure on land.
7. The foreign aid also tends to raise labour productivity in underdeveloped countries
and thereby raises income and employment, which in turn increases real wages of
labour.
8. Foreign aid also helps in improving the provision of basic facilities such as health,
education, sanitation and help to build up human capital. The foreign aid contributes
significantly to the social sector budget in underdeveloped countries.
9. Underdeveloped countries often suffers from inflationary pressures due to existence
of structural rigidities which keeps the supply of food below the demand from the
growing population foreign aid helps to reduce inflationary pressure as it increases the
supply of food and other essential consumers goods.

198
10. Foreign and also help underdeveloped countries to overcome balance of payment
problems. Underdeveloped countries need to import capital goods to accelerate the
pace of development. But their exports consist of mainly primary products which
priced low in the international market. So a gap between import and exports
developed which causes balance of payment problems. The foreign capital or aid
helps underdeveloped countries to get capital goods and reduce the balance of
payment problems.
Thus, it can be concluded that foreign aid is very important for accelerating economic
development in underdeveloped countries. It helps them to fill up the saving and investment
gap and promote capital promotion. It contributes in industrialization and also helps in
building up social and economic overhead capital. It brings in new technology, raises labour
productivity and creates income and employment opportunities. It also undertakes risky
projects and helps to tap and exploits untapped natural resources like, hydropower. Further, it
reduces inflationary pressure and balance of payment difficulties in underdeveloped
countries. Thus, foreign aid is very important for economic development of underdeveloped
countries.
10.7 Let Us Sum Up
The underdeveloped countries have a number of challenges for economic
development. However, there are many strategies for promoting economic development.
They can promote development by adopting suitable trade strategies of development. During
the 1950s and 1960s, important substitution had been the dominant trade strategy among the
underdeveloped countries. But during 1970s and onwards, export promotion became popular
among these countries which calls exporting of their products to vast international market.
The underdeveloped countries also suffer from corruption and poor institutions. The impacts
of these problems have also been discussed in this unit. The investment needs of the
underdeveloped countries are large but they do not have sufficient capital to undertake such
investment. Therefore, they have to rely on foreign capital to promote economic
development.
199
10.8 Key Terms
Infant industry: It refers to the domestic industries which produces
import substitute goods.
Quantitative restrictions: It is the restrictions placed on the amount of a product
that can be imported into a country.
Economic rent: It is the earnings of a factor over and above its transfer
earnings.
10.9 Questions
1. Compare import substitutions and export led growth strategies of development.
2. Discuss the effect of rent seeking activity on economic development in the light of
Krueger’s model.
3. Examine the role of institutions in economic development.
4. What is foreign direct investment? How does it promote economic development in
developing countries? Explain.
5. Discuss the role of foreign aid in economic development of developing countries.
10.10 Further/Suggested Reading
Ray, D., Development Economics, Oxford University Press.
Mier, G., Leading Issues in Economic Development.
Todaro, M.P., Economic Development, Longman, London
Jhingan, M.L., The Economics of Development and planning, Vrinda Publication.


![SEMESTER IV - kunainital.ac.in. Economics Sylla… · SEMESTER IV KUMAUN UNIVERSITY, NAINITAL SYLLABUS (P.G. Class) [2017-18 and Onwards] ECONOMICS SEMESTER SYSTEM Code Course SEMESTER](https://img.pdfslide.us/doc/110x75/6070bc2b633d3b2a89031046/semester-iv-economics-sylla-semester-iv-kumaun-university-nainital-syllabus.jpg)