Embed Size (px)
Citation preview
OVERVIEWVALUE CHAININ FOCUSCONCLUSIONEND NOTES
DE BEERS GROUP THE D IAMOND INSIGHT REPORT 20184
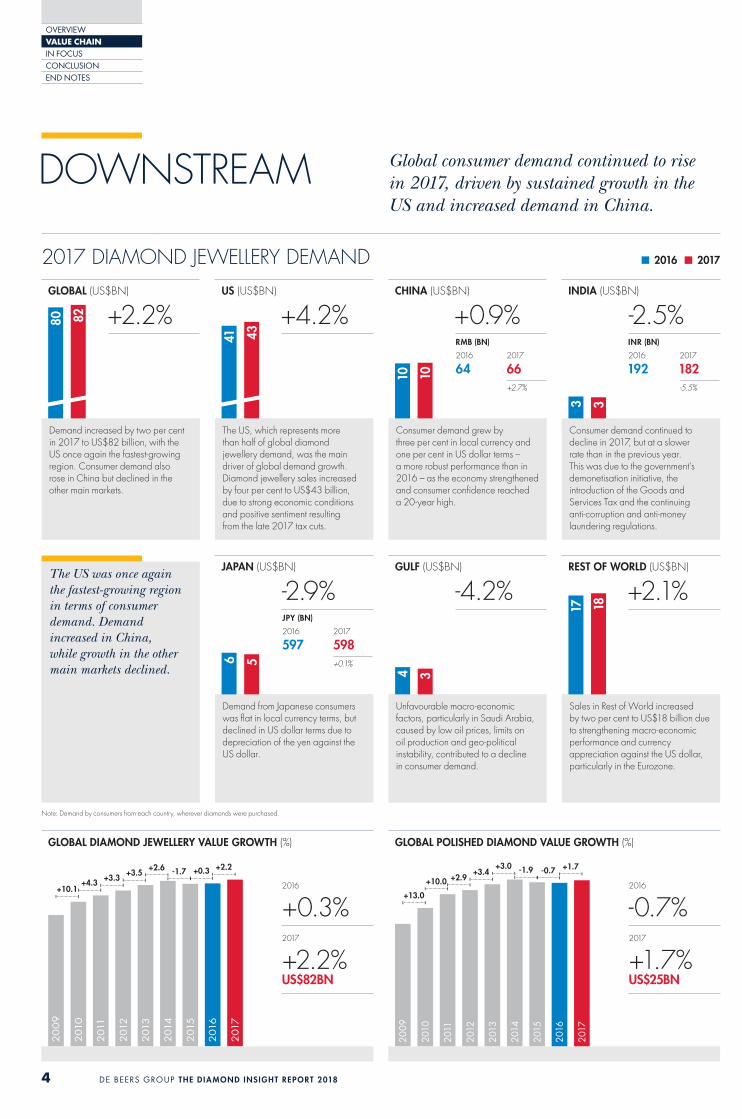
DOWNSTREAM
2017 DIAMOND JEWELLERY DEMAND
Global consumer demand continued to rise in 2017, driven by sustained growth in the US and increased demand in China.
2016 2017
Sales in Rest of World increased by two per cent to US$18 billion due to strengthening macro-economic performance and currency appreciation against the US dollar, particularly in the Eurozone.
Unfavourable macro-economic factors, particularly in Saudi Arabia, caused by low oil prices, limits on oil production and geo-political instability, contributed to a decline in consumer demand.
Demand from Japanese consumers was flat in local currency terms, but declined in US dollar terms due to depreciation of the yen against the US dollar.
Consumer demand continued to decline in 2017, but at a slower rate than in the previous year. This was due to the government’s demonetisation initiative, the introduction of the Goods and Services Tax and the continuing anti-corruption and anti-money laundering regulations.
Consumer demand grew by three per cent in local currency and one per cent in US dollar terms – a more robust performance than in 2016 – as the economy strengthened and consumer confidence reached a 20-year high.
The US, which represents more than half of global diamond jewellery demand, was the main driver of global demand growth. Diamond jewellery sales increased by four per cent to US$43 billion, due to strong economic conditions and positive sentiment resulting from the late 2017 tax cuts.
Demand increased by two per cent in 2017 to US$82 billion, with the US once again the fastest-growing region. Consumer demand also rose in China but declined in the other main markets.
The US was once again the fastest-growing region in terms of consumer demand. Demand increased in China, while growth in the other main markets declined.
+2.2%GLOBAL (US$BN)
8280 +4.2%US (US$BN)
4341
-2.9%JAPAN (US$BN)
56
JPY (BN)
2016
5972017
598+0.1%
-4.2%GULF (US$BN)
34
+2.1%REST OF WORLD (US$BN)
1817
+0.9%CHINA (US$BN)
1010
RMB (BN)
2016
642017
66+2.7%
-2.5%INDIA (US$BN)
33
INR (BN)
2016
1922017
182-5.5%
2016
-0.7%2017
+1.7%
GLOBAL POLISHED DIAMOND VALUE GROWTH (%)
US$25BN
2009
2010
2011
2012
2013
2014
2015
2016
2017
+13.0
+10.0 +2.9+3.4
+3.0 -1.9 -0.7 +1.7
2016
+0.3%2017
+2.2%
GLOBAL DIAMOND JEWELLERY VALUE GROWTH (%)
US$82BN
20
09
201
0
201
1
201
2
201
3
201
4
201
5
201
6
201
7
+10.1+4.3 +3.3
+3.5+2.6 -1.7 +0.3 +2.2
Note: Demand by consumers from each country, wherever diamonds were purchased.
OVERVIEWVALUE CHAININ FOCUSCONCLUSIONEND NOTES
DE BEERS GROUP THE D IAMOND INSIGHT REPORT 20185
2017 CONSUMER TRENDS IN US AND CHINA LOOKING AHEAD
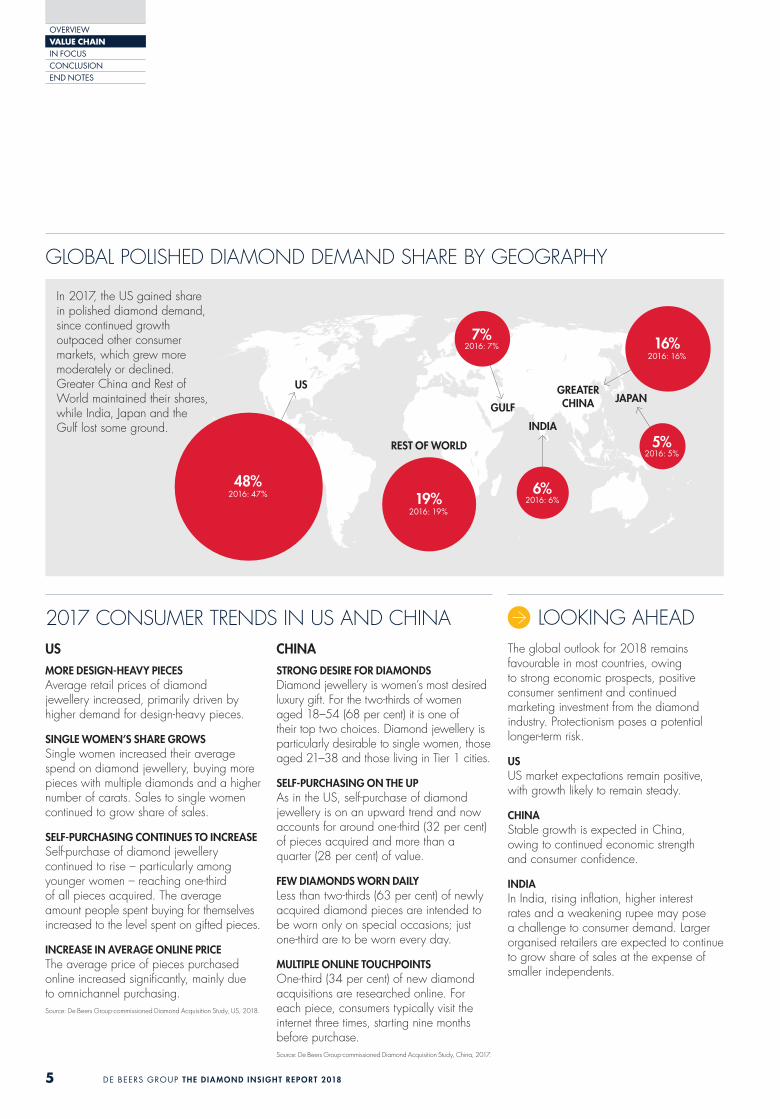
GLOBAL POLISHED DIAMOND DEMAND SHARE BY GEOGRAPHY
The global outlook for 2018 remains favourable in most countries, owing to strong economic prospects, positive consumer sentiment and continued marketing investment from the diamond industry. Protectionism poses a potential longer-term risk.
USUS market expectations remain positive, with growth likely to remain steady.
CHINAStable growth is expected in China, owing to continued economic strength and consumer confidence.
INDIAIn India, rising inflation, higher interest rates and a weakening rupee may pose a challenge to consumer demand. Larger organised retailers are expected to continue to grow share of sales at the expense of smaller independents.
USMORE DESIGN-HEAVY PIECES Average retail prices of diamond jewellery increased, primarily driven by higher demand for design-heavy pieces.
SINGLE WOMEN’S SHARE GROWS Single women increased their average spend on diamond jewellery, buying more pieces with multiple diamonds and a higher number of carats. Sales to single women continued to grow share of sales.
SELF-PURCHASING CONTINUES TO INCREASE Self-purchase of diamond jewellery continued to rise – particularly among younger women – reaching one-third of all pieces acquired. The average amount people spent buying for themselves increased to the level spent on gifted pieces.
INCREASE IN AVERAGE ONLINE PRICEThe average price of pieces purchased online increased significantly, mainly due to omnichannel purchasing.Source: De Beers Group-commissioned Diamond Acquisition Study, US, 2018.
CHINASTRONG DESIRE FOR DIAMONDS Diamond jewellery is women’s most desired luxury gift. For the two-thirds of women aged 18–54 (68 per cent) it is one of their top two choices. Diamond jewellery is particularly desirable to single women, those aged 21–38 and those living in Tier 1 cities.
SELF-PURCHASING ON THE UP As in the US, self-purchase of diamond jewellery is on an upward trend and now accounts for around one-third (32 per cent) of pieces acquired and more than a quarter (28 per cent) of value.
FEW DIAMONDS WORN DAILY Less than two-thirds (63 per cent) of newly acquired diamond pieces are intended to be worn only on special occasions; just one-third are to be worn every day.
MULTIPLE ONLINE TOUCHPOINTS One-third (34 per cent) of new diamond acquisitions are researched online. For each piece, consumers typically visit the internet three times, starting nine months before purchase.Source: De Beers Group-commissioned Diamond Acquisition Study, China, 2017.
INDIA
5%2016: 5%
JAPAN
16%2016: 16%
GREATER CHINA
6%2016: 6%
7%2016: 7%
GULF
US
19%2016: 19%
REST OF WORLD
In 2017, the US gained share in polished diamond demand, since continued growth outpaced other consumer markets, which grew more moderately or declined. Greater China and Rest of World maintained their shares, while India, Japan and the Gulf lost some ground.
48%2016: 47%
DE BEERS GROUP THE D IAMOND INSIGHT REPORT 2018 6
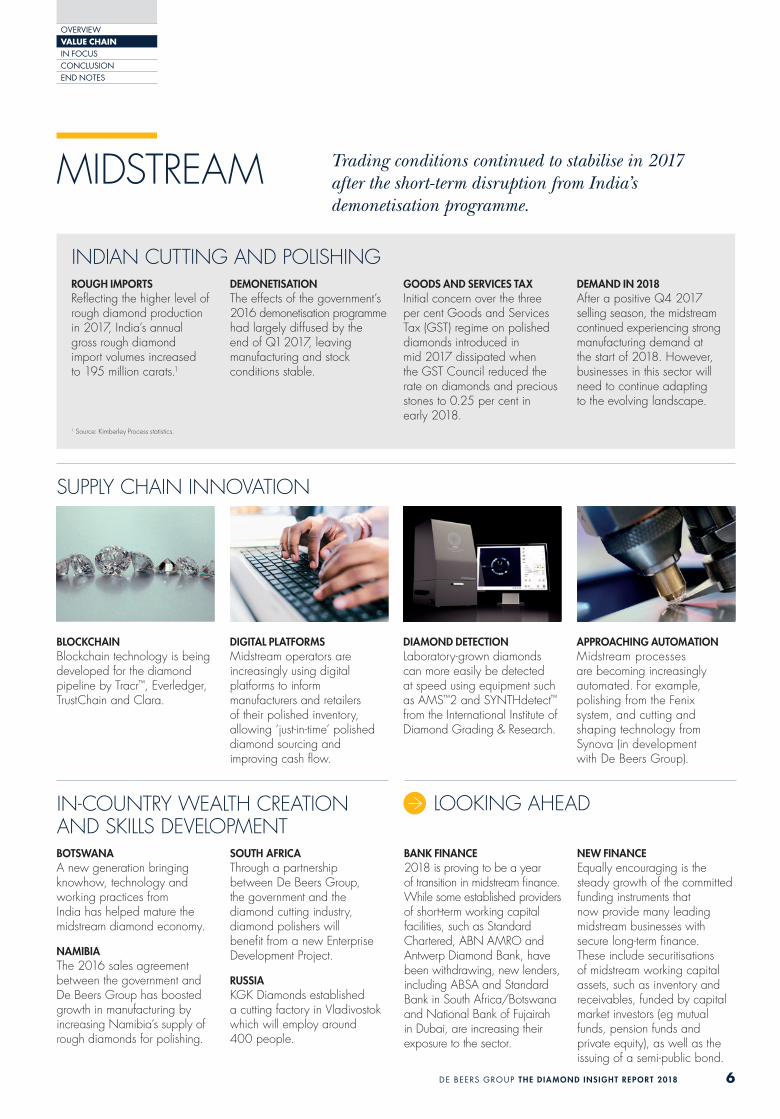
MIDSTREAM Trading conditions continued to stabilise in 2017 after the short-term disruption from India’s demonetisation programme.
INDIAN CUTTING AND POLISHINGROUGH IMPORTSReflecting the higher level of rough diamond production in 2017, India’s annual gross rough diamond import volumes increased to 195 million carats.1
DEMONETISATIONThe effects of the government’s 2016 demonetisation programme had largely diffused by the end of Q1 2017, leaving manufacturing and stock conditions stable.
GOODS AND SERVICES TAXInitial concern over the three per cent Goods and Services Tax (GST) regime on polished diamonds introduced in mid 2017 dissipated when the GST Council reduced the rate on diamonds and precious stones to 0.25 per cent in early 2018.
DEMAND IN 2018After a positive Q4 2017 selling season, the midstream continued experiencing strong manufacturing demand at the start of 2018. However, businesses in this sector will need to continue adapting to the evolving landscape.
SUPPLY CHAIN INNOVATION
BLOCKCHAINBlockchain technology is being developed for the diamond pipeline by Tracr™, Everledger, TrustChain and Clara.
DIGITAL PLATFORMSMidstream operators are increasingly using digital platforms to inform manufacturers and retailers of their polished inventory, allowing ‘just-in-time’ polished diamond sourcing and improving cash flow.
DIAMOND DETECTIONLaboratory-grown diamonds can more easily be detected at speed using equipment such as AMS™2 and SYNTHdetect™ from the International Institute of Diamond Grading & Research.
APPROACHING AUTOMATIONMidstream processes are becoming increasingly automated. For example, polishing from the Fenix system, and cutting and shaping technology from Synova (in development with De Beers Group).
IN-COUNTRY WEALTH CREATION AND SKILLS DEVELOPMENT
LOOKING AHEAD
BOTSWANAA new generation bringing knowhow, technology and working practices from India has helped mature the midstream diamond economy.
NAMIBIAThe 2016 sales agreement between the government and De Beers Group has boosted growth in manufacturing by increasing Namibia’s supply of rough diamonds for polishing.
SOUTH AFRICAThrough a partnership between De Beers Group, the government and the diamond cutting industry, diamond polishers will benefit from a new Enterprise Development Project.
RUSSIAKGK Diamonds established a cutting factory in Vladivostok which will employ around 400 people.
BANK FINANCE2018 is proving to be a year of transition in midstream finance. While some established providers of short-term working capital facilities, such as Standard Chartered, ABN AMRO and Antwerp Diamond Bank, have been withdrawing, new lenders, including ABSA and Standard Bank in South Africa/Botswana and National Bank of Fujairah in Dubai, are increasing their exposure to the sector.
NEW FINANCEEqually encouraging is the steady growth of the committed funding instruments that now provide many leading midstream businesses with secure long-term finance. These include securitisations of midstream working capital assets, such as inventory and receivables, funded by capital market investors (eg mutual funds, pension funds and private equity), as well as the issuing of a semi-public bond.
1 Source: Kimberley Process statistics.
OVERVIEWVALUE CHAININ FOCUSCONCLUSIONEND NOTES
OVERVIEWVALUE CHAININ FOCUSCONCLUSIONEND NOTES
DE BEERS GROUP THE D IAMOND INSIGHT REPORT 2018 7
UPSTREAM Diamond production increased in both volume and value terms in 2017, as the majors expanded output, and three newly opened mines ramped up production.
1 Okavango Diamond Company sales, by value, are included in the De Beers Group share of sales estimate as sales from Diamond Trading Company Botswana.
2 De Beers Group has lower confidence in estimates of informal production.3 Sales values are based on De Beers Group estimates where company reports are unavailable.
2017
2016
De Beers Group ODC1
ALROSA SODIAM Dominion Diamond Mines
Rio Tinto Petra Stornoway Firestone Mountain Province
Other3
Informal sector2
US$16.6BN(ESTIMATED)
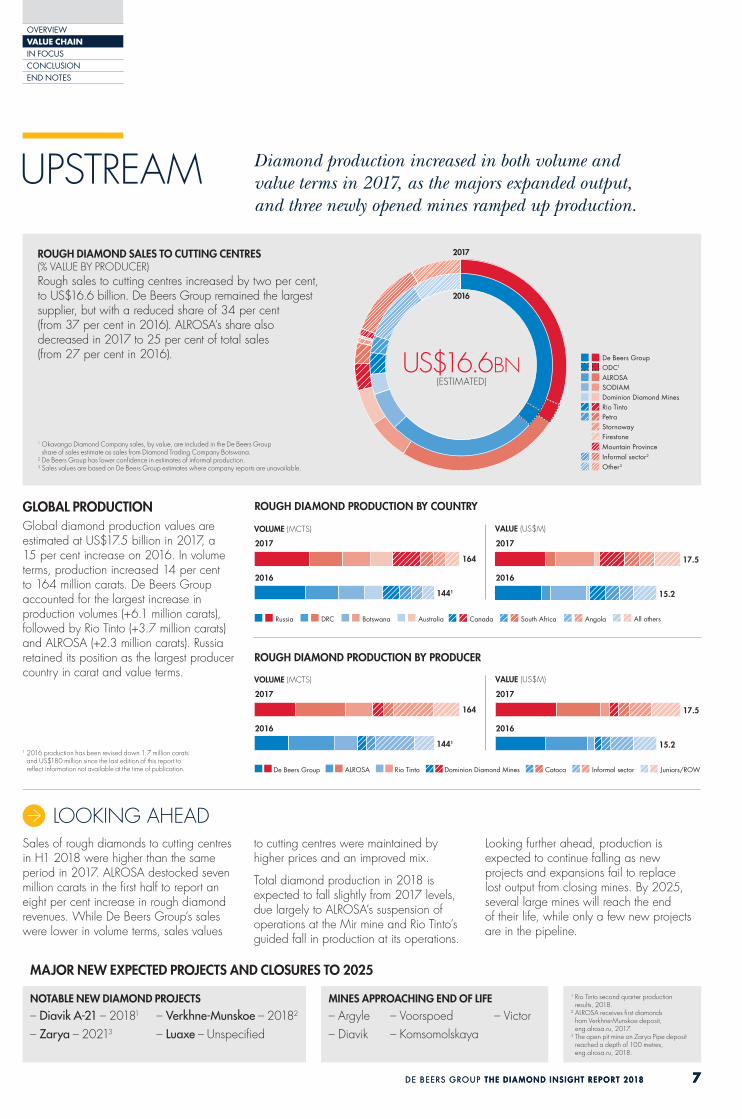
ROUGH DIAMOND SALES TO CUTTING CENTRES (% VALUE BY PRODUCER) Rough sales to cutting centres increased by two per cent, to US$16.6 billion. De Beers Group remained the largest supplier, but with a reduced share of 34 per cent (from 37 per cent in 2016). ALROSA’s share also decreased in 2017 to 25 per cent of total sales (from 27 per cent in 2016).
DE BEERS GROUP THE D IAMOND INSIGHT REPORT 2018 7
Sales of rough diamonds to cutting centres in H1 2018 were higher than the same period in 2017. ALROSA destocked seven million carats in the first half to report an eight per cent increase in rough diamond revenues. While De Beers Group’s sales were lower in volume terms, sales values
to cutting centres were maintained by higher prices and an improved mix.
Total diamond production in 2018 is expected to fall slightly from 2017 levels, due largely to ALROSA’s suspension of operations at the Mir mine and Rio Tinto’s guided fall in production at its operations.
Looking further ahead, production is expected to continue falling as new projects and expansions fail to replace lost output from closing mines. By 2025, several large mines will reach the end of their life, while only a few new projects are in the pipeline.
GLOBAL PRODUCTIONGlobal diamond production values are estimated at US$17.5 billion in 2017, a 15 per cent increase on 2016. In volume terms, production increased 14 per cent to 164 million carats. De Beers Group accounted for the largest increase in production volumes (+6.1 million carats), followed by Rio Tinto (+3.7 million carats) and ALROSA (+2.3 million carats). Russia retained its position as the largest producer country in carat and value terms.
LOOKING AHEAD
2016
2017
2016
164
1441
VOLUME (MCTS)
17.5
15.2
VALUE (US$M)
2017
Russia DRC Botswana Australia Canada South Africa Angola All others
ROUGH DIAMOND PRODUCTION BY COUNTRY
164
1441
VOLUME (MCTS)
17.5
15.2
VALUE (US$M)
2016
2017
2016
2017
De Beers Group ALROSA Rio Tinto Dominion Diamond Mines Catoca Informal sector Juniors/ROW
ROUGH DIAMOND PRODUCTION BY PRODUCER
1 2016 production has been revised down 1.7 million carats and US$180 million since the last edition of this report to reflect information not available at the time of publication.
MAJOR NEW EXPECTED PROJECTS AND CLOSURES TO 2025
NOTABLE NEW DIAMOND PROJECTS MINES APPROACHING END OF LIFE 1 Rio Tinto second quarter production results, 2018.
2 ALROSA receives first diamonds from Verkhne-Munskoe deposit, eng.alrosa.ru, 2017.
3 The open pit mine on Zarya Pipe deposit reached a depth of 100 metres, eng.alrosa.ru, 2018.
– Diavik A-21 – 20181
– Zarya – 20213
– Verkhne-Munskoe – 20182
– Luaxe – Unspecified – Argyle – Diavik
– Voorspoed – Komsomolskaya
– Victor


![Potentially Harmful Drugs in the Elderly: Beers List and Morefmda.org/beers.pdf · The Beers between use of drugs on the Beers list and ]-](https://img.pdfslide.us/doc/110x75/5a79e66f7f8b9ab83f8c4eef/potentially-harmful-drugs-in-the-elderly-beers-list-and-beers-between-use-of-drugs.jpg)